Identification of N- and O-linked glycans recognized by AAL in saliva of patients with atrophic gastritis and gastric cancerJian Shu, Hanjie Yu, Haoqi Du, Jiaxu Zhang, Kun Zhang, Xiaojie Li, Hailong Xie and Zheng Li [Cancer Biomarkers 22(4), 2018, 669–681. DOI 10.3233/CBM-171087] https://content.iospress.com/articles/cancer-biomarkers/cbm171087
Figures 3 and Figure 4 of the article have been wrongly positioned. Figures 3 and Figure 4 should switch positions while the figure legends remain in place.
Below find the correct figures and their legends:
Figure 3.
MALDI-TOF/TOF MS/MS analyzing theN-glycan precursor ion from MS spectra. The three N-glycan peaks (A) m/z 1663.581, (B) 1752.618, and (C) 1809.639 subjected to MS/MS analysis.
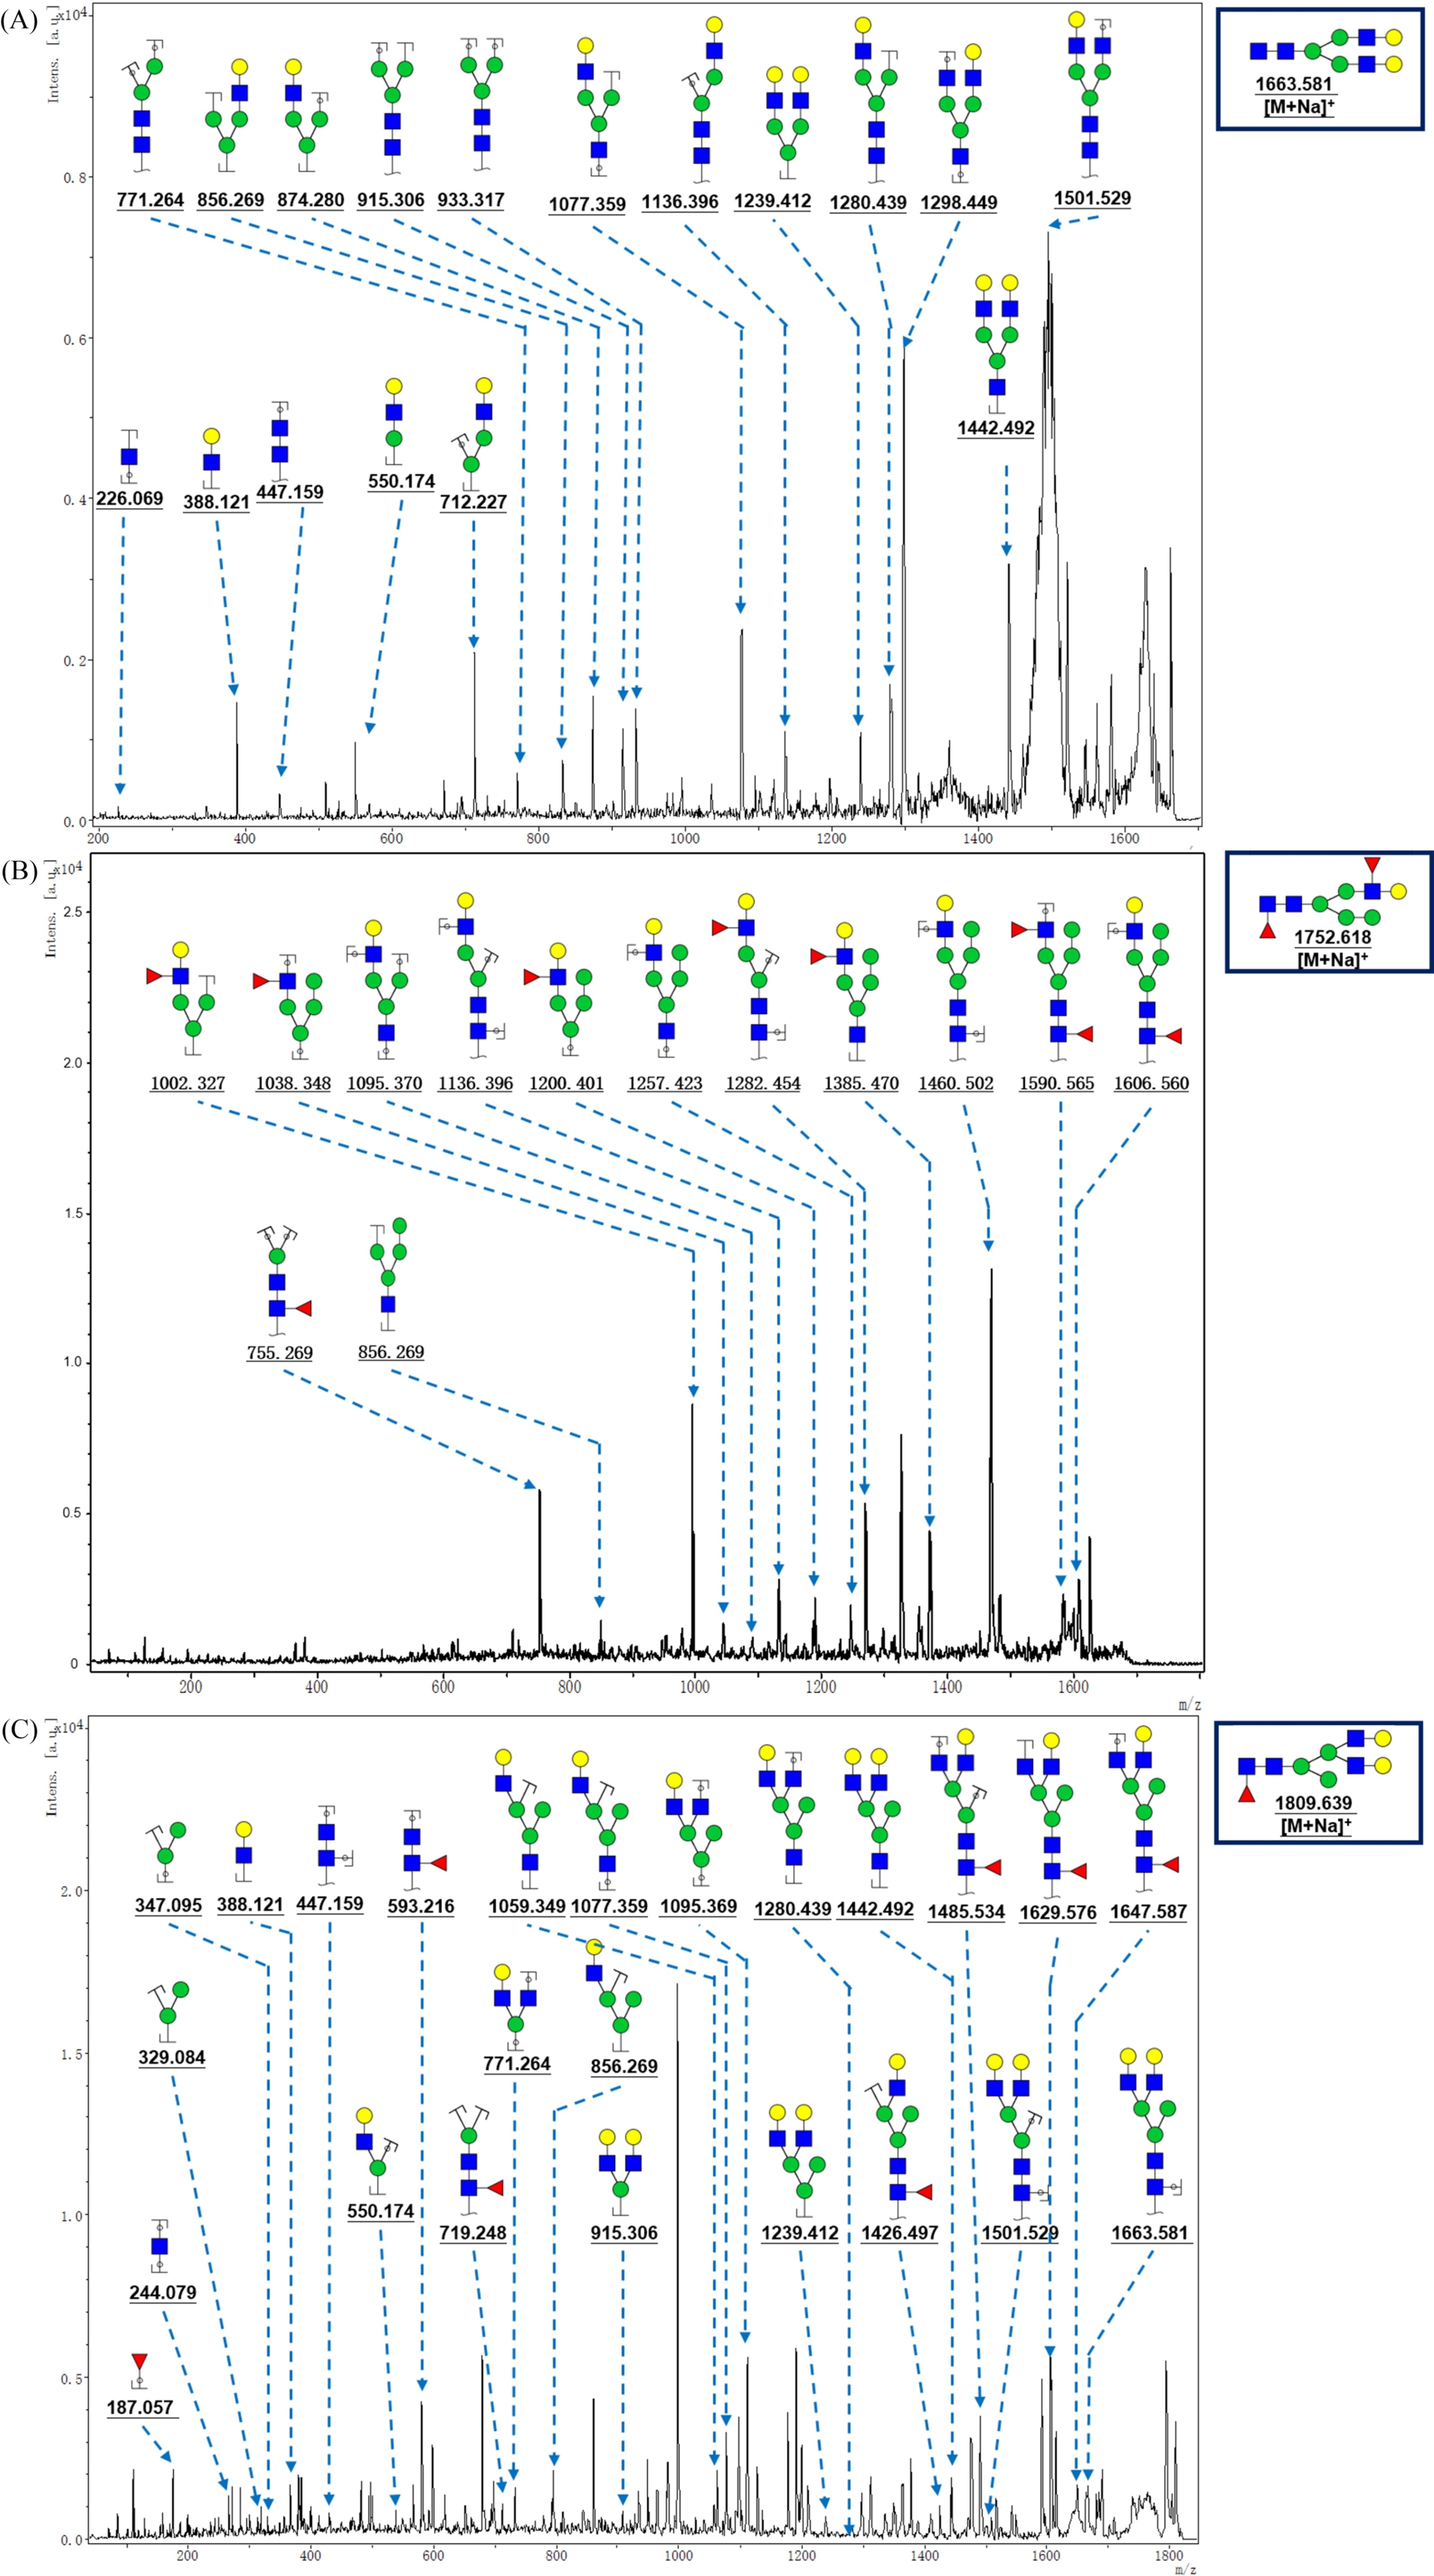
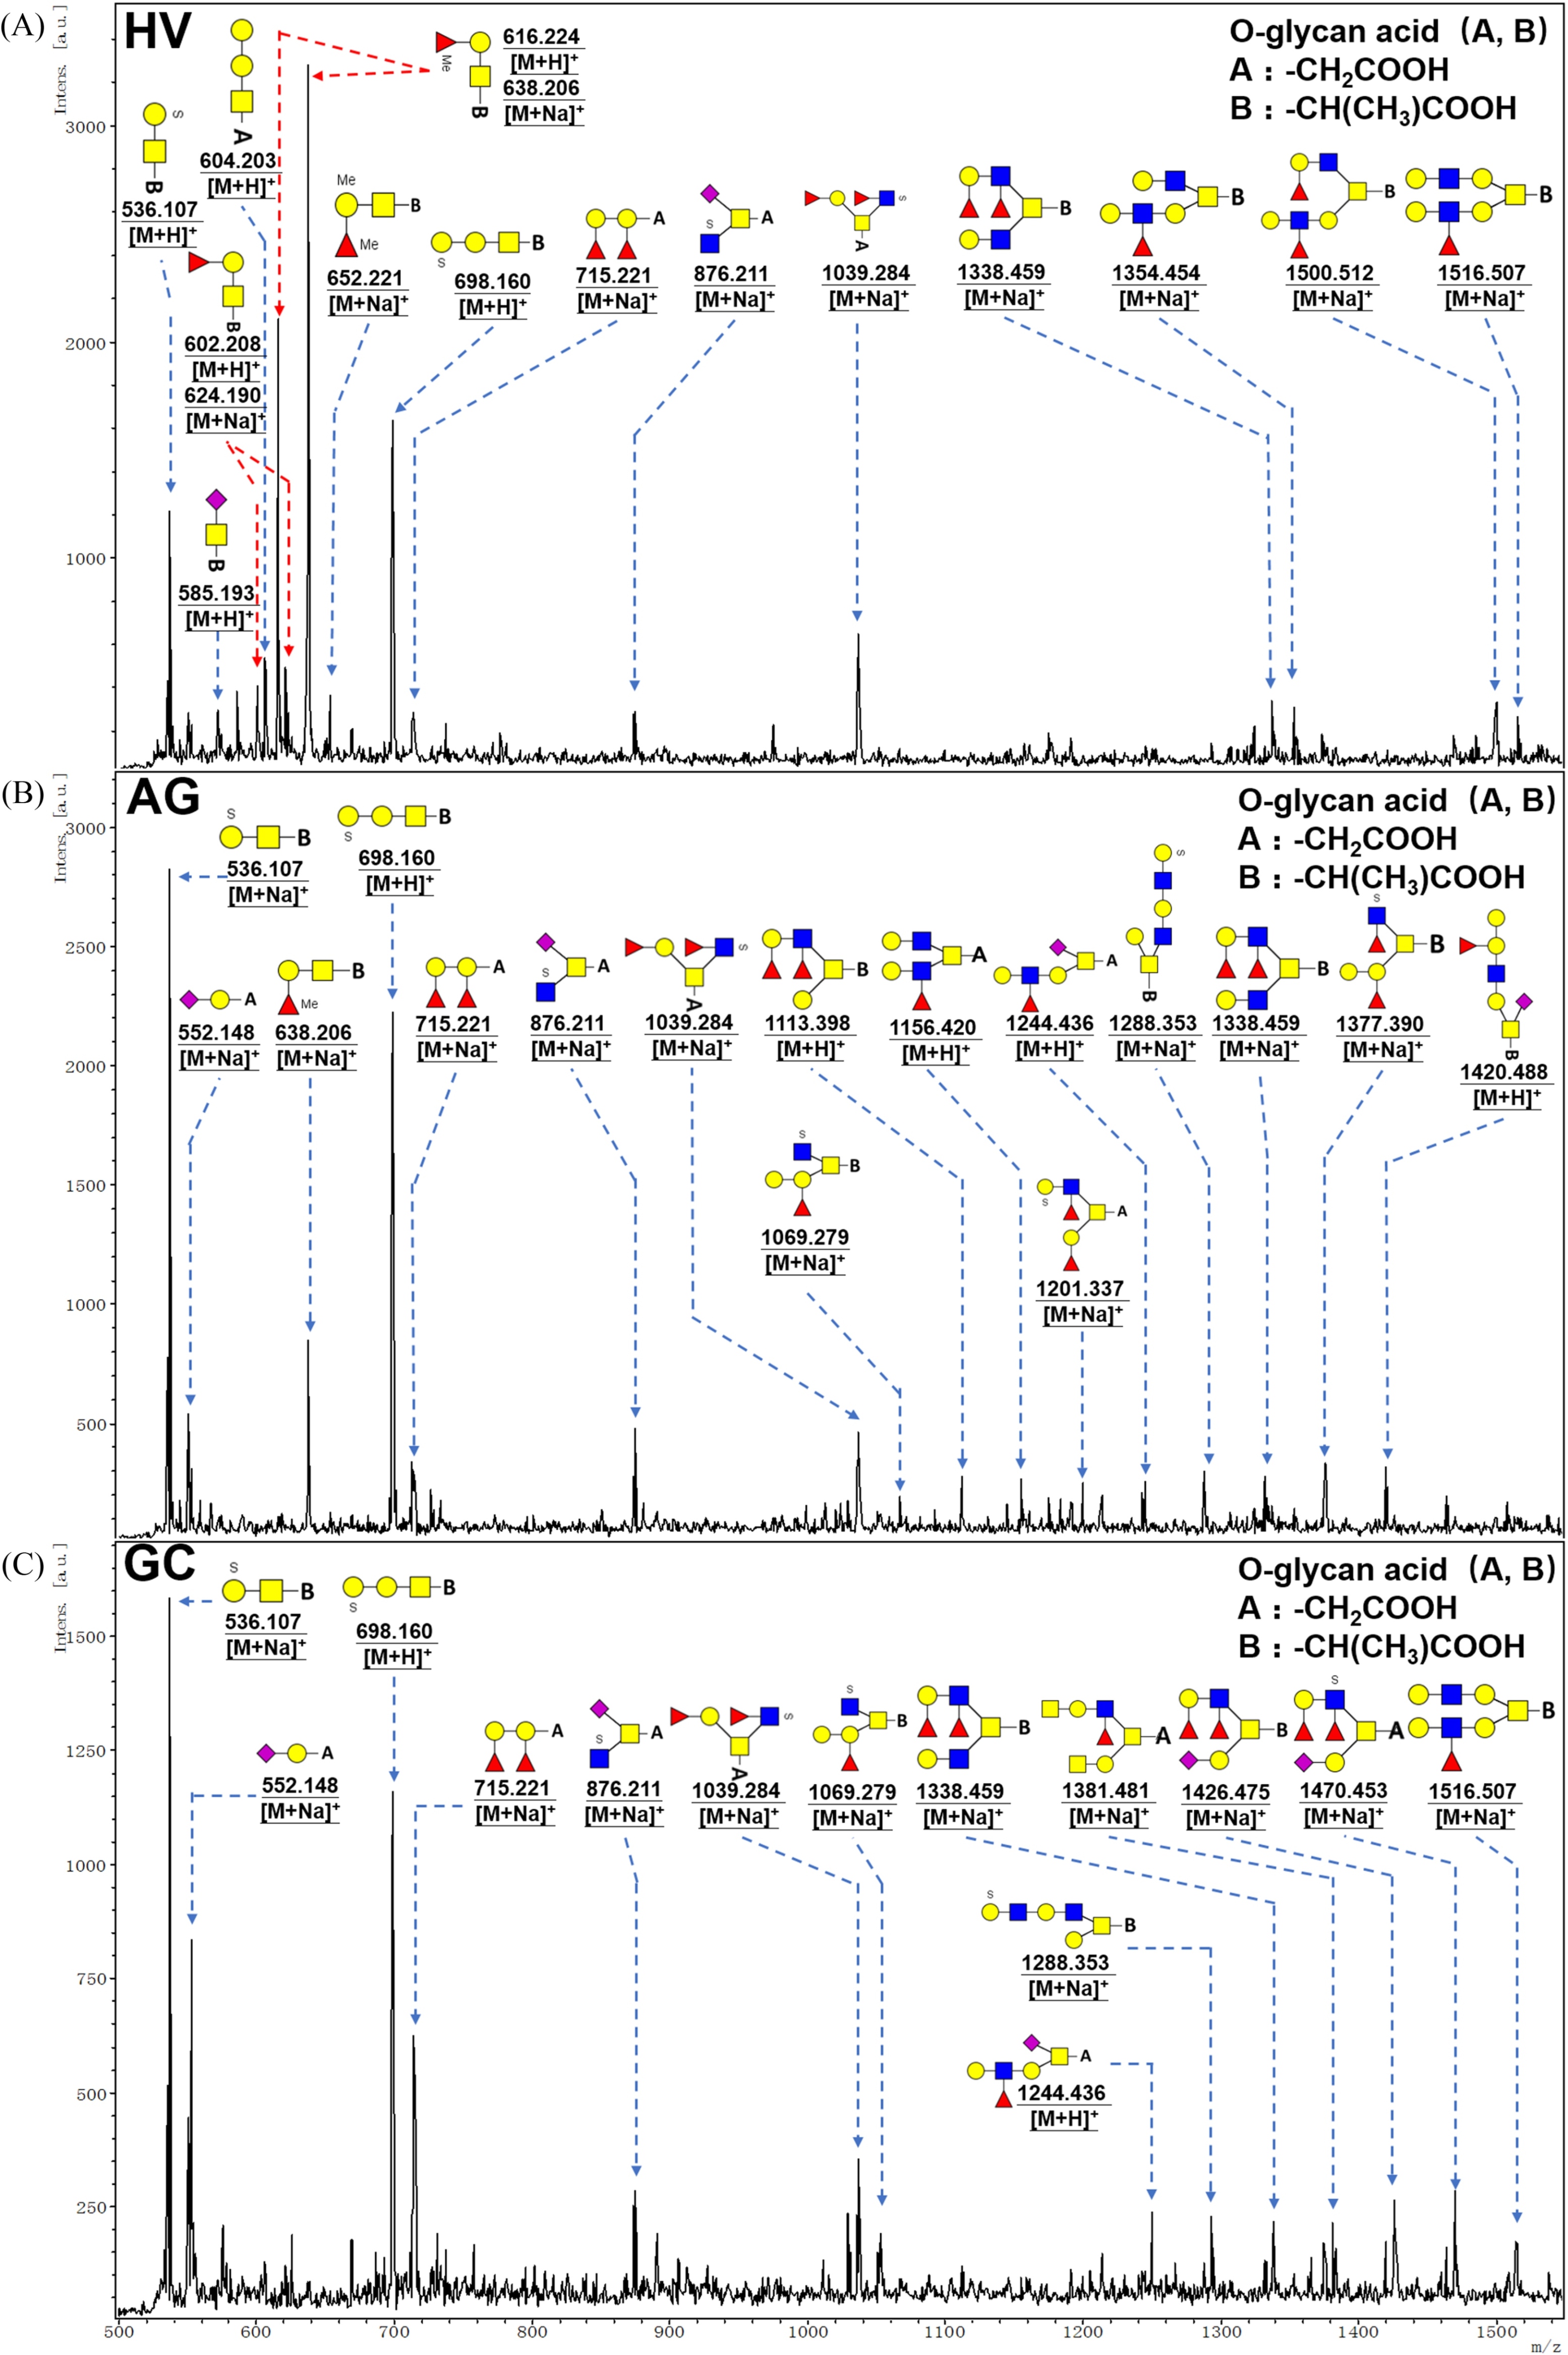
Figure 4.
MALDI-TOF/TOF-MS spectra of purified O-linked glycans from the pooled salivary samples of HV, AG, and GC, respectively. Detailed glycan structures were analyzed using the GlycoWorkbench software. Proposed structures and their m/z values were shown for each peak. Blue square = GlcNAc, green circle = Man, yellow circle = Gal, yellow square = GalNAc, purple diamond = NeuAc, red triangle = Fuc.