
Redundancy and reliability levels of post-tensioned and grouted concrete cross-section in case of tendon failure
Abstract
Since the 1960 s and 1970 s, the prestressing steel used on post-tensioned concrete (PTC) bridges has been known to be susceptible to stress corrosion cracking (SCC). This can result in brittle rupture of the prestressing steel. Objective of this study is to evaluate the reliability levels achieved with assessment method developed for verifying crack behaviour before failure in cross-section of PTC bridges with cross-section loss of prestressing steel. Additionally, the study aims to investigate of tendon loss on crack before failure behaviour. This paper applies a reliability analysis for methodology based on robustness analysis on crack before failure behaviour in PTC with deteriorating prestressing steel. The analysis involves examining cross-sections with various design criteria. The effects of choices made in designing the PTC structure are analysed and noted to have a significant impact on the safety margin of the structure, while the deterioration of prestressing steel does not significantly decrease the ductility of the cross-section if certain conditions are met. The use of stricter serviceability limit-state (SLS) criteria used in past design results the greater safety margin for the structure in the event of tendon loss, which therefore makes it beneficial for structural redundancy in the ultimate limit state (ULS).
1Introduction
Post-tensioned concrete bridges with grouted tendons are a common solution for large-span bridges. The primary advantage of using post-tensioned (PTC) concrete is to minimize deflection and cracking of the concrete structure in comparison to a reinforced concrete (RC) cross-section. A compression force due to prestressing allows for a higher alteration of stress due to external loads before cracking of concrete. The tendon geometry also provides load balancing to compensate the deflection due to external loads. While ultimate limit state is more or less straightforward with PTC, there is significant freedom in selecting design criteria for SLS [1]. Prestressing controls the service limit state criterion, with which by increasing the prestressing, the amount passive reinforcement may be reduced while decreasing prestress leads to increasing amount of passive steel [1]. With PTC, it is possible to achieve more economical structures compared to RC. However, the possible signs of overloading of PTC can be difficult to detect due to the beneficial effects of prestressing in cross-section cracking. Therefore, the deterioration of PTC structures can advance unnoticed further than in RC.
Studies have shown that post-tensioning tendons are prone to corrosion which, in certain circumstances, can lead to the embrittlement of steel tendon material [2–4]. In these circumstances the post-tensioning steel with brittle behaviour cannot elongate due to stress increments and therefore ultimately fails. This study focuses on PTC structures with internal bonded and post-grouted tendons. These tendons consist of strand bundles placed inside ducts placed within the concrete. These kinds of tendons are difficult to inspect for corrosion and therefore additional measures are necessary to ensure the safety of the bridge is needed as damage to the tendons cannot be directly observed. Despite the brittle nature of breakage of a single corroded strand in case of bonded post-tensioned tendon, the behaviour of cross-section can still exhibit ductile behaviour, which is beneficial for cross-section robustness, while load effects from broken strands are transferred to intact ones. The ductility of cross-section is beneficial for the robustness in large structural systems, in which a redistribution of forces to cross-sections with residual capacity is possible. This is for example a case of moment re-distribution in indeterminate beams, or transversal distribution of moment in case of multiple girders. The validity of this is mainly for bonded internal tendons and strands. If external and unbonded tendons rupture, the effectiveness of tendon is lost on whole length due to the lack of bond.
PTC cross-section properties are widely discussed in literature, and methodologies have been developed to verify crack before failure behaviour in cross-section design [5]. In [5] the safety to brittle failure in prestressed concrete structures is assessed by analysing the ratio between cracking moment and ultimate moment as well as variables affecting on this ratio. To ensure sufficient crack before failure behaviour in the new design of PTC structures, rules were developed by assessing factors such as the effects of PT-steel percentage, cross-section shape, amount of ordinary reinforcement, eccentricity of PT-steel, and bending tensile strength of concrete The assessment method of ductility of post-tensioned cross-section is presented in [6, 7]. This method calculates, the amount of tendon loss that causes concrete crack in frequent load. A sufficient safety is ensured with calculation of ultimate capacity of PTC cross section with reduced PT-steel area, which must exceed the effects of rare load. In this paper the robustness of cross-section in case of tendon failure is analysed with methods presented in [5] and reliability levels acquired with methods presented in [6, 7]. This is done by analysing the PTC cross-sections with PT-steel cross-section loss with different design assumptions, and comparison of the effect of different factors on the robustness of cross-section is assessed with sensitivity analysis. This analysis could help identify critical factors, that may cause the bridge’s structural behaviour to become non-redundant in the event of tendon failure.
1.1Structural reliability and robustness of structures
A reliability of structure is the measure of the structure or structural system to perform its purpose adequately for an intended period of time. The reliability of structure is the measure of safety against failure, whereas the robustness is determined as an ability to withstand damage to the structural member without failure under unexpected or damaged conditions [8]. In literature, robustness and redundancy have several partly overlapping definitions, usually described at the system level.
In this paper, the damaged condition of the post-tensioned structure is considered to be the level in which the reduction of the prestressing steel area leads to cracking of the concrete cross-section with frequent load combination, which is described in the method of safety assessment presented in [6, 7]. The robustness of the structure is defined by the ability of the structure to withstand additional loads after the brittle fracture of a certain amount of pre-stressing wires causes cross-section cracking due to loss of prestress.
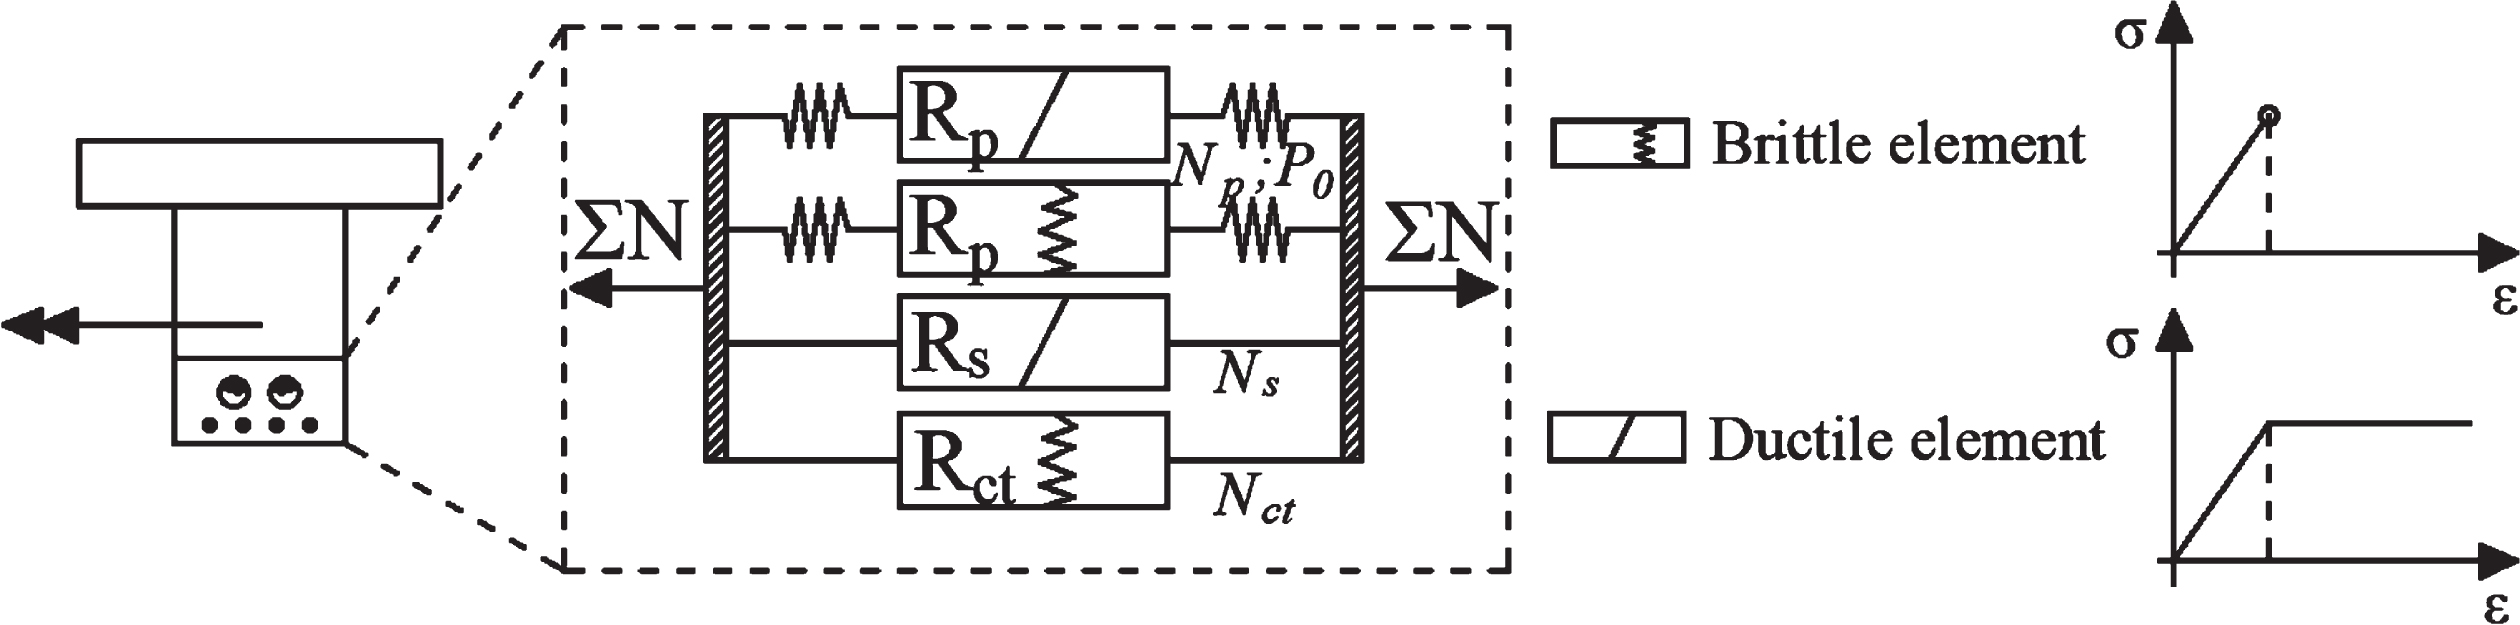
The importance of the crack before failure behaviour of a structure is emphasised for two reasons: for possible visual observation of approaching failure, and for reduction in stiffness of structure due to cracking of PTC cross section, which allows a redistribution of bending moments along the beam. In a robust structure the failure of brittle components in cross-section (for example corroded prestressing steel, which behaves in brittle manner, marked Rp in Fig. 1 and concrete under tensile stress Rct) causes the load to shift to other components Rp and Rs with residual capacity in the cross-section level in Fig. 1. This causes increased deformation and cracking of concrete cross section, which can be an indicator of a reduced reliability level.
Fig. 1
Schematic diagram of the resistance elements in the tensile chord of the cross-section.
2Materials and methods
2.1Probabilistic approach
A general deterministic formulation of structural safety in the assessment of bridges is provided in many codes with the equation Ed < Rd, with the design value of load being less than the design value of capacity. This is not necessarily the ultimate limit state, as the design equation also applies to the serviceability limit state. In probabilistic analysis, the formulation is typically presented with the limit state function and stochastic variables g(X) = M(X) = R(X)-S(X). The failure occurs when g(X) < 0, and the probability of failure is pf = Pr(g(X) < 0). In structural reliability applications, the reliability index β is a widely used measure of reliability and defined as β= –Φ-1(pf). Reliability index β is the ratio between mean safety margin μM, which is difference between mean resistance μR and stress μS, and standard deviation of safety margin σM. The location of the stochastic distributions in design is determined by the design criteria of the limit state under consideration.
(1)
μR, σR Mean value and standard deviation of concrete cross section resistance
μs, σS Mean value and standard deviation of concrete cross section stress
While quantification of safety has accepted measure as a probability of failure or reliability index (equation 1, for mean load method), the structural redundancy or robustness has no universal definition [8, 9]. There are discussions and several attempts for quantification of structural robustness, both deterministic and probabilistic [8, 10, 11]. However, the consensus for the term is still missing. Despite these imperfections, it is convenient to use the redundancy index presented in [11]. The redundancy index βR itself does not include physical interpretation, but it is still suitable in robustness comparison between different designs and is therefore suitable for use in this paper.
(2)
in which
βintact The reliability index of intact system
βdamaged The reliability index of damaged system
In Equation (2) the reliability index of the intact system is divided by the reduction of the reliability index due to damage. This probabilistic redundancy index varies at βR= [0; ∝[, in which βR = 0 represents the case in which βdamaged = -∝ rindicating non-redundant structure rand βR =∝ the case in which damage does not affect the safety of structure βdamaged = βintact.
2.2A target value for the reliability index
Structural codes 12 r13">0; ∝, in which βR = 0 represents the case in which βdamaged = -∝, indicating non-redundant structure, and βR =∝ the case in which damage does not affect the safety of structure βdamaged = βintact.
2.2A target value for the reliability index
Structural codes 12, 13 give various approaches and values for the determination of target reliability for existing structures, with different consequences and ductility of failure varying from 3.09 to 5.20. In [14] the value of target reliability depends on system behaviour, element behaviour, consequences of failure and level of inspection, varying between 2.25 and 3.75. As can be seen, there is significant variation for target reliability for the existing structure and therefore engineering judgement must be used. A suitable lower bound for target reliability in case of bridge structures with probable post-failure capacity should be around 3.0.
2.3Assessment of the safety in case of tendon failure
The investigation method in reference [7] has the basic idea of considering a gradual failure of tendons. The aim is to check whether the beam cross-section is able to bear a rare load after losses of tendon area form cracks in concrete in frequent load. It is assumed that in this case the damage can be noticed early enough. The crack formation of concrete is the trigger value in this method, which is considered the first damage stage. The method is limited to cross-section level assessment and redistribution of forces along the structure is not considered in this method.
The calculation in this case is a two-step process: 1) Determination of the remaining cross-sectional area of prestressing steel at crack formation in concrete, 2) Calculation of the load bearing capacity with remaining area of prestressing steel. A method presented suggests that concrete tensile strength is considered upon calculation of step 1) PTC cracking moment with fctm > 2.7 MPa, which is fulfilled with concrete with fck ≥30 MPa. It must be noted that remaining tendon area in calculation is considered fully functional, with original properties and deformation capacity and tendon loss all the area which does not fulfil this criterion, therefore the remaining prestressing steel area is a tool for calculation rather than real quantity measurable in the structure.
The remaining proportion of the cross-sectional area of prestressing steel AP,red in crack formation in tensile chord of concrete can be calculated [7].
(3)
(4)
σb.FREQ is an edge stress in concrete cross-section in frequent combination
fct tensile strength of concrete
σp,∝ prestressing in tendons after prestress losses
ep eccentricity of tendons in cross-section
Ac Area of concrete cross section
Ap,tot Initial area of prestressing steel
Wb Section modulus of concrete cross-section for tensile chord
The residual ultimate capacity and the safety factor for verification of sufficient behaviour
(5)
(6)
(7)
Mp,r+s Bending moment capacity carried by remaining prestressing steel and reinforcement in PTC cross section
MΔT Bending moment from restrained deformations due to temperature gradient
γQ Partial safety factor of traffic load effects for verification of sufficient behaviour > 1.1 [6] >1.0 [7]
γG Partial safety factor of dead load 1.1 [6]
MG Bending moment from self-weights
MQ Bending moment due to the infrequent (1-year) traffic effects
Mvx,∞ Indirect bending moment from prestressing
The safety factor of capacities is determined by using the characteristic values of strength for concrete, fp,0.1-value for prestressing steel and mean value of yield for rebar. This is very close to capacity of the accidental limit state presented in EN 1992 [15], in which the partial safety factor for concrete is γc = 1.2 and for rebar and prestressing steel 1.0.
3Calculation of design point
3.1Design point by ULS
The design point (D.P.) in Fig. 2-a is an arbitrary point at which the distributions fME(M) and fMR(M) are shifted to achieve an adequate reliability level in limit state Ed = Rd. In the case of Equation 5, a probability distribution function (PDF) fME(M) is placed so that one year value of traffic load is combined with other loads and the design value of the combination coincides with the design point. Respectively, a PDF of the resistance fMR(M) is set so that a design value of the capacity coincides with D.P. If D.P. is considered constant, the factor of safety γQ > 1.0 in Equation 6 shifts one year-load distribution fME(M) leftwards according to Fig. 2-b, which decreases the overlapping area of distributions and probability of failure pf shown in Fig. 2.
Fig. 2
a) Load (red ME) and Resistance (blue MR) distributions in ULS with condition ME . d = MR . d, b) Location of Load (red dashdot ME) distribution when SLS is of determinate design.
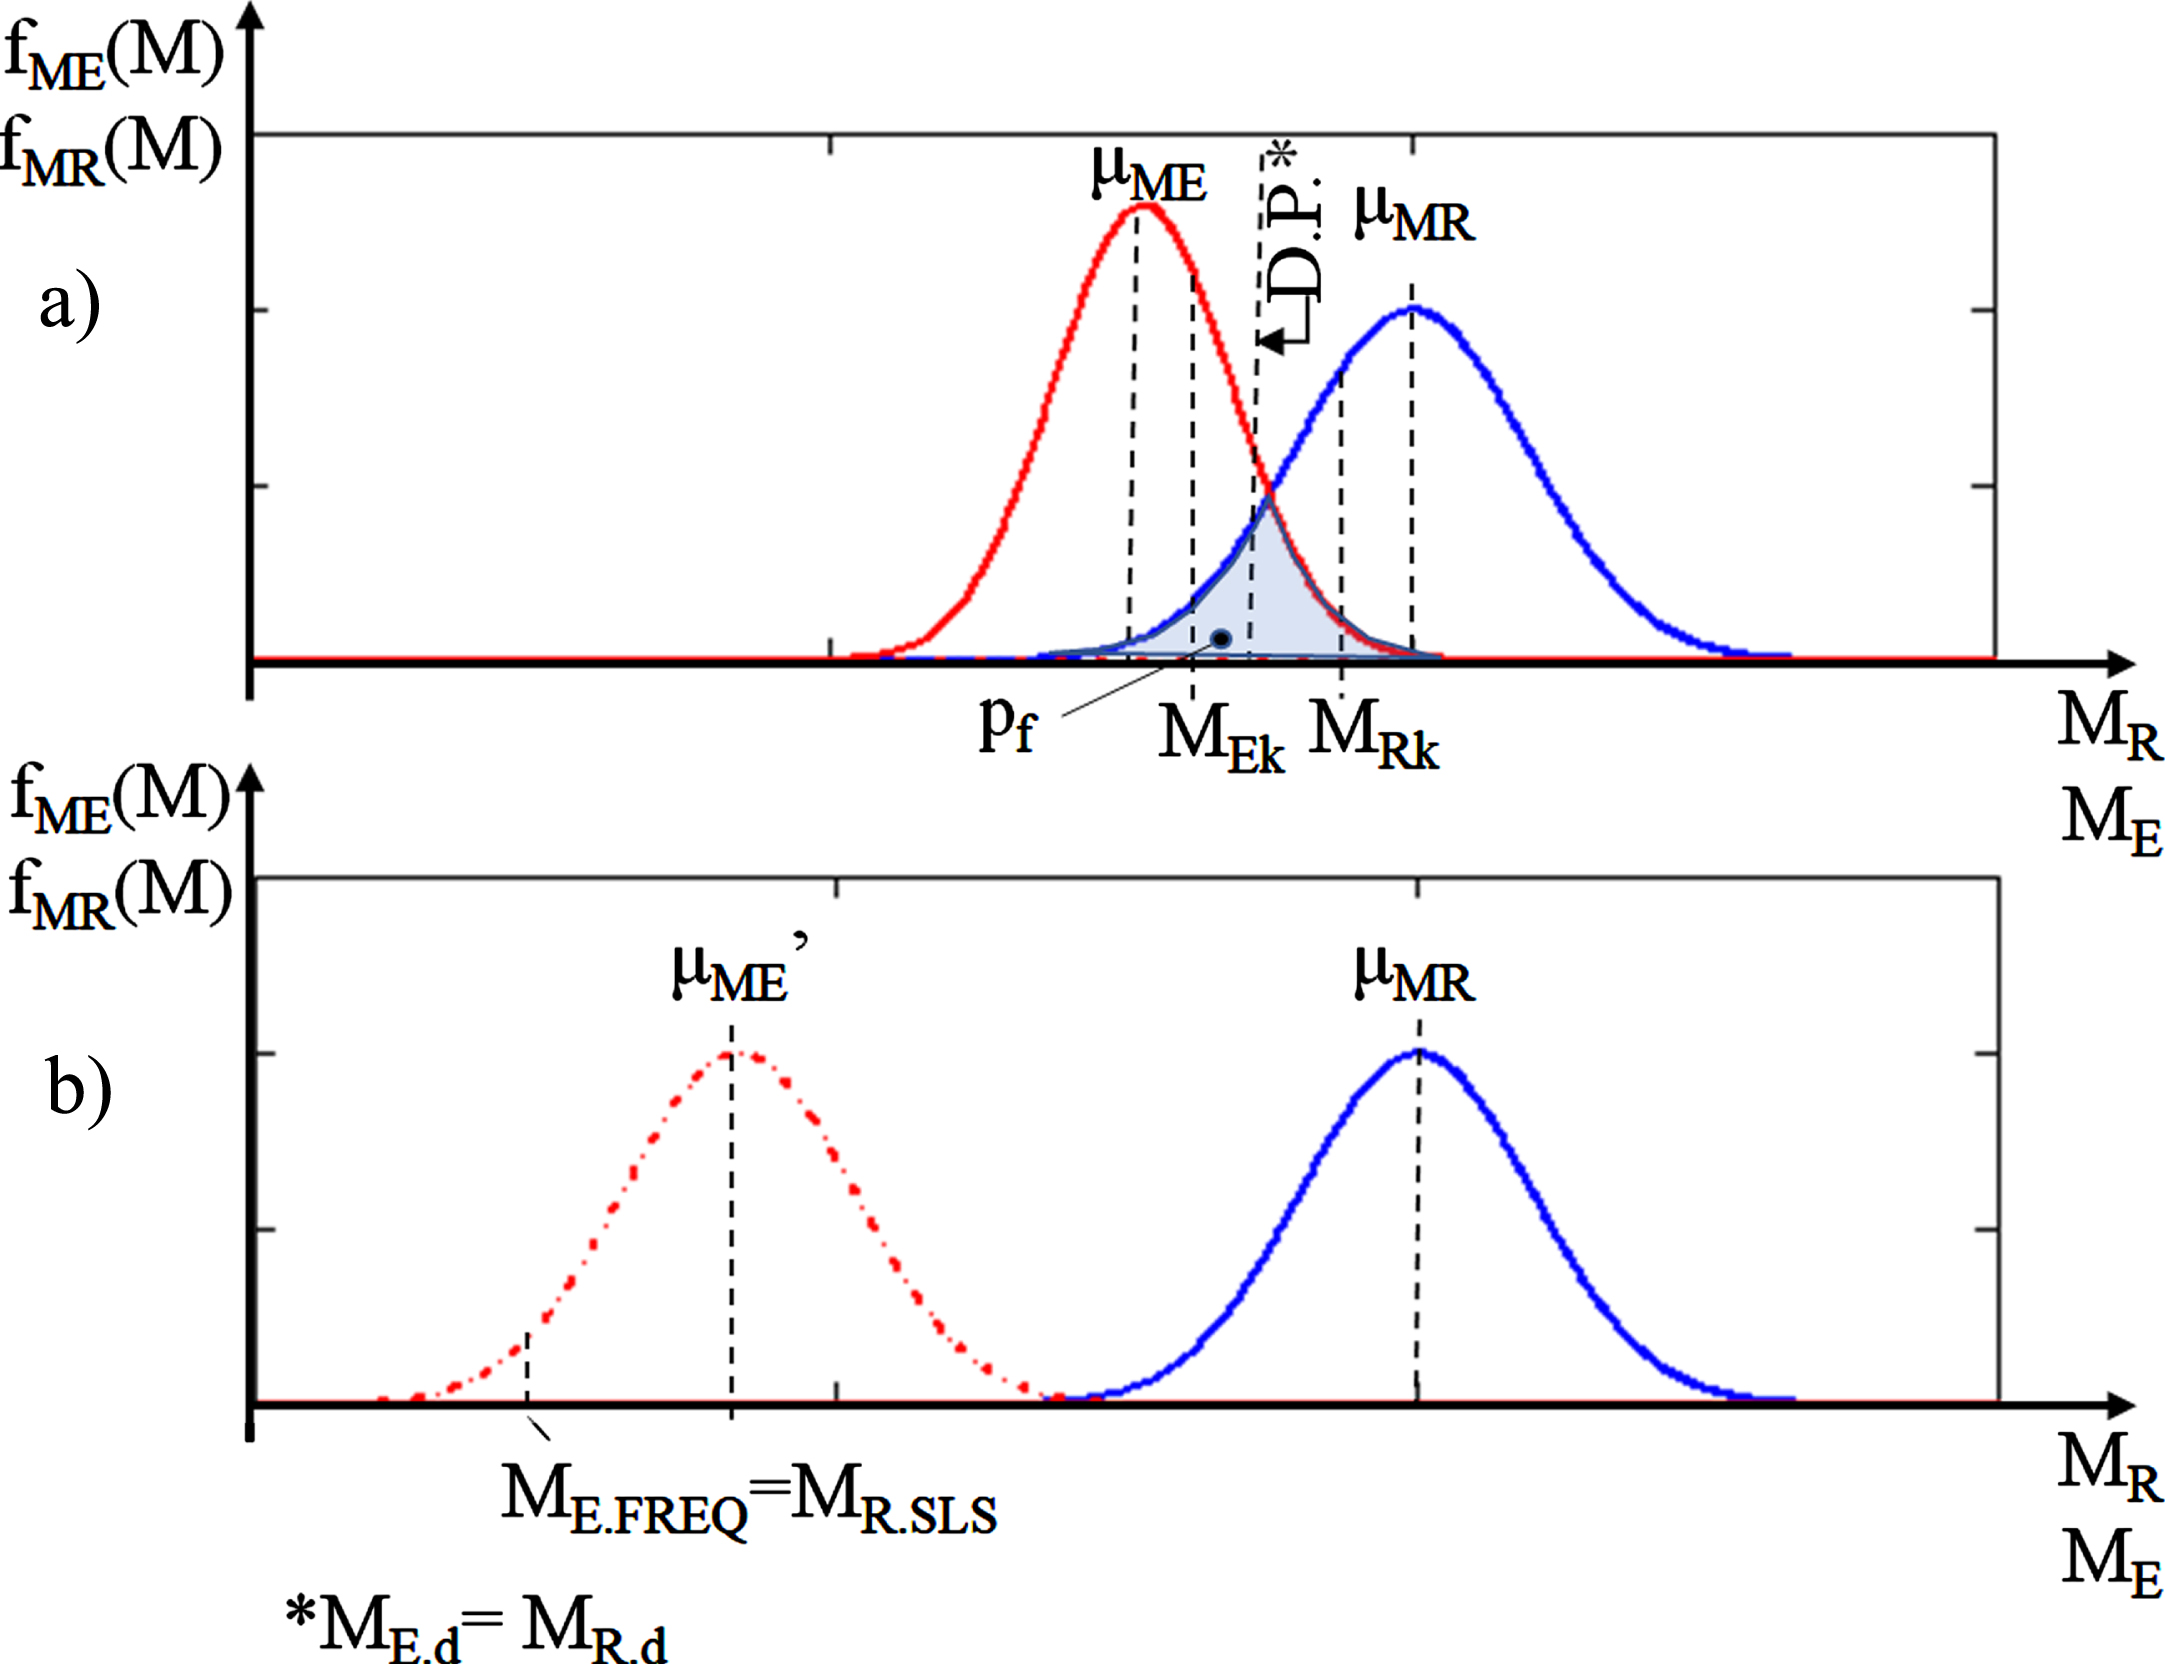
The design case in which SLS is determinate is presented in Fig. 2-b, and in the D.P of SLS the condition ME . FREQ=MR . SLS is set. This means, that for the same structure, the actual load affecting on structure is limited by SLS-capacity and therefore the safety margin of ULS is much higher in comparison to ULS calculation. Typically ratio between characteristic ultimate capacity and allowed SLS-value is in order of 2..3 depending on SLS criteria, while the allowed SLS-loads are from 60% to 70 % of factored design loads [16].
3.2Design point in ULS limited by SLS
For intact cross-section the value of frequent load (ME . FREQ) is set as equal to the allowed service limit state of the intact cross-section, Equation 8. A design criterion in SLS can be the decompression moment capacity or the bending moment capacity corresponding to a certain crack width. This sets limiting boundary of PDF of load in Fig. 2-b.
(8)
(9)
ME.FREQ Frequent load according to codes
MR.SLS,allowed.int Capacity of cross section in SLS
ME.d Design value of bending moment
MR.d Design capacity of cross section in ULS
The proportion of variable loads from total load of frequent combination can be calculated according to equations 10 using SLS-parameters and 11 using ULS parameters; with ψ-factors the proportion is multiplied to achieve the rare value of variable load.
(10)
(11)
In which α is the load ratio
(12)
ψ1 Combination factor for frequent load value
ψRARE Combination factor for rare load value
MG Bending moment from self-weights
MQ Bending moment due to the infrequent (1-year) variable loads
The proportion of permanent load can then be calculated in SLS (Equation 13a) and ULS (Equation 13b)
(13a)
(13b)
And the value of rare combination, which is the mean 1-year load μM.E (α), and used as design value in Equation (9) load with equation:
(14)
The combination value of rare load consists of permanent part ME.G (α) and variable part MEQ,RARE (α).
3.3Probabilistic modelling of vertical load effects on bridges
The vertical loads on a bridge consist of permanent and variable loads. It is evident that permanent loads consist of dead loads due to the self-weight of bridge components. Also loads caused by settlement of bridge piers and secondary moments due to post-tensioning are considered permanent. The most important variable live load on a bridge is traffic load, while another significant source of the variable load effect is thermal loading. A statistical modelling of loads is done by applying relevant distributions: for extreme effects, an extreme value distribution is used, whereas for permanent loads or the values of live load effects at an arbitrary point in time, the normal distribution is considered an adequate selection.
3.4Dead load
Dead load includes the weight of construction materials and components (pavements, etc.) attached to the bridge. The specific weight of concrete, including reinforcement and prestressing steel, is 25 kN/m3. A mean value of permanent load can be calculated from the nominal value by using bias factor λG = 1.03 [17] μG = λG*MG.
3.5Thermal actions
A thermal load consists of two parts: uniform temperature change and temperature gradient. In this study only the gradient part, which causes restraint moments in a hyperstatic structure, is considered. The specific data about the history of thermal loads suitable for reliability analysis is not available with reasonable effort. A calibrated value of temperature gradient according to EN-1991-5 [18] and assuming a 150-mm pavement layer on the bridge. For a concrete beam bridge, a positive temperature gradient (top surface is warmer) is ΔTM . HEAT = 7.5°C, and for negative temperature the gradient is ΔTM . COOL = 8°C. A characteristic value (return period of 50 years) of thermal load is calculated by applying these gradients. Combination factors for thermal loads are presented in [16] and are ψ1 = 0.6 for frequent combination and ψ2 = 0.5 for quasi-permanent combination.
Let us assume the quasi-permanent value represents the value of arbitrary-point-in-time (APT) and is normally distributed with a mean of 0.5 and a coefficient of variation of 0.13. The mean value of 7-day extreme, which corresponds to the frequent value of 0.66 and characteristic value of 1, which seem to match ψ the values presented in EN-1990 [16].
In references [9] and [19], the statistical parameters are provided for the temperature gradient. The coefficient of variation for positive temperature gradient is 0.06, whereas for the negative temperature gradient the CoV = 0.15. The difference between the values presented in [9] and [19] and calculated values may be due to different climatic conditions.
3.6Traffic loads
Based on monitoring and simulations of Finnish traffic, the average coefficient of variation of the daily maximum effect of road traffic loads is 11% for sagging and 15% for hogging of a 2-span bridge [20]. A characteristic value of traffic load is the extrapolated value of traffic load effects with a return period of 1,000 years. When extrapolating daily values, it must be noted that one should not use 365 days per year, but instead account for public holidays, weekends and other days of low economic activity affecting freight, in this case 251 days/year.
(15)
μXn Mean extreme value of n-period (1-year mean extreme value)
μ Mean value of extreme value of period (distribution of daily extreme)
n Factor (n = 251)
σ Standard deviation of extreme value of period (distribution of daily extreme)
A mean value of variable load with a one-year return period μQ.1yr = MEQ . RARE. In codes, the combination factor for rare value of traffic load is not presented. The rare combination value of traffic loads is achieved by multiplying a characteristic value of LM1 traffic load effect with factor ψ= 0.78, while the combination factor for frequent traffic load effect is 0.75 for axles and 0.4 for UDL, leading to a combined value where ψ1 is typically from 0.5 to 0.7, in Table 1.
Table 1
Traffic load characteristics
| Sagging moment [kNm] | Hogging moment [kNm] | |||||||||
| Span | μ1.yr | σ | MFREQ . LM1 | MCHAR . LM1 | ψ1 | μ1.yr | σ | MFREQ . LM1 | MCHAR . LM1 | ψ1 |
| 20 | 3,991 | 215 | 3,329 | 5,117 | 0.57 | 2,888 | 155 | 2,114 | 3,703 | 0.65 |
| 30 | 6,940 | 374 | 5,523 | 8,898 | 0.54 | 5,447 | 294 | 3,745 | 6,983 | 0.62 |
| 40 | 10,723 | 579 | 8,149 | 13,747 | 0.51 | 9,111 | 492 | 5,941 | 11,681 | 0.59 |
Assume APT value for traffic load equals 1.0,
Fig. 3
a) Cumulative distribution and return periods of traffic load, b) Ratio between rare and frequent value of traffic load with various numbers of daily lorries c) Ratio between rare and frequent value of load combination with different load ratios.
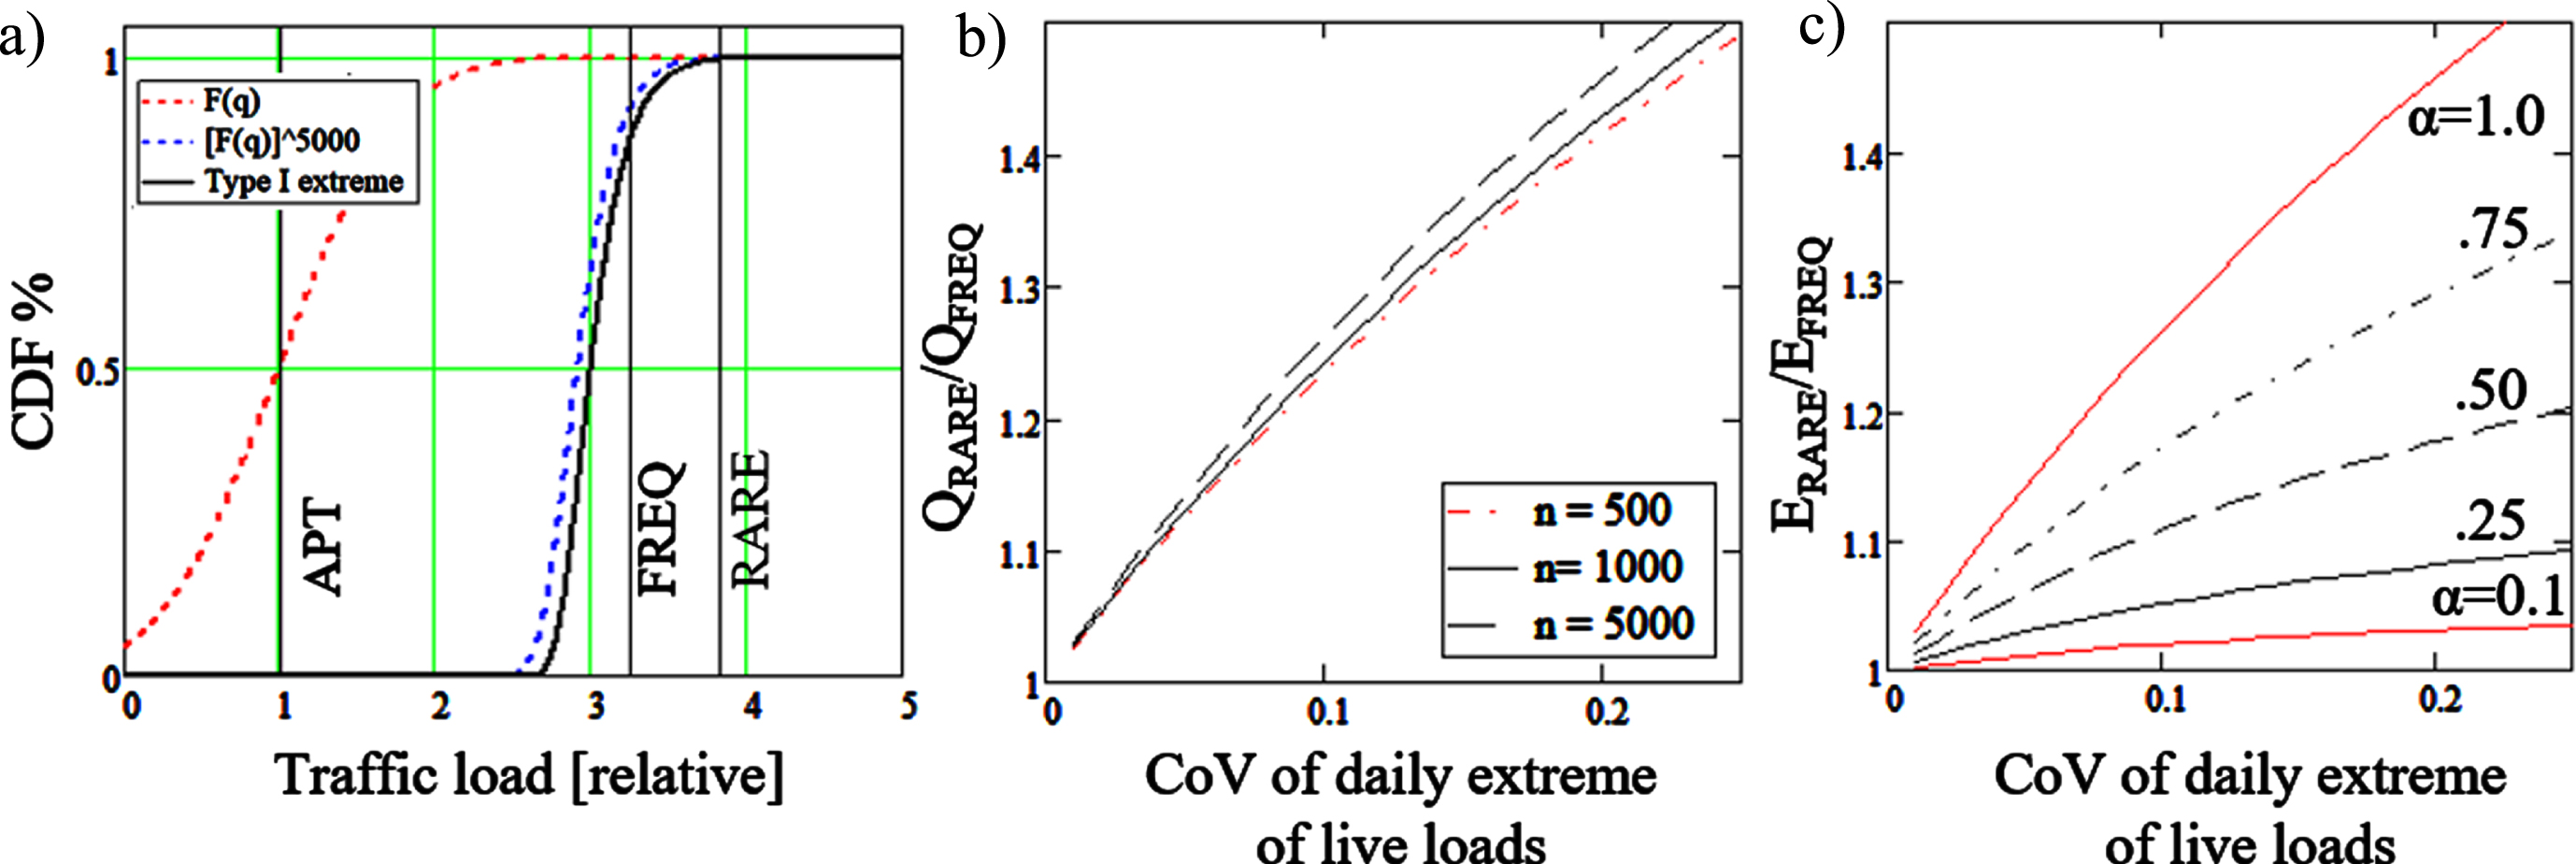
According to studies, the variability in daily number of lorries passing through the bridge varies considerably depending on the location. Assuming daily traffic of n = 1,000 vehicles with the APT value distribution described earlier, the expected load of a return period of one week (frequent value) is 3.297 and for a 1-year return period (rare value) 3.823 times the APT value, leading the typical value of ratio between frequent and rare load 1.16 in Fig. 3-b. In bridges the live load ratio α varies between 0.2 and 0.8, which leads the ratio between the total rare and total frequent load to vary from 1.1 to 1.3 as shown in Fig. 3-c.
3.7Load combination
Load combination in codes is done by summing loads, which are multiplied with combination factors ψ, which are presented in Eurocodes [16]. A combination of statistical distributions (“max” in equations 16 and 17) of loads is done by using Turksta’s rule, with assumptions of independent loads, and while the extreme value of a single load affects the structure, the other loads are in their average –arbitrary-point-in-time-value (“apt” in equations 16 and 17), over time [17].
(16)
(17)
Because of multiple different loads affecting the bridge, the result is load combination, i.e. the distribution of the sum of loads approaches normal distribution, assuming no skewed load distribution is dominant.
For existing bridges, the statistical properties of the combined load effect are rather constant over time. The evolution in traffic loads could possibly have an increasing effect on the combination value. The significance of this increase is related to live load ratio α in the section under consideration: if live load is the dominant action, the change in combination value due to a change in live load is higher.
4Case studies
To assess the reliability levels of the calculation method, a set of typical cross-sections is selected from existing constructed bridges. The bridges in question are two-span beam bridges with a span length of 20, 30 and 40 metres and an efficient width of 9.1, 9.2 and 12 metres. The L/h ratio varies from 16.7 to 22.9. The bridges were constructed in 1989, 1988 and 1998.
4.1Properties of post-tensioned cross-section
In analysis, only one beam cross-section is considered. The bending moment from self-weight distributes equally on both beams as a restraint moment form temperature gradient. With a traffic load pattern of LM1, the calculation of bending moments affecting the beam due to traffic loads is done by using girder factors, for lanes 1 to 3 for LM1: 1.08, 0.5, 0 and for real traffic lanes 1 and 2 : 0.82 and 0 respectively. The girder factors applied are based on lever rule.
The cross-section characteristics are shown in Table 2. In the analysis, the amount of reinforcing steel is varied and marked with the letters a,b,c and d, with c being the original design presented in Table 2. Also, the calculation is performed with prestressing force multiplied by 0.85 to account for prestressing losses of 15 %, which is typical assumed amount of prestress losses in PTC cross section. This is done to assess the effect of prestress losses and possible inaccuracy in prediction in them.
Table 2
Cross-section characteristic of example bridges
| Bridge | Lspan | h | bw | tcf | bcf | As . bot* | As . top* | Ap | P0f** | |
| [m] | [m] | [m] | [m] | [m] | [mm2] | [mm2] | [mm2] | [kN] | ||
| B20 | 20 | 1.2 | 1.35 | 0.3 | 4.55 | 2,454a | 2,739a | 4,950 | 5,813 | 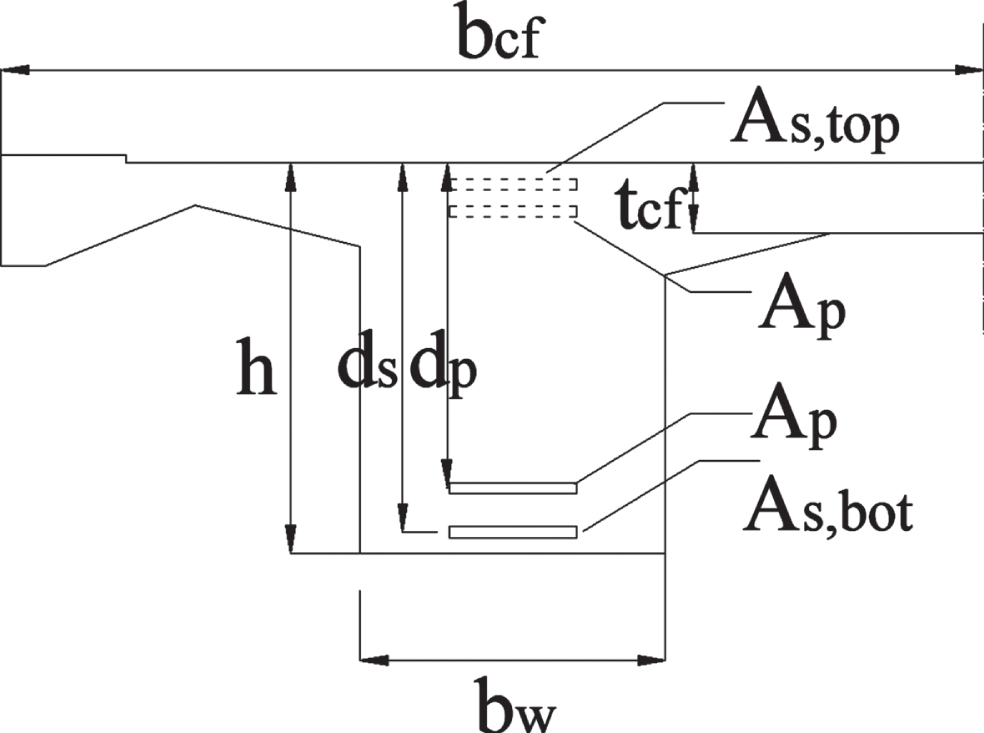 |
| 4,909b | 4,134b | |||||||||
| 6,872c | 4,850c | |||||||||
| 10,799d | 10,100d | |||||||||
| B30 | 30 | 1.5 | 1.2 | 0.35 | 4.6 | 2,827 | 2,652 | 6,600 | 7,785 | |
| 4,418 | 3,889 | |||||||||
| 5,890 | 4,870 | |||||||||
| 7,854 | 7,815 | |||||||||
| B40 | 40 | 1.75 | 1.5 | 0.45 | 6 | 1,963 | 6,308 | 17,000 | 19,400 | |
| 2,954 | 8,721 | |||||||||
| 3,927 | 10,330 | |||||||||
| 5,400 | 14,000 |
*Varied with a . . . d. **Without losses and with losses 15% (‘).
4.2Material properties
For simulation of cross-section behaviour, use is made of the non-linear material properties for concrete, reinforcement, and prestressing steel, presented, respectively, in Fig. 4-a, 4-b and 4-c. The non-linear material model of concrete and reinforcing steel is selected according to one presented in [15] Section 3.1.5. For reinforcement steel the model is modified to be yielding with ɛys = 5‰ and strain-hardening after strain exceeds 3*ɛys. The maximum strain of reinforcement steel is 1.5%, which corresponds to steel stress 575 MPa.
Fig. 4
Stress-Strain relations for materials a) concrete b) reinforcement steel c) prestressing steel.
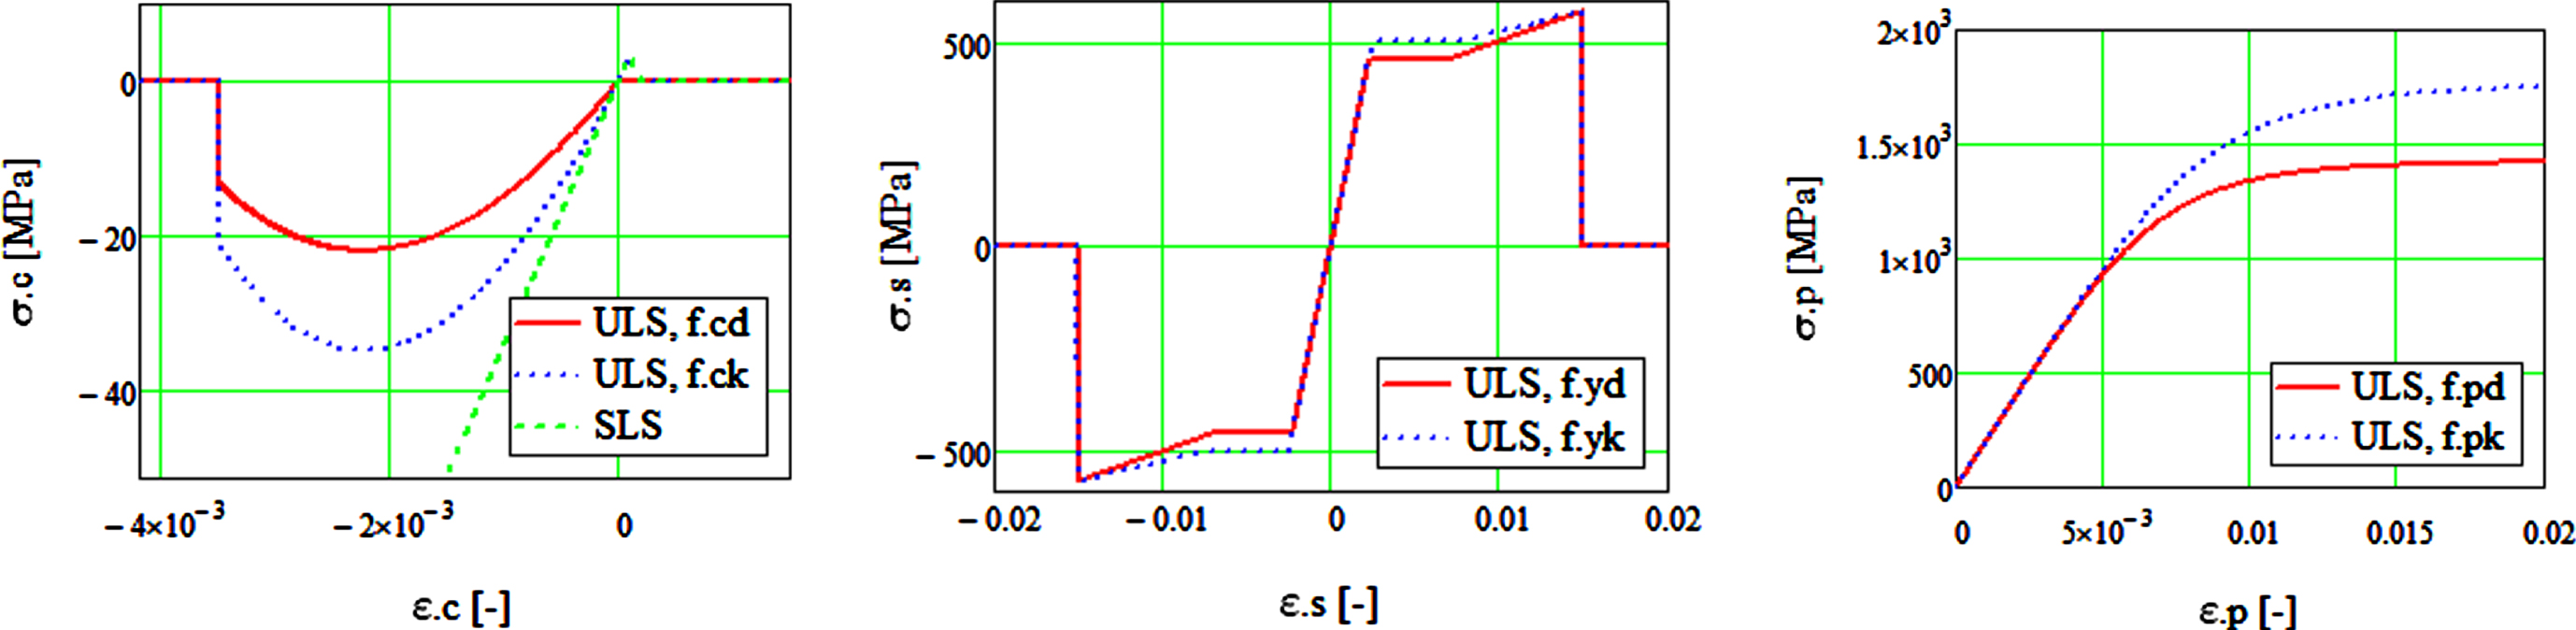
In the analysis of cross-section cracking, the material properties of the remaining tendon area are assumed to remain unchanged. The yield value of prestressing steel is assumed to be 5% fractile of 0.1% -strain value, and the material model is according to the Ramberg-Osgood function [22]. According to [6] the maximum elongation of the limit of additional strain of prestressing steel due to bending and normal force should be limited to 5‰ for intact tendons. The stochastic properties of cross-section materials and dimensions are presented in Table 3.
Table 3
Variability of material properties and dimensions used in resistance calculation. 1) [23]; 2) [24]; 3) [25]
| Variable | Notation | Nominal | Bias | COV % | ||
| Geometry | Effective depth prestressing | dp | Nominal | 1 | 500/h | |
| Effective depth steel | ds | Nominal | 1 | 500/h | ||
| Materials | Concrete compressive strength | fc,cyl | 32 | MPa | 1.24 | 12.5(1 |
| Concrete tensile strength | fct | 2.1 | MPa | 1.46 | 40 | |
| Prestressing steel tensile strength | fp . 01 . k | 1,570 | MPa | 1.02 | 2(2 | |
| fpu | 1,770 | MPa | 1.02 | 2 | ||
| Prestressing ultimate strain | ɛu | 3.50 | % | 1.43 | 8(3 | |
| Reinforcing steel strength | fs | 500 | MPa | 1.15 | 5 |
In analysis the assumption is made that the amount of lost tendon is fully ineffective, which means the amount of remaining tendon Ap . RED is fully effective and has strain and strength properties of intact tendon.
4.3Loads on cross-section
In this paper the most important loads on bridge cross-section are considered. The selected load effects are self-weight, traffic load, secondary moment due to prestressing and thermal constraint loads. The loads are combined according to Equations 16 and 17 and shown in Tables 4 and 5 . The observed load combinations 1 and 2 are combinations with a leading action of traffic load and thermal load, respectively.
Table 4
Hogging moments of case bridges
| B20 | B30 | B40 | ||||
| All loads | μ | cov | μ | cov | μ | cov |
| Load combination 1 | 4.44 | 0.09 | 10.20 | 0.09 | 16.74 | 0.14 |
| Load combination 2 | 2.42 | 0.19 | 6.40 | 0.17 | 10.52 | 0.22 |
| Variable loads only | ||||||
| Load combination 1 | 3.33 | 0.05 | 6.04 | 0.05 | 10.14 | 0.05 |
| Load combination 2 | 1.31 | 0.27 | 2.24 | 0.35 | 3.92 | 0.35 |
Table 5
Sagging moments of case bridges
| B20 | B30 | B40 | ||||
| μ | cov | μ | cov | μ | cov | |
| Load combination 1 | –6.88 | 0.04 | –13.54 | 0.05 | –27.37 | 0.05 |
| Load combination 2 | –3.52 | 0.09 | –7.84 | 0.09 | –18.76 | 0.08 |
| Variable loads only | ||||||
| Load combination 1 | –3.56 | 0.06 | –6.27 | 0.06 | –9.62 | 0.06 |
| Load combination 2 | –0.74 | 0.36 | –1.33 | 0.44 | –2.35 | 0.45 |
4.4Capacity of cross-section
The capacities of post-tensioned cross-sections are calculated by modelling stress-strain relationships for materials, prestressing force and geometry for cross-section according to Table 2. The stress-strain models for materials are defined with nonlinear models with yielding or strain hardening. The curvature of cross-section is increased, and the equilibrium of forces is observed to achieve moment-curvature relationship for cross-section and limits of pre-defined limit states. The assumption is that all cross-sections are normally reinforced, i.e. the ultimate stress of steel is achieved at the ultimate limit state. The values of capacities of example cross-sections are presented in Table 8. Figure 5-a shows the non-linear moment curvature relation for intact cross-section with different prestressing levels and for reduced prestressing steel area.
Table 6
Hogging moments of example bridges
| B20 | B30 | B40 | Distribution | ||||
| μ | COV | μ | COV | μ | COV | ||
| Self weight | 3.15 | 0.10 | 8.10 | 0.10 | 18.60 | 0.10 | Normal |
| Secondary moment, prestressing | –2.03 | 0.10 | –3.93 | 0.10 | –12.00 | 0.10 | Normal |
| Traffic load, apt | 0.43 | 0.80 | 0.96 | 0.80 | 1.71 | 0.80 | Normal |
| ext | 2.78 | 0.06 | 5.24 | 0.06 | 8.76 | 0.06 | Gumbel |
| Thermal load –, apt | –0.52 | 0.13 | –0.75 | 0.13 | –1.30 | 0.13 | Normal |
| ext | –0.83 | 0.08 | –1.20 | 0.08 | –2.08 | 0.08 | Gumbel |
| Thermal load+, apt | 0.55 | 0.13 | 0.80 | 0.13 | 1.38 | 0.13 | Normal |
| Ext | 0.88 | 0.08 | 1.28 | 0.08 | 2.21 | 0.08 | Gumbel |
Table 7
Sagging moments of example bridges
| B20 | B30 | B40 | Distribution | ||||
| μ | COV | μ | COV | μ | COV | ||
| Self weight | –1.76 | 0.10 | –4.54 | 0.10 | –10.42 | 0.10 | Normal |
| Traffic load, apt | –0.33 | 0.80 | –0.74 | 0.80 | –1.31 | 0.80 | Normal |
| ext | –3.84 | 0.06 | –6.67 | 0.06 | –10.31 | 0.06 | Gumbel |
| Thermal load -, apt | –0.26 | 0.13 | –0.37 | 0.13 | –0.65 | 0.13 | Normal |
| ext | –0.41 | 0.08 | –0.60 | 0.08 | –1.04 | 0.08 | Gumbel |
| Thermal load+, apt | 0.28 | 0.13 | 0.40 | 0.13 | 0.69 | 0.13 | Normal |
| ext | 0.44 | 0.08 | 0.64 | 0.08 | 1.11 | 0.08 | Gumbel |
| Secondary moment | –1.02 | 0.10 | –1.97 | 0.10 | –6.00 | 0.10 | Normal |
Table 8
Cross-section bending moment capacities of original design in various limit states [MNm]
| Capacities | Load effects | ||||||||||
| MR . k | MR . d | MWdc3 | MWdc2 | Mcr | Mdecomp | Md | MCHAR | MFREQ | MQP | ||
| B20 | Sagging | –12.8 | –11.0 | –5.9 | –4.9 | –4.1 | –3.7 | –10.2 | –8.4 | –6.7 | –3.8 |
| Hogging | 12.2 | 8.9 | 5.2 | 4.5 | 3.8 | 3.1 | 7.5 | 6.7 | 4.6 | 3.0 | |
| B30 | Sagging | –19.4 | –16.4 | –9.5 | –8.3 | –7.1 | –6.5 | –19.5 | –16.4 | –13.0 | –8.5 |
| Hogging | 17.2 | 13.9 | 7.4 | 6.7 | 6.1 | 5.1 | 16.1 | 14.5 | 10.4 | 8.0 | |
| B40 | Sagging | –45.3 | –36.9 | –22.6 | –20.7 | –19.1 | –17.6 | –36.8 | –31.9 | –26.3 | –19.9 |
| Hogging | 38.2 | 29.9 | 22.1 | 19.9 | 17.8 | 13.9 | 27.6 | 24.9 | 17.7 | 14.1 | |
xx.x = Capacity less than load effect in design.
Fig. 5
a) Moment curvature relation for intact cross-section with different prestressing levels and for reduced prestressing steel area. b) Scaled hogging capacities of bridge cross-sections with different amounts of reinforcement (a ... d) and with prestress losses (‘).
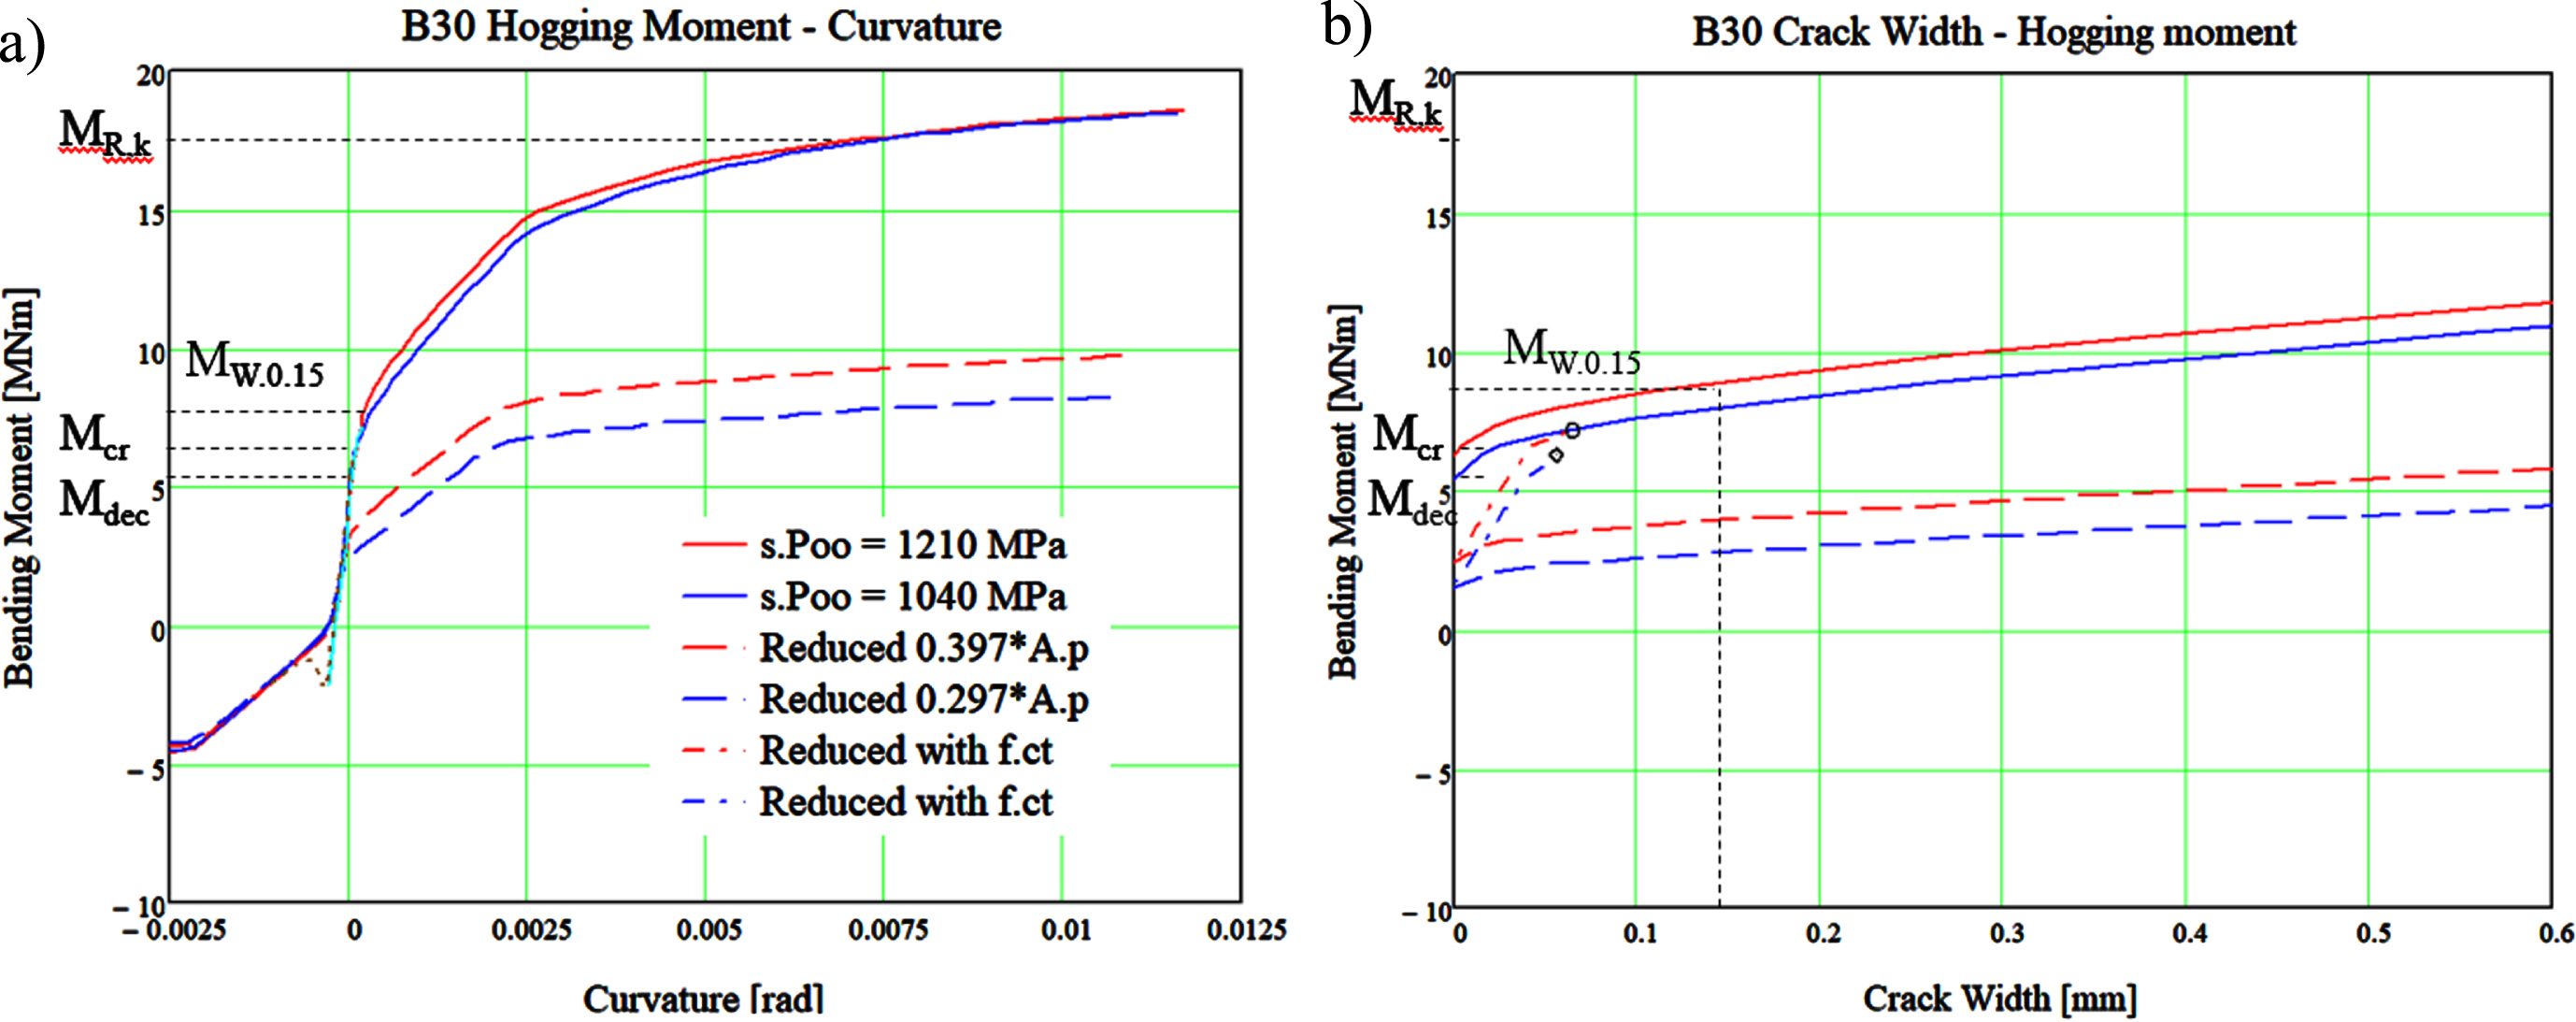
In Fig. 5-b, the effects of reduced tendon area with different prestresses on bending moment –crack width behaviour are shown. The width of the crack is considered via strain in reinforcement steel. The inclusion of the effect of tensile strength of concrete causes the peak in curves with a reduced tendon area. The cracking moment of concrete is shown with a hollow dot. In case of force-controlled loading of a beam, when the cracking moment of cross-section is exceeded, a rapid opening of cracks in concrete is observed due to tensile failure of the concrete which is transferred to reinforcement steel.
The cross-section properties are varied to take account of the different possible designs of the bridge with various amounts of reinforcing steel according to Table 2. The effect of lower (or loss considered in design) prestressing stress in tendon is marked with notation (‘), meaning 0.85-fold prestressing stress in comparison to the original. The capacities of concrete cross-section are calculated in limit states of decompression, cracking, crack width of 0.07 mm (DC2), crack width of 0.15 mm (DC3), ultimate limit state with safety factors (MR) and ultimate limit state with characteristic values (MRk). The calculated average MRK/Mcr-ratio is 2.5 and MRK/Mdecomp-ratio is 3. For crack widths MRK/MW0.07 and MRK/MW0.15 the ratios are 2.0 to 2.5 and 1.7 to 2.0 respectively depending heavily on prestressing and amount of reinforcement. It can be noticed from Table 8 that all the case cross-sections will crack under current LM1-2014 frequent load combination. That is why the analysis of the robustness of cross-section must be performed with scaled frequent load combinations which fulfil the design criteria presented in Equation (8).
In Table 8 the sagging moment capacity is higher in comparison to hogging due to the broader compression zone in the T-section. Also, the ratios between the ultimate capacity and SLS limit states of decompression and cracking are higher in case of hogging, causing a higher margin of safety from cracking to ultimate. The margin from cracking to ultimate is also increased by additional reinforcement and prestress losses.
5Reliability analysis
5.1Reliability analysis for design cases
For original structures in case bridges, following reliability indices are calculated and presented in Table 9. 1-year reliability levels against failure are on satisfying level for original structures and very high values are noticed due to excess amount of prestressing steel determined by SLS-criteria. The results show the problem with calculation method in sagging moment of case bridges B20 and B30. Due to increase in traffic loads in comparison to design era of the bridge, the frequent load affecting on bridge exceeds the cracking load i.e the cracking moment is exceeded with current amount of tendons. Therefore, the kRED > 1.0, which means there is need to increase the amount of prestressing steel rather than reduce it to satisfy the condition Mcr = MFREQ, so amount of tendon reduction to cause cracking in frequent combination is 0.
Table 9
Results of reliability analysis of case bridges
| Sagging | Hogging | |||||||
| kRED | β | βRED | βR | kRED | β | βRED | βR | |
| B20 | 1.31 | 8.53 | 9.88 | – | 0.31 | 15.40 | 4.54 | 1.42 |
| B30 | 1.53 | 3.62 | 7.88 | – | 0.87 | 10.34 | 8.67 | 6.20 |
| B40 | 0.97 | 4.47 | 2.88 | 2.81 | 0.50 | 15.11 | 10.52 | 3.29 |
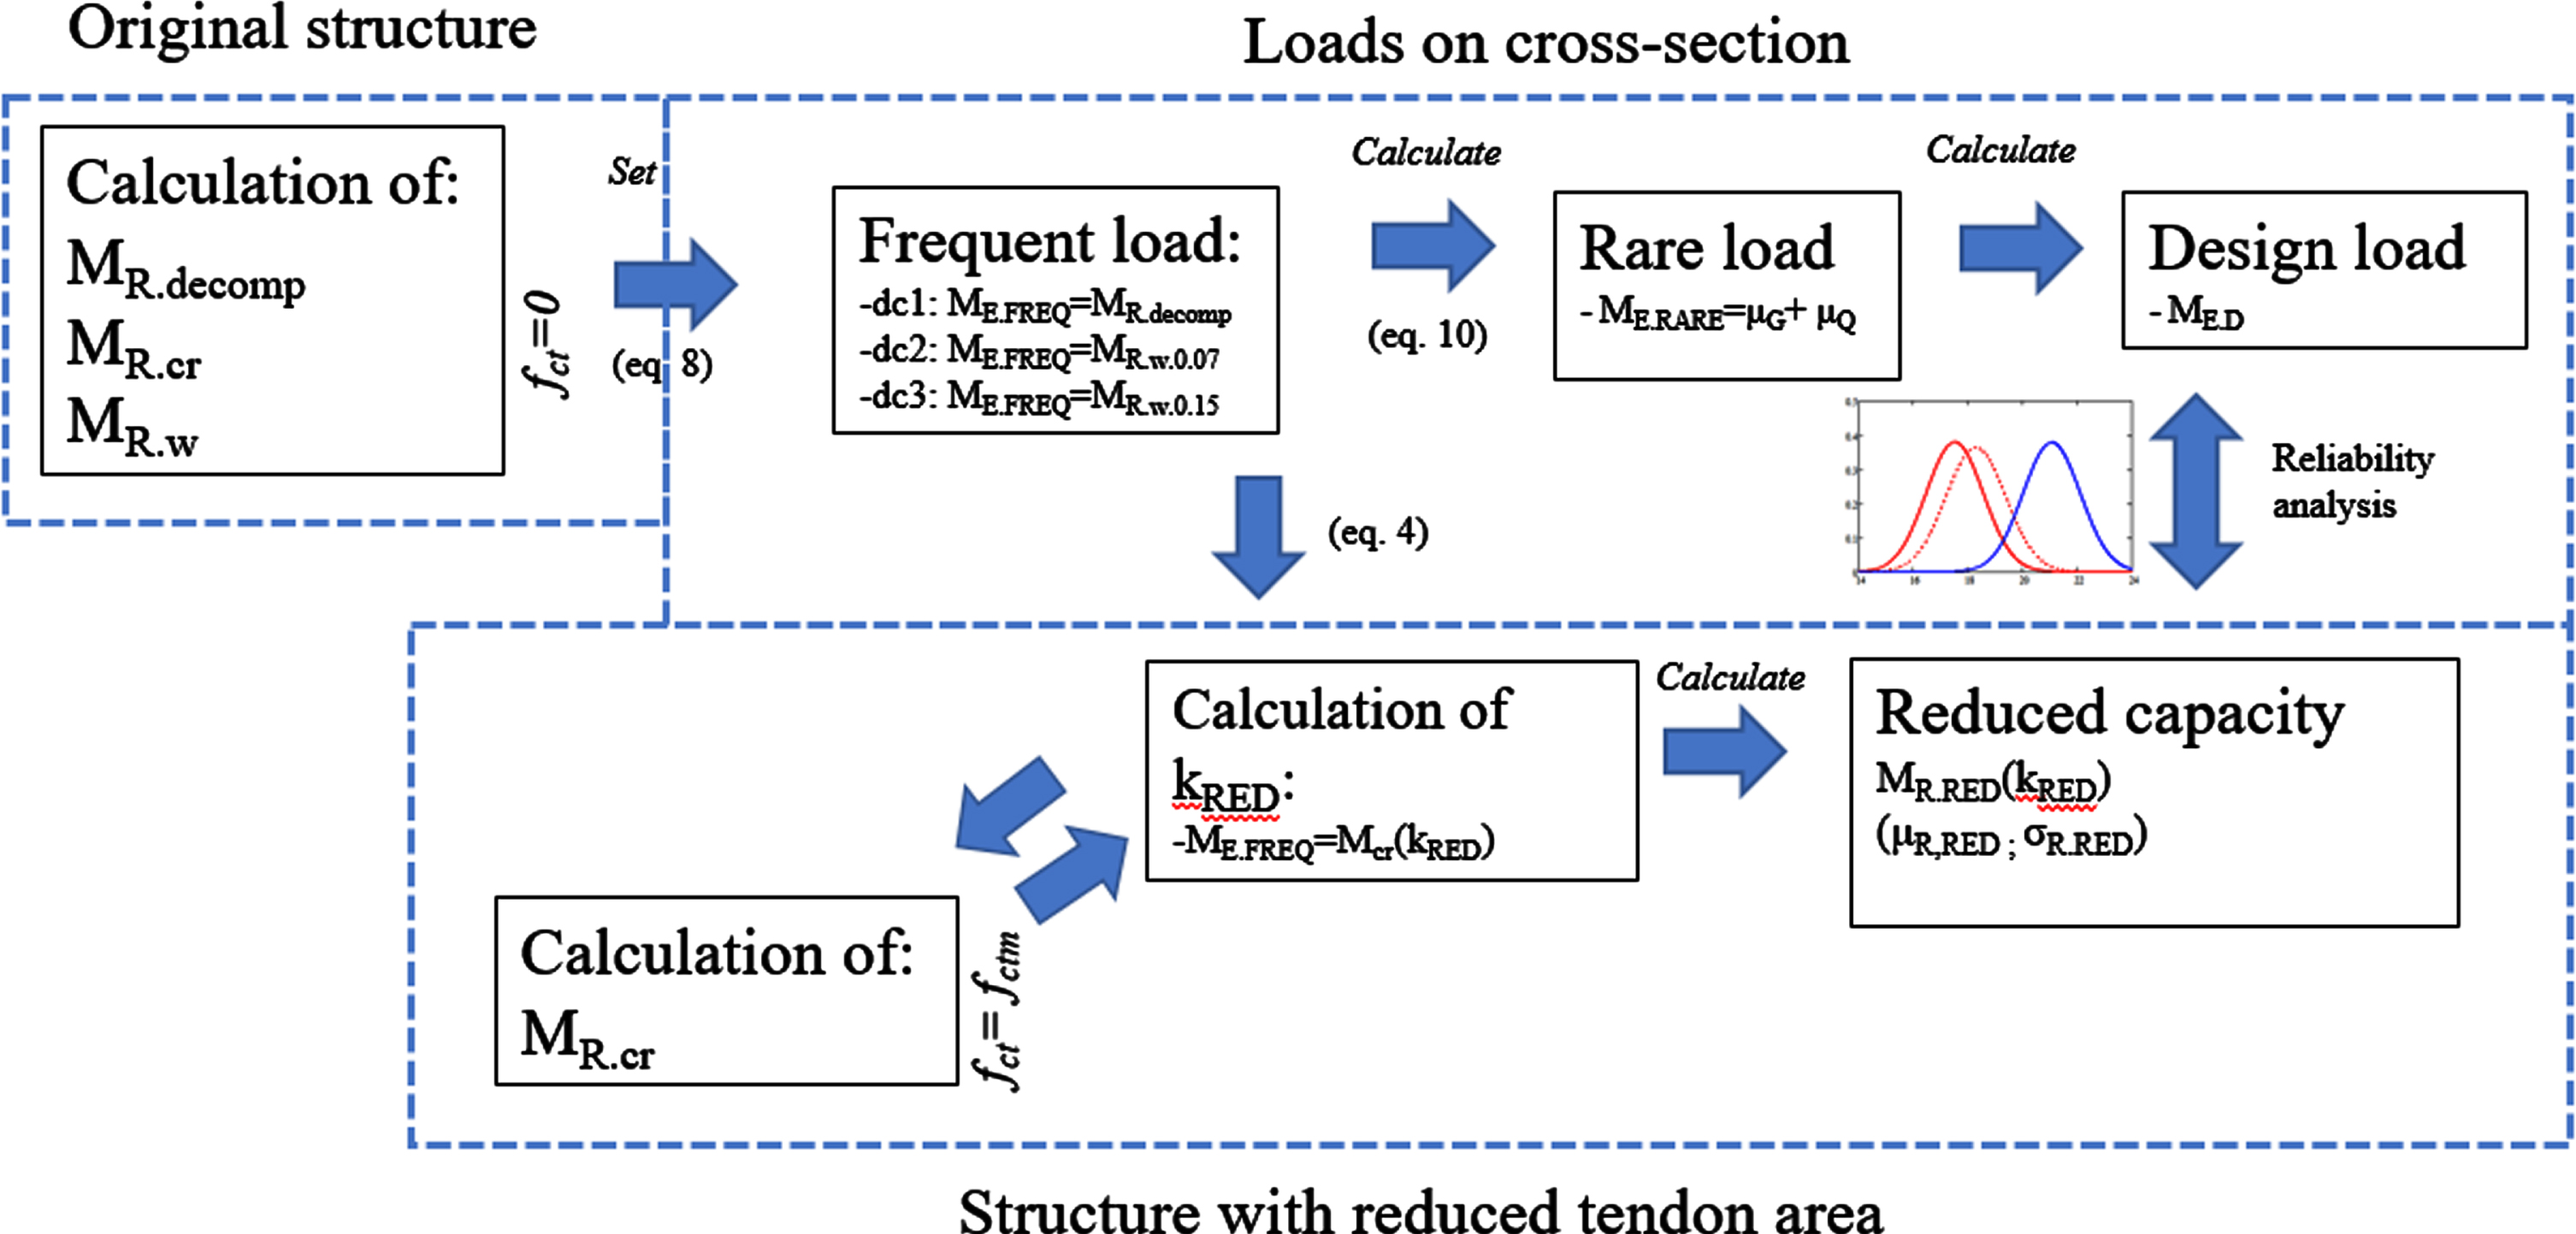
Due to forementioned and comparability, the reliability analysis is conducted with the process presented in Fig. 6 and Equations 8–14 allows us to assess the reliability level of different designs in the event of crack formation due to loss of prestressing steel area. This method forces the condition Mcr = MFREQ to be applied. This allows us to assess the reliability level of different designs in the event of crack formation due to loss of prestressing steel area and draw general conclusions about the reliability levels achieved with the presented method in case of structures in which the SLS is determinate factor in design or in bearing capacity assessment.
Fig. 6
Calculation procedure for determination of the design point and reliability of cross-section with reduced tendon area.
5.2SLS design criteria
In post-tensioned bridges the utilisation of SLS typically determines the design of the cross-section. This means the amount of prestressing steel, reinforcement steel and dimension cross-section geometry and prestress are determined to fulfil the SLS design criteria, whereas the utilisation ratio in ULS is typically low, meaning excessive capacity in ULS. The SLS capacity of cross-section could be increased by increasing the prestress in tendons, which does not influence the ULS capacity.
Design criteria for the cracking of a post-tensioned bridge depends on the environmental exposure class of the bridge. For more severe exposure, the decompression limit should not be exceeded in frequent combination. In case of less severe environmental decompression, the limit is required only in quasi-permanent combination and a limited crack width in frequent combination. The allowed crack width has varied in structural codes in different exposure classes during the past decades, as shown in Table 10. The codes also allow an increase in allowed crack widths presented in the Table if the concrete cover fulfils certain requirements. The factor in codes typically ranges from 1.0 to 1.5.
Table 10
Basic values of allowed crack widths of service limit states in Finnish bridge codes for concrete structures, with corrosion sensitive reinforcement in [mm]
| Environmental class | 1972 | 1981 | 2005 | 2012 | ||||
| (conditions) | SLSt(1 | SLSs(2 | SLSt | SLSs | SLSt | SLSs | SLSt | SLSs |
| 1 (Severe) | Uncr(3 | decomp | decomp | decomp | decomp | decomp | decomp | decomp |
| 2 (Normal) | N/A | decomp | 0.1 | decomp | 0.1 | decomp | 0.07 | decomp |
| 3 (Mild) | N/A | N/A | 0.2 | 0.3 | 0.2 | 0.3 | N/A | 0.2 |
(1 Temporary load (2 Sustained load (3 0.85*fct is allowed.
Design point is the capacity of cross-section with tendon loss determined by the calculation of cross-section cracking. The location of the design point depends on the design criteria and the original design of the bridge. In this paper, the bridges in the case studies are analysed with three different design cases in frequent SLS:
• DC1: No tension allowed in concrete in original design
• DC2: allowed crack width 0.07 mm in original design
• DC3: allowed crack width 0.15 mm in original design
A design point is found by setting the decompression moment as equal to the total frequent load and calculating the proportions of permanent load and live loads as a function of the load ratio.
5.3Calculation of reliability
A reliability of cross-section is analysed at the design point, which is calculated with the method described in previous chapter. A design point is found by setting a corresponding value of limit state Equation (8), with which the value of ME . FREQ is calculated.
The reliability index for bridge cross-section can be presented and calculated in form:
(18)
(19)
μR, σR Mean value and standard deviation of concrete cross section resistance
μR, σR Mean value and standard deviation of concrete cross section stress
ME.FREQ Frequent load according to codes
ψ1 Combination factor for frequent load value
ψRARE Combination factor for rare load value
α Load ratio according to Equation (12)
γG Bias factor for self-weight
VG, VQ Coefficient of variation of self-weight and variable load
The parameters of 1-year distribution of bending moment and the values of μQ = MEQ . RARE and μG are calculated according to equations (Equations 10 and 11) and (Equations 13 and 14) by applying the bias factors and standard COVs presented in Tables 11 and 12.
Table 11
Statistical parameters of sagging from simulation
| μMRs/ μCRs | COVMRs | λMRf | COVCRs | λCRs | |
| B20 | 1.97 | 0.055 | 1.093 | 0.093 | 1.196 |
| B30 | 1.77 | 0.057 | 1.087 | 0.098 | 1.180 |
| B40 | 1.61 | 0.061 | 1.074 | 0.097 | 1.147 |
Table 12
Statistical parameters of hogging from simulation
| μMRh/ μCRh | COVMRh | λMRh | COVCRh | λCRh | |
| B20 | 1.93 | 0.058 | 1.120 | 0.106 | 1.299 |
| B30 | 1.30 | 0.053 | 1.089 | 0.117 | 1.286 |
| B40 | 1.62 | 0.066 | 1.098 | 0.106 | 1.237 |
5.4Monte Carlo simulation of cross-section capacity
A Monte Carlo simulation is performed to find a probability distribution and parameters for the ultimate bending moment and cracking moment for the cross-section. A simulation is performed with a simplified model of the ultimate limit state with help of the parameters found in Table 3, and the mean values and standard deviations of ultimate capacities are found. Bias factors λ for capacities are obtained with equation (Equation 20) by dividing the obtained mean value μi with the corresponding characteristic value Xk,i.
(20)
In reliability analysis, the mean values of cross-sections with different reinforcements are calculated by multiplying the characteristic resistance with the bias factor. A bias factor is assumed constant for different bridges independent of the amount of reinforcement steel. Due to several random parameters affecting capacity, the distributions of bending moment capacities are towards normal distribution.
For prestressed cross-section, the probability of cracking capacity exceeding the ultimate capacity can be presented with equation Pr(MR > Mcr), and the corresponding reliability can be calculated by substituting Equation (20) into Equation (18):
(21)
μMR, σMR Mean value and standard deviation of ultimate resistance of PTC cross section
μcr, σcr Mean value and standard deviation of concrete cracking resistance of PTC cross section
MR;k Characteristic value of ultimate moment of PTC cross section
Mcr;k Characteristic value of cracking moment of PTC cross section
λMR, λcr Bias factors of ultimate moment and cracking moment of PTC cross section
VMR, Vcr Coefficients of variation of ultimate moment and cracking moment of PTC cross section
in which the parameters’ application of parameters can be done according to Tables 11 and 12. It must be noted that the presented probability in Equation (21) is solely property of cross section and depending only on the geometry and properties of cross section and is applicable also to cross section with tendon loss.
6Results and discussion
The reliability analysis is conducted with the process presented in Fig. 6 and Equations 8—14 by forcing the condition Mcr = MFREQ to be fulfilled. The analysis shows the SLS to be the determinate due to excess reliability level in DC1...DC3 with the original design which can be noticed in solid lines in Fig. 7, while the reliability level of the ULS equation with reduced prestressing steel is lower (black). The reliability of the cross-section is shown through the adequate 1-year reliability level with tendon loss (dashed line) in Fig. 7.
Fig. 7
1-year reliability index for a) sagging b) sagging with 15% prestress loss, c) hogging d) hogging with 15% presress loss, achieved with different DCs for original design (solid line) and for reduced prestressing steel area (dashed line).
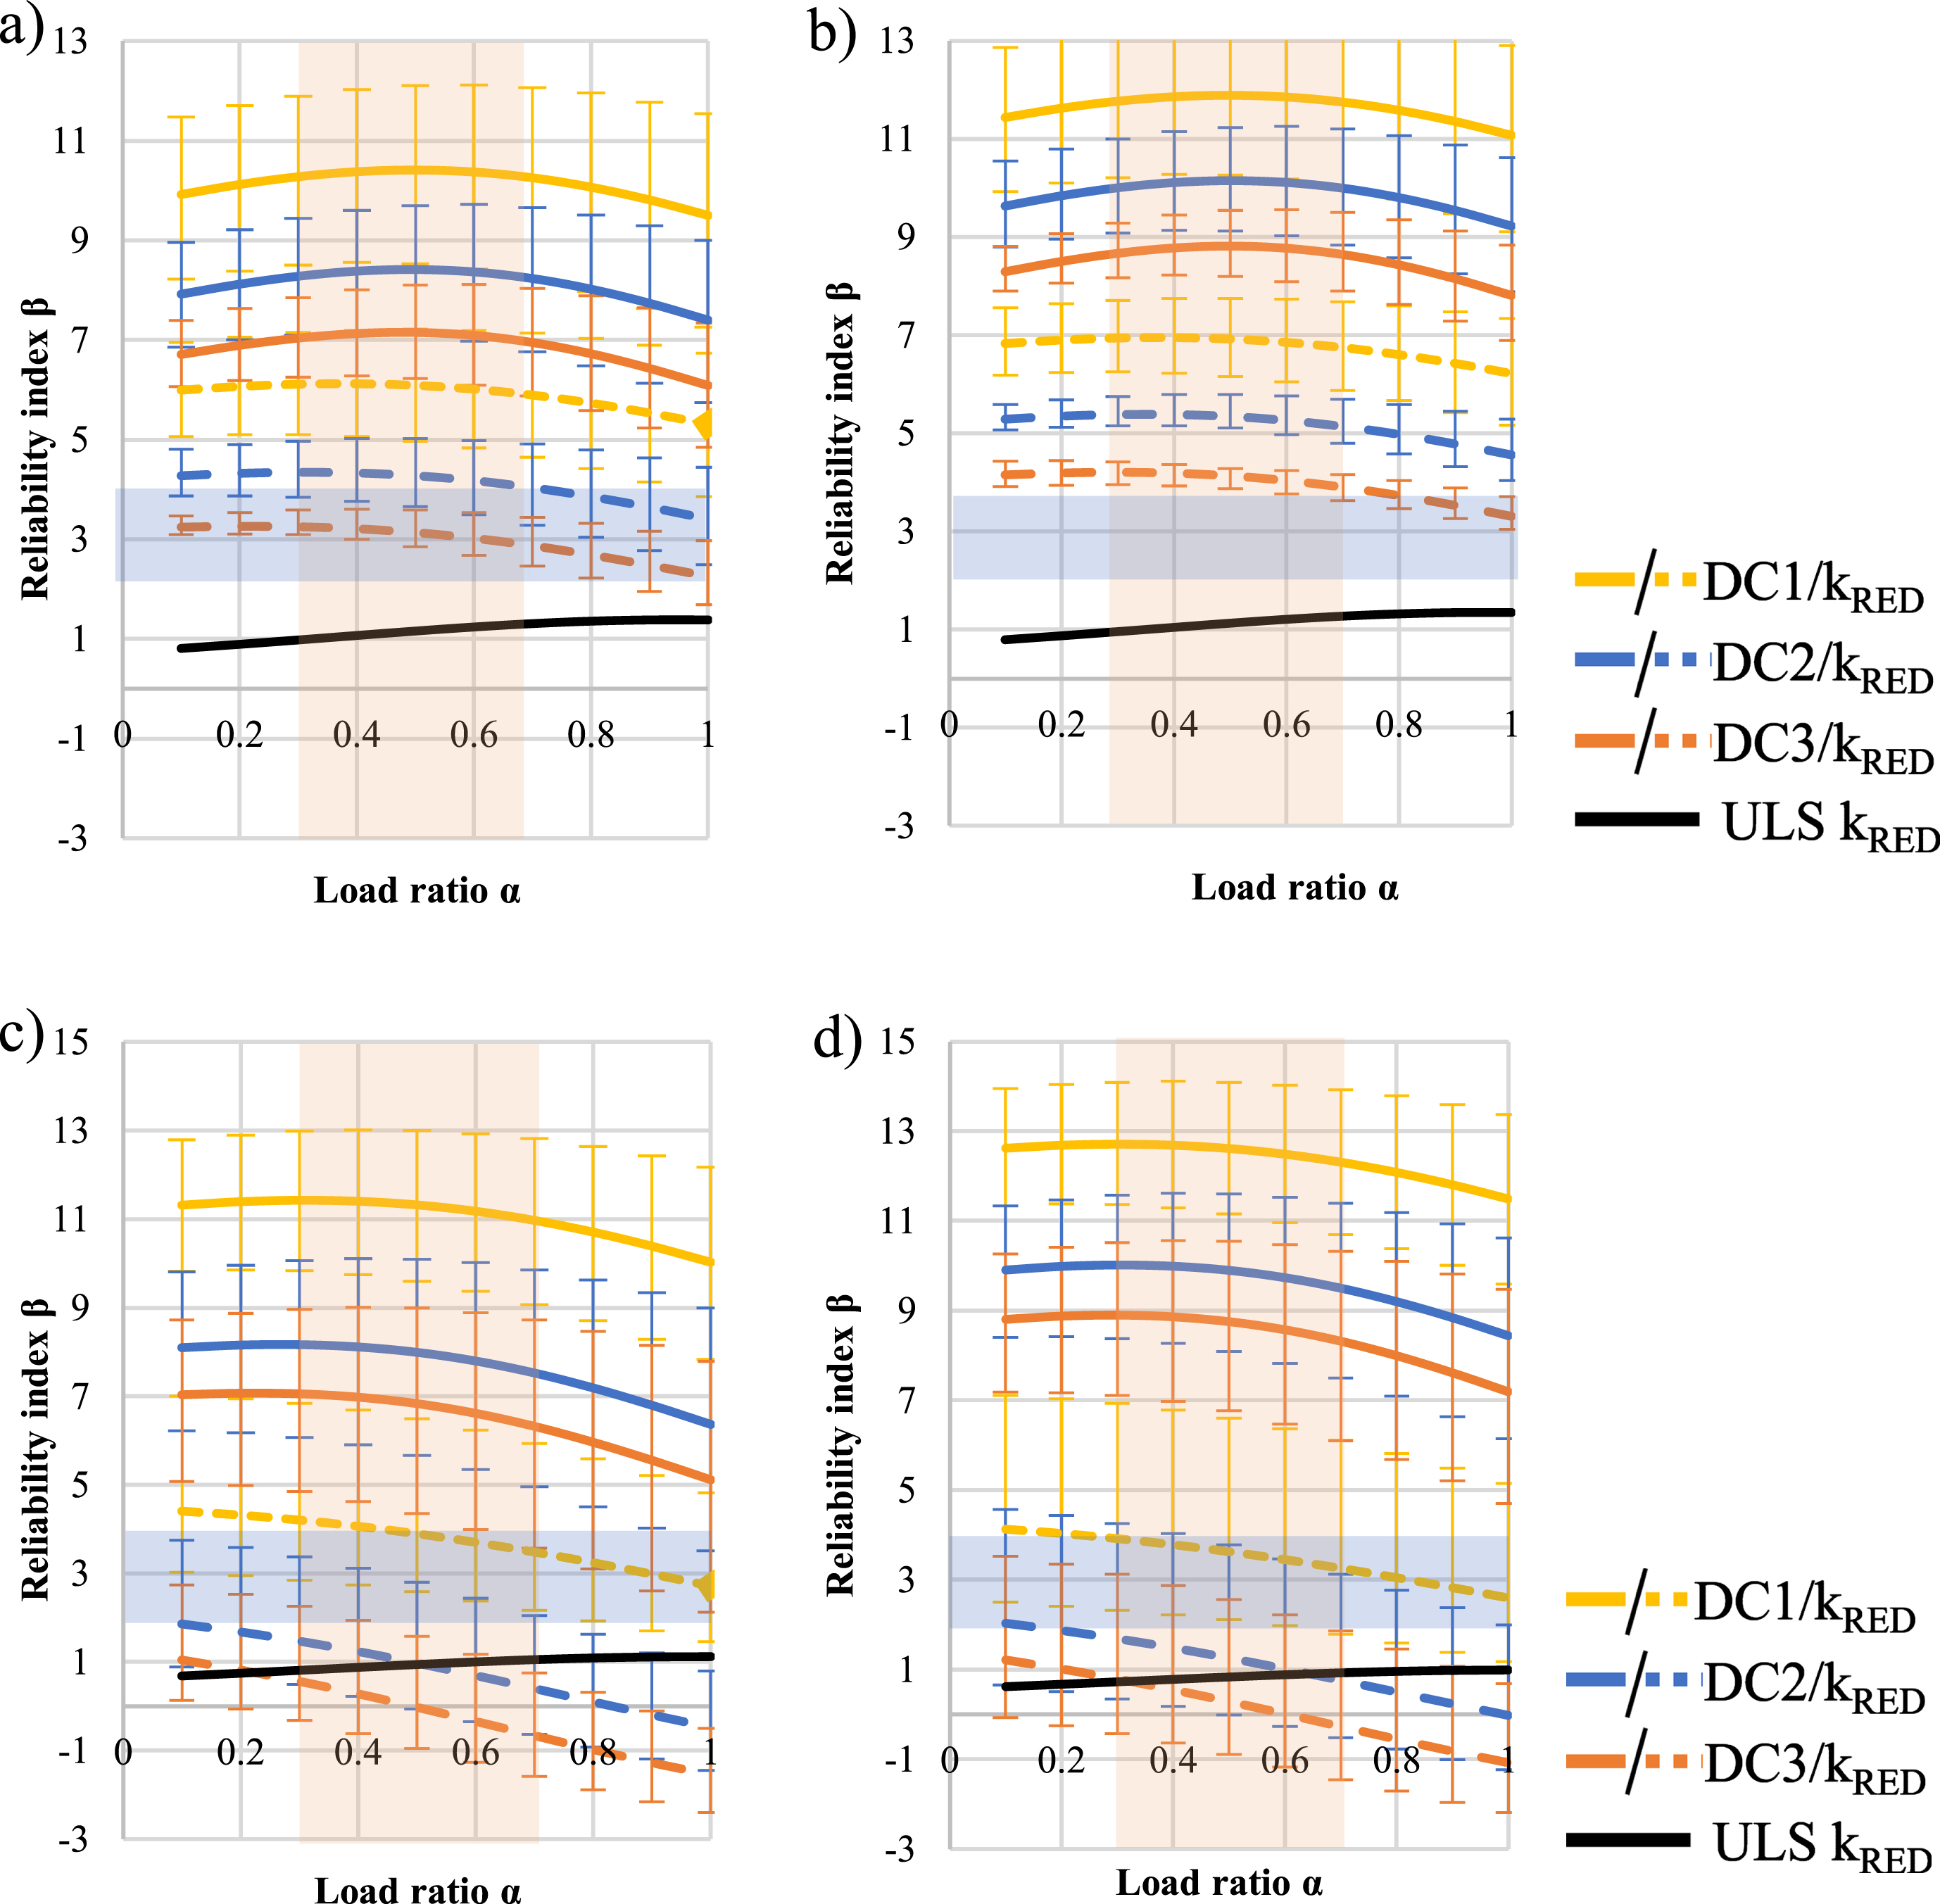
The difference in reliability levels after tendon loss induced crack formation can be noticed between the sagging moments in Fig. 7-a, and b, and hogging moments in Fig. 7-c, and d. In support, the amount of tendon loss to form a crack with frequent load is significantly higher in comparison to the sagging moment. In the case of the hogging moment, the ULS limits the decrease of the reliability level. The SLS criteria with no allowance of tensile forces or cracking in concrete in design of the bridge (DC1) leads to a safety margin from SLS to ULS and therefore high reliability level of the intact cross-section. This is mainly due to the lower allowed frequent load, which is also the case in structures with lower prestressing. In case studies, the increase in load ratio decreases the reliability index, due to increase of live load which has higher variability and increased rare combination value.
The reason for the lower reliability level in hogging moment with a damaged structure in comparison to sagging is due to the difference in section modulus between negative and positive bending. In the T-section the centre of the cross-section is located closer to the top surface, which leads to a higher top fibre section modulus. The reliability level achieved with equation. 5 and 6 is low in comparison to adequate target reliability levels.
In Fig. 7 it is shown that the 1-year load distributions calculated from SLS criteria DC2 and DC3 exceed the one calculated with ULS criteria in case of hogging moment with relevant load ratios and thus they are irrelevant in reliability analysis, while ULS criteria govern the assessment. This means that allowance of crack width more than 0.07 mm in frequent combination leads relatively higher rare values of loads and therefore lower reliability indices in case of reduced prestressing steel.
6.1Effect of prestress
The amount of prestress influences the robustness (crack before failure behaviour) of the structure. The increase in prestressing stress in design allows for higher loads in SLS combination, whereas the ultimate capacity does not increase as the amount of prestressing steel remains constant. For this reason, the ratio between allowed frequent load and ultimate capacity increases the leading lower reliability of bridges with higher prestress. If prestressing stress is decreased in design in SLS (for example by considering prestressing losses), the margin between cracking moment and ultimate moment increases, which increases reliability. Also, the amount of prestressing affects the allowed SLS load on the bridge. With higher prestressing in tendons, the allowed SLS loads increase, leading to an increase in ultimate load (due to constant ratio between frequent and ultimate load) but not in ultimate capacity. In this paper, calculating the design point requires the frequent load to be equal to the cracking load according to equation 8, which leads to higher frequent loads with high prestress and lower loss of prestressing steel area before concrete cracking, which can be noticed on legend tables below charts in Fig. 8 a-d. The value of proportional amount of remaining tendon area (marked k in Fig. 8 a-d increases as prestressing of steel increases.
Fig. 8
Effect of prestressing on ultimate to cracking moment ratio in a) sagging b)..d) hogging. Continuous line and Diamond marker: without loss in Ap; Dashed line and cross-marker: with loss in Ap.
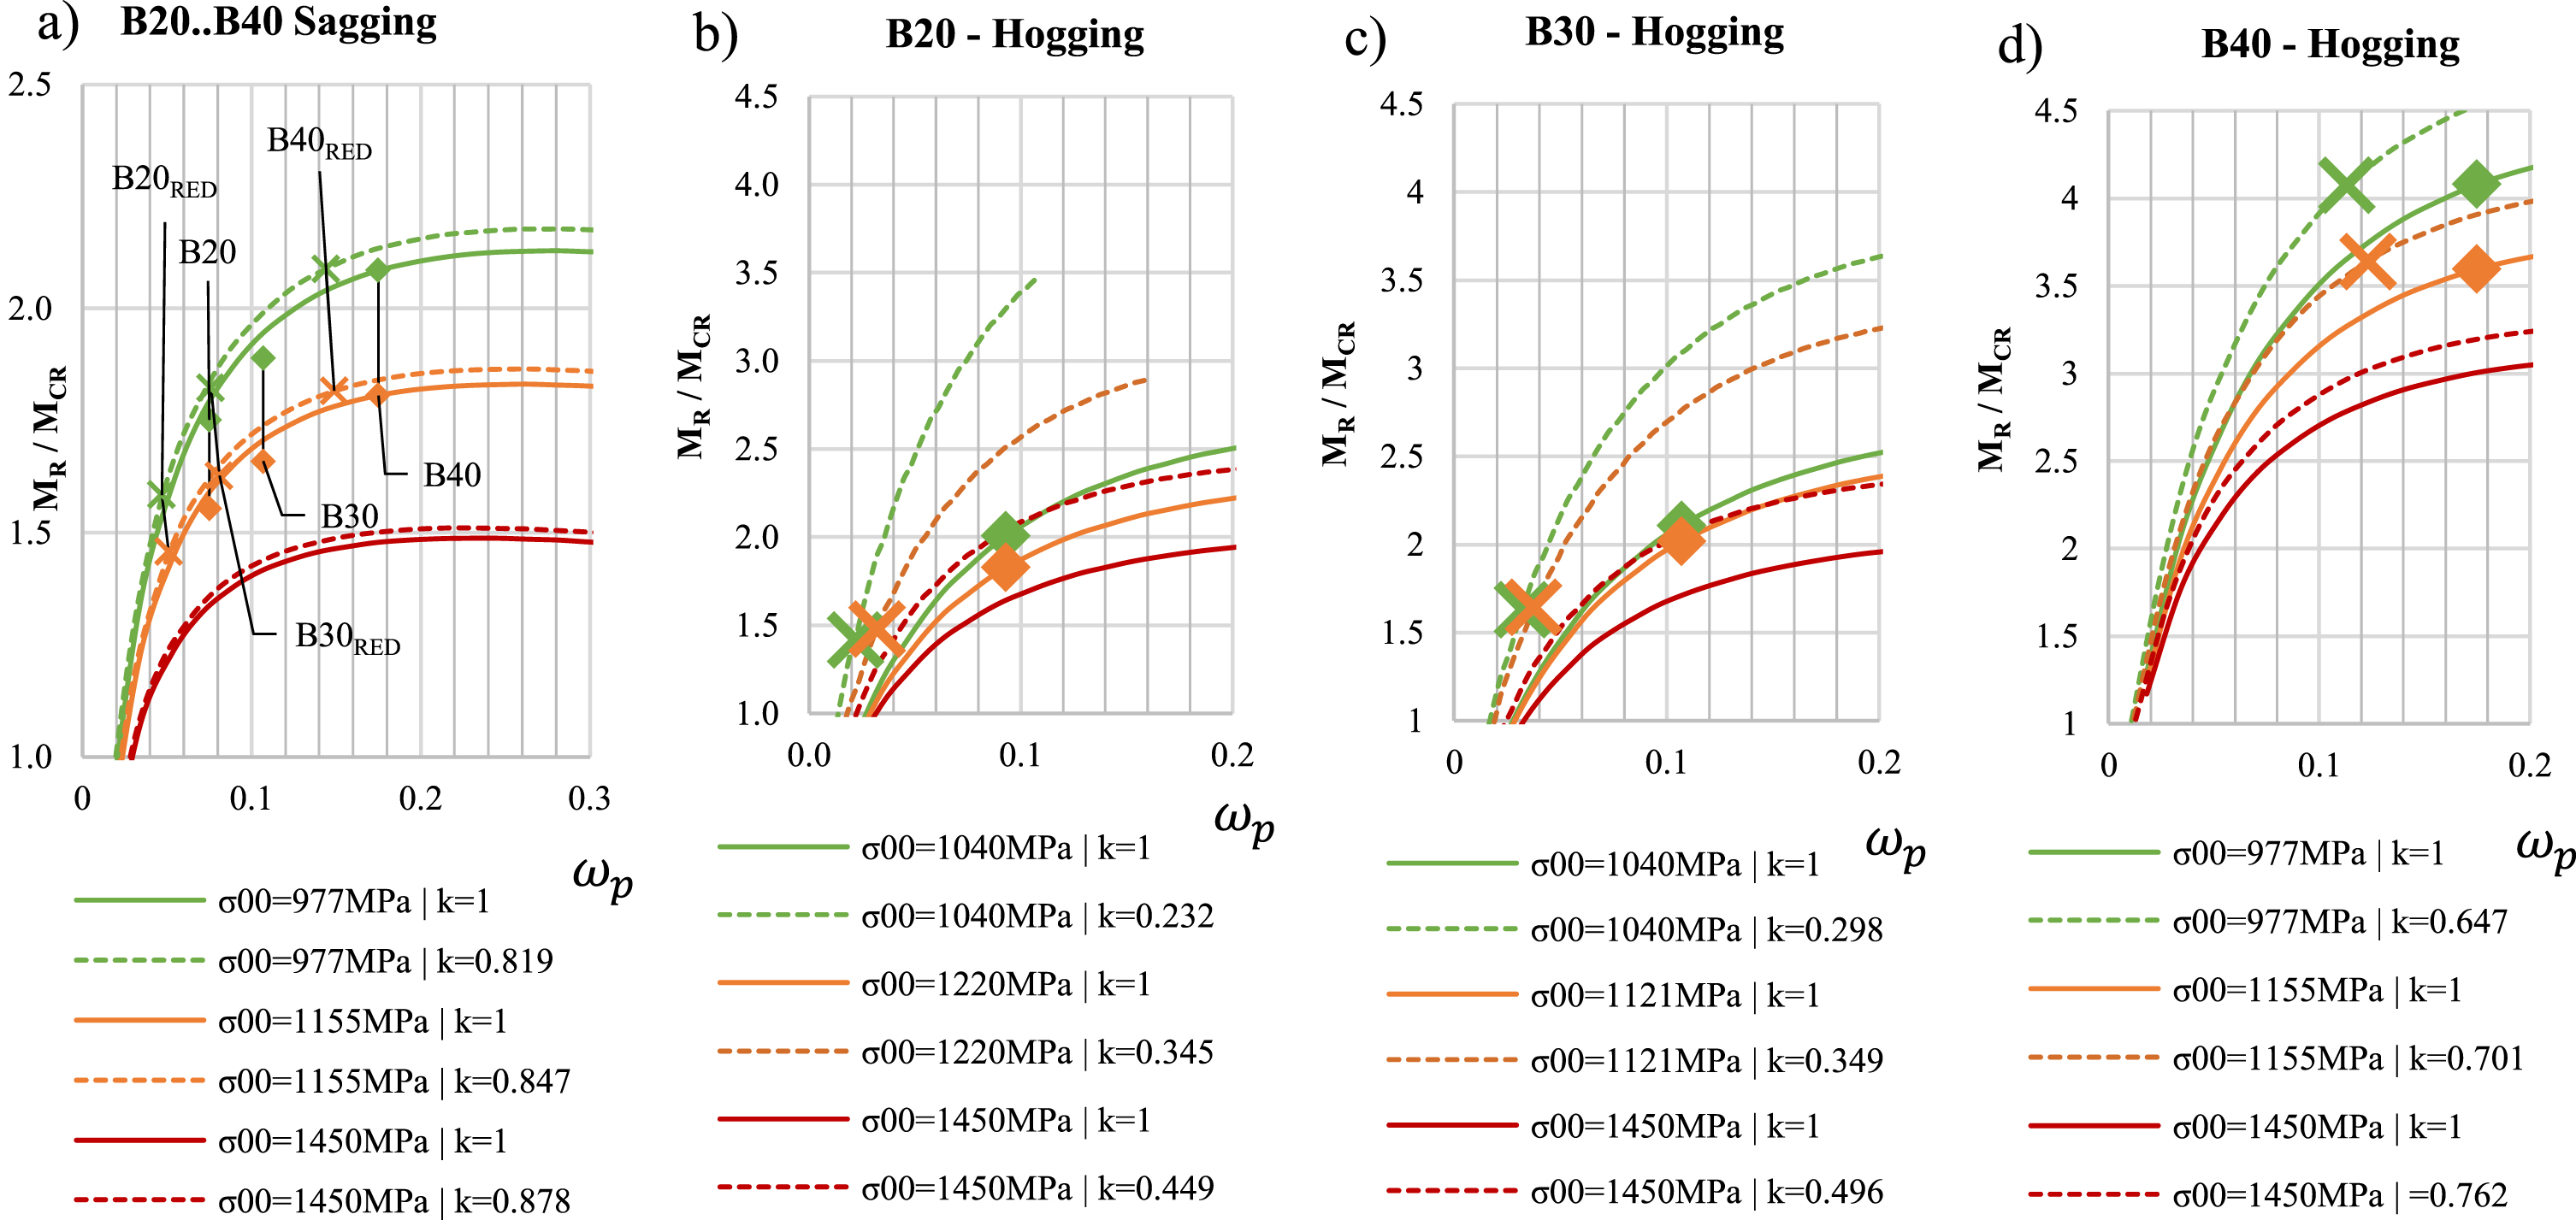
In Fig. 8, the beneficial effect of lower prestress on the MR/Mcr ratio can be observed (solid lines), which show higher marginal from cracking to ultimate with lower prestressing. The effect of the loss of the area of prestressing steel has a decreasing effect on the MR/Mcr ratio. The mechanical reinforcement ratio of prestressing steel ωp is shifted towards left and the marker of example bridge from solid to dashed line. The lower ωp of original structure may lead to higher prestress and thus increased effect of tendon loss on MR/Mcr, while higher ωp causes the ratio to be almost constant despite the reduction of prestressing steel for example B40 in Fig. 8a) and 8d). In Fig. 8 b-c can be observed the higher the prestressing loss the more upwards the MR/Mcr –curve turns, meaning more sensitive response in the reduced value of ωp in case of hogging moment.
6.2Effect of design case (DC) and amount of ordinary reinforcement
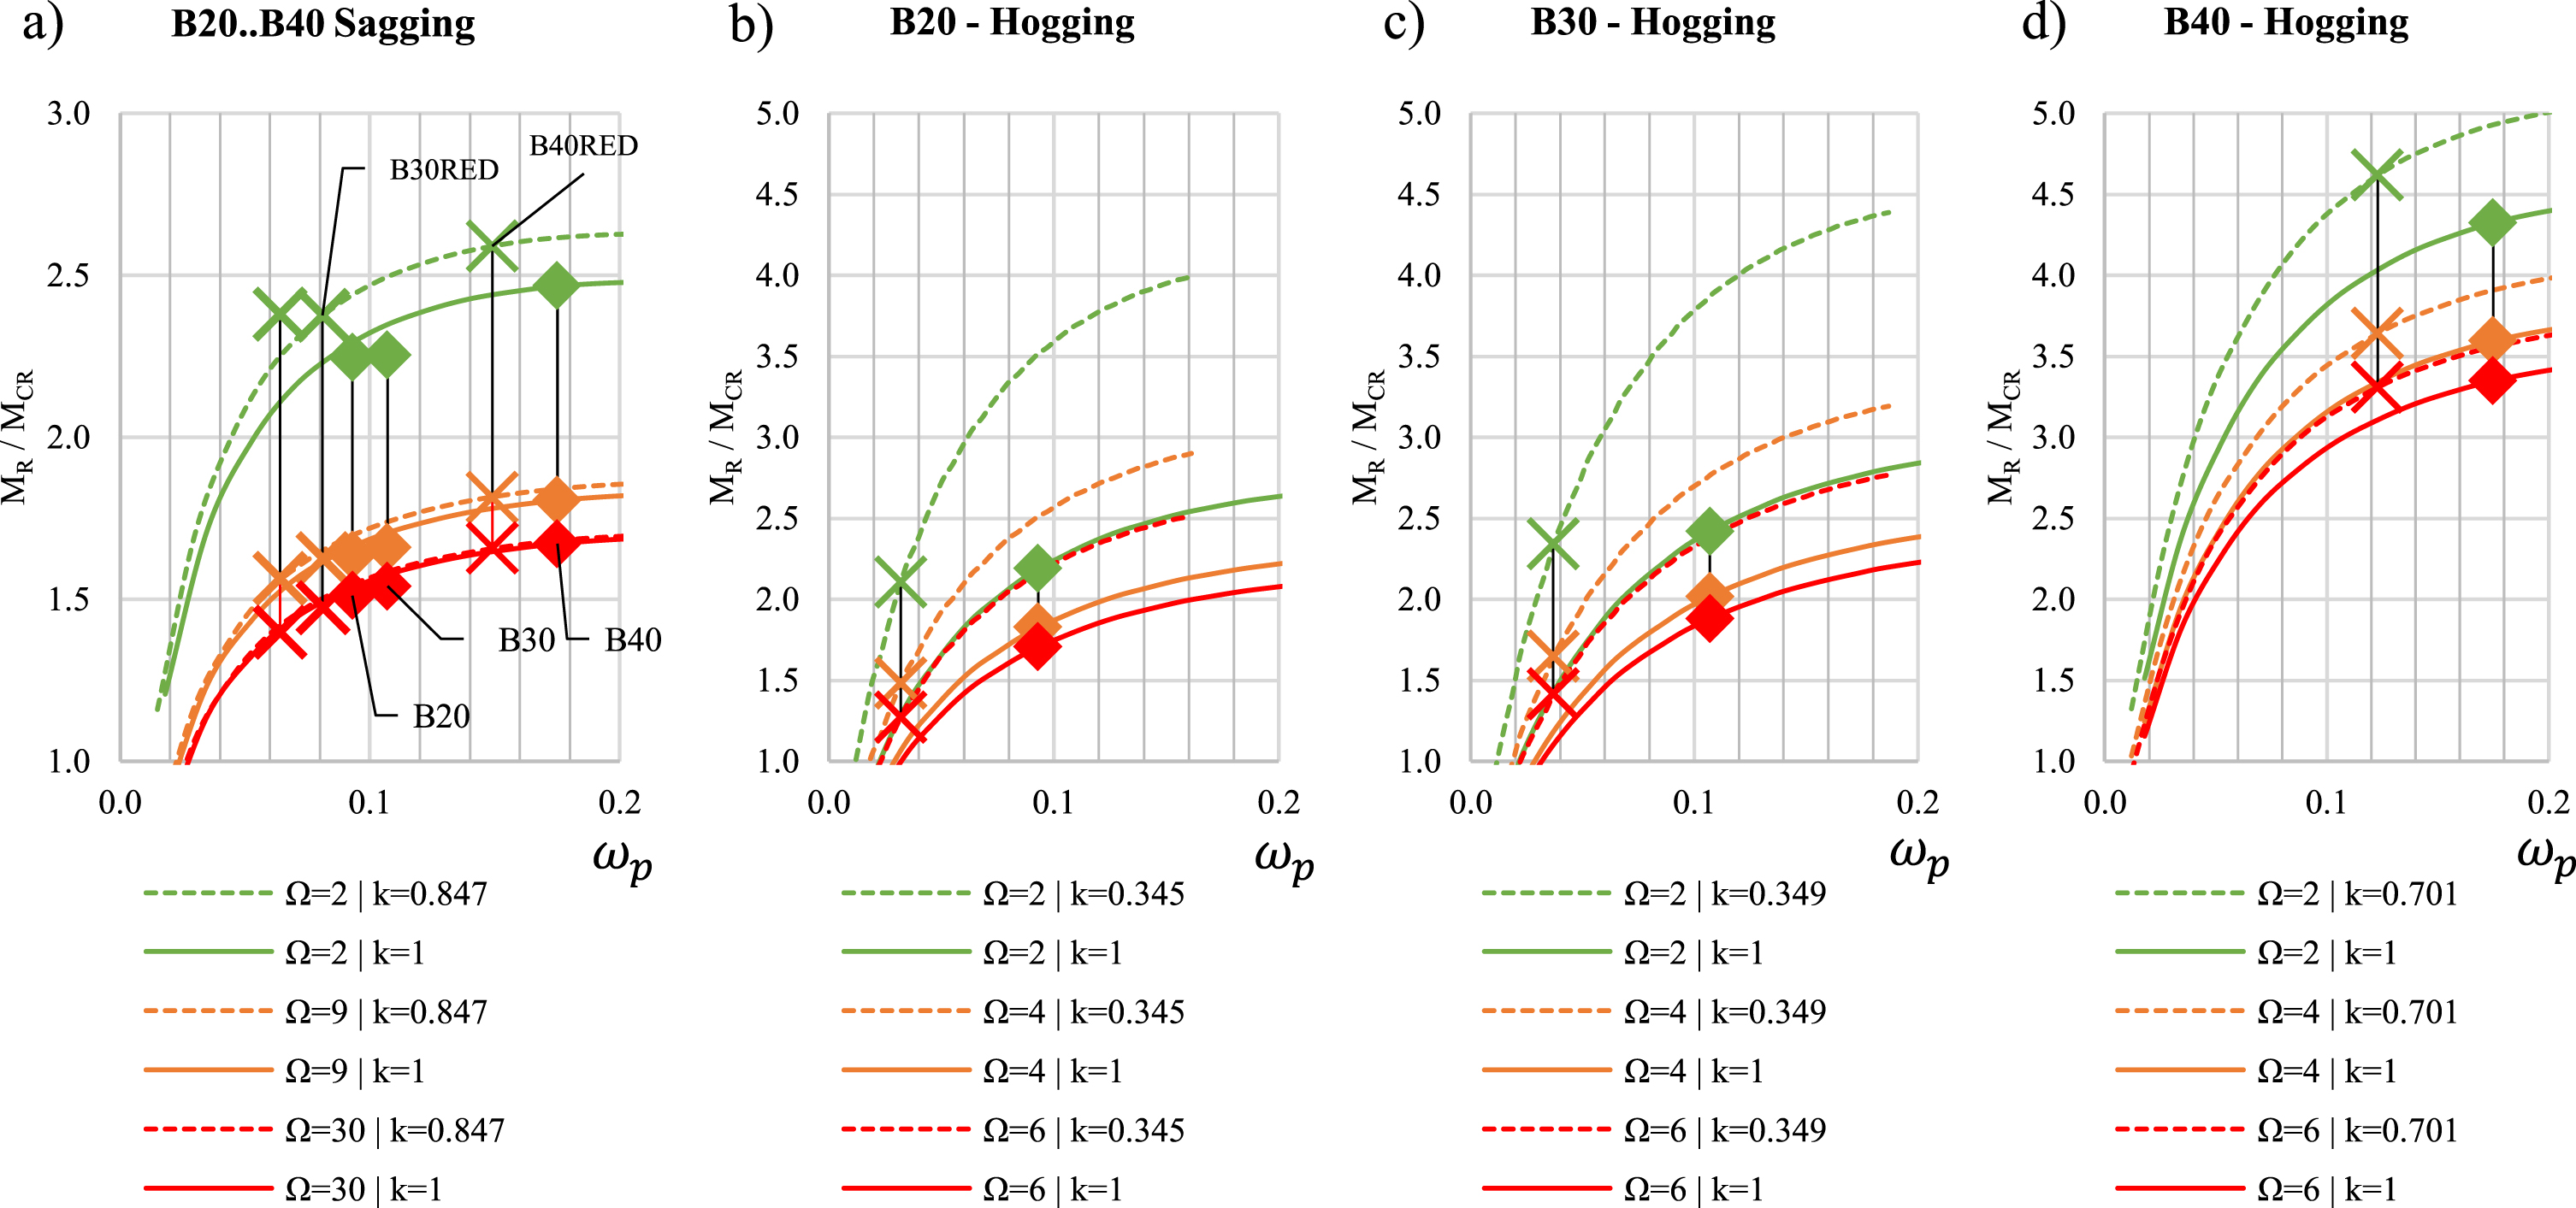
A margin of safety can be presented with a ratio between ultimate moment and cracking moment. In Fig. 9, the variation of MR/MCR is shown for various case cross-sections with different ratios between prestressing steel and reinforcement steel, marked with Ω. In this case, bridge Ω varies at 2.2 ... 15.2 for sagging and 2.0 ... 5.2 for hogging.
Fig. 9
Effect of amount of reinforcement steel on ultimate to cracking moment ratio in a) sagging b)..d) hogging. Continuous line and diamond marker: without loss in Ap; Dashed line and cross marker: with loss in Ap.
(22)
In which
ωp, Ap, fpk and ωs, As, fsk are mechanical reinforcement ratios, cross-section areas and tensile strengths of prestressing and reinforcement steel respectively.
Increasing amount of reinforcement steel in cross-section leads to a decrease on Ω and higher ratios between cracking and ultimate moment, meaning the cross-section behaviour is more like ordinary non-prestressed concrete, which can be seen in Fig. 9 a-d. A loss on prestressing steel cross-section area does have a minor increasing effect on the MR/MCR ratio in Fig. 9-a, while Ωp is higher than 0.15. With the lower Ω ratio the higher increase in the MR/MCR ratio can be observed due to the loss in prestressing steel area.
The amount of reinforcement steel does not have a significant contribution on the cross-section cracking moment. However, the placing and amount of ordinary reinforcement has a reducing effect on the crack width growth in loading, allowing higher loads in SLS with a certain limited crack width. The ultimate capacity of the cross-section is also increased as the amount of reinforcement increases. Therefore, an increase in the area of reinforcement increases the robustness of the structure in case of tendon failure, especially in cases in which the cross-section is originally designed for decompression limit, because decompression is not dependent on the amount of reinforcement steel and therefore the allowed SLS load is not increased due to an increase of reinforcement steel.
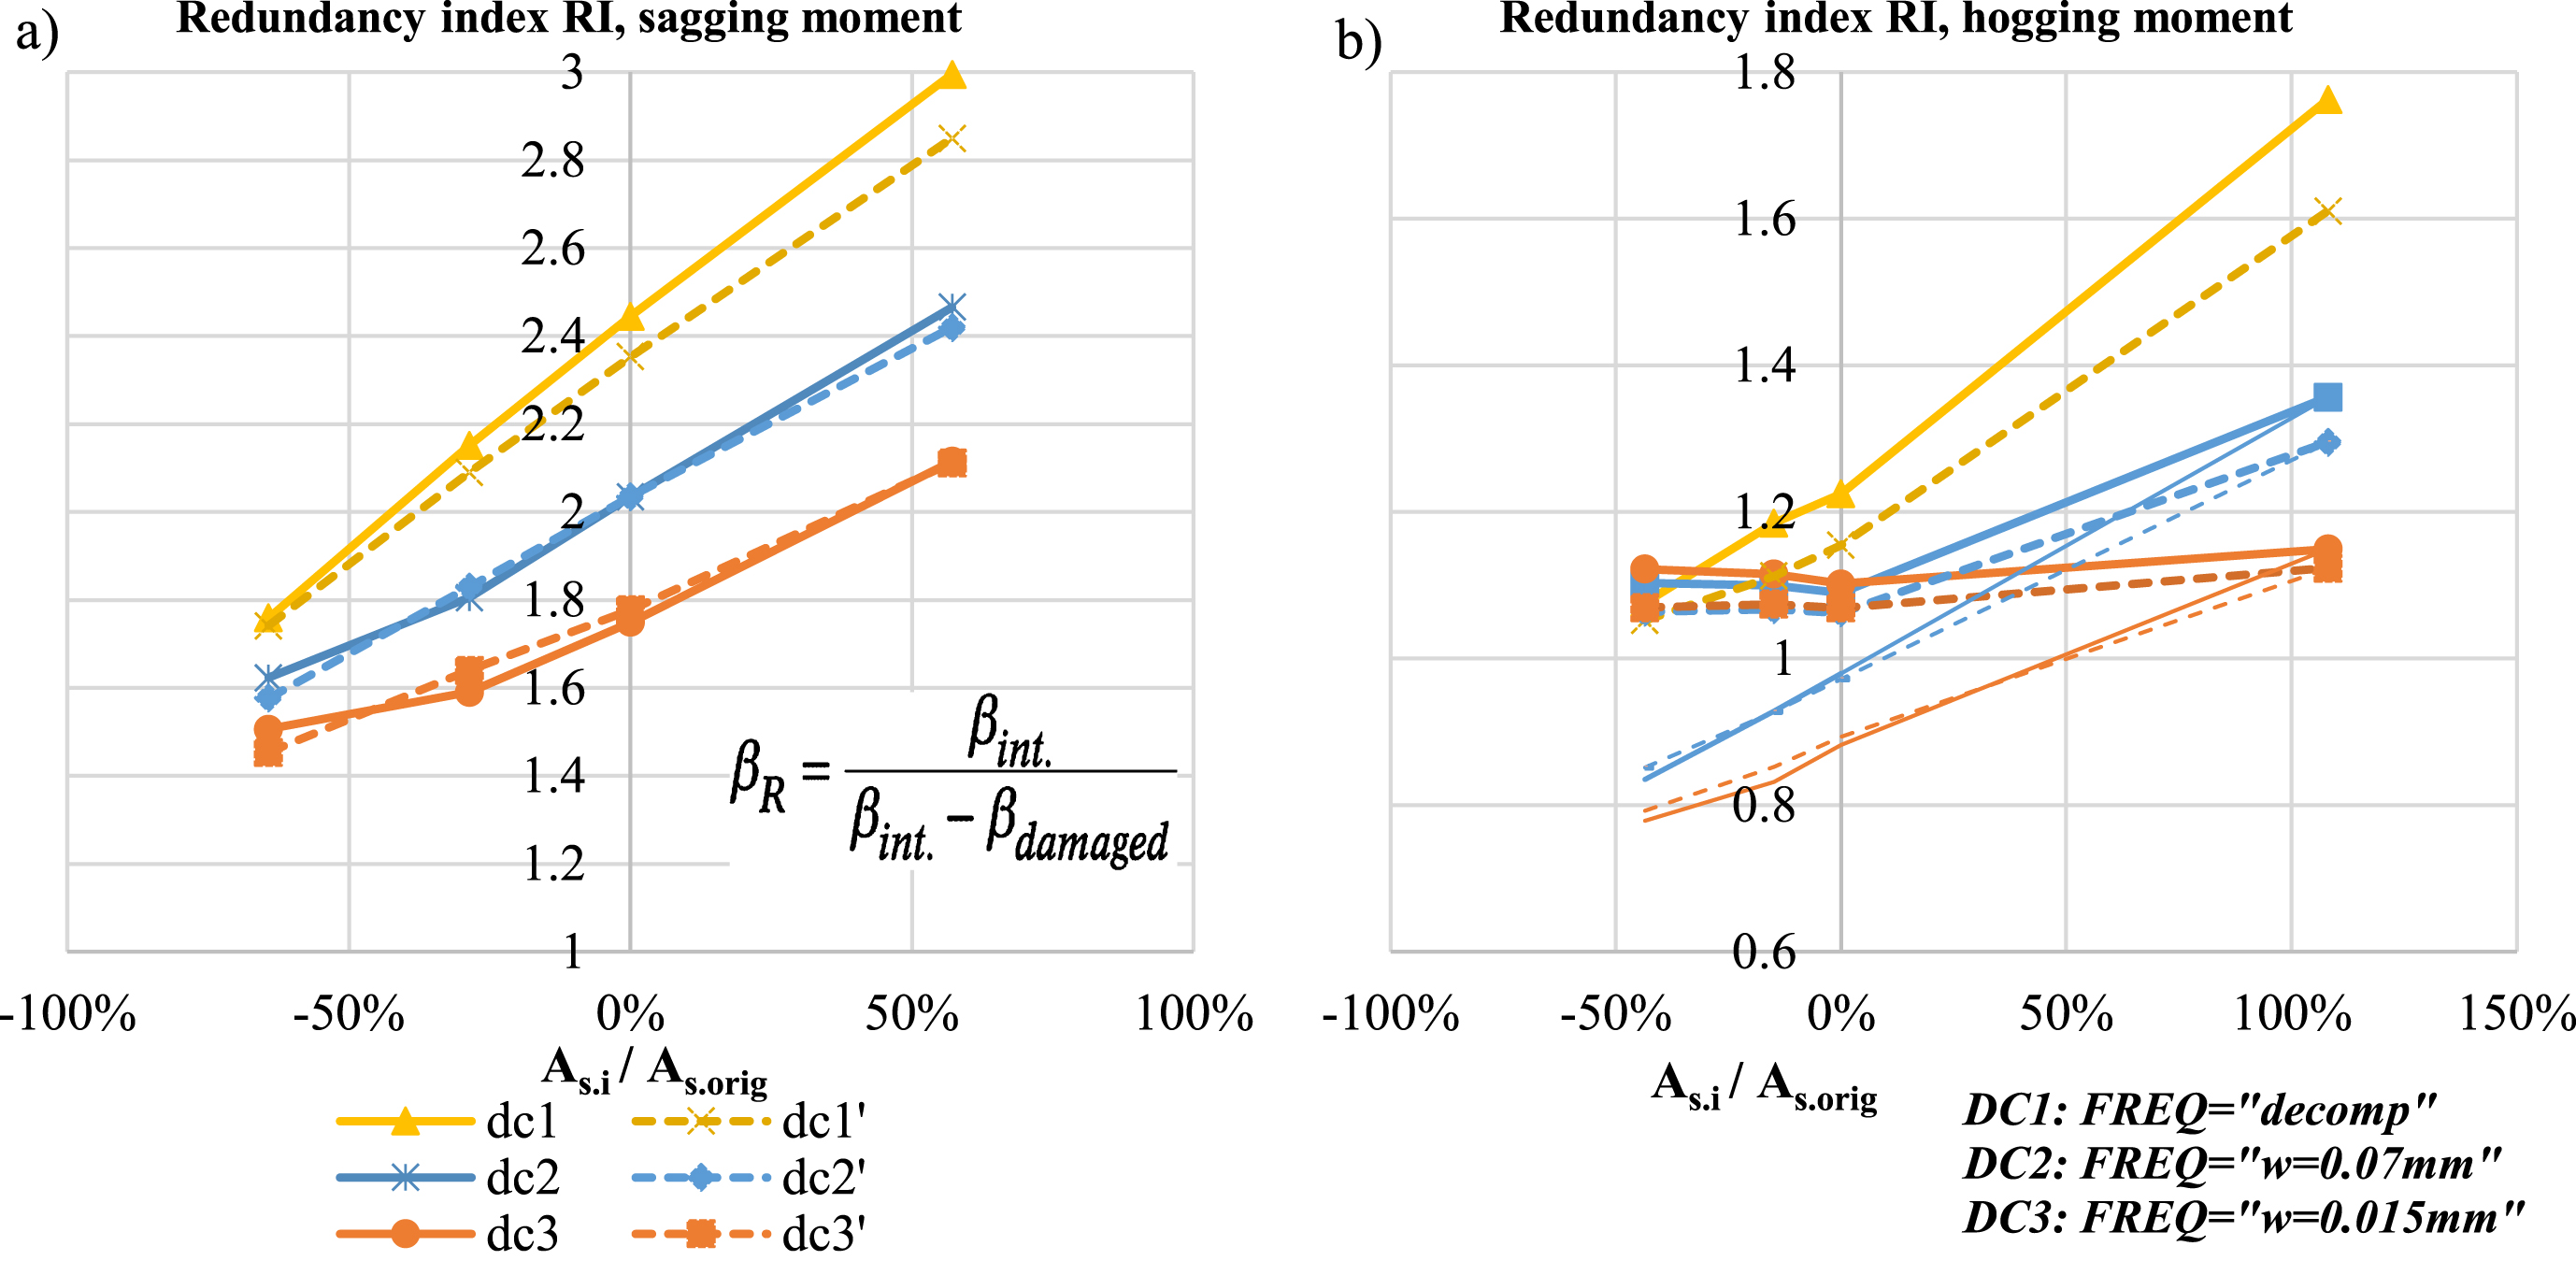
In Fig. 10 the comparison of a redundancy index of case bridges in case of loss of prestressing steel cross-section until cracking in frequent load, with different DCs, reinforcement variations (in comparison to the original design) and prestressing, are presented. In the Fig. 10, the beneficial effect of increase on reinforcement steel can be observed both sagging (Fig. 10-a) and hogging moment (Fig. 10-b). The ‘DC1’ has the highest redundancy due to the safety margin caused by design criteria, which allows no cracking on frequent combination. It is remarkable because usually there is usually a low amount of reinforcement steel in bridges designed with this criterion, while reinforcement steel must be applied on other design cases to achieve the same redundancy level. In Fig. 10 the effect of prestressing losses, taking account of design (dashed line), shows a decreasing effect on redundancy. This can be explained with a lower frequent load in design due to SLS limits and therefore a higher amount of loss of prestressing steel cross-section before cracking. The excess amount of reinforcement steel in DC1 acts as a stand-by redundancy because the stresses in steel in SLS are negligible, while in other DCs the part of the capacity is utilised in SLS due to cracking. In DC2 and DC3, the plateau in hogging moment diagrams in Fig. 10-b (thick lines) can be explained by cut-off effect of determinate ULS, which sets a minimum value for reliability index, while narrow lines in Fig. 10-b are drawn by ignoring the ULS.
Fig. 10
Comparison of redundancy indices of different design cases and reinforcement steel areas for a) sagging, b) hogging.
6.3Determination of cracking moment
The value of the cracking moment of cross-section is highly sensitive to the section modulus of cross-section and tensile strength of concrete. Usually in cracking analysis of design, the tensile strength of concrete is neglected, with it assumed to be 0 MPa. The tensile strength of concrete has a two-way effect on the robustness of a prestressed structure. The utilisation of tensile strength in the original design increases the cracking moment of the cross-section in the design to allow higher SLS loads for the structure while not having an effect on the ultimate capacity of the structure. This decreases the margin between the allowed SLS load and ultimate capacity, which leads to lower reliability ULS.
In case of analysis of robustness of a section in case of tendon loss, the excessive tensile strength of concrete causes the section to tolerate more cross-section loss of prestressing before cracking, leading to a lower reliability level with the lower amount of remaining tendon in the point of cracking. Therefore, an assumption of high tensile strength in this analysis is conservative.
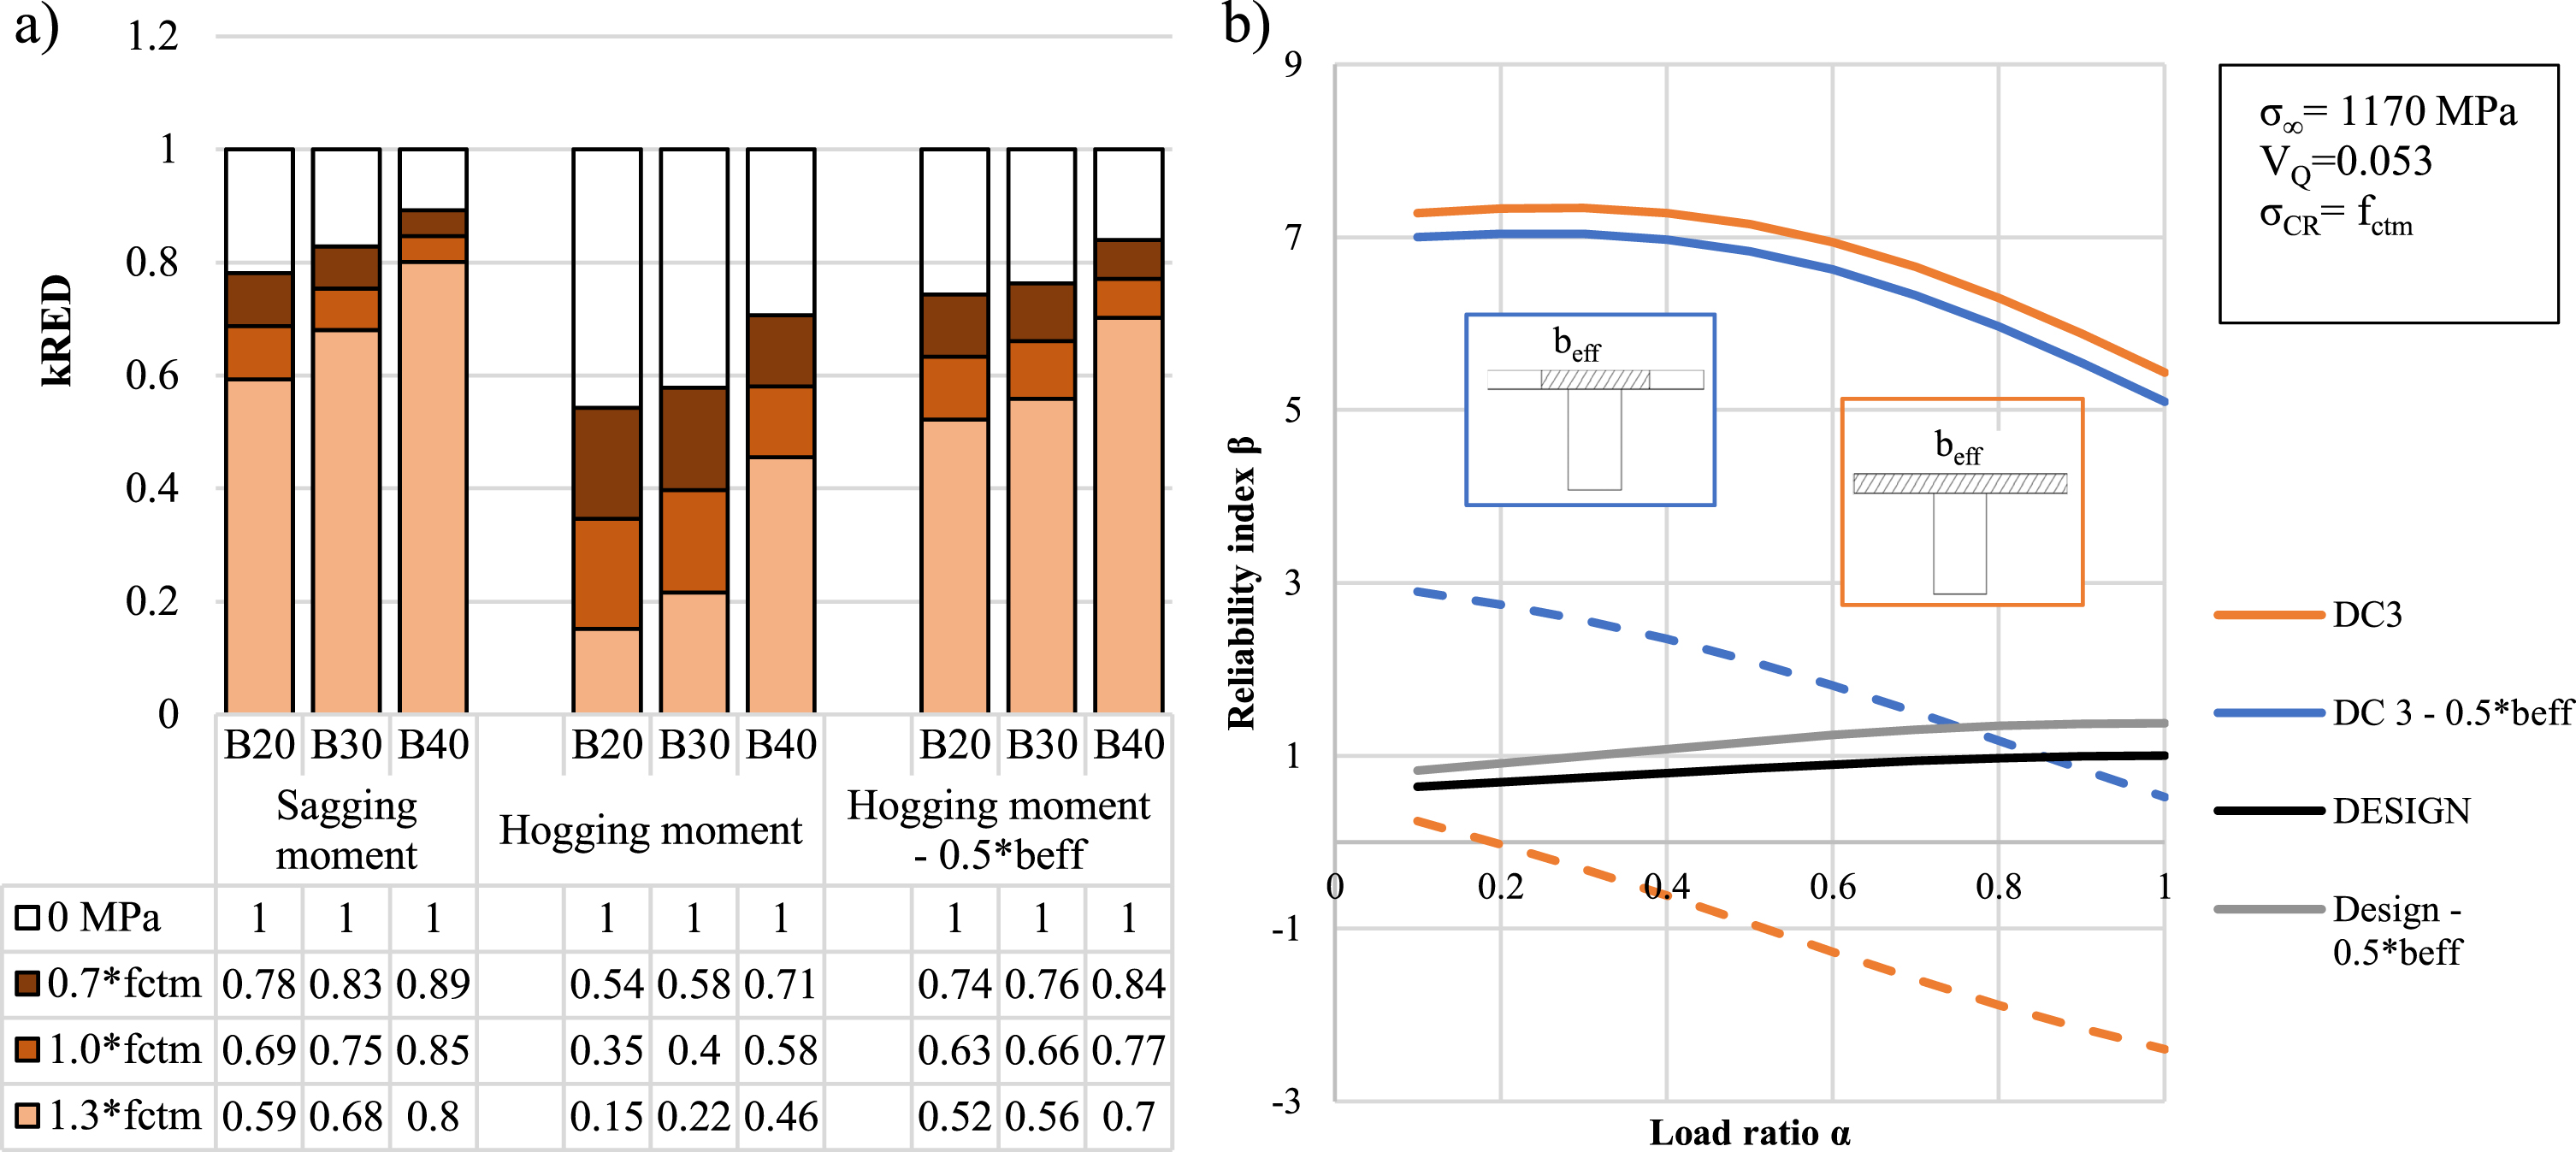
The values of kRED presented in the Table in Fig. 11 are calculated by assuming that in the original design the tensile strength is neglected in SLS. The ratio of loss of prestressing steel cross-section increases as the tensile strength of concrete increases. Also, the effect of the selected efficient width of the T-slab in the middle support hogging moment can be noticed, as shown also in Fig. 11-a and b. If efficient width is selected to extend throughout the whole width of the top slab, 3–4 times the width of a beam, the reduction of steel before cracking on frequent load is higher due to the higher value of top-fibre section modulus in comparison to the selection of limited efficient width, which leads to a decreased reliability level and therefore wide enough effective width should be used in assessment.
Fig. 11
a) The effect of selection of efficient width of top slab in calculation of prestressing steel loss required for cracking and reliability. The values of kRED for case bridges with varying tensile strength of concrete, b) the effect of effective width on reliability of cross section in case of tendon failure.
In this paper the robustness of structure is determined to be the marginal between concrete cracking and yielding of tendon in case of loss of prestressing steel cross section. Therefore, it is important to highlight the effect of different design variables on cracking behaviour of structure. In Table 13 the effects of these variables on allowed SLS loads, cracking moment, ultimate moment, and robustness of structure are presented as a summary.
Table 13
Effects of design variables on SLS loads, cracking moment, ultimate moment, and robustness of structure
| Increase in ... | SLS/Capacity loads | Cracking moment | Ultimate capacity | Robustness |
| ..prestress P0/Ap | ++ | + | 0 | – |
| ..area of reinforcement steel | + | 0 | + | + |
| ..concrete tensile strength | + | ++ | 0 | – |
| ..allowed crack width in SLS | + | 0 | 0 | – |
| ..Beff of top slab in hogging in design | – | ++ | 0 | – |
| .. prestress losses | – | – | 0 | + |
| .. utilisation of tensile strength of concrete in design | + | + | 0 | – |
‘++ significant increase. ‘+ minor increase-. ‘0 does not effect. ‘–decrease.
6.4Probability of failure before cracking in cross section
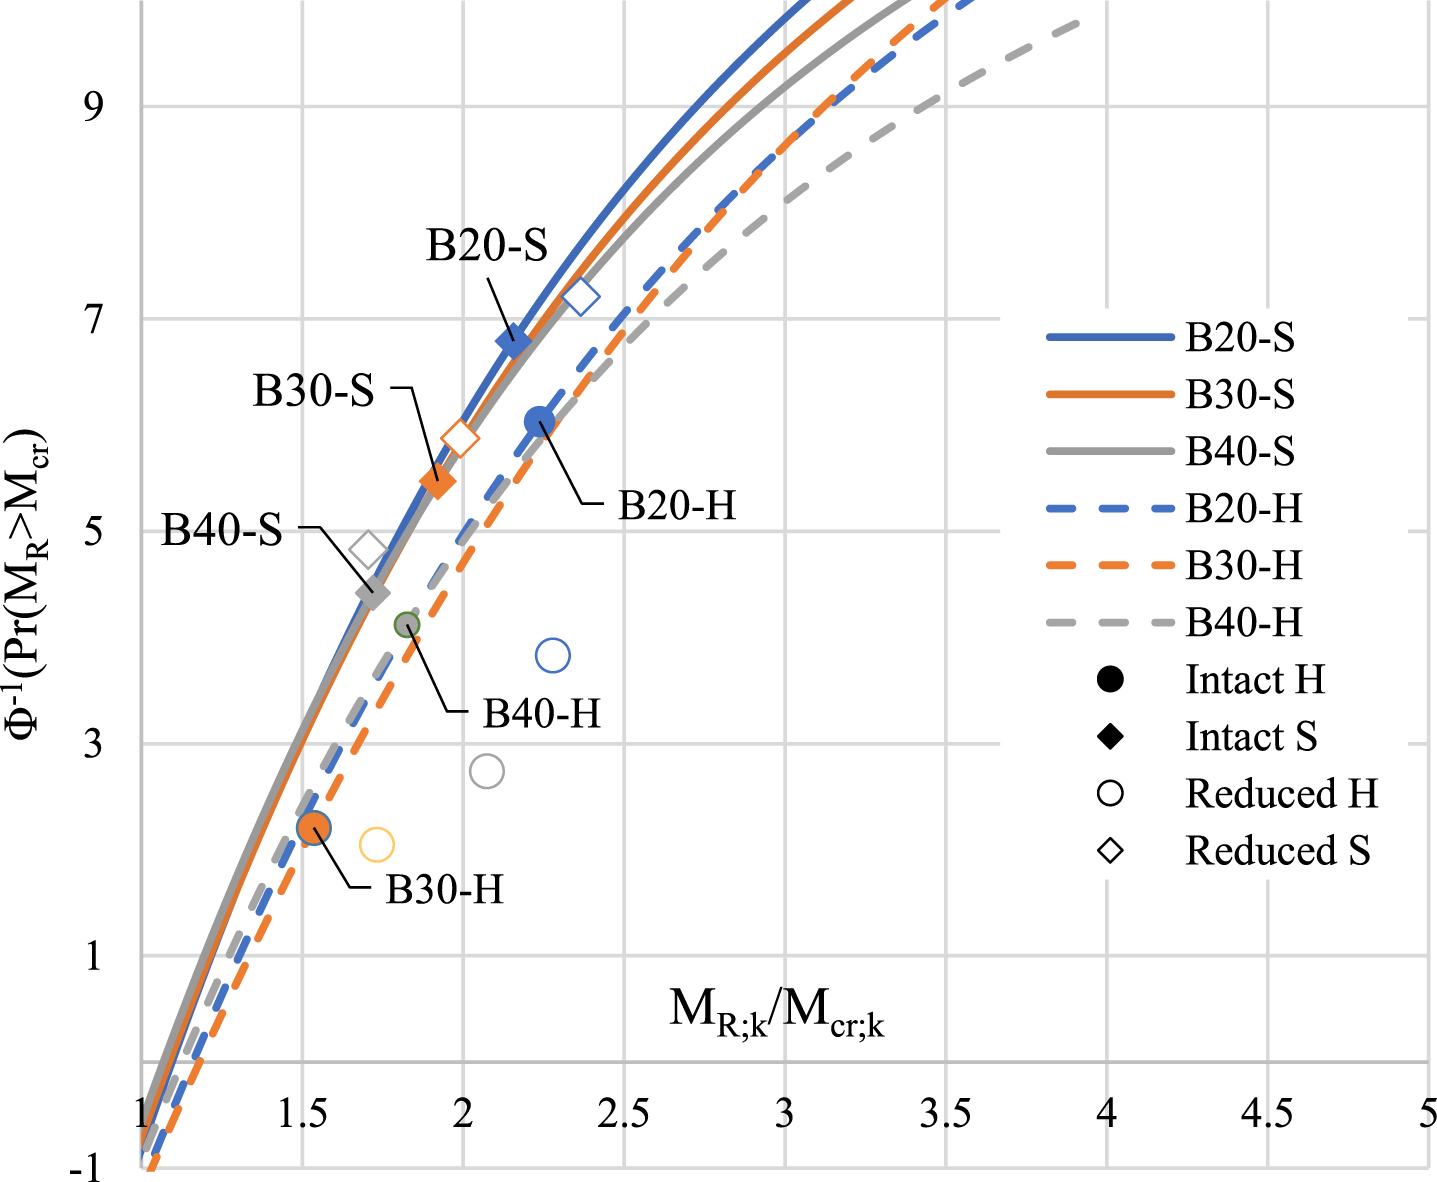
The observed margin from cracking to failure in bridge cases varies between 1.72 and 2.16 and 1.54 and 2.24 in case of sagging and hogging of intact cross-sections, respectively. This corresponds to a reliability index value for failure before cracking (without prior notice) between 2.21 and 6.79 (Pr(MR < Mcr) = 0.013 . . . 5.607*10—12). For decreased amount of prestressing steel according to Table in Fig. 8. (Table with green dashed line), the corresponding reliability indexes have slight increase and vary between 4.8 and 7.2 in case of sagging, while in case of hogging reliability decreases 2.05 and 3.8. This corresponds to Pr(MR < Mcr) = 0.029 ... 0.089, which is rather high probability for the event of failure before cracking.
A probability against failure before cracking is plotted for case bridges in Fig. 12 according to equation (21). Characteristic values of concrete cross-section cracking and ultimate moments are calculated with intact cross section and in the case of a cross-sections with loss in prestressing steel area by using the k-values shown in Fig. 8 a-d, with legends next to green dashed lines. The results calculated with reduced prestressing steel area are presented with hollow markers in Fig. 12, with only minor effect on the ratio, MR,k/Mcr,k, in comparison to intact cross section. In fact, the loss of prestressing steel area reduces cracking moment more than ultimate moment, increasing the ratio, MR,k/Mcr,k. With loss of prestressing steel area and prestress, a relative portion of cracking resistance of concrete increases, which leads the increase in deviation of Mcr, this applies especially in case of greater reductions in prestressing steel area and hogging moment due to the higher section modulus in comparison to sagging.
Fig. 12
Standardised probability for crack before failure behaviour for intact cross-section and cross section with reduced prestressing steel S = sagging, H = hogging.
7Conclusions
• This study investigates the impact of tendon area loss on crack before failure behaviour. Case studies demonstrate that even with tendon loss, the ratio between failure and cracking moment remains around 1.5 indicating adequate crack before failure behaviour as typical ratio between frequent and rare loads are in order of 1.1 and 1.3. However, in worst cases with varied structure the MR/Mcr-ratio falls below 1.3 which may increase the risk of inadequate crack-before-failure behaviour.
• The original design criteria of a post-tensioned bridge can significantly affect its robustness in the event of tendon failure. In some cases, the design in SLS provides excessive reliability. The limits of crack width and decompression, and limited prestressing in strands (specified by manufacturer) can increase the reliability and robustness of a bridge in ULS, even in the event of tendon failure. Bridges with minimal reinforcement steel are typically designed with stricter SLS criteria, which is beneficial for robustness. However, if live loads affecting the bridge increase and cause cracking which is often permitted in SLS, the safety margin and redundancy against tendon loss are significantly reduced.
• In the calculation method for assessing the safety of PTC cross-sections with tendon cross-section loss, it was found that the design of the structure is more influenced by the SLS limits than the ULS limits, as the margin between SLS and ULS is wider. This paper assesses the effect of different design variables on the robustness of a structure in case of loss of tendon area. The results are presented in a Table 13 that can be used to identify suspicious structures in a bridge stock population. The Table 13 can also be used to determine variables that should be overestimated rather than underestimated, as indicated by the (-) in the robustness column. The analysis method described earlier should be used.
• The ultimate capacity of a PTC cross-section is significantly reduced by the loss of the prestressing steel area. However, the ratio between ultimate moment and cracking moment in studied structures is only slightly affected in structures with different variable parameters. The loss of tendon area has minor impact on the MR/MCR ratio, while other characteristics of the structure may have a more significant effect.
• In an indeterminate structure the constraint forces can cause cracking in SLS. However, a portion of these forces vanish in ULS due to reduced stiffness of the beam. This increases the margin between cracking and ultimate limit state of the structure and increases robustness when external loads affect it.
7.1Further study
In this paper the reliability level achieved with assessment method is assessed. It assumable that the target reliability level and safety factors of the method needs to be calibrated according to perception of the national authorities of bridge management.
In this study elements affecting on robustness of post-tensioned bridge in case of tendon loss are assessed. In further study an assessment for broader bridge stock would be beneficial to find a population of bridges with less robust cross sections based on design, amount of reinforcement and prestressing.
The method presented in literature is for assessment at cross section level, however the post-tensioned bridges are usually indeterminate. This leads the need to assess the robustness and reliability also at system level, which provides better understanding on safety of existing post-tensioned bridges.
Conflict of interest
The authors report there are no competing interests to declare.
Data availability statement
The data used in this paper is available from authors on request.
Author contributions
Conceptualization: A.L, O.A; Data curation: O.A.; Formal analysis: O.A.; Investigation: O.A.; Methodology: O.A., A.L.; Writing original draft: O.A.; Validation: A.L.; Supervision: A.L.; Funding acquisition: A.L. Software: O.A.
Funding
The authors report no funding.
References
[1] | Burdet F Amount of Prestressing Based on Serviceability Requirements, Presented at the IABSE Symposium and Annual Meetings. Rio de Janeiro: Structural Engineering International. 1999. |
[2] | Cavell DG , Waldron P . Residual strength model for deteriorating post-tensioned concrete bridges, Computers and Structures, (2001) ;79: (4):361–373.doi: 10.1016/S0045-7949(00)00150-4. |
[3] | Eichinger EM , Petraschek T , Kollegger J . Ultimate strength ofdamaged post-tensioning tendons, Structural Concrete: Journal ofthe FIB, (2003) ;4: (3):117–124.doi: 10.1680/stco.2003.4.3.117. |
[4] | Nürnberger U Corrosion induced failures of prestressing steel. Otto-Graf —Journal. 2002;13. |
[5] | Windisch A Safety to brittle failure in prestressed concrete structures with bond. (Department of Reinforced Concrete Structures, Budapest technical University). 1970. |
[6] | Lingemann J Zum Ankündigungsverhalten von älterenBrückenbauwerken bei Spannstahlausfällen infolge von Spannungsrisskorrosion. 2010. |
[7] | Lingemann K , Zilch J Probability Considerations on the Behaviour of Older Prestressed Concrete Bridges in Case of Tendon Failures.pdf, in Proceedings of 6th probabilistic workshop, 2008, p. 16. |
[8] | Podroužek J , Strauss A , Bergmeister K . Robustness-basedperformance assessment of a prestressed concrete bridge, StructuralConcrete, (2014) ;15: (2):248–257.doi: 10.1002/suco.201300002. |
[9] | He J , Xin H , Wang Y , Correia JAFO . Effect of temperature loading on the performance of a PC bridge in Oklahoma: Reliability analysis, Structures (2021) ;34: :51–60.doi: 10.1016/j.istruc.2021.06.099. |
[10] | Cavaco ES , Casas JR , Neves LAC , Huespe AE . Robustness of corroded reinforced concrete structures –a structural performance approach, Structure and Infrastructure Engineering, (2013) ;9: (1):42–58.doi: 10.1080/15732479.2010.515597. |
[11] | Frangopol D , Curley J . EFFECTS OF DAMAGE AND REDUNDANCY ON STRUCTURAL RELIABILITY 3 By Dan M, Frangopol, 1 M, ASCE, and James P. Curley 2. Journal of Structural Engineering, (1987) ;113: (7):1533–1549. |
[12] | Nordic Committee on Building Regulations: Recommendations for loading and safety regulations for structural design. NKB report no. 36. |
[13] | fib Bulletin No:80. Partial safety factor methods for existing concrete structures. Fib, Lausanne, 2016. |
[14] | CSA, Existing Bridge Evaluation to CSA standard CAN/CSA-S6-88, design of Highway Bridges. Supplement No 1. CSA, Rexdale, Toronto, Canada, 1990. |
[15] | CEN,EN1992-1 Eurocode 2: Design of concrete structures. 2010. |
[16] | CEN, EN 1990-1 Eurocode: Basis of Structural design. 2010. |
[17] | Nowak AS , Collins K Reliability of Structures. Boston: McGraw-Hill, 2000. |
[18] | CEN, EN 1991-5 Eurocode 1: Actions on structures –Part 1-5: General actions –Thermal actions. 2010. |
[19] | He J , Xin H , Wang Y , Correia JAFO . Effect of temperature loading on the performance of a prestressed concrete bridge in Oklahoma: Probabilistic modelling, Structures- (2021) ;34: (August):1429–1442.doi: 10.1016/j.istruc.2021.08.007. |
[20] | Asp O , Laaksonen A . Traffic Load Model Calibration and Comparison to Evolving Traffic Loads in 2014-2018, The Baltic Journal of Road and Bridge Engineering, (2023) ;18: (3):139–168.doi: 10.7250/bjrbe.2023-18.612. |
[21] | Ang AHS , Tang WH Probability Concepts in engineering, Planning and design –Volume II: Decision, Risk and Reliability. John Wiley & Sons, Inc., 1984. |
[22] | Collins M , Mitchell D Prestressed Concrete Structures. Englewood Cliffs (NJ, USA): Prentice Hall, 1991. |
[23] | Nowak AS , Rakoczy AM , Szeliga EK Revised statistical resistance models for R / C structural components Andy Scanlon Symposium on Serviceability and Safety of Concrete Structures : From Research to Practice Editors. Andy Scanlon Symposium on Serviceability and Safety of Concrete Structures: From Research to Practice, no. June, pp. 1-16, 2013. |
[24] | , Martí Vargas JR . Reliability-based sensitivity analysis for prestressed concrete girder bridges. PCI Journal, (2014) ;59: (4):129–130. |
[25] | Wisniewski D , Casas JR , Henriques AA , Cruz PJS . Probability-based assessment of existing concrete bridges-stochastic resistance models and applications, Structural Engineering International: Journal of the International Association for Bridge and Structural Engineering (IABSE), (2009) ;19: (2):203–210.doi: 10.2749/101686609788220268. |


