
Investigating the effect of span-length and earthquake directivity on the response of multi-span continuous girder bridges isolated by friction bearings
Abstract
Bridges are of particular importance among the structures built by human beings. Therefore, the desired seismic behaviour of this type of structures during the earthquake is of utmost importance. The friction pendulum system is considered as a type of sliding isolator in which sliding motion and recursive force are combined by isolator’s geometry. The effects of the earthquake directivity and the span-length of two multi-span continuous steel girder bridges were investigated in this study. The base shear created in the bridges depends on the bridge span, so that more base shear is applied on the bridge with longer spans. In both bridges, the base shear under records of a side with directivity feature was more than the other side. Deck displacement in the bridges in the side with directivity feature was significantly larger than the other side. This increase in structural displacement can lead to the pounding of the bridge deck on abutments. For this reason, it seems necessary to embed the appropriate expansion joints considering the effect of directivity of the earthquakes.
1Introduction
Bridges are considered as an important part of the transportation system and their continuous performance is expected during the strong ground motions. Bridges, like other structures must have the ability to withstand earthquake forces. One of the common methods to achieve this goal, is to use seismic isolators that are used on top of the bridges’ piers and abutments. Among various types of bridges, multi-span continuous steel girder bridges are considered as the most vulnerable type [1]. Hence, this study has investigated multi-span continuous steel girder bridges. The most effective parameter in determining the seismic weight of bridges is the length of the deck span. Hence, the importance of examining how the isolated bridges operate with different span lengths is of utmost importance. In addition, in seismically active regions, there is a probability of occurrence of earthquakes with directivity feature that can increase the earthquake force. Therefore, study of the performance of isolated bridges due to the earthquakes with directivity feature is also undeniable. In general, there are three strategies for coping with earthquake forces. Increasing the strength and stiffness of the structural components is considered as the first solution. This method will be very costly and expensive, and in addition, it should be noted that excessive increase in the strength and stiffness of the structure can lead to increase forces in the structure. Another solution is to use the nonlinear capacity of the members and the ductility of the structural elements. The use of structural elements ductility requires providing stringent seismic design criteria. On the other hand, a structure that utilizes its nonlinear ductility capacity under a strong ground motion, after an earthquake is a structure in which plastic hinges and permanent deformations have occurred and re-use of that structure could be dangerous. Seismic isolation is considered as another solution that offers a different purpose compared to the two methods mentioned earlier. In contrast to the previous two methods that emphasized the increase in capacity, this approach focuses on reducing the demand for structures. We cannot prevent an earthquake, but we can reduce the demand for it. The use of seismic isolators prevents the movement of earth to structure and as a result, reduces the amount of damage to the structure significantly.
Thjorsa Bridge is an example of successful isolated bridges under the influence of the near-field earthquake, which was built in Iceland in 1950. This bridge was isolated by lead rubber bearing (LRB) isolators. The accelerograms installed on this bridge recorded a significant acceleration of 0.84 g, but Thjorsa’s bridge was not damaged during this earthquake [2]. In 2008, another isolated bridge in Iceland, Oseyrar, with a length of 370-meters, with a continuous and pre-stressed deck was damaged by a near-field earthquake. The bridge was subjected to two earthquakes with magnitudes of 5.8 and 6.1 richter in 2008 [3]. A bridge with three-span box-shaped girders, which the piers of this bridge were isolated by LRB isolators and abutments of this bridge by a combination of friction and elastomeric isolators, was evaluated under near-field earthquakes, and it was shown that if the effective period of the isolator is close to the pulse period, structural responses are significantly increased [4]. The nonlinear dynamical response of a three-span continuous steel bridge was compared in two states, including with isolator and without isolator and showed that the decrease in the base shear in the state in which the structure is isolated, is less for the near-field earthquakes than the far-field earthquakes [5]. In addition to the studies related to bridges isolated by LRB isolators, the effect of modeling parameters on the performance of multi-span bridges isolated by a friction pendulum system, which has continuous steel girders, was investigated [6].
2Determining friction pendulum system (FPS) specifications
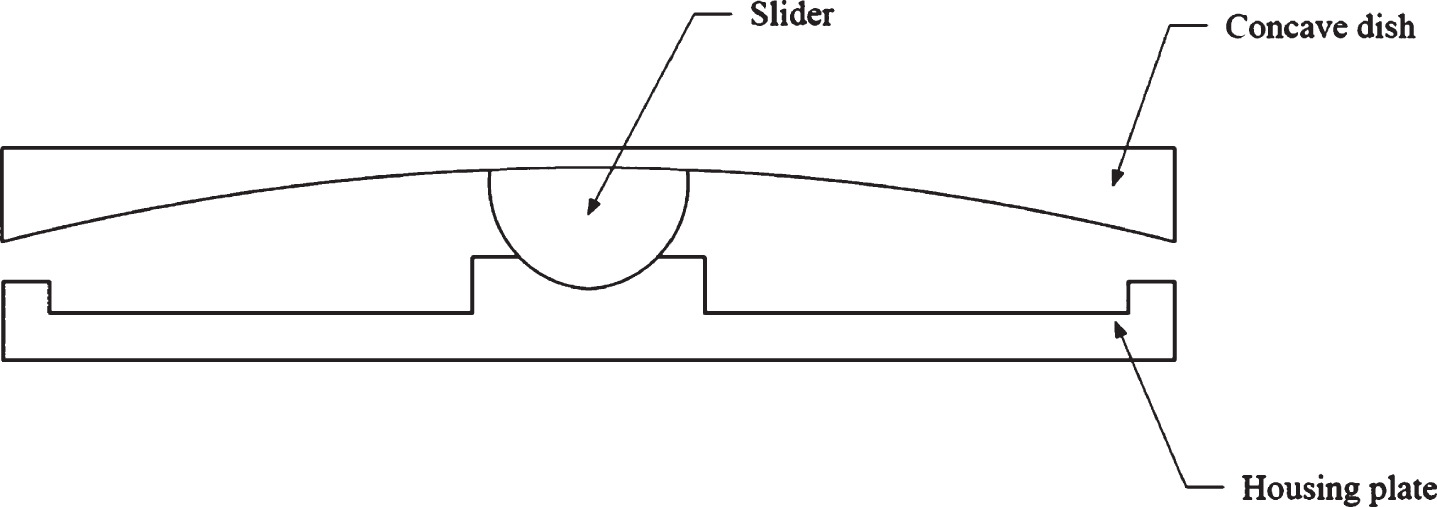
The seismic isolation separates the structure from the horizontal components of the earthquake using elements that have low stiffness [7]. isolators can be classified into two general categories of sliding and elastomeric isolators [8]. The FPS isolator is considered as a sliding isolator, and was first used to retrofit an apartment in California in 1989 [7]. In friction pendulum system, sliding motion and recursive force are combined with isolator’s geometry. This isolator is used for seismic isolation of a wide range of structures, including tanks, buildings and bridges. The FPS consists of a concave stainless steel dish, a slider and a plate [9] (Fig. 1). Assuming that the radius of the FPS isolator is significantly larger than its horizontal displacement, the force-displacement response of the FPS can be shown by Equation (1) [10]. Where, V is the horizontal force, W is the gravity load, μ is the friction coefficient, R is the isolator radius, u the horizontal displacement of the isolator, and sgn (
(1)
Fig.1
FPS isolator components.
According to the Equation (1), Independence of the frequency specification of the isolated structure to mass can be proven. In order to better understand this issue, we obtain the equation of motion in a non-damping state for obtaining the natural frequency of the isolated structure ωn, Equation (2). Then according to the Equation (3), it can be observed that ωn is independent of mass but depends on the radius of the isolator. The FPS radius determines the stiffness and period of the isolated structure [7]. In these equations, m is the mass of the structure,
(2)
(3)
The coefficient of friction is considered by the Equation (4) [11]. In this equation, fmax is the maximum friction coefficient, Df is the difference between the maximum coefficient of friction and minimum coefficient of friction fmin and a (Rate parameter) is a constant value. After evaluating the bridges isolated by FPS under the influence of near-field earthquakes, it has been observed that there is an optimum amount of coefficient of friction for FPS, which simultaneously reduces the amount of displacement of the isolator and acceleration applied to the superstructure. The friction coefficient between 0.07 and 0.19 is proposed for isolated bridges [12].
(4)
3Modeling
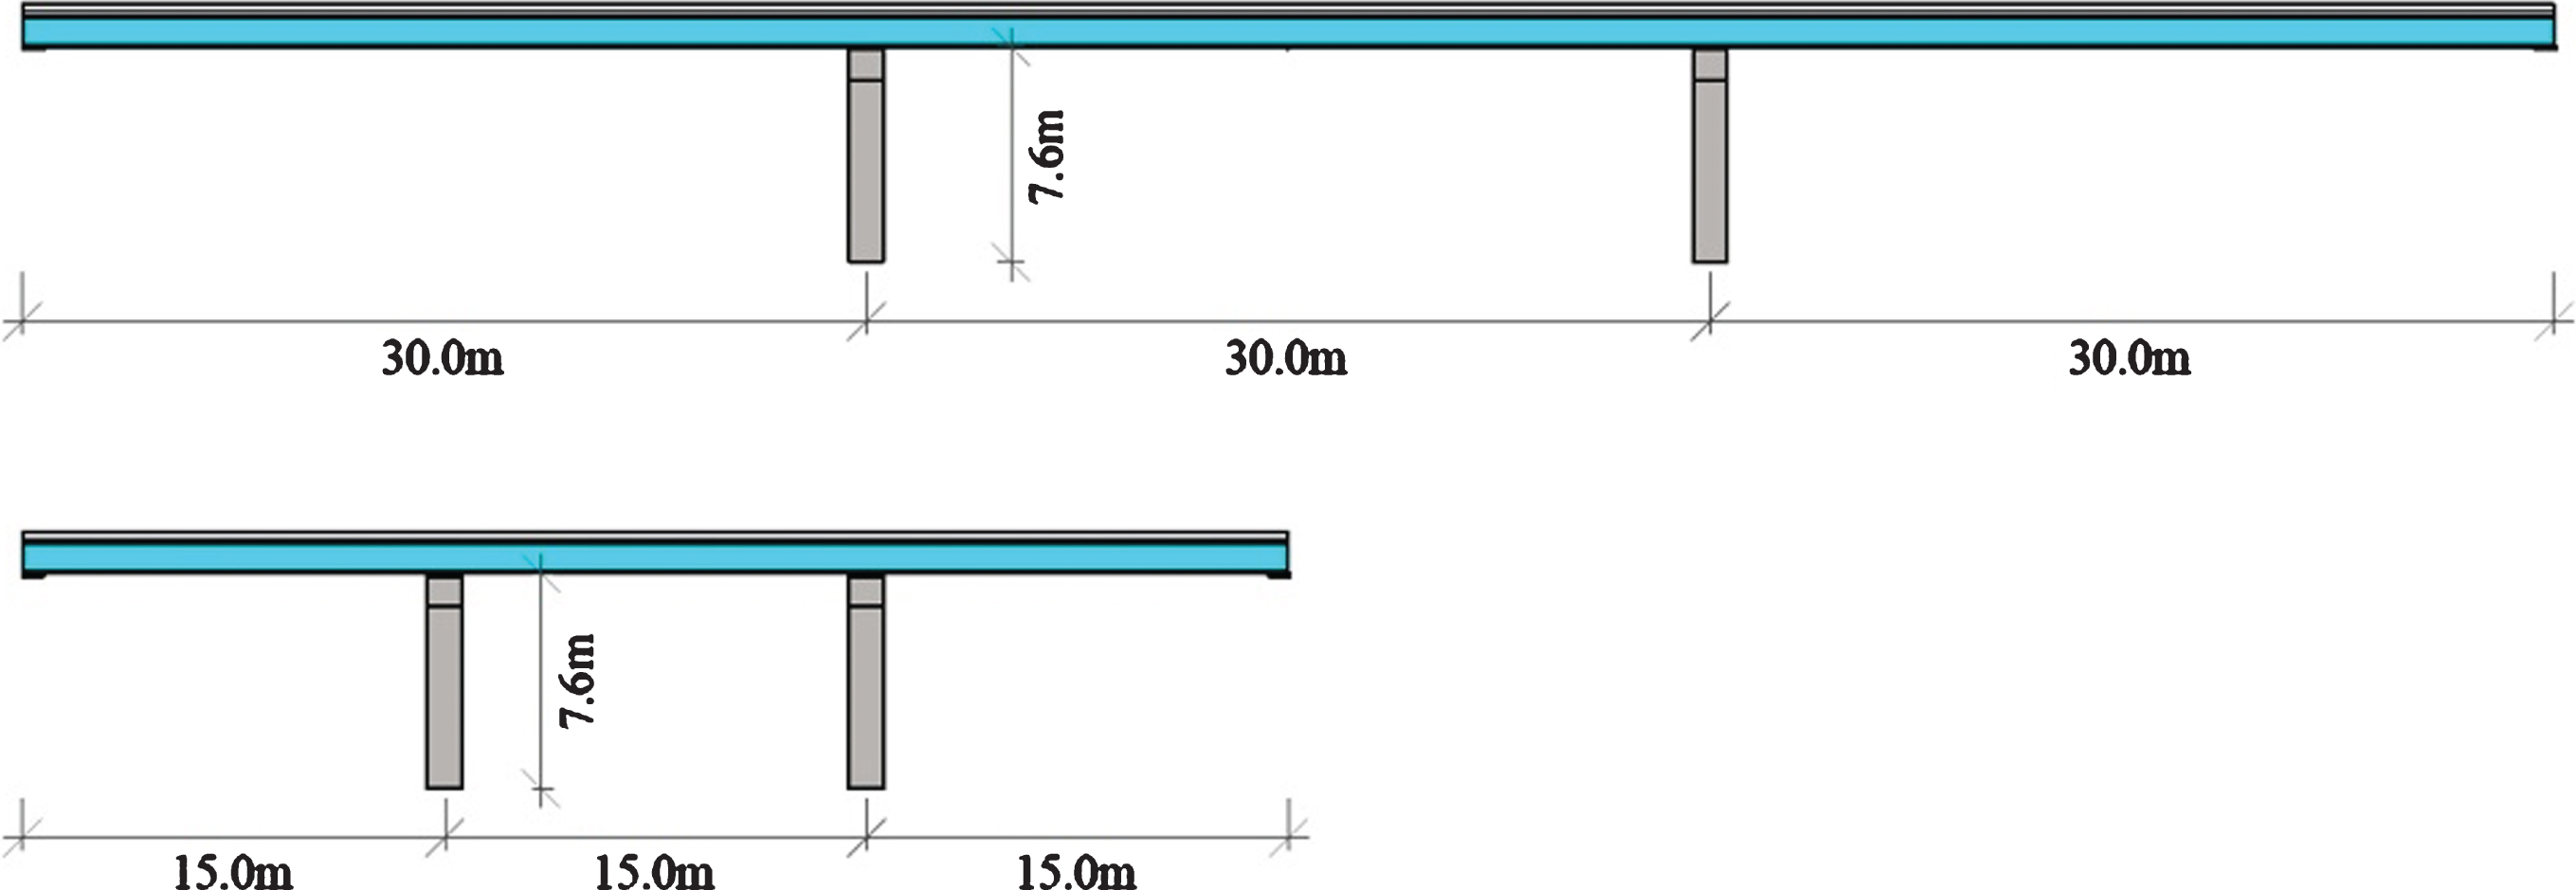
In order to investigate the effect of span-length of the bridge on the response of bridges isolated by FPS system, two multi-span continuous steel girder bridges were modeled with different dimensions but identical specifications, such as identical materials, sections and slab’s height. The first bridge and the second bridge have three 30-meters and 15-meters continuous span-length respectively (Fig. 2).
Fig.2
Transverse view of the studied bridges.
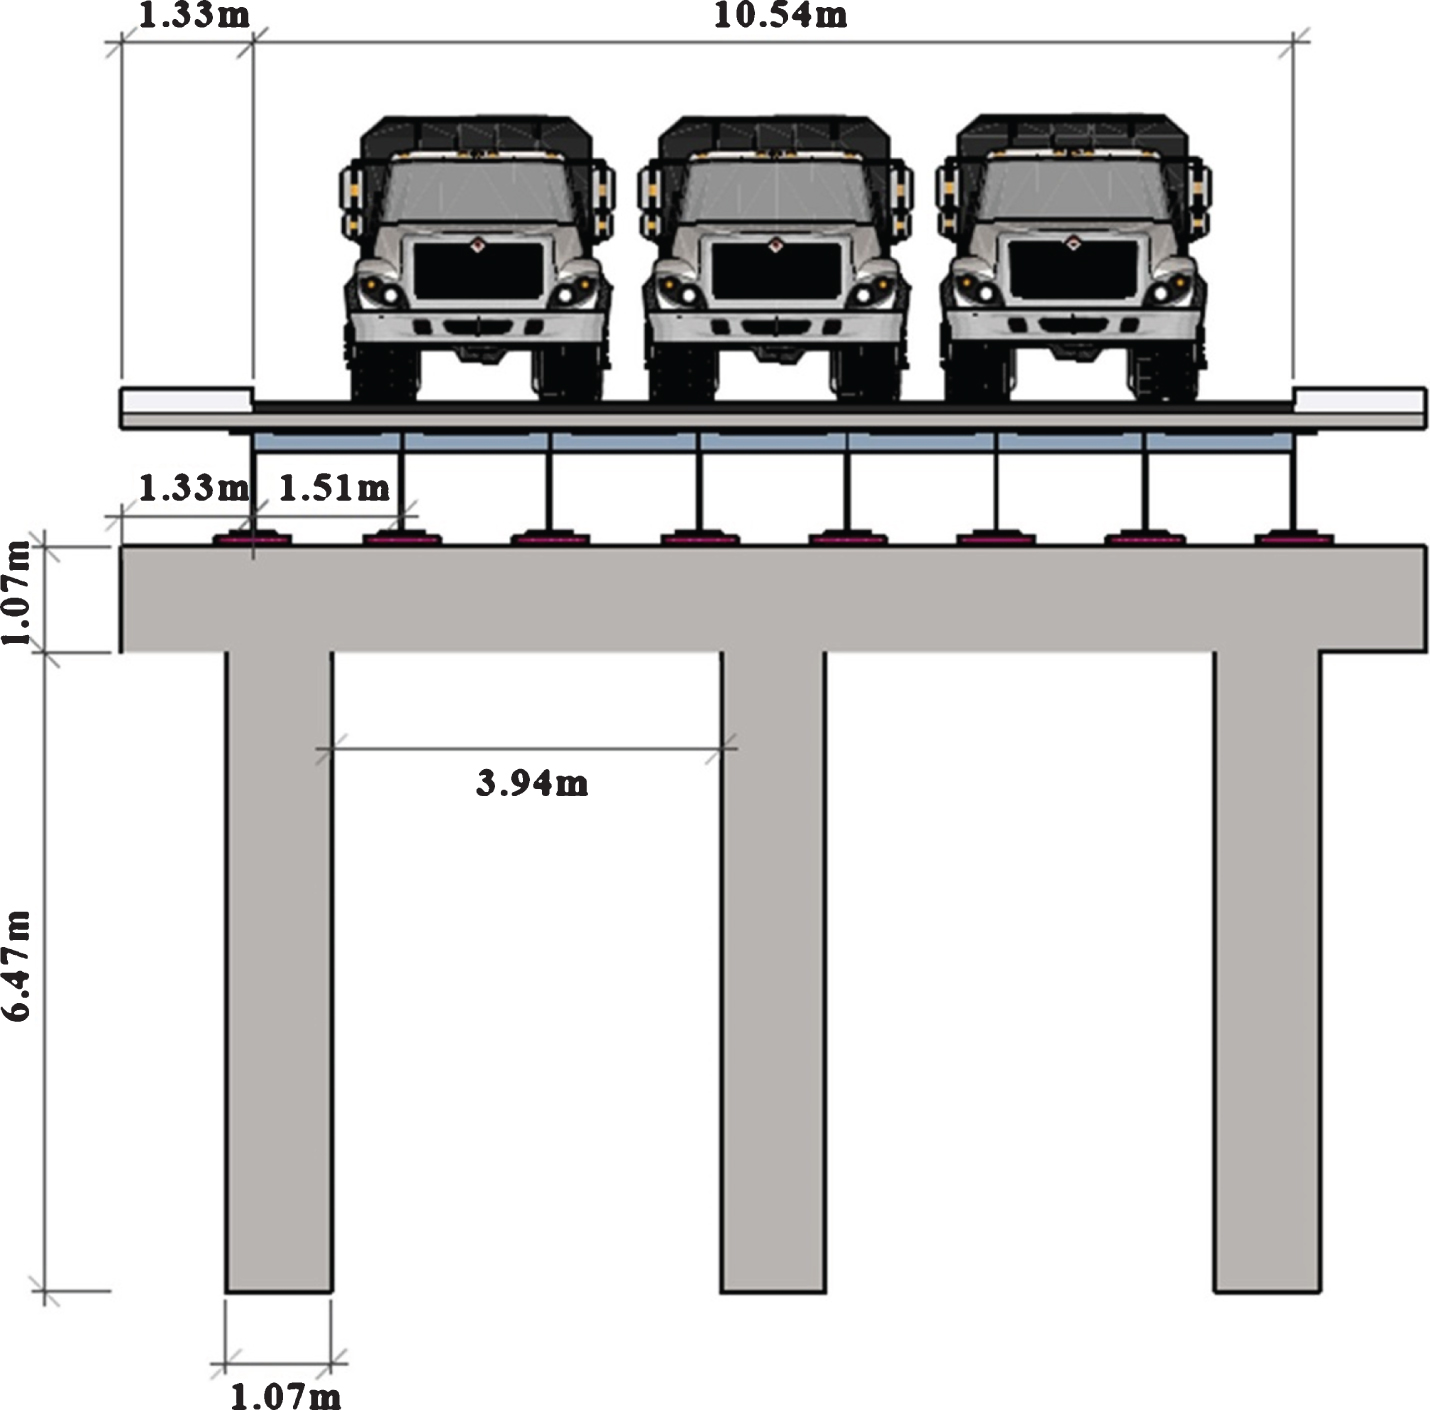
The gravity loads applied on the bridges are dead loads, including the weight of the structural and non-structural elements, the sidewalk load of 2 kN/m2, and the moving load of three 400-kN trucks with a length of 10-meters, which there is a 3-meters of free space on the front and back of the truck and in the rest of the length of the lane the uniformity load is set to 15 kN/m [13]. The maximum number of moving loads along the width is equal to the absolute value of the width of the roadway divided by a standard width of 3-meters. The width of the roadway is 10.54-meters, thus three lanes shall be considered. The longitudinal section of the bridges is shown in Fig. 3.
Fig.3
Longitudinal section of the considered bridges.
The slab has a thickness of 0.25-meters. The piers and Cap-beam’s cross sections were selected according to Fig. 4. Cross sections of bridges’ continuous girders were also selected according to the limitations of the AASHTO [14] (Fig. 5). The modeled bridges have eight continuous steel girders, and a total of 32 FPS isolators were used in the abutments and bents. The FPS isolator used in the studied structure is a single-friction pendulum bearing, which has a radius of curvature of 1.5-meters and the parameter a, is 50 second/meters and fmax/fmin is equal to 3 [15]. The periods of the bridges were obtained, so that the two main modes for the Span30m bridge was 2.45 seconds and for Span15m was 2.44 seconds.
Fig.4
The cross section used in the middle piers and cap-beams.
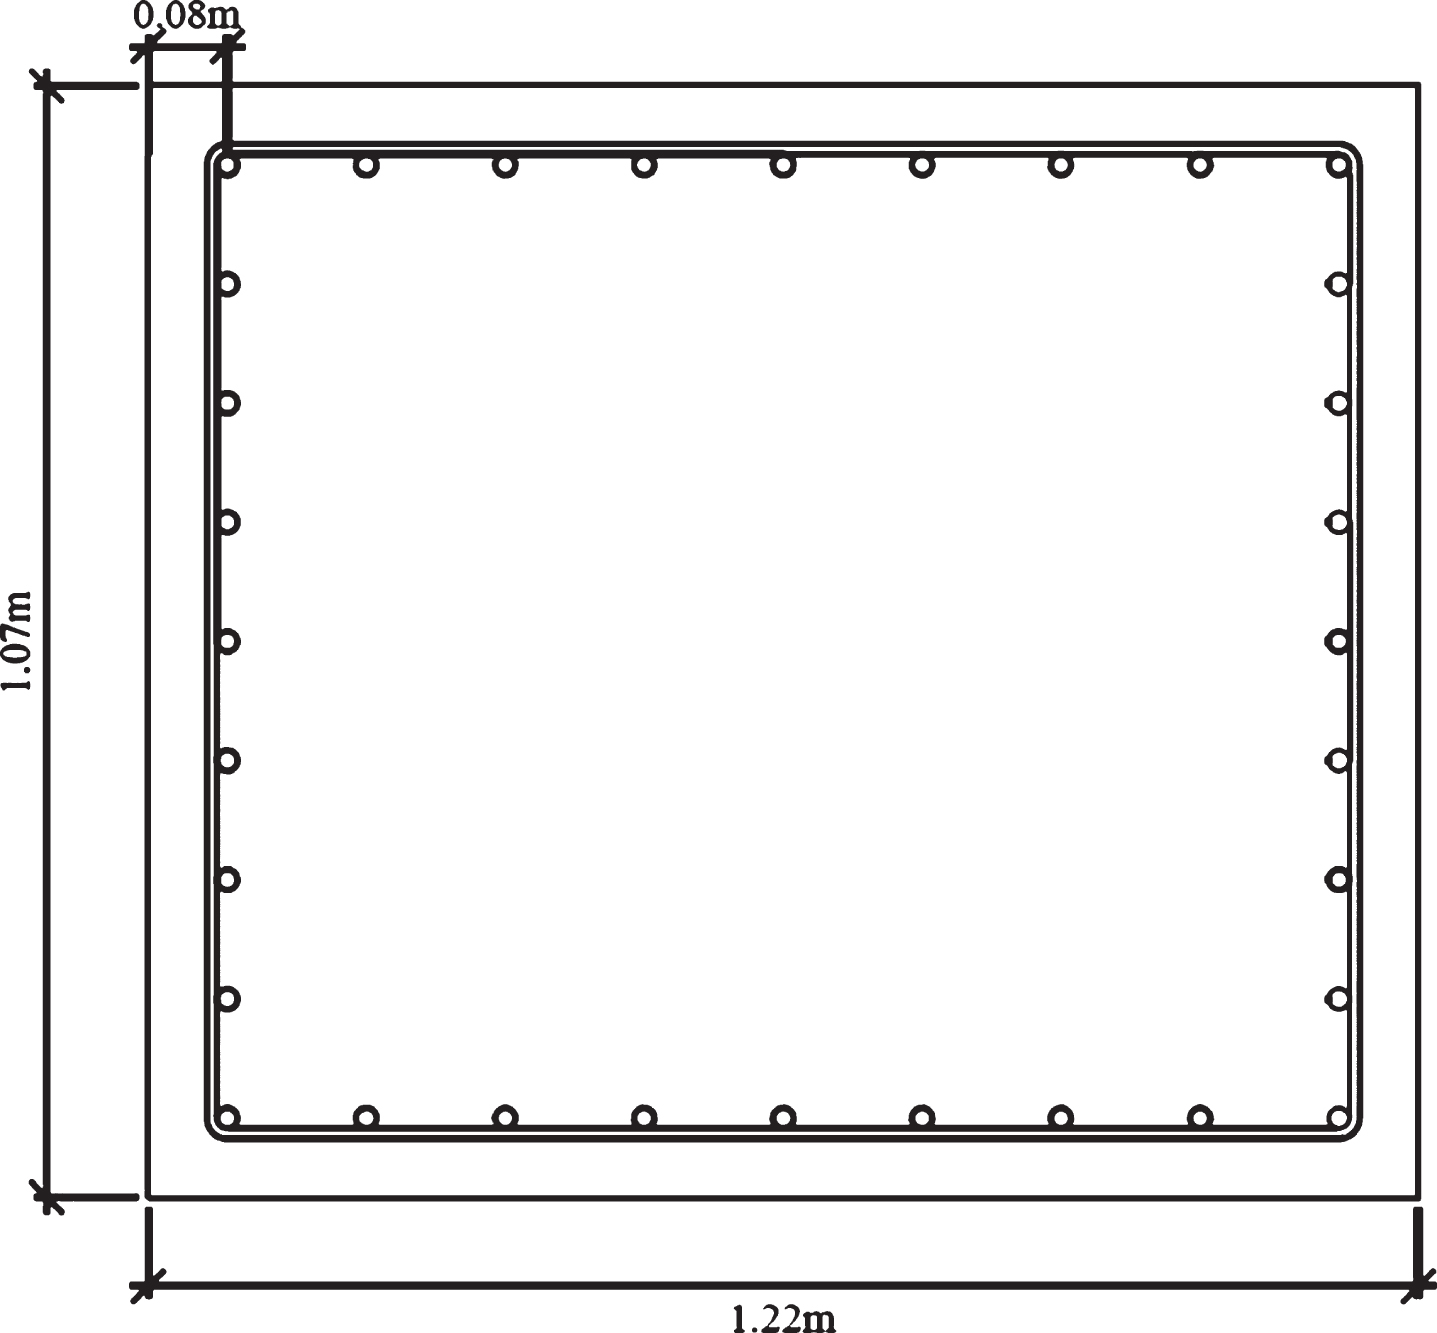
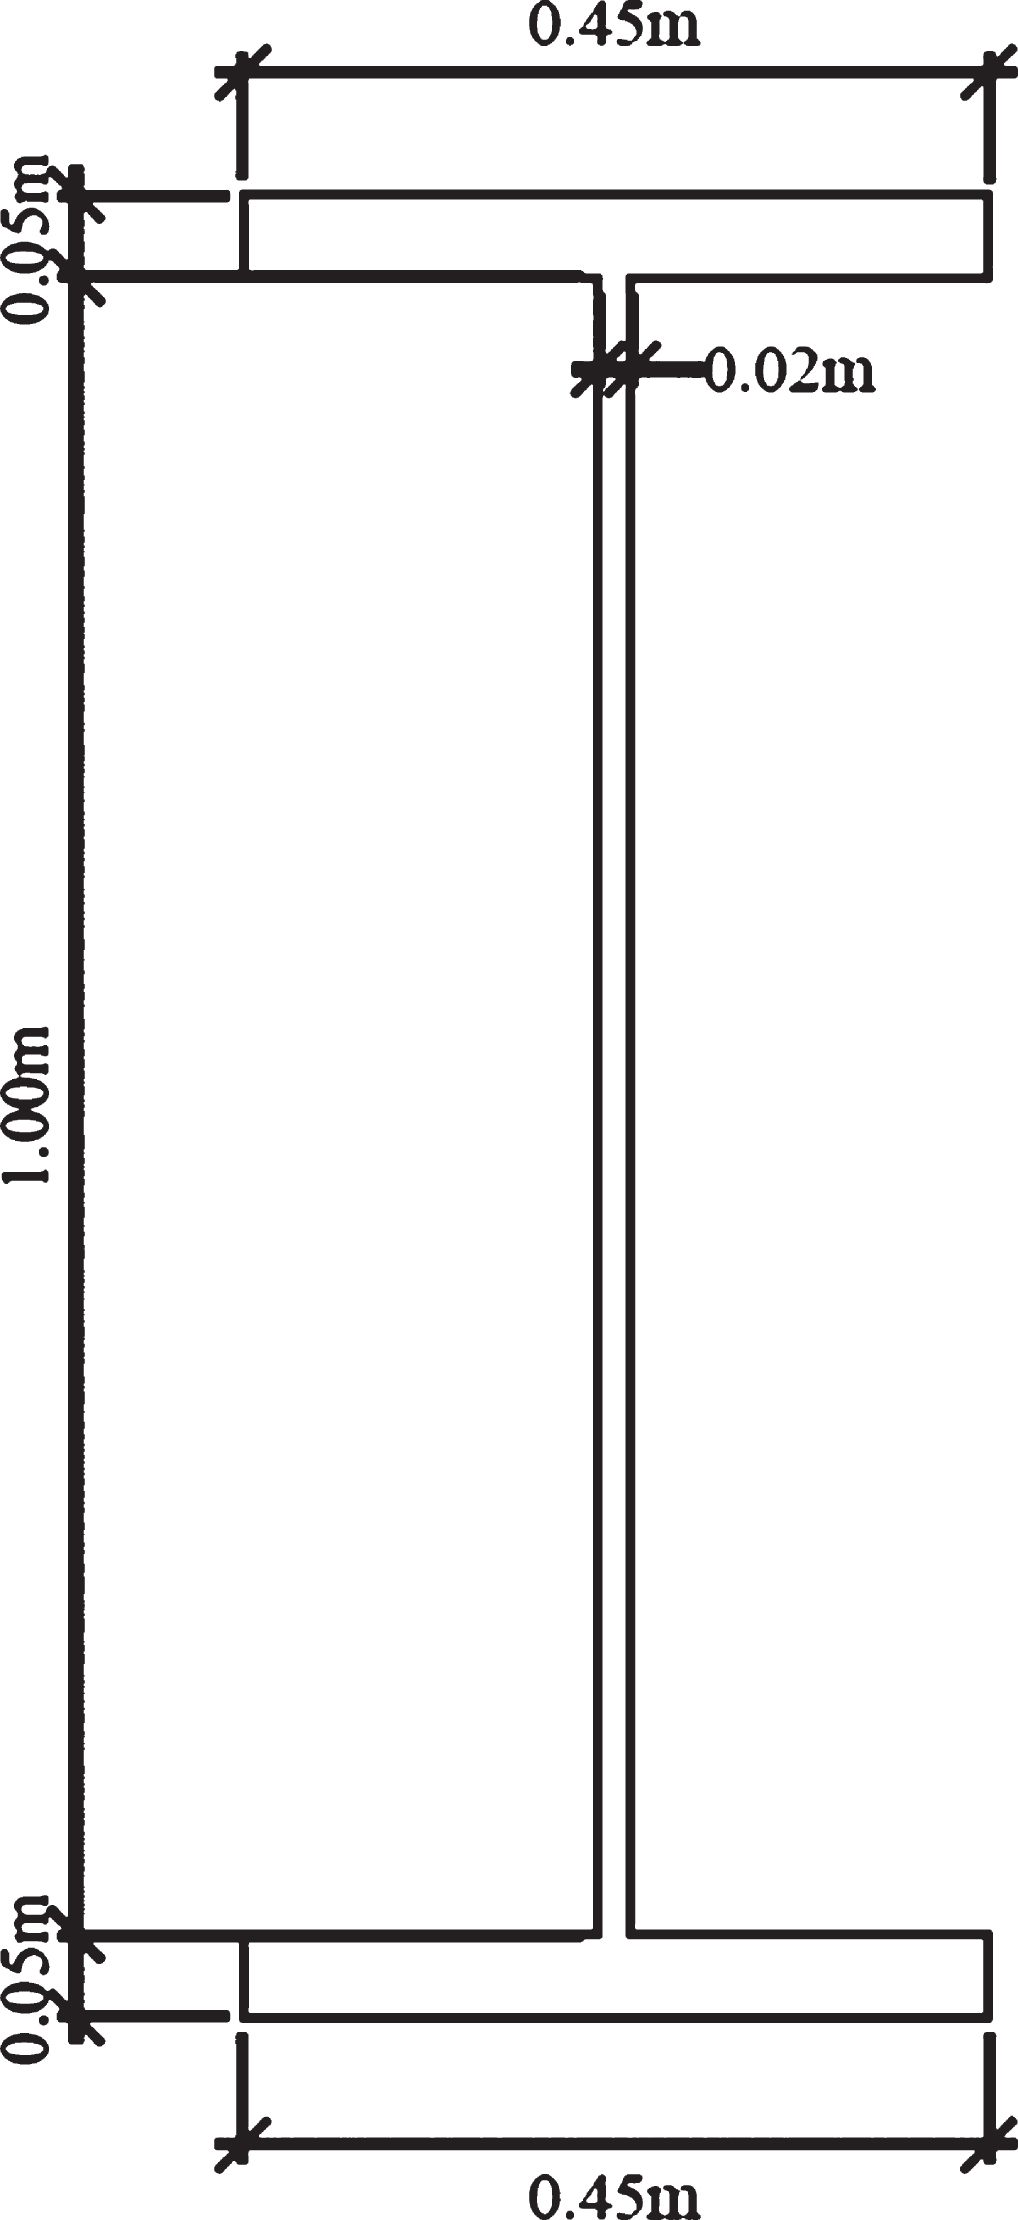
Fig.5
The cross section of steel girders used in this study.
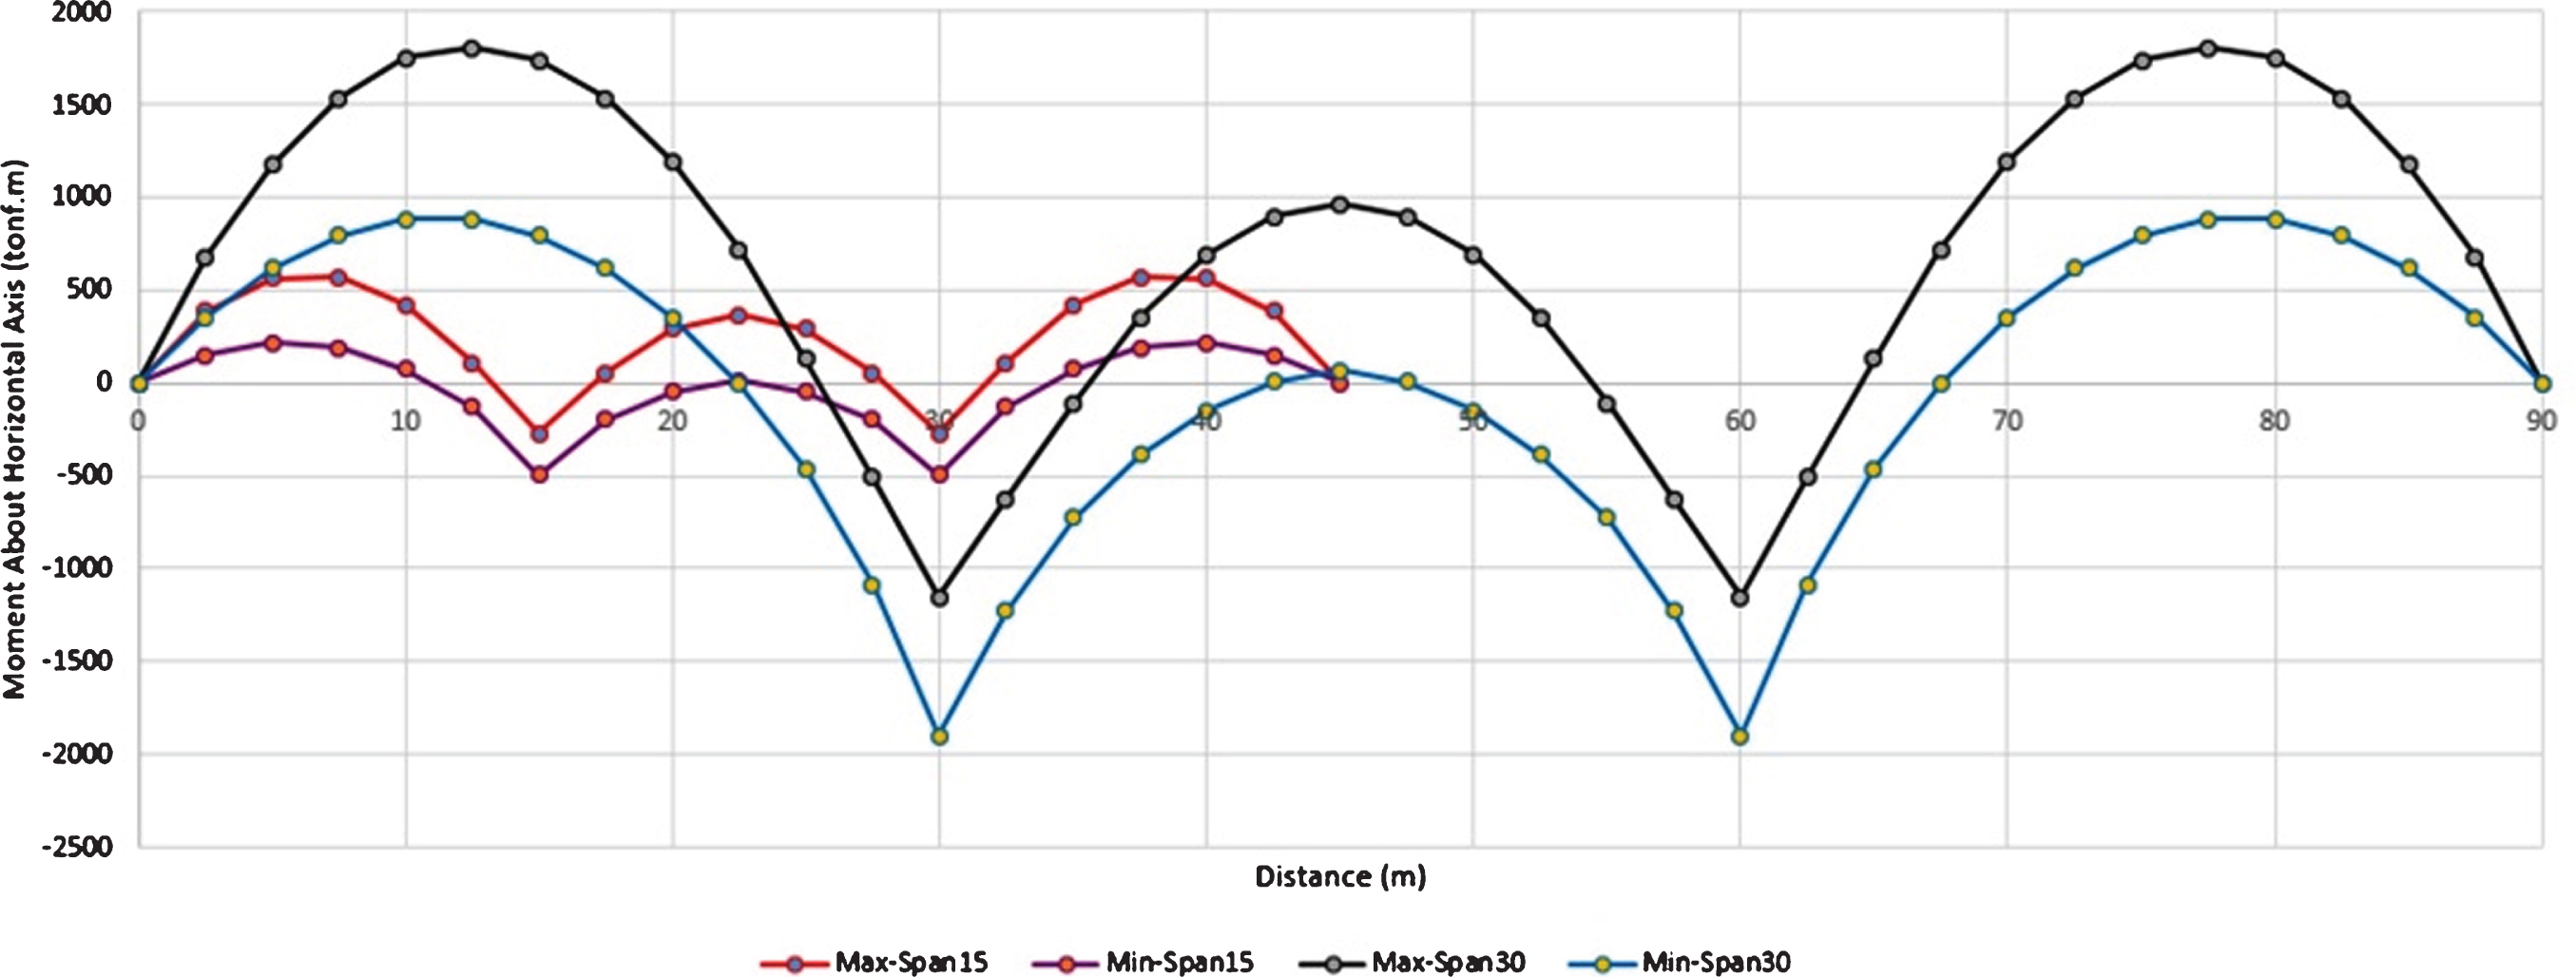
Influence lines for the combination of dead and moving loads along the longitudinal axis of the bridges were obtained in form of maximum and minimum envelope diagrams (Fig. 6). As expected, the longer span lengths would increase the bending moment and the Span30m bridge with a longer span than the other bridge, should withstand more bending moment.
Fig.6
Influence lines of the bridges under gravity loads.
4Selecting the appropriate earthquakes
Selecting appropriate earthquake records is one of the most important steps in nonlinear time history analysis, since nonlinear responses of structures are highly dependent on the selected records, and the mistake in choosing appropriate records can disrupt the outcome of analysis. Therefore, the selected earthquakes should have similar characteristics to the probable earthquake that might occur in the site were bridges are located. These characteristics include magnitude, distance from the fault, fault mechanism, Soil / Rock type and directivity effect. It was assumed that the bridges under study are located in a high seismic hazard zone with a shear wave velocity between 375 and 750 meters/second at a depth of 30-meters. Regulations for the representation of external lateral forces entering the structures provide the characteristics of the motions of the earth in form of design spectrums. For this reason, scaling records is necessary. The scaling was done in six steps. In the first step, each pair of records were scaled up to their peak ground acceleration (PGA), then the spectral acceleration response was obtained for each records. In the next step, these spectrums of pair of records were combined with the SRSS method. In the next step, the average of the combined spectrums in the previous step was obtained (Fig. 7). Then, the spectrum from the regulation and the average of spectrums at the previous stage were compared [16]. The average values of the spectrums should not be less than 1.4 times the range of regulations spectrum in the range of 0.2 to 1.5 times the bridges’ first mode period based on Iranian standard [16]. The last step is to find the final scale factors for the earthquake records, therefore the records should be scaled to the scale factor obtained from the comparison of the regulation spectrum and the average of the spectrums in a way that these two diagrams result the most efficient state. In this study, seven pairs of records were used with specifications according to Table 1.
Fig.7
Combined response spectrums along with the average spectrum.
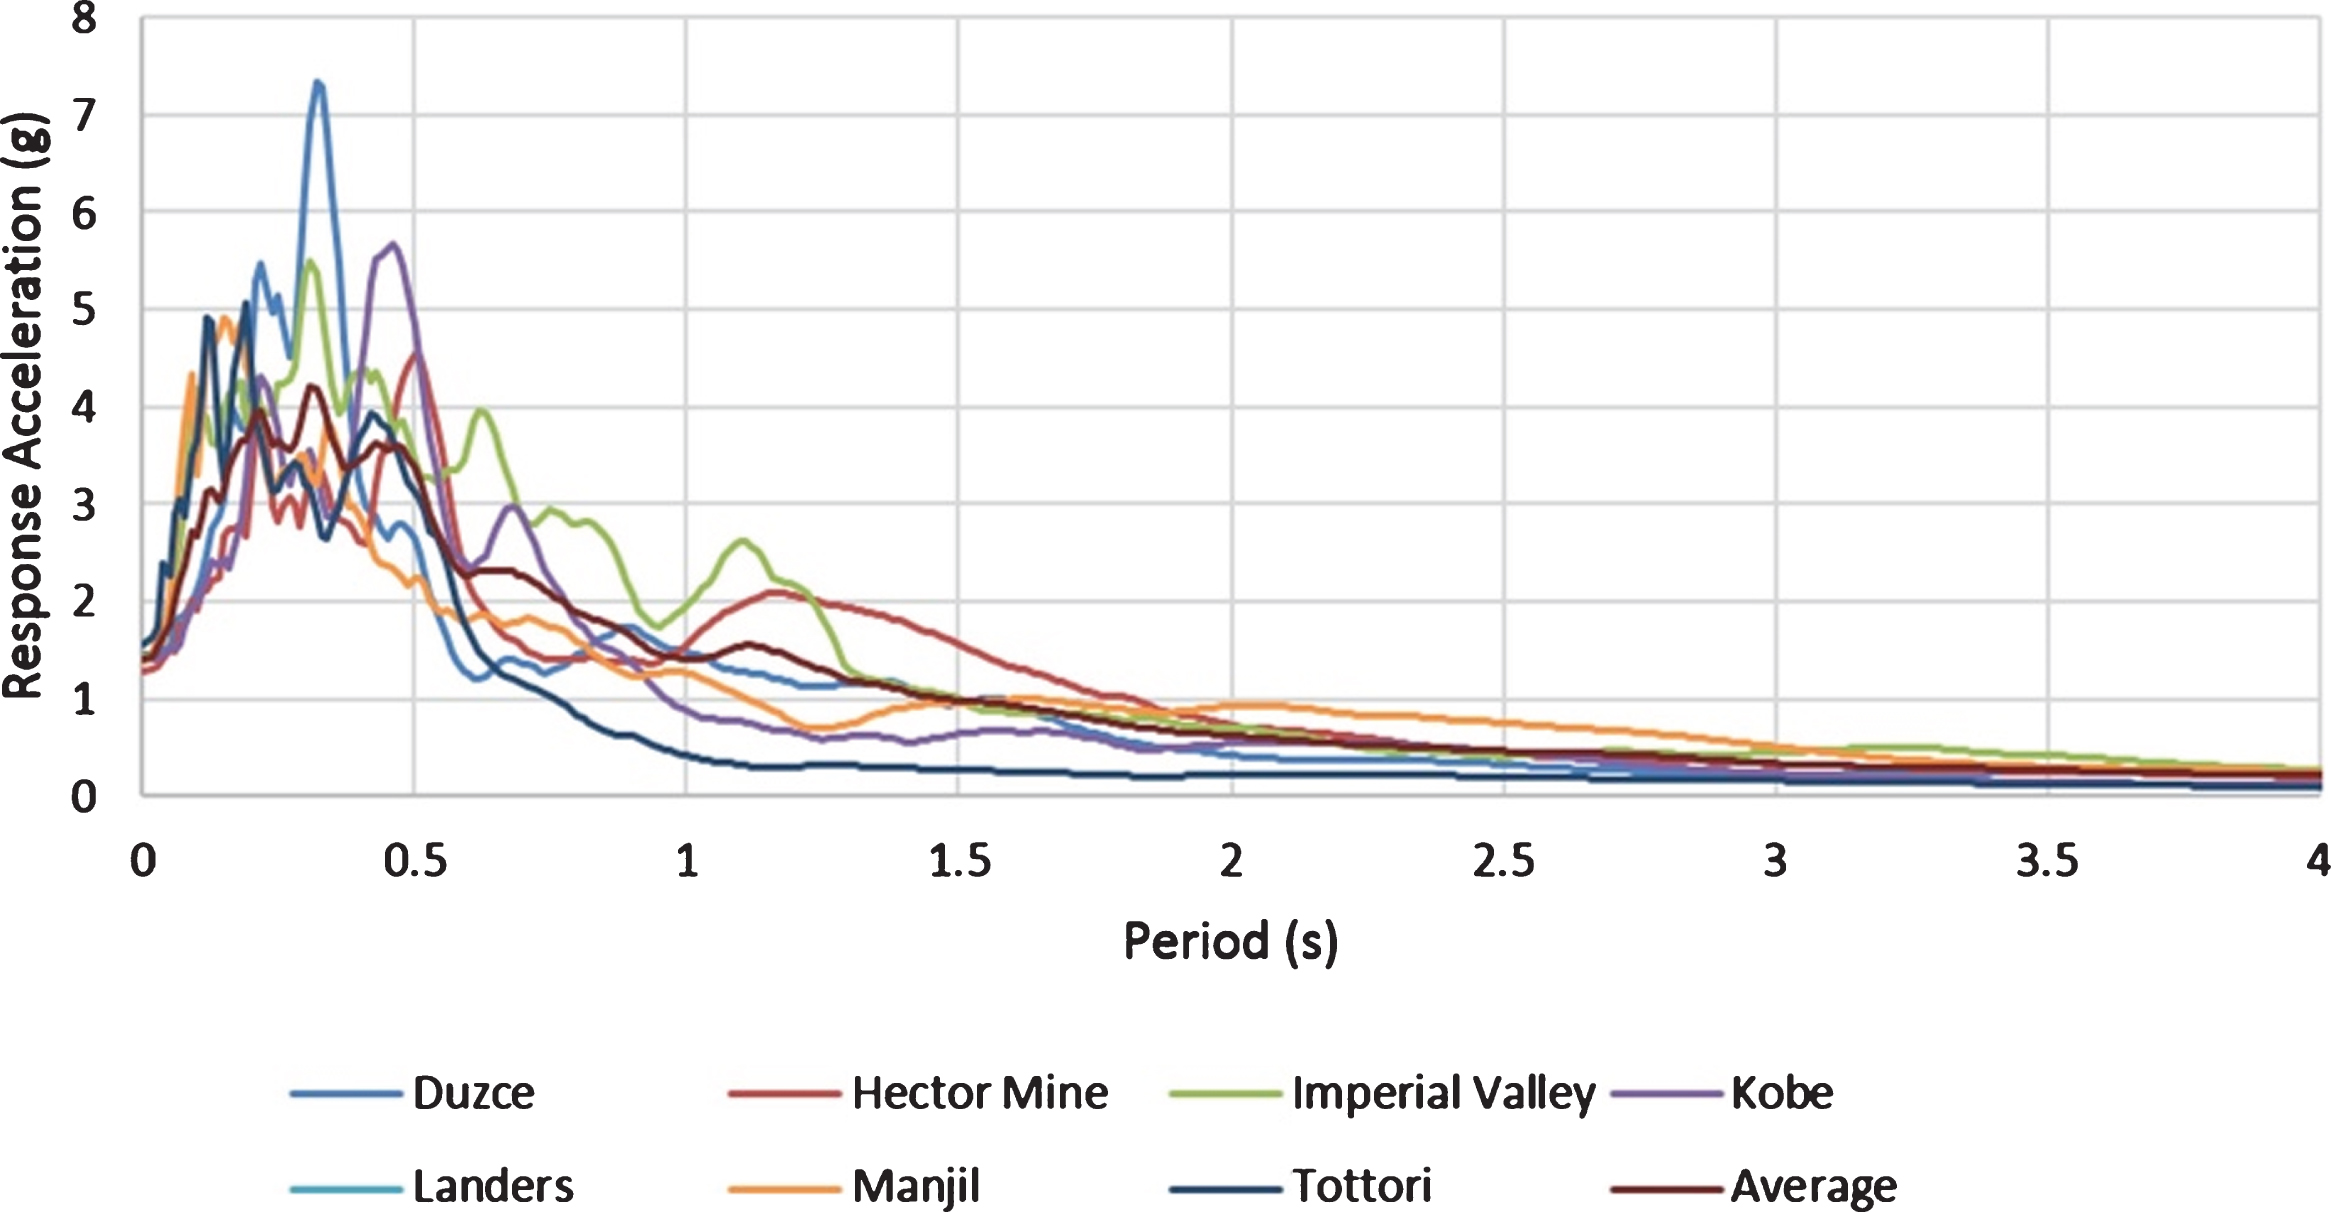
Table 1
Selected earthquakes and their specifications
| Event | Year | Station | Magnitude | Mechanism | Rjb(km) | Vs30(m/s) | Scale Factor |
| Manjil | 1990 | Abbar | 7.37 | Strike slip | 12.55 | 723.95 | 0.825 |
| Landers | 1992 | Joshua Tree | 7.28 | Strike slip | 11.03 | 379.32 | 1.498 |
| Duzce | 1999 | Lamont 1061 | 7.14 | Strike slip | 11.46 | 481 | 3.732 |
| Hector Mine | 1999 | Hector | 7.13 | Strike slip | 10.35 | 726 | 1.297 |
| Kobe | 1995 | Nishi-Akashi | 6.9 | Strike slip | 7.08 | 609 | 0.888 |
| Tottori | 2000 | TTR007 | 6.61 | Strike slip | 11.28 | 469.79 | 0.719 |
| Imperial Valley | 1979 | Cerro Prieto | 6.53 | Strike slip | 15.19 | 471.53 | 2.659 |
5Determining the effect of earthquake directivity and finding the most critical angle of force applied to the structure
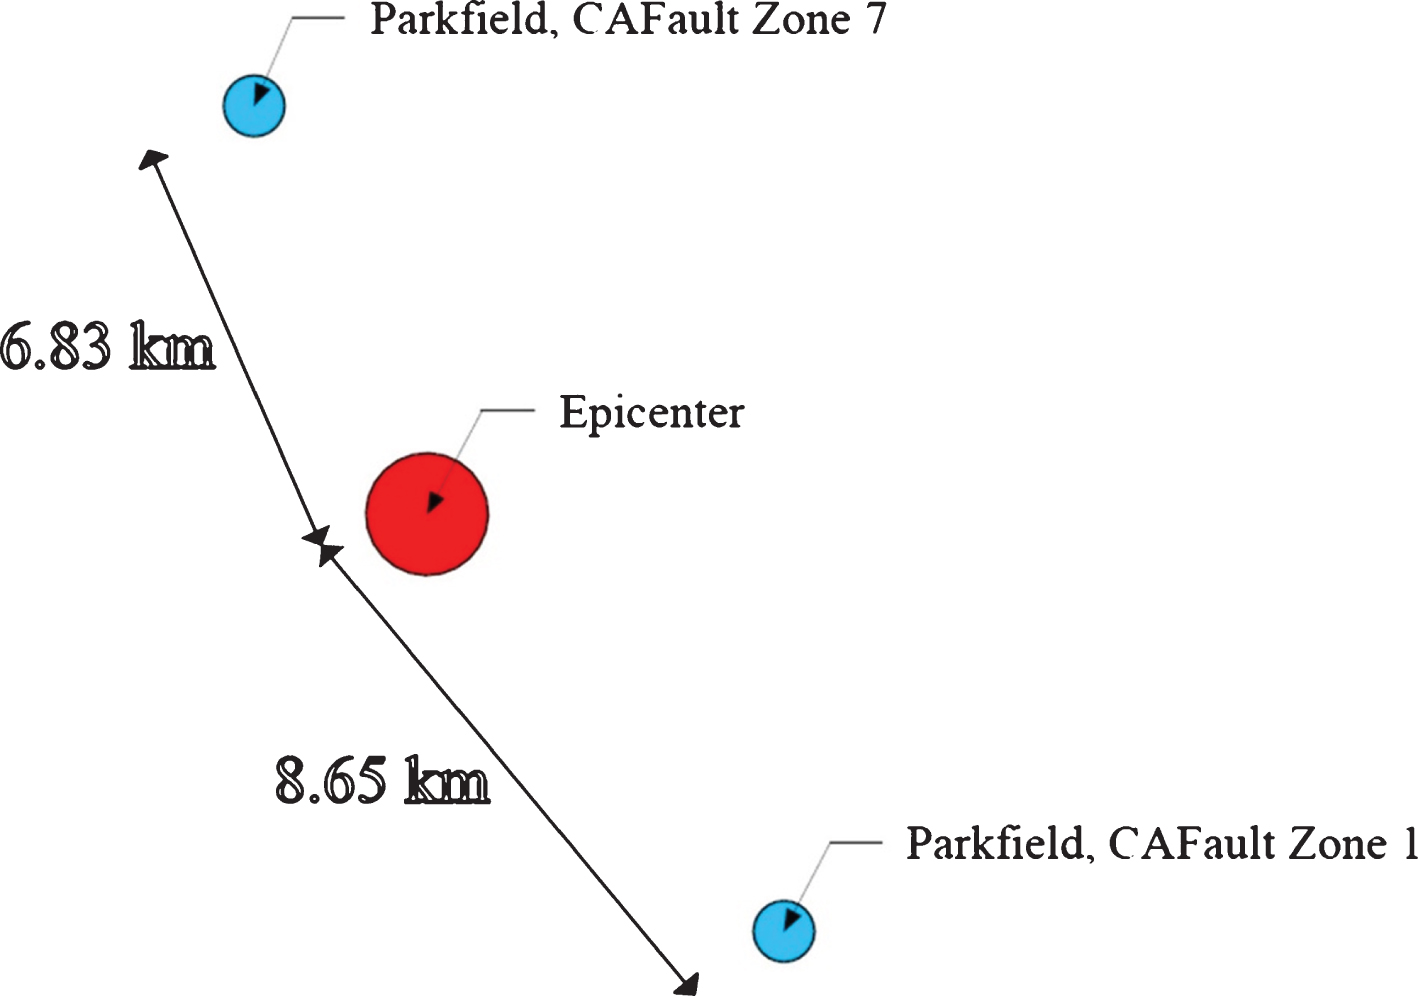
When an earthquake with directivity feature occurs, a near-field region receives greater acceleration than other areas near the fault. Important recorded earthquakes with directivity feature are the Darfield New Zealand (2010), Niigata Japan (2004), Bam Iran (2003), and Christchurch New Zealand (2011) [17]. In this study, the Parkfield 2004 earthquake is considered to investigate the effect of earthquake directivity on the bridges isolated by FPS. The factor that distinguishes this earthquake from other earthquakes with directivity feature is the presence of two appropriate stations in a way that one station is located on the side affected by directivity feature and the other one is located on another side of the earthquake epicenter [18, 19] (Fig. 8). From the comparison of the time history of the velocity and spectral acceleration response at the two Parkfield 2004 earthquake stations, it is illustrated that there is a pulse at the beginning of the time history of velocity and a significant acceleration increase in the direction of the earthquake directivity that is indicative of the directivity phenomenon of this earthquake along the station CA Fault Zone 1 (Figs. 9, 10).
Fig.8
Location of the earthquake epicenter and two near-field stations that recorded the Parkfield 2004 earthquake.
![Time history of velocity related to two Parkfield 2004 earthquake stations [19].](https://content.iospress.com:443/media/brs/2020/16-1/brs-16-1-brs200169/brs-16-brs200169-g009.jpg)
![Spectral acceleration response for two Parkfield 2004 earthquake stations [19].](https://content.iospress.com:443/media/brs/2020/16-1/brs-16-1-brs200169/brs-16-brs200169-g010.jpg)
On the horizontal plane of the ground, the stations record only the records related to the two perpendicular horizontal acceleration components, but the probability that these two acceleration components exhibit the highest acceleration on the structures is very low, therefore the records of the side with directivity of the earthquake after every 10 degrees of rotation by the rotation matrix were obtained and the spectral acceleration response of each one was plotted (Fig. 11). The first mode periods of the bridges Span30m and Span15m under study are 2.45 and 2.44 seconds, respectively. According to Fig. 11, the highest acceleration applied on both bridges is generated after 50 degrees of the original records rotation, also records of the side without directivity was obtained after 50 degrees of rotation in order to compare the responses of bridges under the most critical condition (Fig. 12).
Fig.11
Spectral acceleration response diagrams on the side with directivity of the Parkfield 2004 Earthquake after rotation [19].
![Spectral acceleration response diagrams on the side with directivity of the Parkfield 2004 Earthquake after rotation [19].](https://content.iospress.com:443/media/brs/2020/16-1/brs-16-1-brs200169/brs-16-brs200169-g011.jpg)
Fig.12
Time history of acceleration of two Parkfield 2004 stations after 50 degrees of rotation [19].
![Time history of acceleration of two Parkfield 2004 stations after 50 degrees of rotation [19].](https://content.iospress.com:443/media/brs/2020/16-1/brs-16-1-brs200169/brs-16-brs200169-g012.jpg)
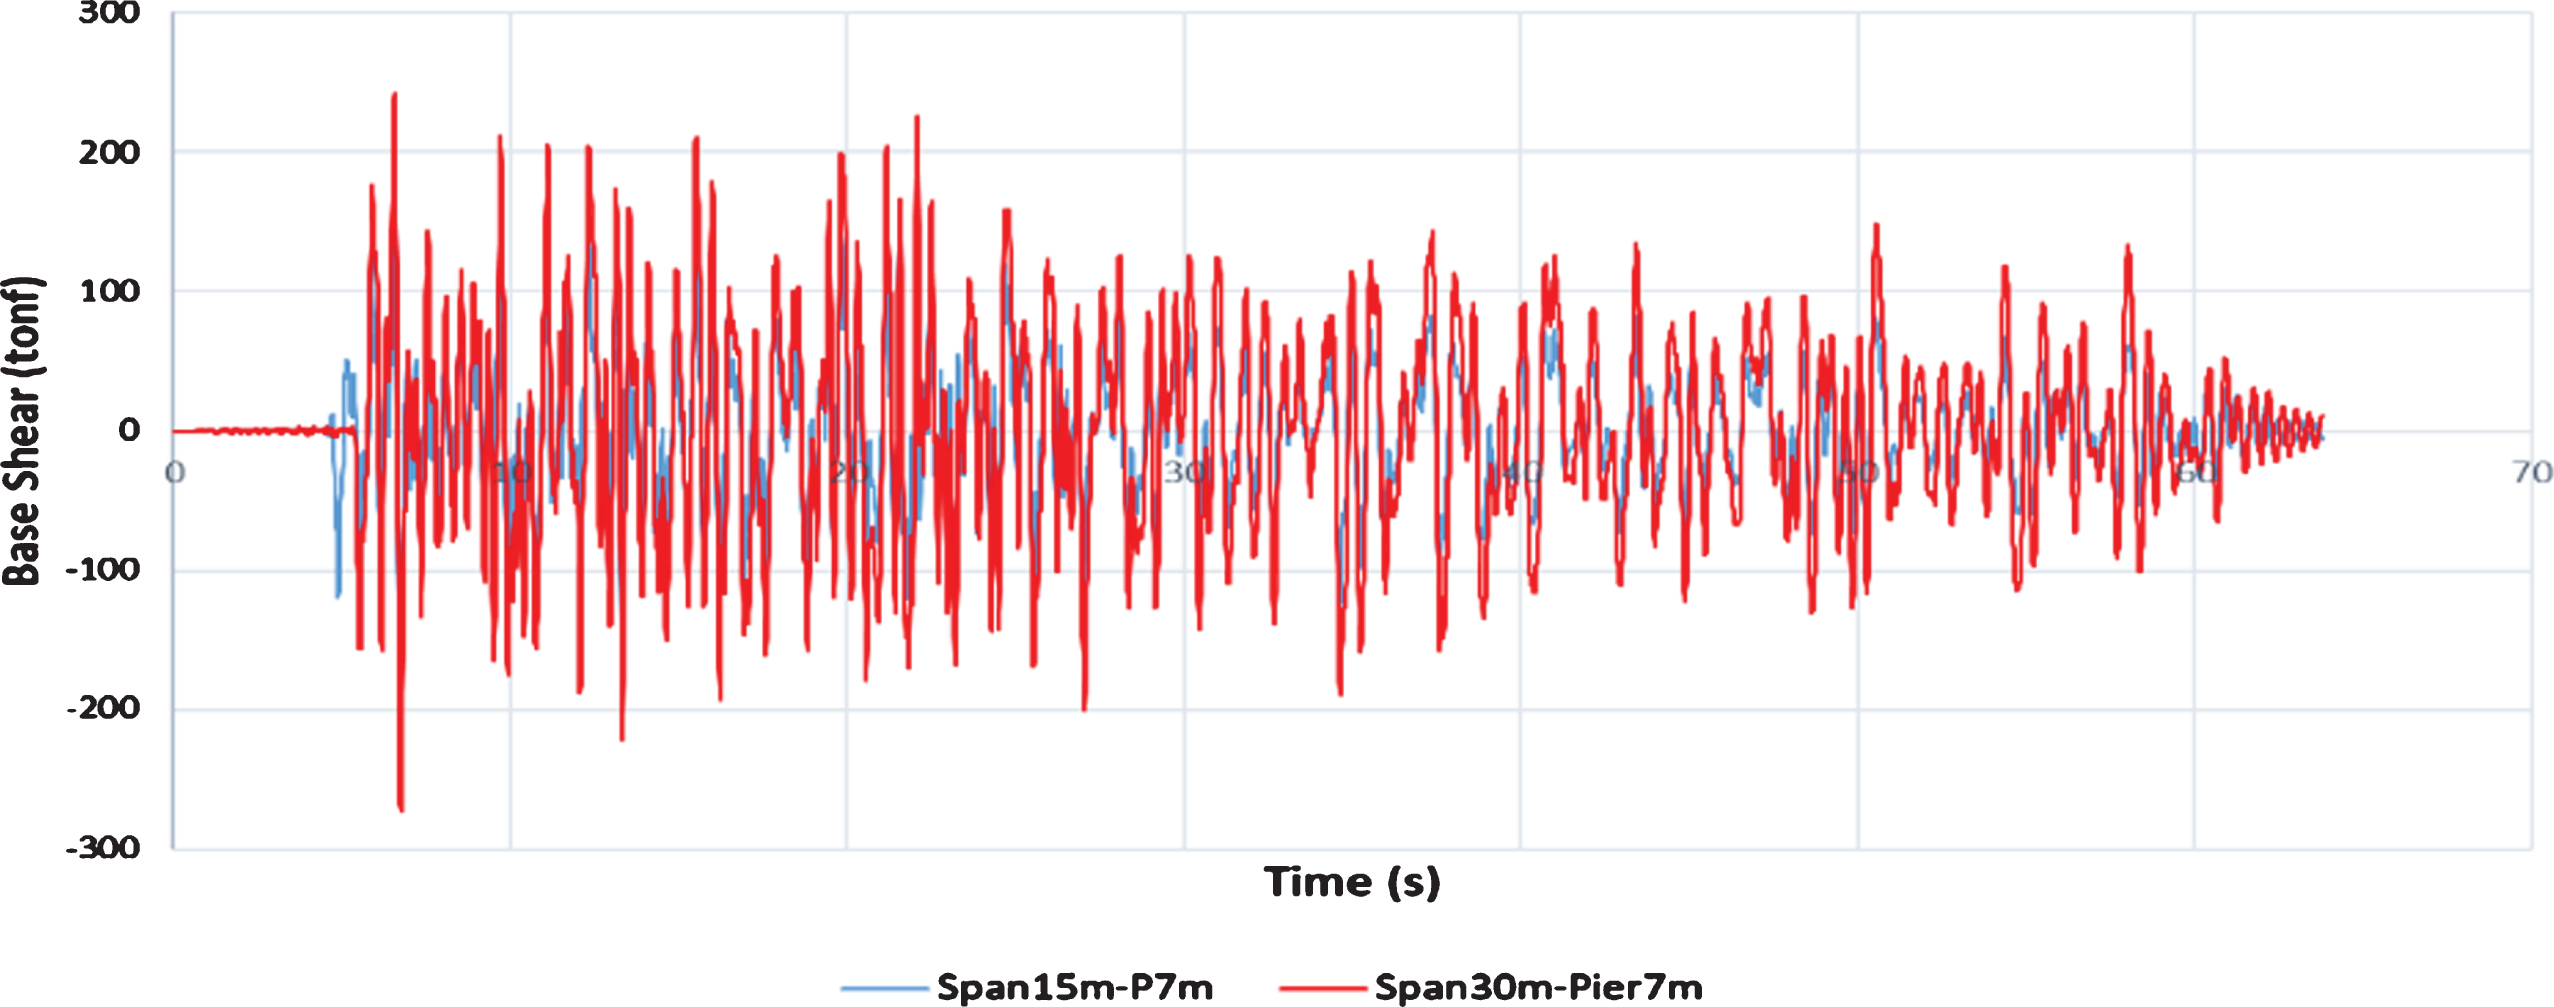
6The effect of span-length on the response of bridges isolated by FPS
In order to study the effect of bridges’ span-length on the performance of the bridges isolated by the friction pendulum system, two bridges with span-length of 30-meters and 15-meters were considered. The seismic behavior of these two bridges was evaluated by examining the base shear, the ratio of acceleration of superstructure-to-substructure and the displacement of the deck center. After plotting the base shear diagrams for two Span30m and Span15m bridges, it was observed that under all earthquakes, Span30m received more base shear, and it can be concluded that the increase in the span-length has a direct relationship with the base shear applied on the bridges (Fig. 13).
Fig.13
Comparison of the base shear of two Span30m and Span15m bridges under the Imperial Valley earthquake.
One of the most important characteristics of seismic isolators is the reduction of acceleration applied to the superstructure. Seismic isolators are installed on the middle-piers and the abutments of bridges, and the bridge structure is divided into two parts: substructure and superstructure. Hence, the values of acceleration applied on the superstructure are expected to be less than the acceleration on the substructure. After examining this for two Span30m and Span15m bridges, it was observed that in all the earthquakes under study, the acceleration on the superstructure was less than the acceleration on the substructure (Fig. 14). In accordance with Table 2, maximum superstructure to maximum substructure acceleration ratio was obtained for both mentioned bridges. As can be seen from the values in this table, the seismic isolator on the bridge with a shorter span-length applies less acceleration into superstructure.
Fig.14
Acceleration on the superstructure and substructure on the Span30m bridge under the Hector Mine earthquake.
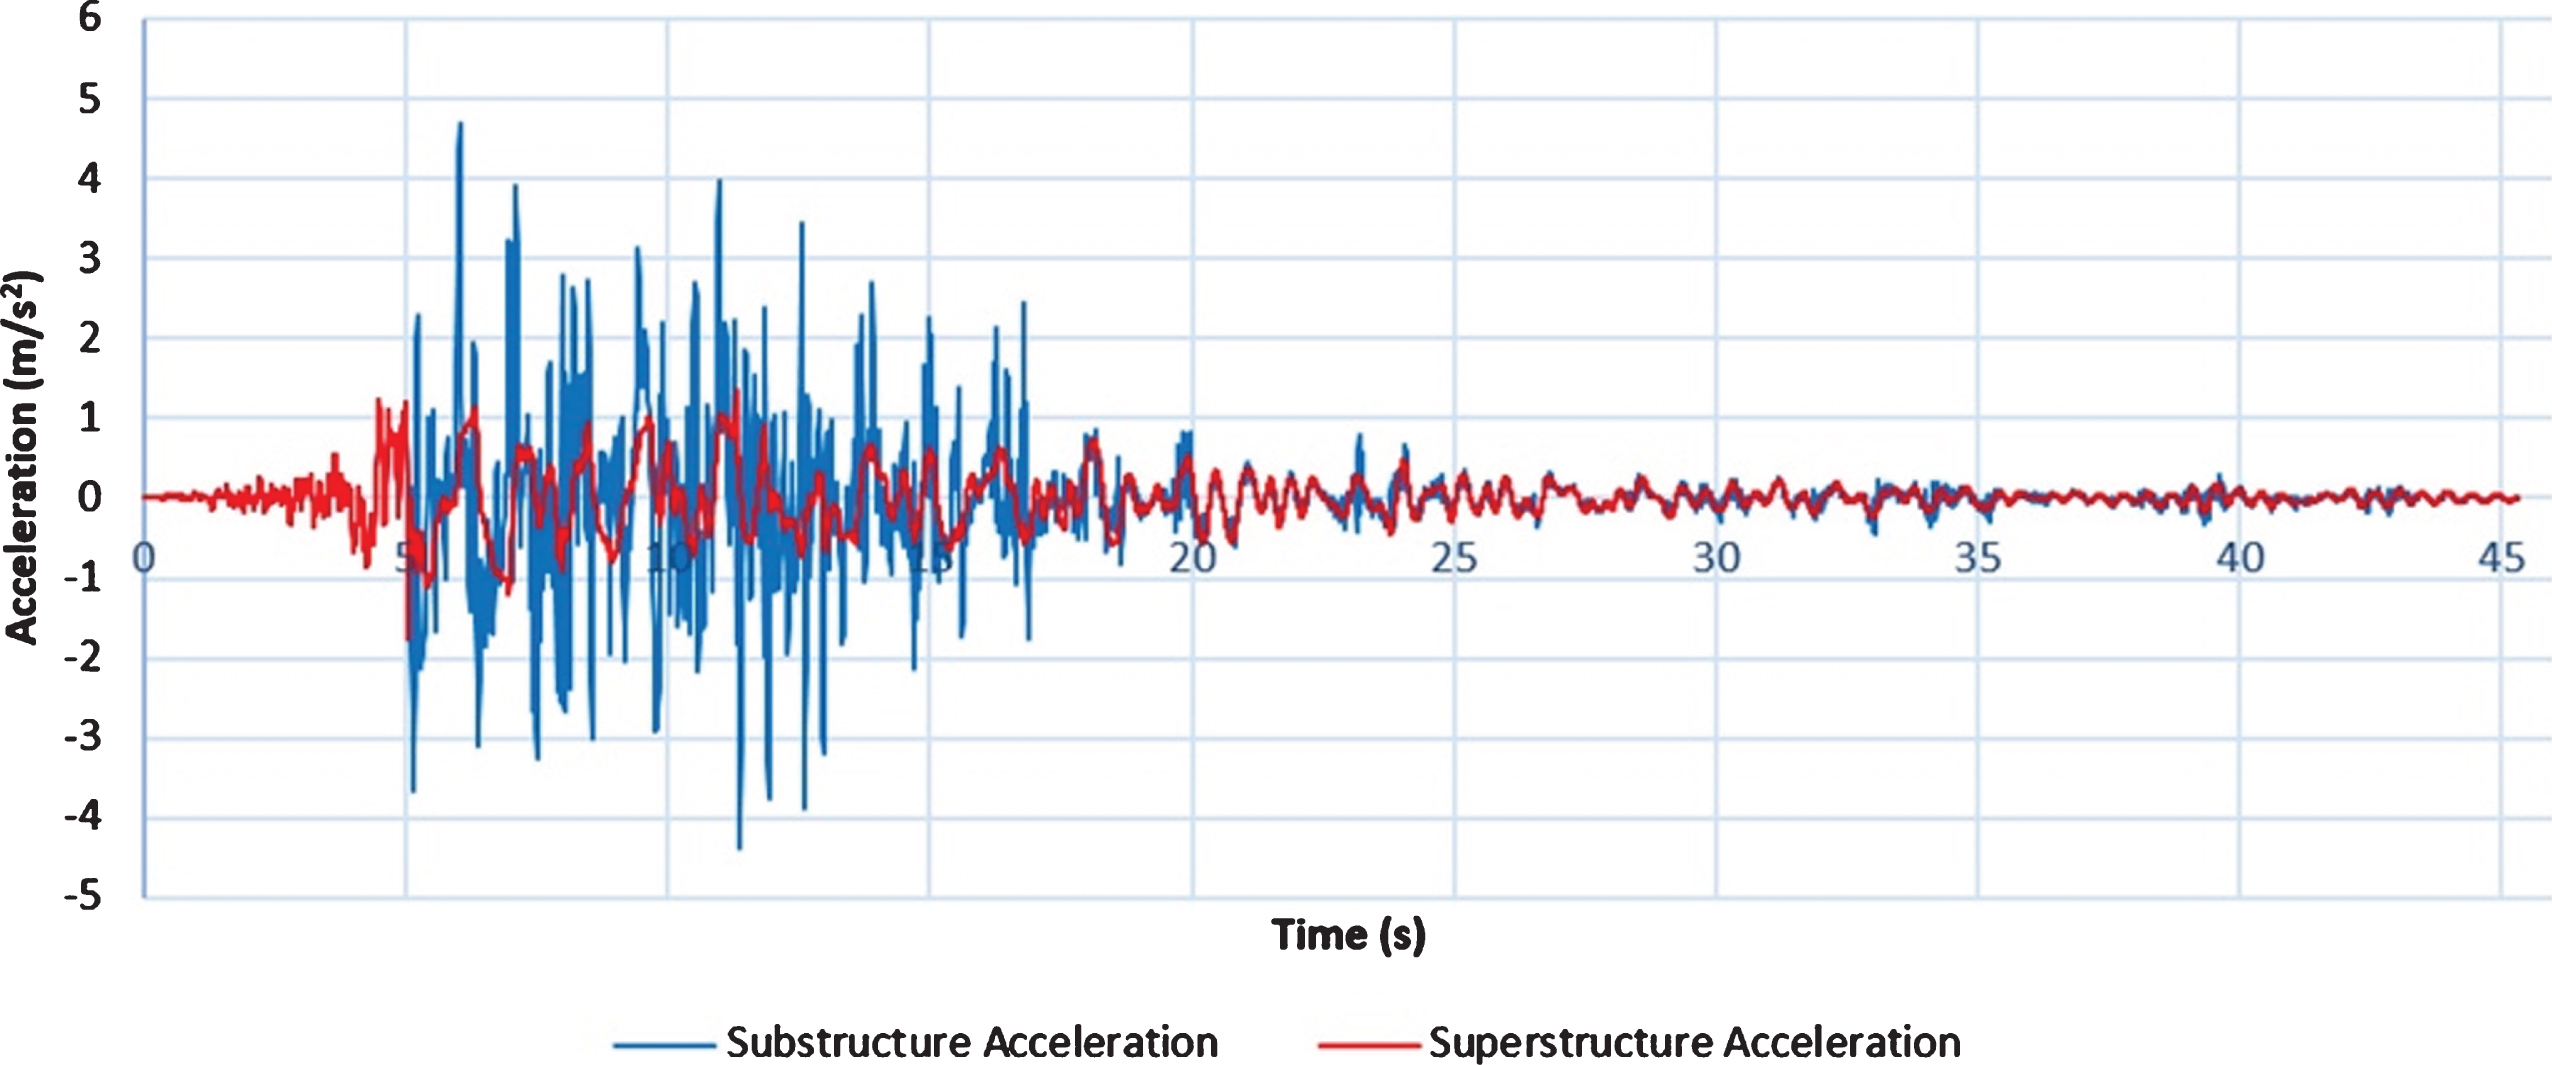
Table 2
The ratio of the maximum superstructure to maximum substructure acceleration ratio of bridges
| Event | Span30m | Span15m |
| Manjil | 0.24 | 0.18 |
| Landers | 0.32 | 0.27 |
| Duzce | 0.19 | 0.13 |
| Hector Mine | 0.28 | 0.25 |
| Kobe | 0.26 | 0.21 |
| Tottori | 0.25 | 0.24 |
| Imperial Valley | 0.33 | 0.19 |
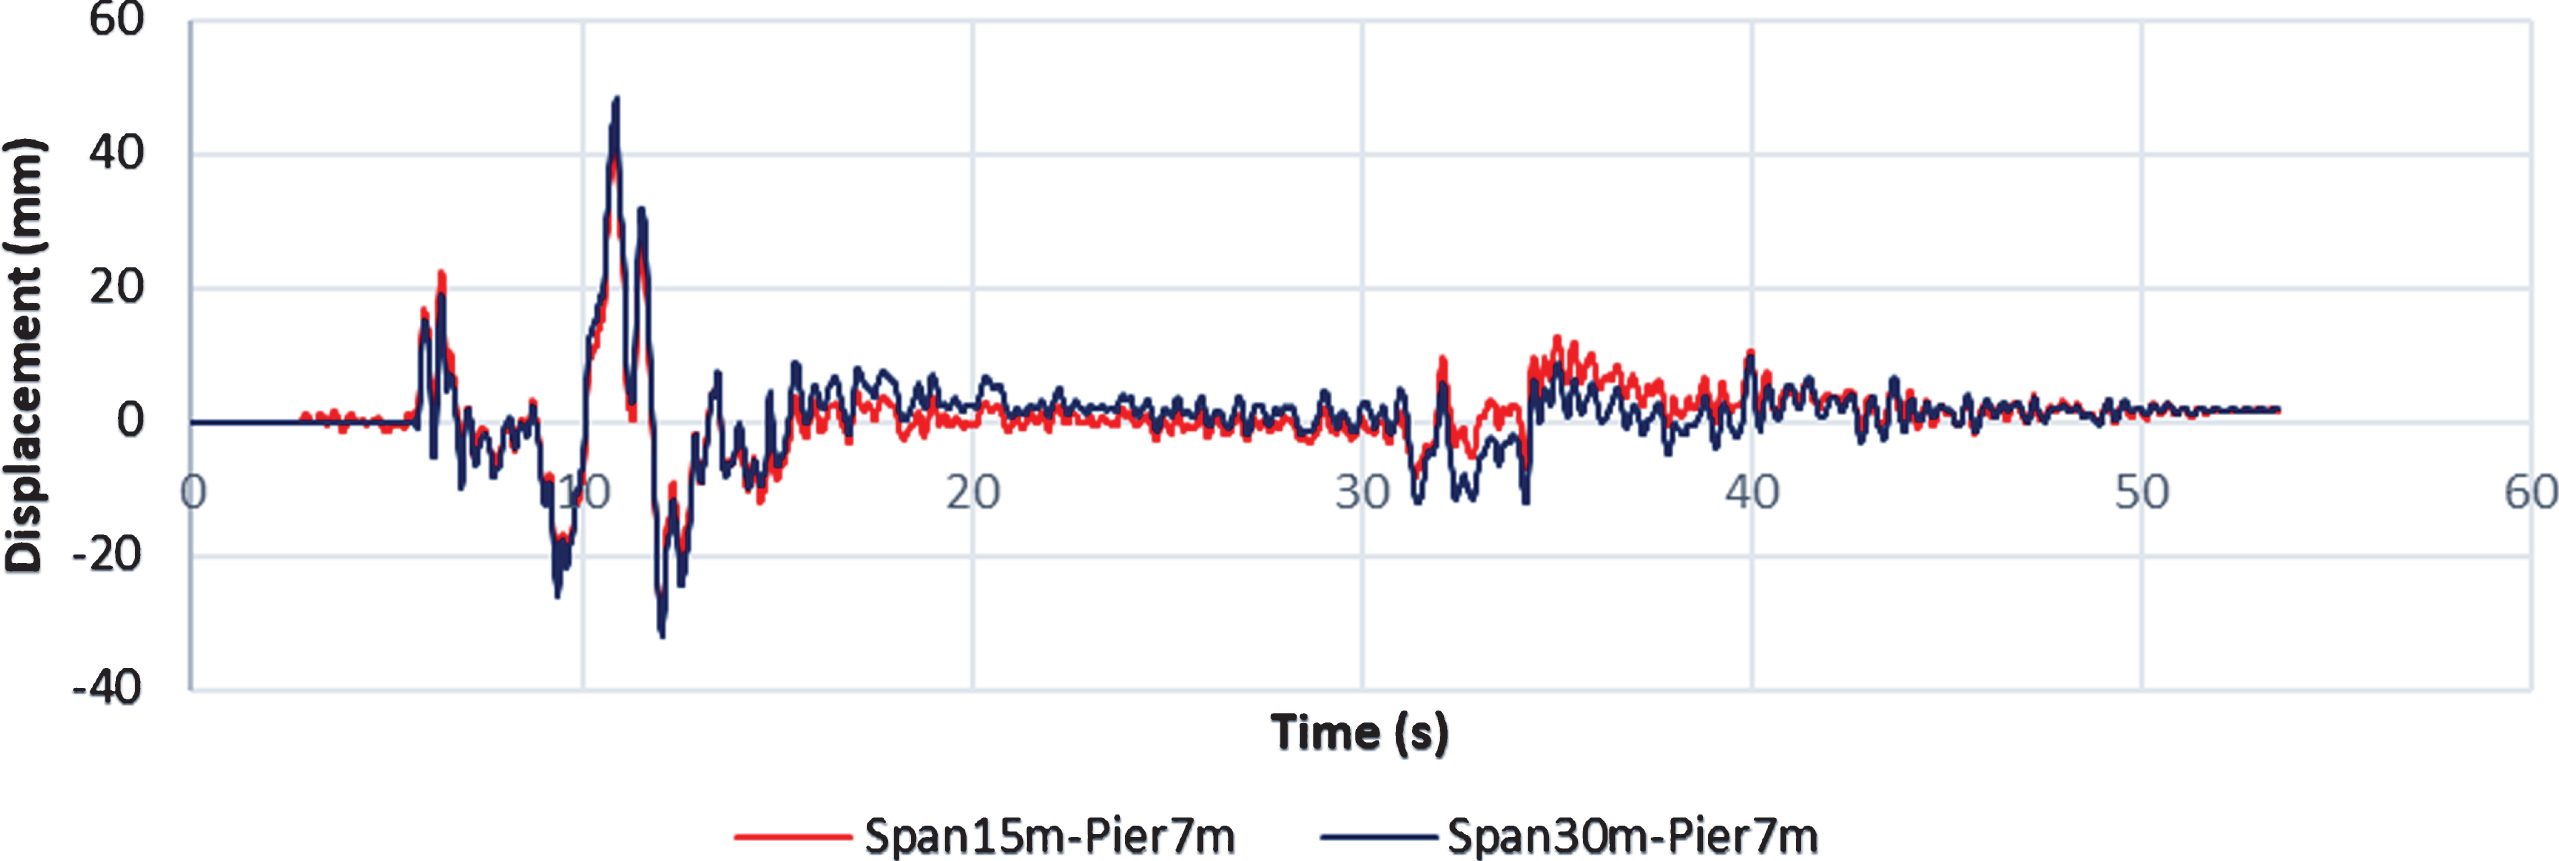
Another criterion for comparing bridges in this study is the superstructure displacement. No significant difference was observed between deck displacements in these two bridges under different earthquakes. Therefore, it can be concluded that the span-length did not have a significant impact on the displacement of the superstructure of bridges isolated by the FPS system (Fig. 15).
Fig.15
Deck displacement for two Span30m and Span15m bridges under the Manjil earthquake.
7Effect of earthquake directivity on the response of bridges isolated by FPS
In this section, the performance of bridges isolated by FPS under the influence of the Parkfield 2004 earthquake directivity at the most critical angle in terms of base shear and deck displacement was investigated. It was observed that the base shear created on both bridges in the direction where directivity was occurred was more than the other side (Figs. 16, 17). Deck displacement on the bridge in the direction where directivity was occurred, was more than the other side (Figs. 18, 19). In order to understand the effect of the earthquake directivity on the base shear and the displacement of the bridge deck better, the maximum values obtained from the base shear and the displacement of the deck on the directivity direction were divided by the maximum values of the side without the directivity effect. These ratios are listed in Table 3. According to this table, although in both bridges the base shear on the side with directivity is more than the other side, no significant difference was observed between the base shear ratios. But in terms of the deck displacement, Span30m showed a higher displacement ratio.
Fig.16
Comparison of the Span30m bridge base shear in the side with directivity with the other side.
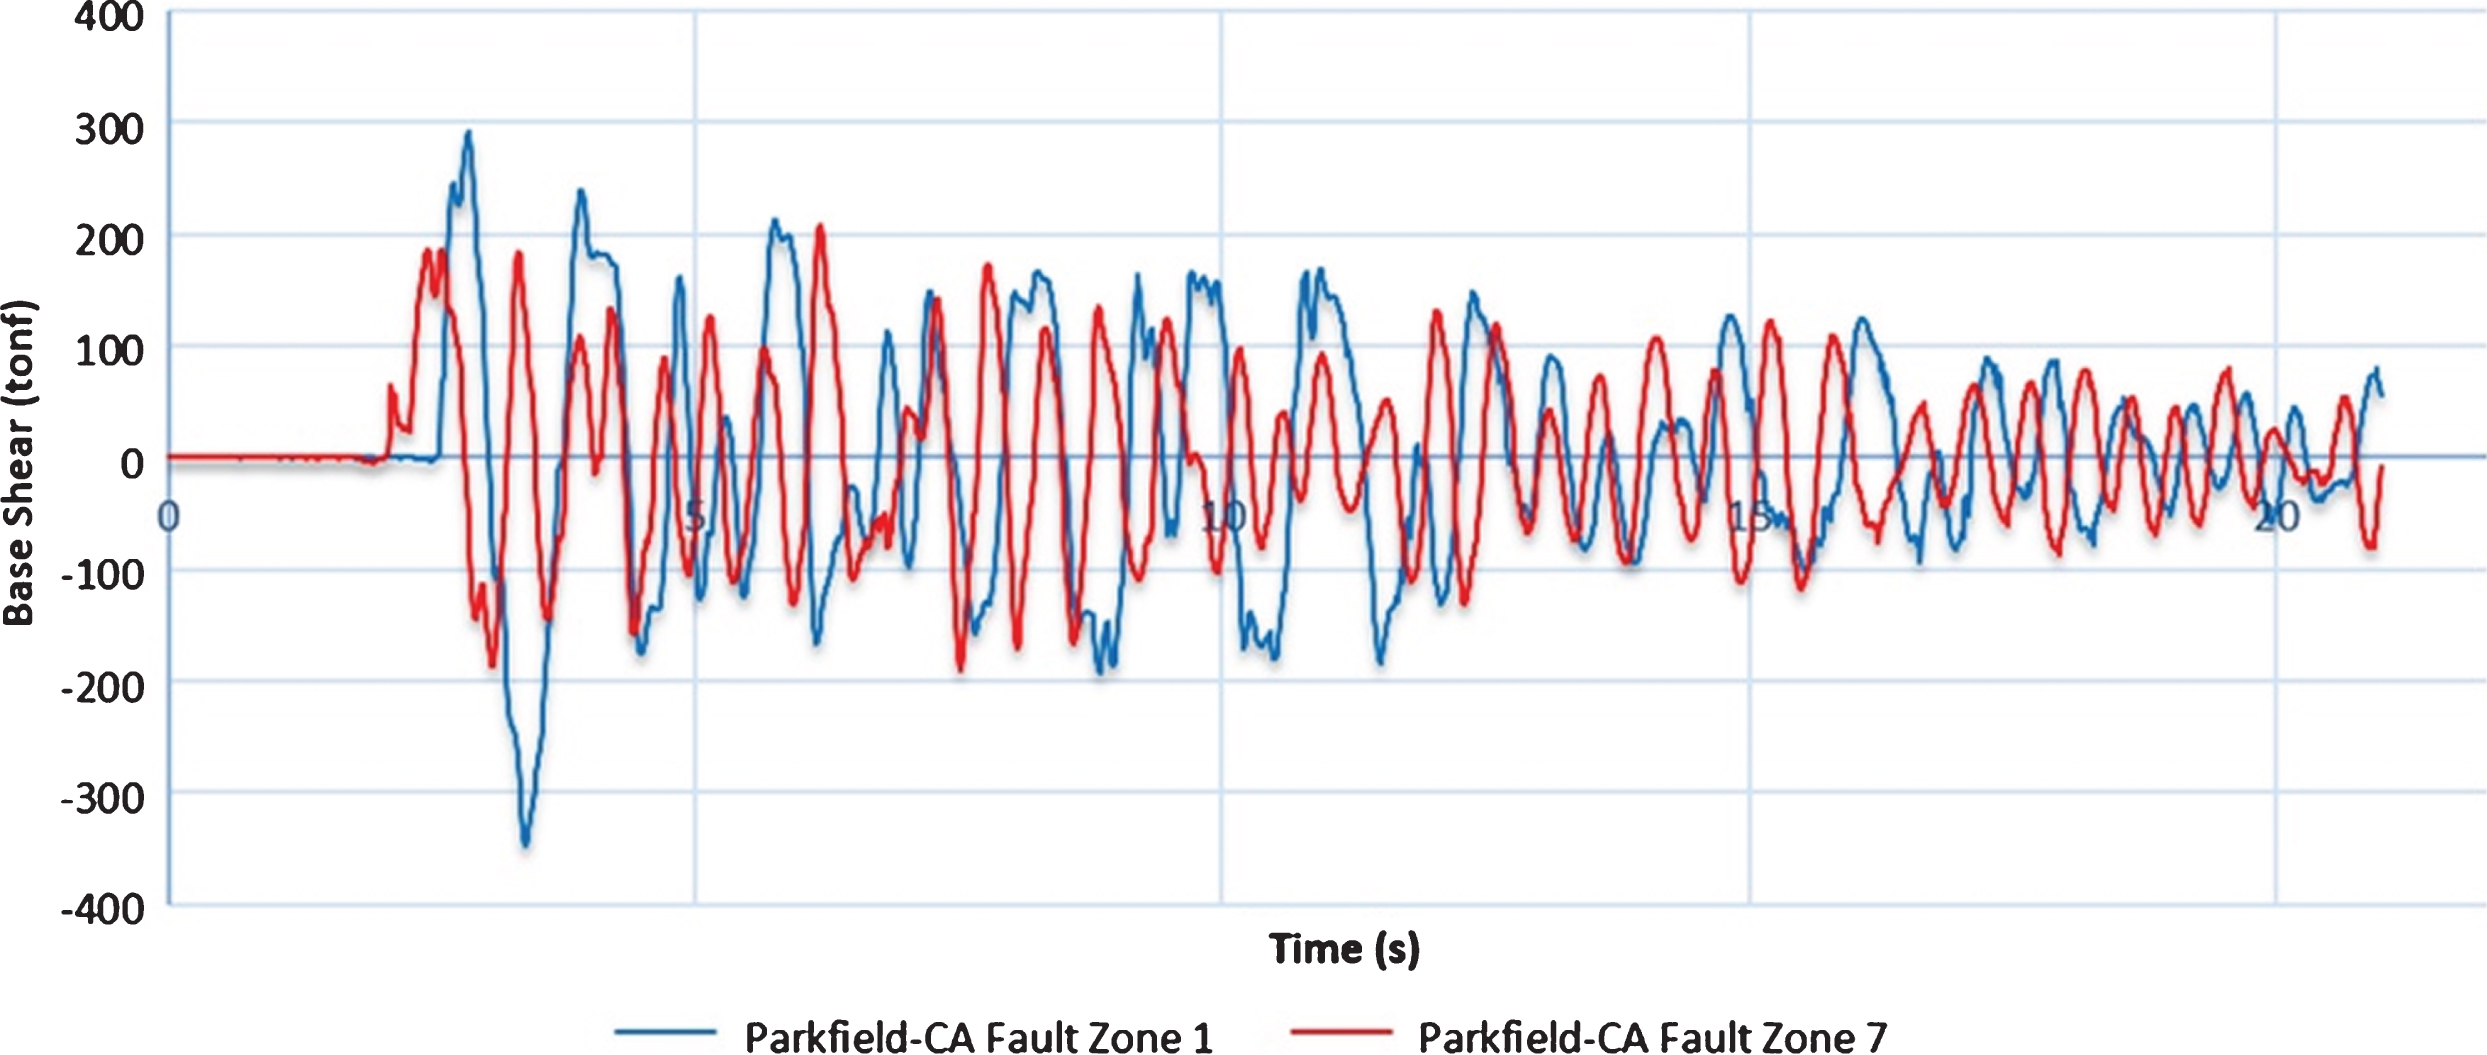
Fig.17
Comparison of the Span15m bridge base shear in the side with directivity with the other side.
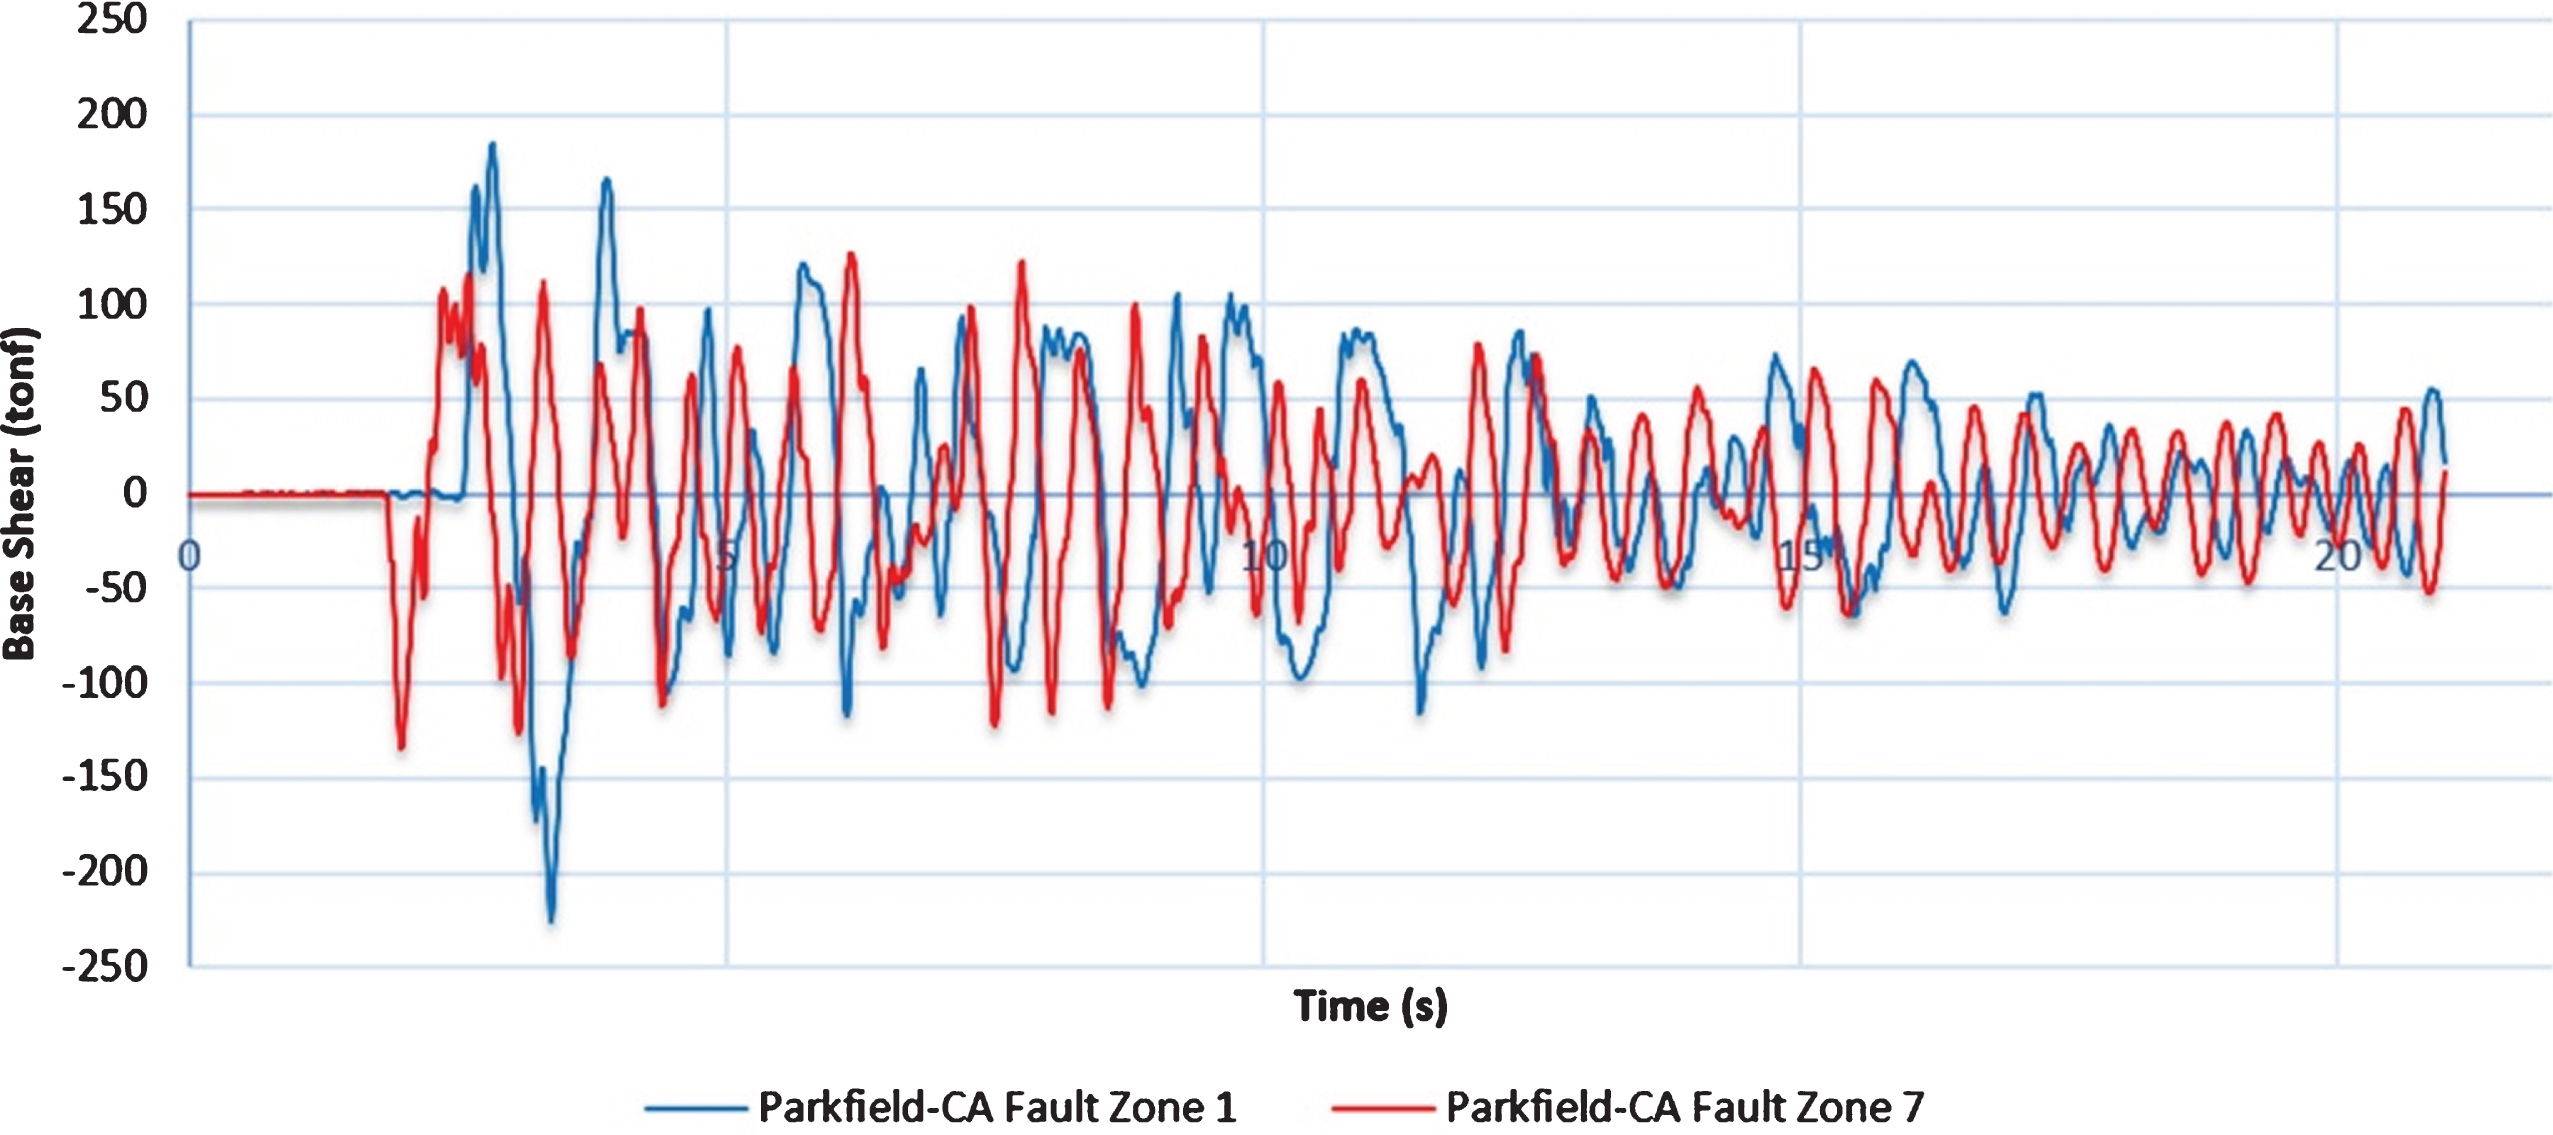
Fig.18
Comparison of the Span30m bridge deck displacement in the side with directivity and with the other side.
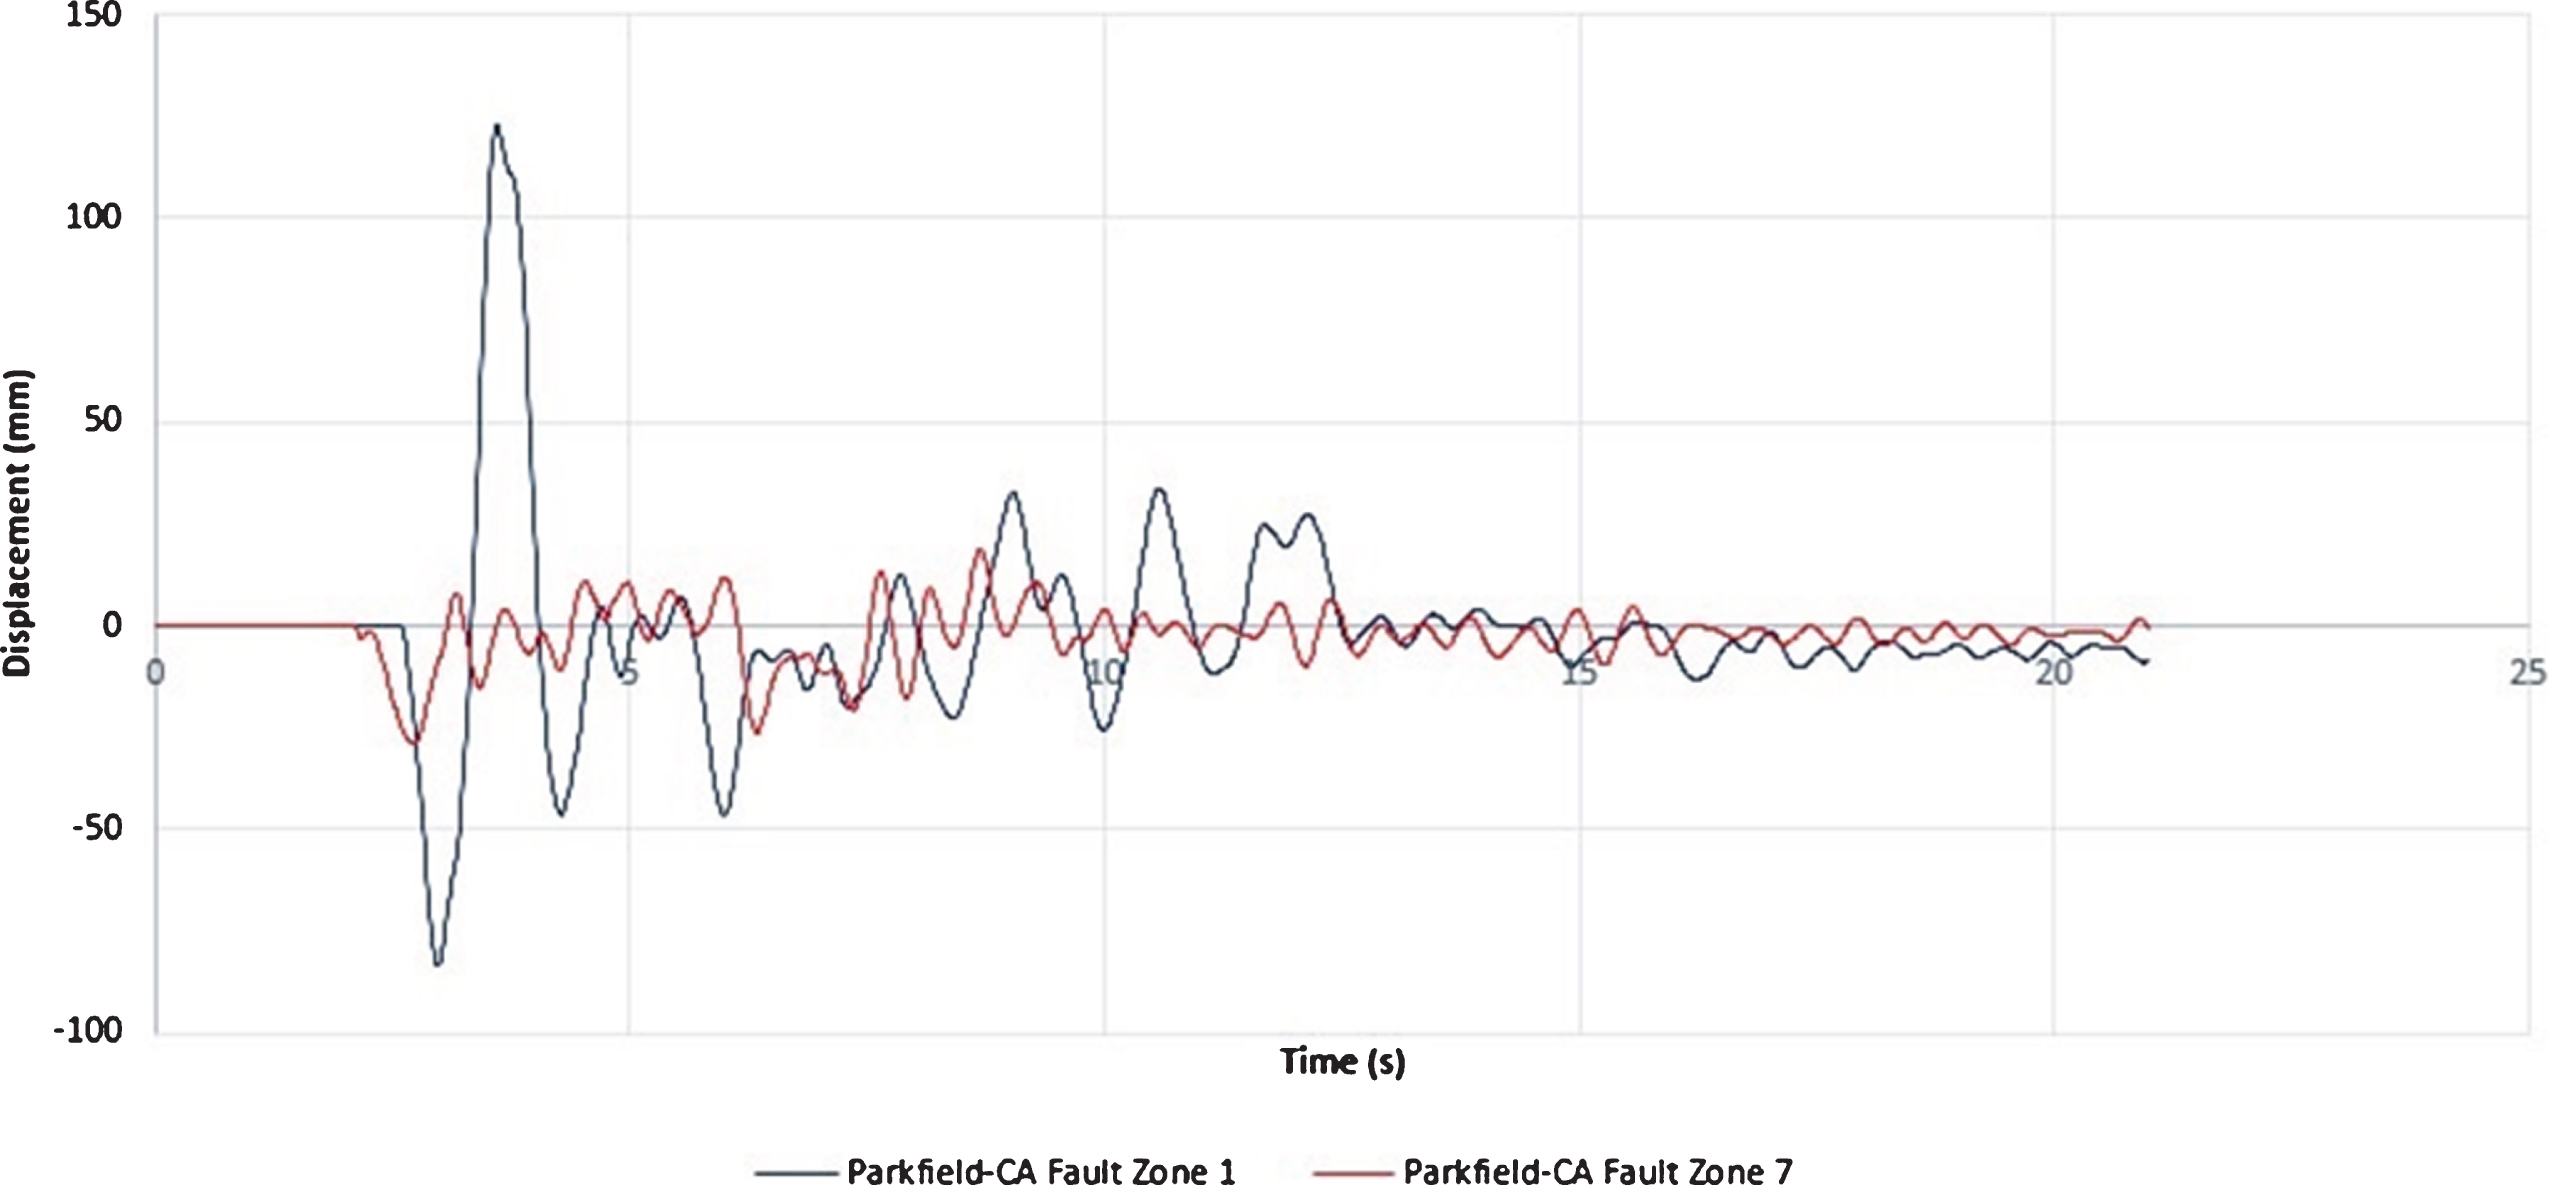
Fig.19
Comparison of the Span15m deck displacement in the side with directivity and with the other side.
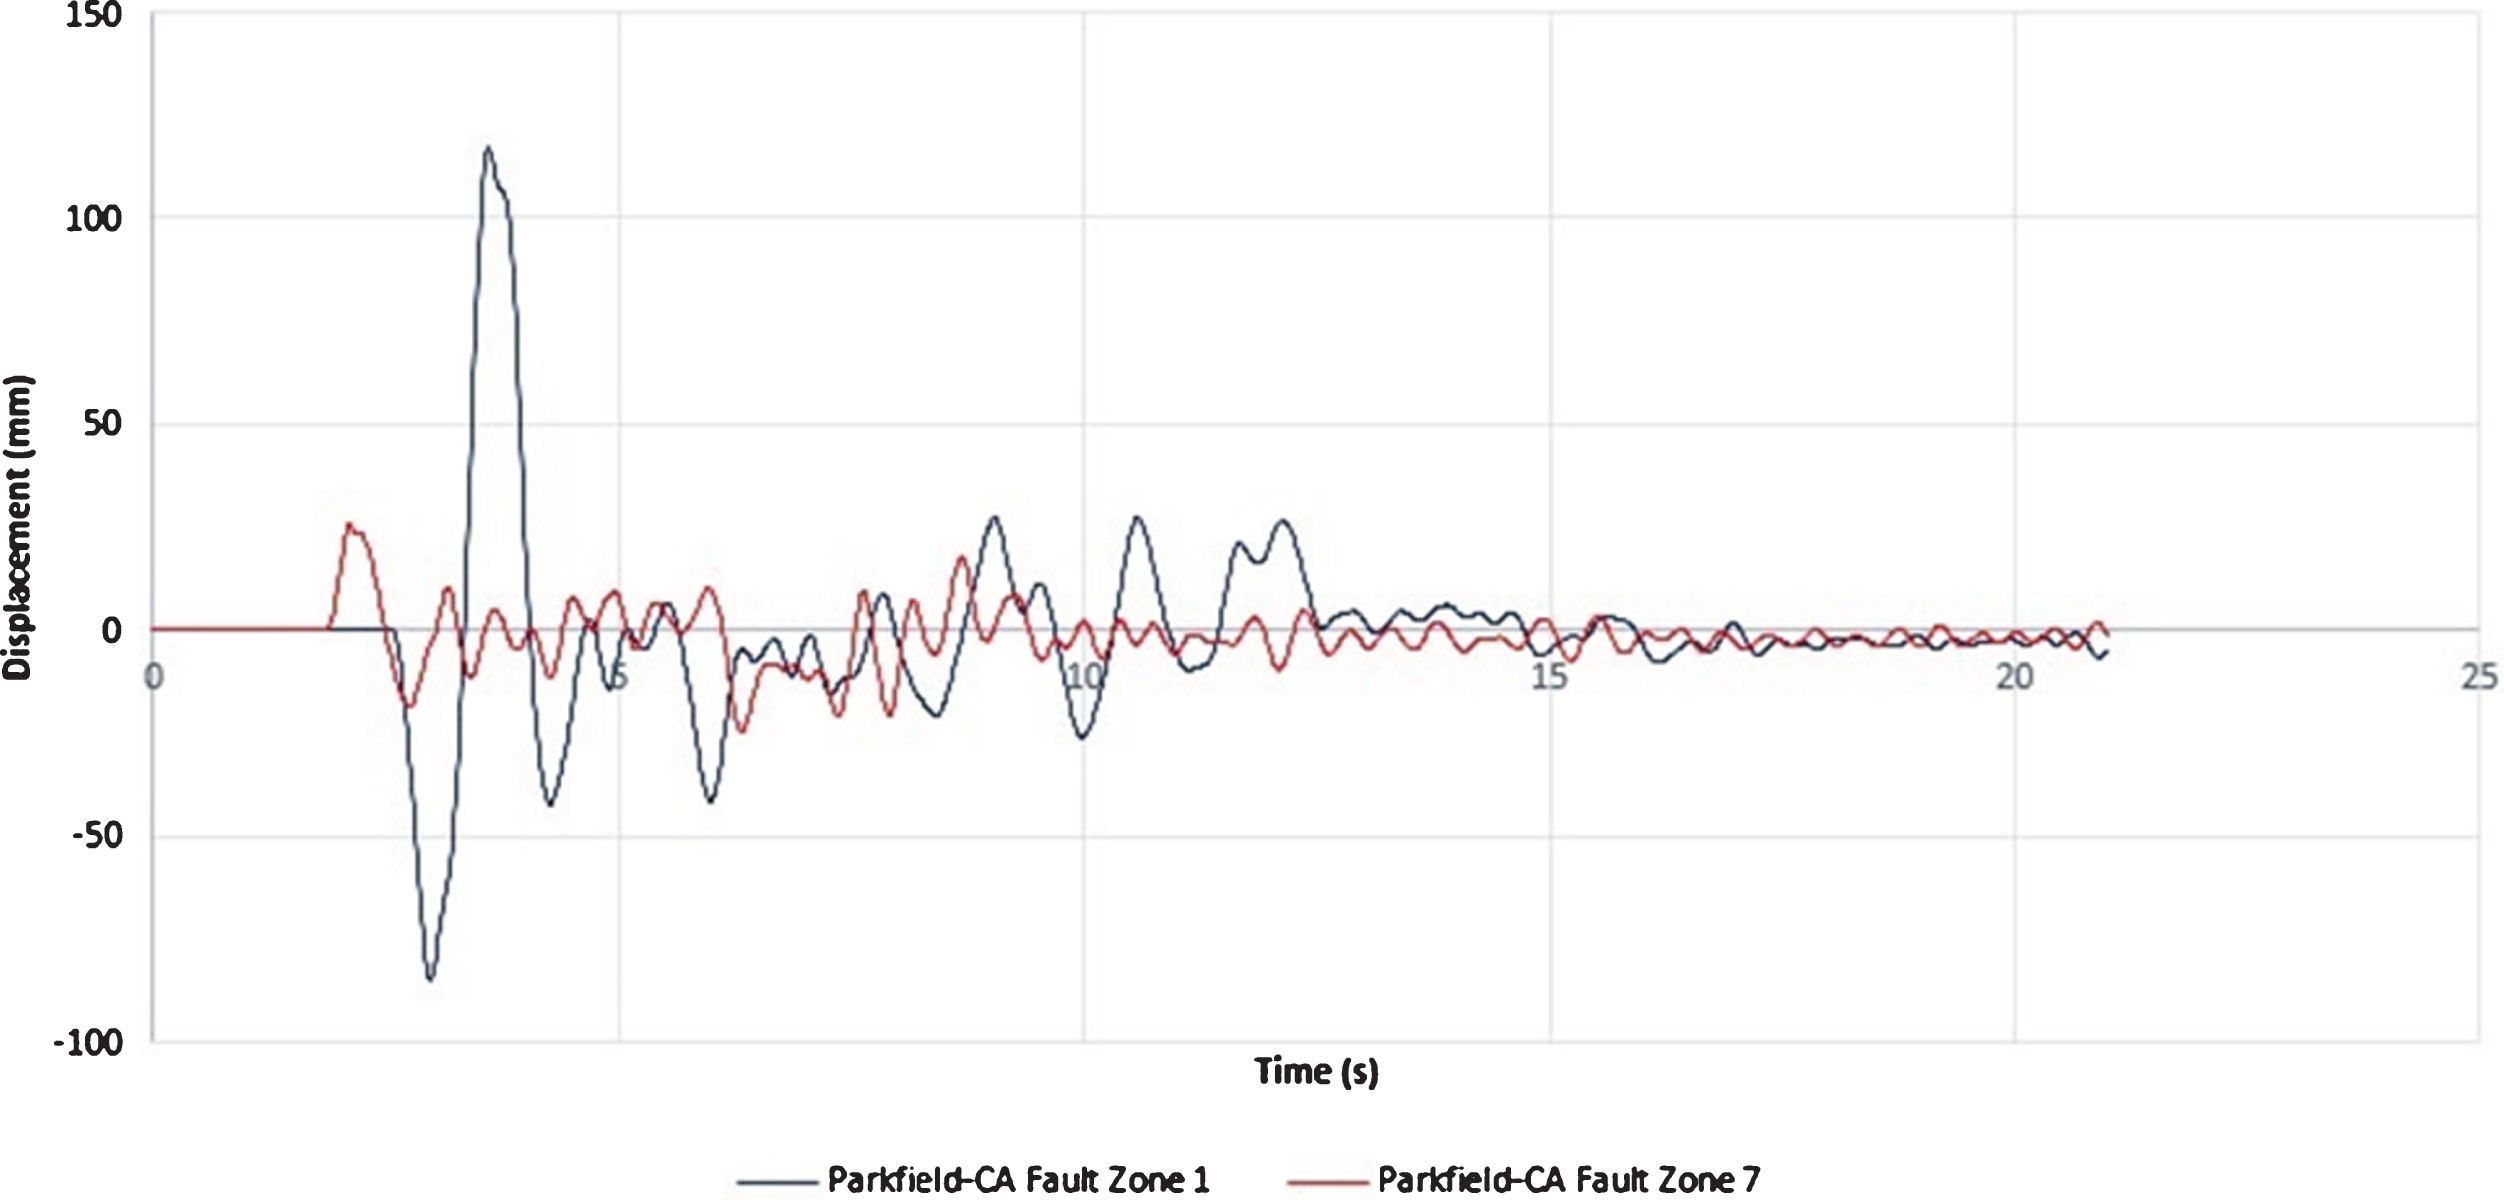
Table 3
The maximum base shear and deck displacement ratios of bridges
| Bridge types | Base shear ratio | Deck displacement ratio |
| Span30m | 1.401 | 6.5 |
| Span15m | 1.455 | 4.5 |
8Conclusions
According to influence line diagrams, under a gravity load, the bridge with longer span tolerated more moment than the other one. According to the results of the modal analysis, the period of structures in which the friction pendulum system was used depends only on the isolator’s geometry. Using the velocity time history and spectral acceleration response diagrams, the Parkfield 2004 earthquake directivity feature was proved. Then, according to the first mode periods of the studied structures, the most critical angle of applying force was determined. After nonlinear time history analysis, it was observed that the base shear created on the bridges depends on the bridge span-length, so that the bridge with longer span-length faced with higher base shear force. In both bridges, under all earthquakes, it was observed that the ratio of acceleration on the superstructure to the substructure is small, which indicates the proper behavior of the FPS. However, it was observed that in the superstructure of the bridge with smaller span-length reducing acceleration was more perceptible than the other, and the isolator at the shorter span-length bridge exhibited a more appropriate behavior. After analyzing the bridges using Parkfield 2004 earthquake rotated records, it was shown that in both bridges the base shear under record of the side with directivity was more than the other side. However, there was no significant difference between the ratios of the maximum base shear of the side with directivity and the other side. The deck displacement was not dependent on the span-length of the bridges, and only depended on the frequency content and the earthquake directivity effect. So that the deck displacement in both bridges on the side with directivity was more than the other side, which this increase in the structure’s displacement could cause pounding between the bridge deck and the abutments. For this reason, it seems necessary to investigate the appropriate expansion joints considering the effect of directivity of the earthquake in the future studies.
References
[1] | Choi E , DesRoches R , Nielson B . Seismic fragility of typical bridges in moderate seismic zones. Engineering Structures. (2004) ;26: :187–199. Doi: 10.1016/j.engstruct.2003.09.006 |
[2] | Bessason B , Haflidason E . Recorded and numerical strong motion response of a base-isolated bridge. Earthquake Spectra. (2004) ;20: (2):309–32. https://earthquakespectra.org/doi/10.1193/1.1705656 |
[3] | Hreinsdóttir S , Árnadóttir T , Decriem J , Geirsson H , Tryggvason A , Bennett RA , LaFemina P . A complex earthquake sequence captured by the continuous GPS network in SW Iceland. Geophysical Research Letters. (2009) ;36: (12):L12309. Doi: 10.1029/2009GL038391 |
[4] | Shen J , Tsai MH , Chang KC , Lee GC . Performance of a seismically isolated bridge under bear-fault earthquake ground motions. Journal of Structural Engineering. (2004) ;130: (6):861–68. Doi: https://ascelibrary.org/doi/abs/10.1061/%28ASCE%290733-9445%282004%29130%3A6%28861%29 |
[5] | Liao WI , Loh CH , Lee BH . Comparison of dynamic response of isolated and non-isolated continuous girder bridges subjected to near-fault ground motions. Engineering Structures. (2004) ;26: (14):2173–83. Doi: 10.1016/j.engstruct.2004.07.016 |
[6] | Eröz M , DesRoches R . Bridge seismic response as a function of the Friction Pendulum System (FPS) modeling assumptions. Engineering Structures. (2008) ;30: :3204–12. Doi: 10.1016/j.engstruct.2008.04.032 |
[7] | Naeim F , Kelly JM . Design of Seismic Isolated Structures: From Theory to Practice. John Wiley & Sons; (1999) . |
[8] | Taylor AW , Igusa T . Primer on seismic isolation. American Society of Civil Engineers, USA; (2004) . |
[9] | Eröz M , DesRoches R . The influence of design parameters on the response of bridges seismically isolated with the Friction Pendulum System (FPS). Engineering Structures. (2013) ;56: :585–599. Doi: 10.1016/j.engstruct.2013.05.020 |
[10] | Zayas V , Low SS , Mokha A , Imbsen R . The FPS earthquake resisting system. Report number: UCB/EERC-87/01, Earthquake Engineering Research Center, Berkeley, California; (1987) . |
[11] | Tsopelas P , Constantinou MC , Kim Y , Okamoto S . Experimental study of FPS system in bridge seismic isolation. Earthquake Engineering and Structural Dynamics. (1996) ;25: (1):65–78. Doi: 10.1002/(SICI)1096-9845(199601)25:1%3C65::AID-EQE536%3E3.0.CO;2-A |
[12] | Jangid RS . Seismic response of isolated bridges. Bridge Engineering. (2004) ;9: (2):156–166. Doi: 10.1061/(ASCE)1084-0702(2004)9:2(156) |
[13] | Iranian Standards No. 139 (Standard Loads for Bridges). Office of the Deputy for Technical Affairs, Bureau of Technical Affairs and Standards, Management and Planning Organization, Tehran; 2000. |
[14] | AASHTO LRFD Bridge Design Specifications. Washington, DC; 2012. |
[15] | Castaldo P , Palazzo B , Della Vecchia P . Seismic reliability of base-isolated structures with friction pendulum bearings. Engineering Structures. (2015) ;95: :80–93. Doi: 10.1016/j.engstruct.2015.03.053 |
[16] | Iranian Standards No. 463. (Road and Railway Bridges Seismic Resistance Design). Office of Deputy for Strategic Supervision Bureau of Technical Execution System, Tehran; 2008. |
[17] | Baker J , Shahi S . Pulse Classifications from NGA West2 database; (2012) . |
[18] | Vatanshenas A . Investigation of PTMD system affected by Parkfield near-field Earthquake. Modern Applied Science. (2017) ;11: (4):70–9. Doi: 10.5539/mas.v11n4p70 |
[19] | Vatanshenas A , Rohanimanesh MS , Mohammadiha E . Investigating the performance of viscoelastic dampers (VED) under near-field earthquakes with directivity feature. Civil and Environmental Engineering. (2018) ;14: (1):21–27. Doi: 10.2478/cee-2018-0003 |

