
Effects of Intravenously Administered Plasma from Exercise-Trained Donors on Microglia and Cytokines in a Transgenic Rat Model of Alzheimer’s Disease
Abstract
Background:
Microglia and inflammation play a significant role in Alzheimer’s disease (AD). Physical exercise and peripheral signals can influence microglial activity in the brain. Modulating the inflammatory response in the brain may provide therapeutic approaches for AD.
Objective:
To assess the effects of intravenously administered blood plasma from exercise-trained donor rats on cognitive function, microglia, and cytokine levels in an AD rat model at two different pathological stages; an early pre-plaque stage and a later stage closer to the emergence of extracellular plaques.
Methods:
Male transgenic McGill-R-Thy1-APP rats aged 2 and 5 months received 14 injections over 6 weeks: 1) plasma from exercise-trained rats (ExPlas), 2) plasma from sedentary rats (SedPlas), or 3) saline. Cognitive function was evaluated in a novel object recognition task. Microglia count and morphology were analyzed in cornu ammonis, dentate gyrus, entorhinal cortex, and subiculum. Amyloid plaque number and size were assessed in the rats with the later treatment start. A multiplex assay was used to measure 23 cytokines in cornu ammonis.
Results:
In rats treated from 2 months of age, ExPlas and SedPlas increased number and length of microglial branches in cornu ammonis and dentate gyrus compared to saline. Only ExPlas-treated rats exhibited similar changes in subiculum, while entorhinal cortex showed no differences across treatments. Microglia count remained unaffected. In rats treated from 5 months of age, there were no significant differences in microglia count or morphology or the number or size of amyloid plaques in any brain region. Compared to both other treatments in early pre-plaque stage rats, SedPlas increased TNF-α levels. ExPlas upregulated GM-CSF, IL-18, and VEGF, while SedPlas increased IL-10 compared to saline. In later-stage rats, ExPlas upregulated IL-17, and SedPlas upregulated TNF-α compared to saline. There were no effects of treatments on recognition memory.
Conclusions:
Intravenous injections of blood plasma from exercise-trained and sedentary donors differentially modulated microglial morphology and cytokine levels in the AD rat model at an early pre-plaque stage of pathology. Exercised plasma may reduce proinflammatory TNF-α signaling and promote microglial responses to early Aβ accumulation but the lack of treatment effects in the later-stage rats emphasizes the potential importance of treatment timing.
INTRODUCTION
Alzheimer’s disease (AD) is a neurodegenerative disorder and the leading cause of dementia worldwide [1]. Pathologically, it is characterized by the progressive accumulation and deposition of amyloid-beta (Aβ) and hyperphosphorylated tau proteins into plaques and neurofibrillary tangles in the brain. A neuroinflammatory response, largely mediated by microglial responses to the neurotoxic effects of Aβ build up, plays a key role in early AD pathogenesis [2]. As the current pharmacological treatments for AD only provide limited functional benefits, it is crucial to test novel therapeutic strategies that could effectively target the early aspects of AD pathology.
Microglia are the predominant immune cell population in the brain and play a crucial role in maintaining brain homeostasis. For this purpose, they actively survey the brain and respond to various signals in the local and systemic environment. Depending on the stimuli, microglia can acquire different phenotypes or functional states that aim to maintain homeostasis and protect the brain [3]. Morphological changes in microglia can serve as indicators of their functional state. Homeostatic surveying microglia generally have a ramified morphology with long and highly branched projections [4], whereas microglia responding to Aβ have an enlarged cell body and shorter, less branched projections [5]. The accumulation of soluble Aβ species and associated neuron-derived pro-inflammatory cytokines can trigger microglial response as soon as the early pre-plaque stages [6]. Initially, this response may be beneficial as microglia have the ability to phagocytose Aβ, but chronic microglial activation and excessive production of pro-inflammatory cytokines have been associated with impaired Aβ clearance, depressed neurogenesis and promoted neurodegeneration [4, 7–9]. Studying microglial morphology and cytokine levels could therefore inform about microglial function and the inflammatory state of the brain in general.
Exercise training has garnered significant attention as a potential preventive and therapeutic intervention for AD due to its multifaceted effects on brain health and cognitive function [10]. However, its limited feasibility in patients highlights the need for alternative approaches that build upon this knowledge. Exercise has been shown to promote brain plasticity and improve cognitive function in both animal models and human studies [11–14]. Studies in various animal models have provided further insight into associated effects of exercise, showing reduced brain atrophy, promoted hippocampal neurogenesis, and reduced systemic and neuroinflammation [15–18].
Accumulating evidence suggests that bio-molecules in blood play an important role as mediators of the exercise effects on the brain [10, 19]. While considerable data supports the beneficial effects of young blood treatment on several tissues, including the brain in aged animals [20, 21], less is known about the effects of blood from exercised donors in aging or diseased brains. Emerging studies have shown that administering blood from voluntarily exercised young or aged donor mice into sedentary mice of the same age confers beneficial effects of exercise on hippocampal neurogenesis and cognitive function [18, 22]. In the case of young mice, the observed effects may be partly attributed to reduced neuroinflammation, as indicated by reduced expression of inflammatory genes in the hippocampi of both healthy sedentary young mice and mice with lipopolysaccharide-induced neuroinflammation [18].
In line with the studies in healthy mice and a study in a mouse model of AD [23], we subsequently found exercised plasma transfusions to promote adult hippocampal neurogenesis in the transgenic McGill-R-Thy1-APP rat model of AD [24]. We found that these effects may be at least partly attributed to reduced levels of proinflammatory cytokines in the plasma from exercise-trained donors compared to the plasma from sedentary donors [24]. Here, we aimed to expand these findings by investigating the effects of exercised plasma injections on microglia and cerebral cytokine levels in the transgenic rat model of AD at two stages of AD development. We hypothesized that exercised plasma transfusions would reduce signs of microglial response to Aβ and lower the levels of proinflammatory cytokines in the brain of AD rats representing both an early pre-symptomatic stage and a later symptomatic stage of AD.
METHODS
Animal model
We utilized the McGill-R-Thy1-APP transgenic rat model for AD, which expresses the hAPP751 with Swedish KM670/671NL and Indiana V717F mutations controlled by the mouse Thy1.2 promoter [25]. We first included male homozygous AD rats (n = 3, age mean±standard deviation; 6.9±0.10 months) and non-transgenic littermates (wild type, n = 3, age 6.8±0.10 months) for characterization of changes in microglial morphology when untreated. At this age, the AD rats present the initial extracellular amyloid plaque pathology [24, 25].
Male homozygous AD rats at an early pre-plaque pathology stage (n = 20, age 2.2±0.14 months) and at a later stage closer to the emergence of extracellular plaques (n = 23, age 5.0±0.20 months) were then randomly assigned for transfusion treatment: one group receiving plasma from young, exercise-trained Wistar rats (ExPlas, n = 7, both age groups), one receiving plasma from sedentary, young Wistar rats (SedPlas, n = 7, both age groups), and one receiving 0.9% NaCl (saline, n = 6 younger, n = 9 older). Defined by their age and pathology stage, we later refer to these rats as early-stage and later-stage rats, respectively. Plasma for the treatment groups was obtained from male donor rats that, starting at the age of 1.3±0.50 months, were either subjected to 6 weeks of exercise training (n = 48) or remained sedentary (n = 48) in their standard housing conditions. The saline injections served as a control treatment allowing us to discern the specific effects of plasma transfusions from the potential confounding factors associated with the injection procedures and associated handling.
All rats were housed two or three together in standard ventilated cages (sized 34×45×20.5 cm) at the Comparative Medicine Core Facility (NTNU). They were on a 12-hour reversed light cycle (darkness from 7 am to 7 pm) and provided with standard rodent chow and water ad libitum, at 23°C and 70% humidity. All rats had access to a plastic opaque house and a wooden stick as environmental enrichment and were acclimatized to the facility for two weeks before the start of any experiments.
The study was carried out following the Norwegian regulations on animal experimentation. All experimental procedures were approved by the competent authority for animal research at the Norwegian Food Safety Authority (FOTS ID 11740/2017) and are in compliance with the Norwegian Animal Welfare Act §§1–28, Norwegian Regulations on Animal Research §§1–26 and European Convention for the Protection of Vertebrate Animals used for Experimental and Other Scientific Purposes.
Exercise training protocol for Wistar donor rats
The Wistar donor rats followed a 6-week exercise training protocol as described more in detail previously [24]. Briefly, the exercise regimen consisted of high-intensity interval training on treadmills (Columbus Instruments, OH, USA) with 25° incline, performed 5 times per week. Each session started with a 10-minute warm-up at 6 m/min before repeating 10 rounds of 4-minute high-intensity intervals with 2-minute active resting period between each round. The intensity of the intervals was kept at approximately 80–90% of the rats’ peak oxygen uptake throughout the training period by progressively increasing the treadmill speed from the initial 12 m/min to 18 m/min. The efficacy of the training protocol in improving peak oxygen uptake was confirmed using a graded maximal exercise protocol in an enclosed treadmill with an indirect open circuit calorimeter system (Oxymax, Columbus Instruments, OH, USA) as described in our previous publication [24]. The last exercise session was performed 3 hours prior to collection of blood from the donors.
Rat donor plasma collection
For the collection of blood plasma, rats were deeply anesthetized with 5% isoflurane before a cardiac puncture to the left ventricle and drawing the blood in citrate tubes. After centrifugation at 2200 RCF for 10 minutes at +4°C, plasma was collected, pooled, and stored at –80°C until use. At the time of blood collection, the donors were 2.9±0.40 months old.
Plasma injections
The AD rats received a total of 14 injections of either saline, ExPlas, or SedPlas administered intravenously in the tail vein. The injections were administered 2 to 3 times per week over 6 weeks, each time adjusted to the maximal recommended dose of 2 mL/kg body weight [26]. The injection frequency was adapted from that outlined in the study by Villeda et al. [21] and adjusted to suit the extended treatment duration. The last injections were given 48 hours before euthanasia. All injections were given under anesthesia (5% induction, 2.5% maintenance isoflurane). The early-stage rats were 3.7±0.20 months old (mean age±standard deviation), and the later-stage rats were 6.6±0.20 months old at the end of the injection treatment periods.
Test of cognitive function
Both the untreated AD rats (n = 3) and non-transgenic littermates (n = 3) and all the AD rats treated with intravenous injections (total n = 20 early-stage AD rats and n = 23 later-stage AD rats) performed a test of recognition memory at the end of the treatment period. The novel object recognition test was performed as previously described [24]. Briefly, the rats were individually tested in a circular arena with uniform color and a camera overhead. On the first day, they were let to explore empty arena for 15 minutes. The following three days, same two identical objects were placed in the arena before the rats were allowed to explore the arena for 10 minutes each day. On the fifth day, one of the objects was replaced with a novel object before the rats were let to explore the arena. The distance travelled, latency to the first encounter of the objects, number of times exploring objects, and total time spent exploring the objects over the first 2 minutes in the test arena were recorded using the Any-maze video tracking system and software (Stoelting Europe, Dublin, Ireland). Two indices for recognition memory were calculated [27]. The Discrimination Index was calculated by dividing the difference in time spent exploring the novel and familiar objects by the total time spent exploring either object. The Novelty preference was calculated as the percentage of novel object exploration time relative to the total time spent exploring either object during the first 2 minutes. Testing was conducted in a controlled environment with consistent procedures, and the experimenter was blinded to treatment conditions.
Brain tissue collection and sectioning
Half of the rats receiving the transfusion treatments were randomly assigned to brain fixation (early-stage rats treated with ExPlas n = 3, SedPlas n = 4, saline n = 3; later-stage rats treated with ExPlas n = 4, SedPlas n = 4, saline n = 3) and the other half to fresh tissue collection (early-stage ExPlas n = 4, SedPlas n = 3, saline n = 3; later-stage ExPlas n = 3, SedPlas n = 3, saline n = 6). The rats assigned to tissue fixation were transcardially perfused with Ringer’s solution (0.85% NaCl, 0.025% KCl, 0.02% NaHCO3; pH 6.9) and 4% paraformaldehyde (Merck kGaA, Darmstadt, Germany) using a Unified Masterflex Drive peristaltic pump (Thermo Fisher Scientific, MA, USA). The brains were post-fixated in 4% paraformaldehyde for 24 hours at +4°C and then transferred to 2% dimethyl sulfoxide in 0.1 M phosphate buffer (PB) with 20% glycerol (Sigma-Aldrich, MO, USA) and stored at +4°C until sectioning. The rats assigned to fresh brain tissue collection were similarly anesthetized with 5% isoflurane in a chamber and weighed before collecting, dissecting, and snap freezing the tissue.
The paraformaldehyde-fixed brains were sectioned serially at 40μm in a coronal plane using a freezing microtome (Microm HM430, Thermo Fisher Scientific, MA, USA). Five equally spaced series were stored at +4°C in tubes with 2% dimethyl sulfoxide in 0.1 M phosphate buffer with 20% glycerol, and one series mounted on SuperFrost Plus Adhesion Slides (Thermo Fisher Scientific, MA, USA) for histological orientation.
Immunofluorescence for microglial analyses
For assessing microglial morphology, sections were incubated with sodium citrate buffer (10 mM sodium citrate, 0.05% Tween 20, pH 6.0) in a water bath at 60°C for 45 minutes to unmask the binding sites. After rinsing with TBS (pH 8.0), non-specific binding sites were blocked by incubating in 10% goat serum in TBS with 0.5% Triton-X-100 (pH 8.0) for 60 minutes. The sections were then incubated with rabbit monoclonal antibody to Iba1 (1 : 2000 in TBS with 0.5% Triton-X-100, Abcam Cat# ab178846, RRID: AB_2636859) at 4°C overnight. The following day, the sections were rinsed in TBS with 0.5% Triton-X-100 and then incubated with Goat anti-rabbit IgG H& L Alexa Fluor 594 (1 : 100 in TBS, Abcam, ab150080, RRID: AB_2650602) for 60 minutes. After rinses in TBS, the sections were mounted on SuperFrost Plus Adhesion Slides (Thermo Fisher Scientific, MA, USA).
Detection and quantification of microglia
Microglia in the dorsal subiculum, intermediate cornu ammonis (CA), dorsal dentate gyrus (DG), and lateral entorhinal cortex (EC) of the hippocampal formation were imaged using a Zeiss LSM 510 Pascal Confocal microscope (Carl Zeiss AG, Oberkochen, Germany) with Plan-Neofluar 40×/1,3 Oil DIC objective lens and 561 nm laser to excite the Alexa Fluor 594 fluorophore. To allow for morphological analyses, Z-stacks covering the entire 40μm depth of the Iba1-immunostained sections were acquired at 1μm intervals with a resolution of 1024×1024 pixels. A total of 6 Z-stack images were acquired from 3 sections (intersection distance 240μm, bregma range –5.60 to –6.04 [28]) per rat brain region.
Analyses of microglial count and morphology were performed on the images in Fiji software [29] utilizing a script written on the basis of a previously described protocol for morphological analyses of microglia [30]. The script first merged the raw images into Z-projections which were further processed for enhanced contrast and visibility of microglial processes and their branching prior to thresholding and skeletonizing the image. Analyze Skeleton plugin [31] was then run with circle pruning of the shortest branch and the detailed information about branch count and length were collected for statistical analyses. Minor fragments of less than 1μm were excluded from confounding the analyses. Number of Iba1-positive cells were manually counted in Z-projections with enhanced contrast using the Cell Counter plugin by two or three treatment-blinded investigators. Third counting was performed in images with more than 2 cells deviation in the two first counts. The number of microglia in each image was determined as the average of the counting results from two investigators allowing for a maximum deviation of 2 cells. For estimation of microglial ramification in each region of interest, the total number and length of branches from the 6 complementary images were divided by the respective total number of microglia.
As an additional method to assess microglial morphology and activation within the same Z-projections, the cell body to cell size ratio of microglia was measured using a distinct Fiji script written in alignment with a previously described protocol [32]. Initially, the script processed the Z-stack projections by employing default thresholding to binarize the images, effectively isolating the microglia from the background. Subsequently, the script executed the Analyze Particles function without imposing any pre-set size limitations. To specifically measure the total cell body size, the binarized images were further thresholded for selective removal of pixels outside the identified cell bodies. The Analyze Particles function was then run using a size filter set at 50 pixels to ensure the analysis concentrated on the cell bodies while excluding any remaining smaller objects within the images. Finally, the ratio of the total cell body size to the total cell size was calculated using totals obtained from the 6 images per region per rat brain.
Immunohistochemical staining and quantification of amyloid plaques
For regional investigation of amyloid plaque number and size, Aβ plaques were visualized in 3 sections per brain using an immunohistochemical staining protocol as also previously described [24]. The brain sections were unmasked by incubation in 125 mM phosphate buffer solution (pH 7.4) at 60°C for 2 hours before rinsing in fresh phosphate buffer solution and Tris-buffered saline with 0.5% Triton-X-100 (TBS-Tx; 50 mM Tris, 150 mM NaCl, pH 8.0). The sections were then incubated in 10% goat serum in TBS-Tx for 30 minutes to prevent nonspecific binding, before overnight incubation with anti-Aβ antibody McSA1 (MédiMabs; Cat# MM-0015-1P, RRID: AB_1807985, QC, Canada), 1 : 4000 in TBS-Tx.
The following day, the sections were rinsed in TBS-Tx before incubation in biotinylated goat anti-mouse secondary antibody (Sigma-Aldrich; Cat#B7401, RRID: AB_258619, MA, USA), 1 : 200 in TBS-Tx. After a rinse in TBS-Tx, the sections were incubated in avidin-biotin solution (Vectastain ABC kit, Vector Laboratories, CA, USA) for 90 minutes. Following rinses in TBS-Tx and Tris-HCl (pH 7.6), the sections were finally incubated in 3,3’-diaminobenzidine solution (3.1 mM in Tris-HCl) and mounted on SuperFrost Plus Adhesion Slides (Thermo Fisher Scientific, MA, USA).
Amyloid plaque detection and quantification
A slide scanner ZEISS Axio Scan.Z1 (Carl Zeiss Microscopy GmbH, Jena, Germany) was used for scanning the slides in brightfield mode with a Hitachi HV-F202SCL camera and a Plan-Apochromat 20×/0.8 objective. Images of 3 brain sections approximately within the bregma range -5.60 to –6.04 [28], were analyzed for the number and size of amyloid plaques specifically in the CA, dorsal DG, lateral EC, and dorsal subiculum utilizing Fiji software (Version 1.54e; National Institutes of Health, Bethesda, MD, USA) and a tailored script allowing manual region selection but automated thresholding and quantification. The optimal threshold was determined by comparing manually counted plaque numbers from original images with automated counts generated from processed images. The quantification step utilized the Analyze Particles function for summary of plaque number, size, and total area covered in the region of interest.
Multiplex immunoassay for cytokine detection
For comprehensive analysis of cytokines, intermediate CA tissue was collected from the ExPlas- (early-stage n = 4, later-stage n = 3), SedPlas- (early-stage n = 3, later-stage n = 3), and saline-injected AD rats (early-stage n = 3, later-stage n = 6), and homogenized and lysed using Dounce homogenizer and RIPA Lysis Buffer System (Santa Cruz Biotechnology, TX, USA). After mixing and 30 minutes of incubation on ice, the lysates were centrifuged at 15000 RCF, +4°C, for 15 minutes. Supernatants were transferred into new tubes with 0.22μm centrifugal filters (Ultrafree-MC Centrifugal Filter PVDF, Merck, Darmstadt, Germany) and filtered by spinning at 12000 RCF, +4°C, for 4 minutes. Protein quantification was performed using Pierce BCA Protein Assay Kit (Thermo Fisher Scientific, IL, USA) according to the manufacturer’s instructions.
Duplicate samples of isolated protein from the intermediate CA were analyzed using a Bio-Plex Pro Rat Cytokine 23-Plex Assay (Bio-Rad Laboratories, CA, USA), according to the manufacturer’s instructions. The plate was read using a Luminex 200 System (Luminex Corporation, TX, USA) and data was analyzed using the Bio-Plex Manager software (version 6.1).
Statistical analyses
Due to the exploratory nature of the study, without prior studies published using a similar approach, conventional power calculations could not be undertaken. This study should therefore be regarded as a proof-of-concept study building a foundation for future studies. All tests and analyses were conducted while blinded to the treatment given.
Two-tailed unpaired t-test was used for the analyses between untreated AD and wild-type rats. Otherwise, one-way ANOVA followed by Tukey post-hoc comparisons was used to analyze between-group differences. Spearman correlation analysis was used for examining associations between different cytokine levels in the intermediate CA in early- and later-stage AD rats, as well as associations between amyloid plaques and microglial parameters in different brain regions in all later-stage AD rats independent of the treatment. Only p-values<0.05 were considered as significant. All statistical analyses were performed using GraphPad Prism version 9.5.1 (GraphPad Software, LLC, MA, USA). Data are expressed as mean±standard error of the mean (mean±SEM).
RESULTS
Reduced complexity of microglial projections in the AD rat model at 6 months of age
The transgenic McGill-R-Thy1-APP rat model of AD expresses the mutated human APP gene, leading to intraneuronal Aβ accumulation already detectable from 1 week of age [25]. Prior to the emergence of first plaques around the age of 6 months in the subiculum, intraneuronal Aβ is detectable across the EC and hippocampal subiculum and CA areas at 3 months, with comparatively lower levels in DG [25]. To explore the regional effects of the emergence of Aβ plaques on microglia, we confirmed the presence of Aβ plaque pathology in untreated male AD rats (age mean±SD: 6.9±0.1 months; Fig. 1) and then assessed the number of microglia and their morphological complexity in the dorsal subiculum, intermediate CA, dorsal DG, and lateral EC regions of the brains from the AD rats and age-matched wild-type controls (age mean±SD: 6.8±0.1 months; Fig. 2). There were no statistically significant differences in recognition memory between these rats (Supplementary Figure 1).
Fig. 1
Amyloid plaques in the brain of a transgenic AD rat. A representative image of a brain section from a 6.8-month-old untreated male transgenic AD rat shows early amyloid plaque pathology (A). Majority of the plaques were within the subiculum (B), with less plaques seen in the cornu ammonis (C), dentate gyrus (D), and entorhinal cortex (E).
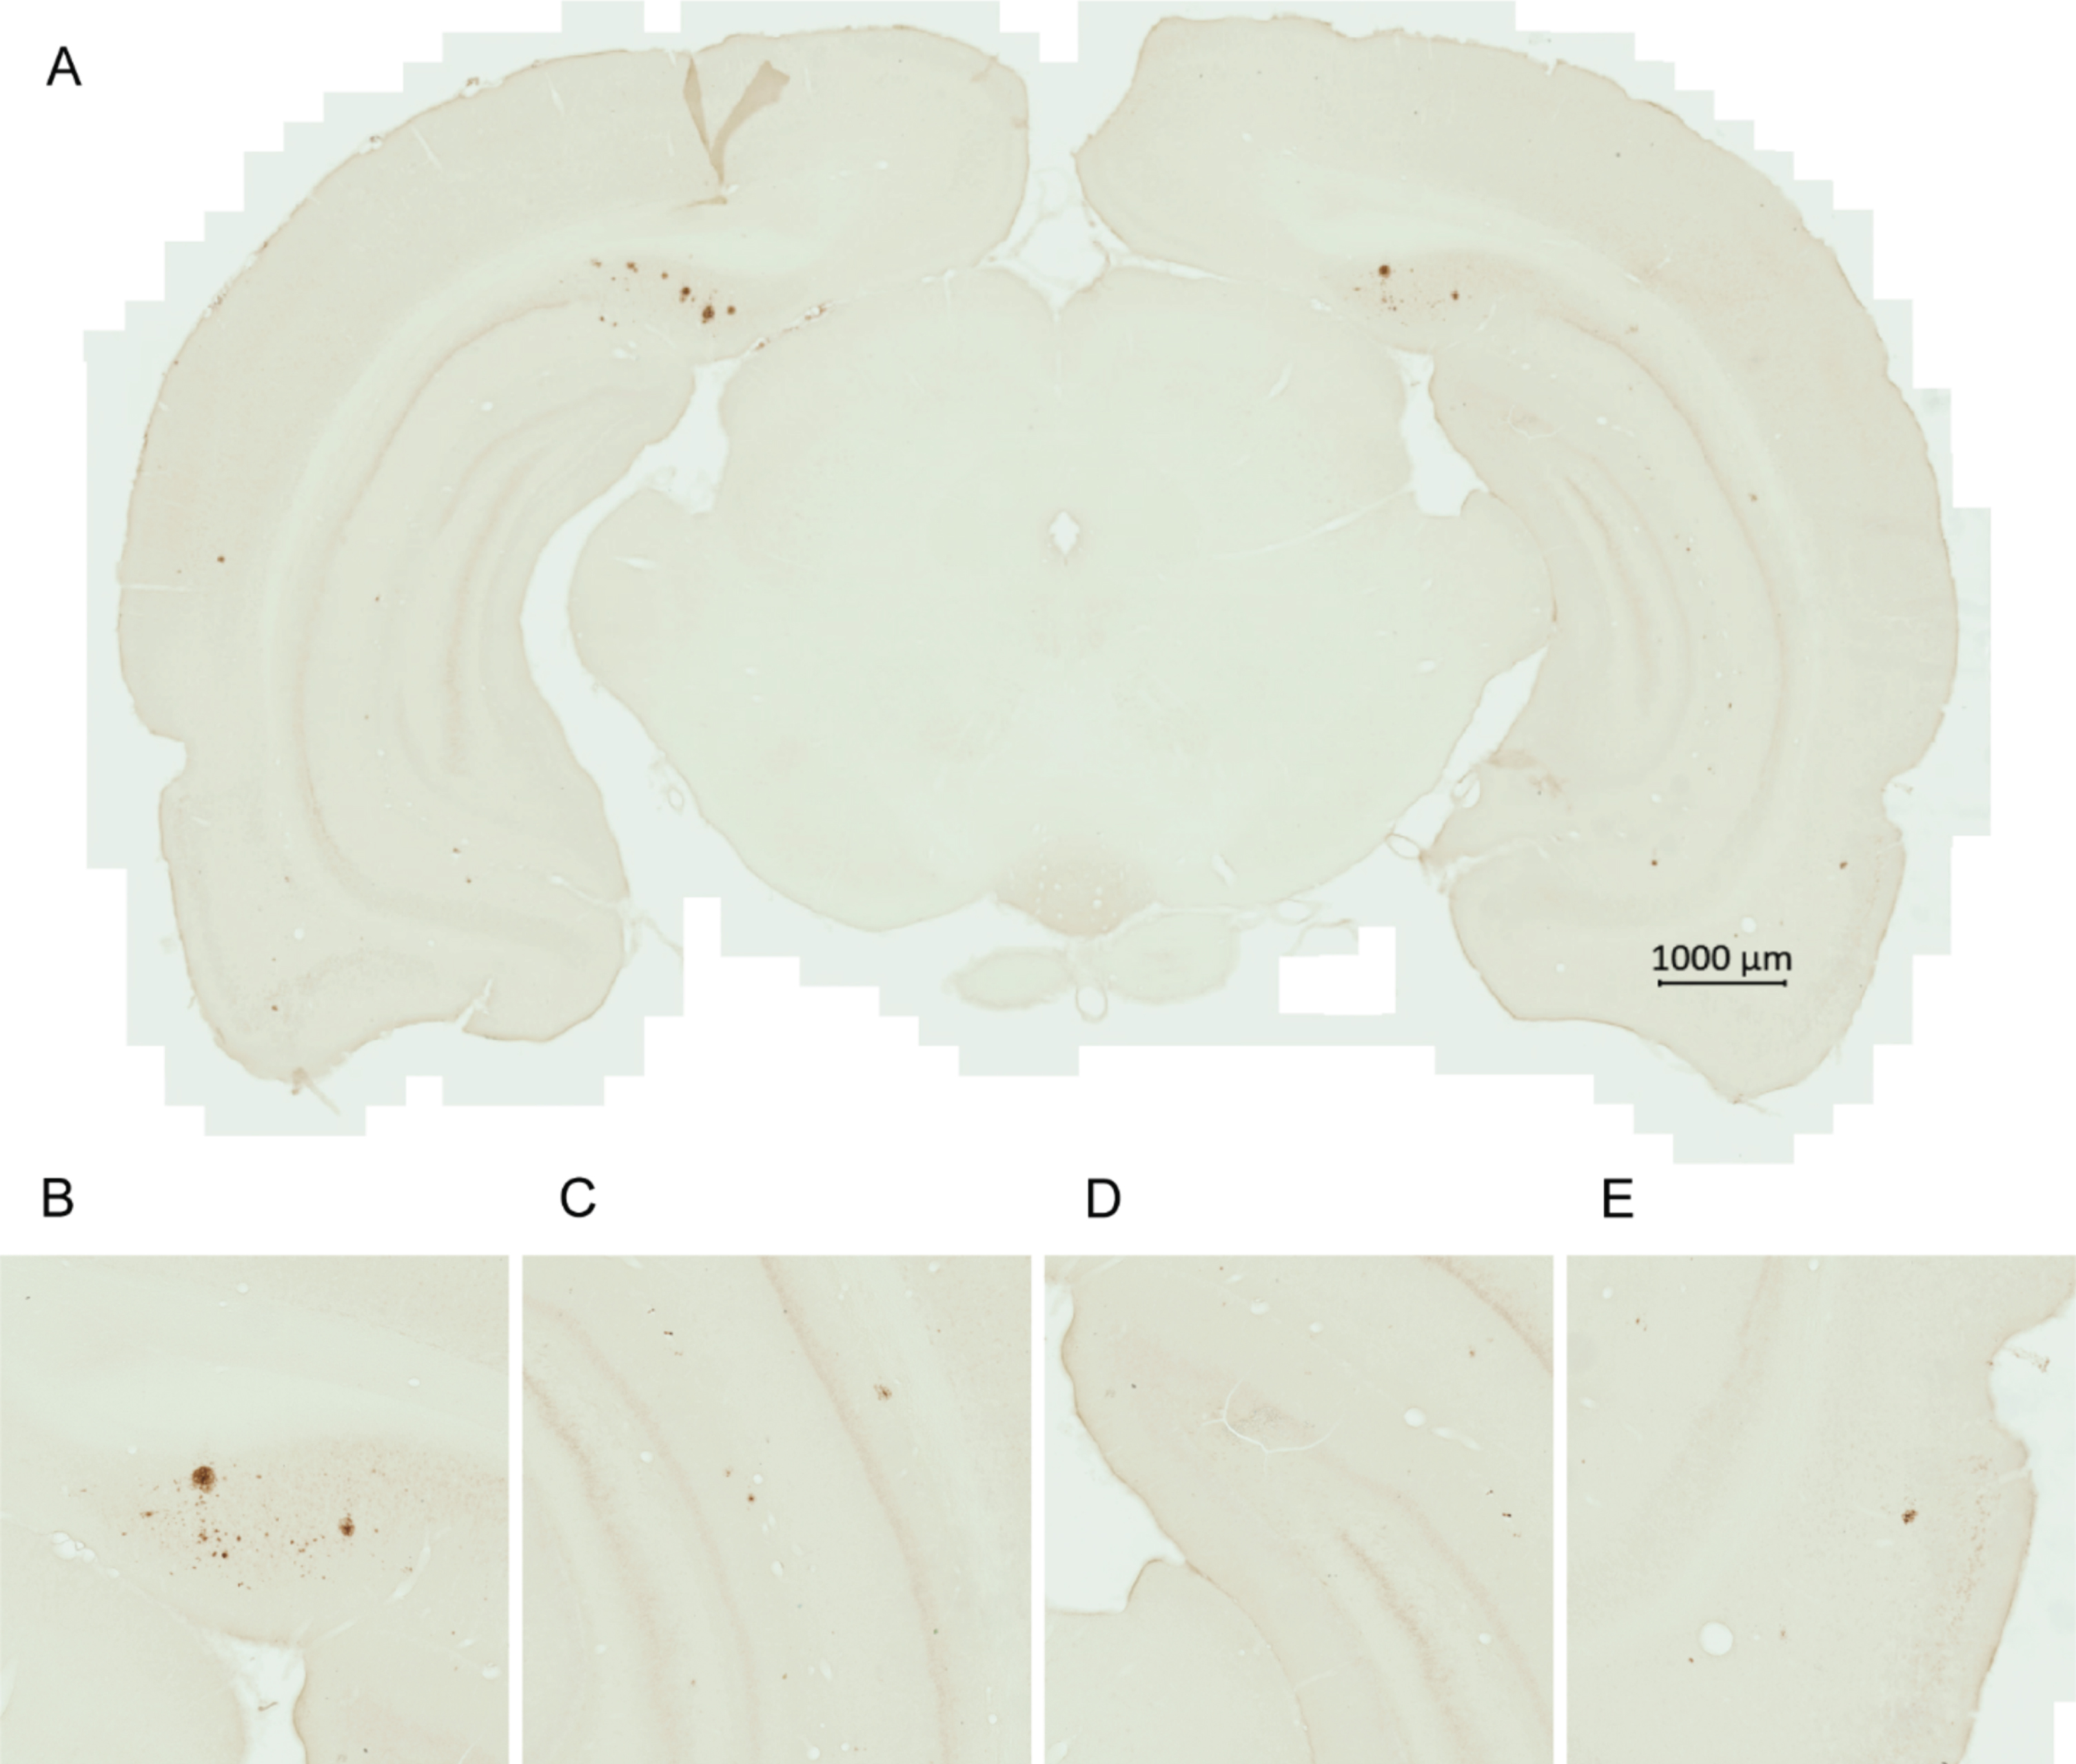
Fig. 2
Alterations in microglial morphology in the subiculum of the transgenic AD rats. The number of microglia and their morphological complexity was assessed in dorsal subiculum (A-D) of the AD rats (n = 3, age mean±standard deviation; 6.9±0.10 months) and the wild-type control rats (n = 3, age 6.8±0.10 months). Representative images of Iba1-staining of microglia in AD (E) and wild-type rats (F) with corresponding binary and skeletonized images for skeleton analysis and cell body size measurement. Two-tailed unpaired t-test, *p < 0.05, **p < 0.001.
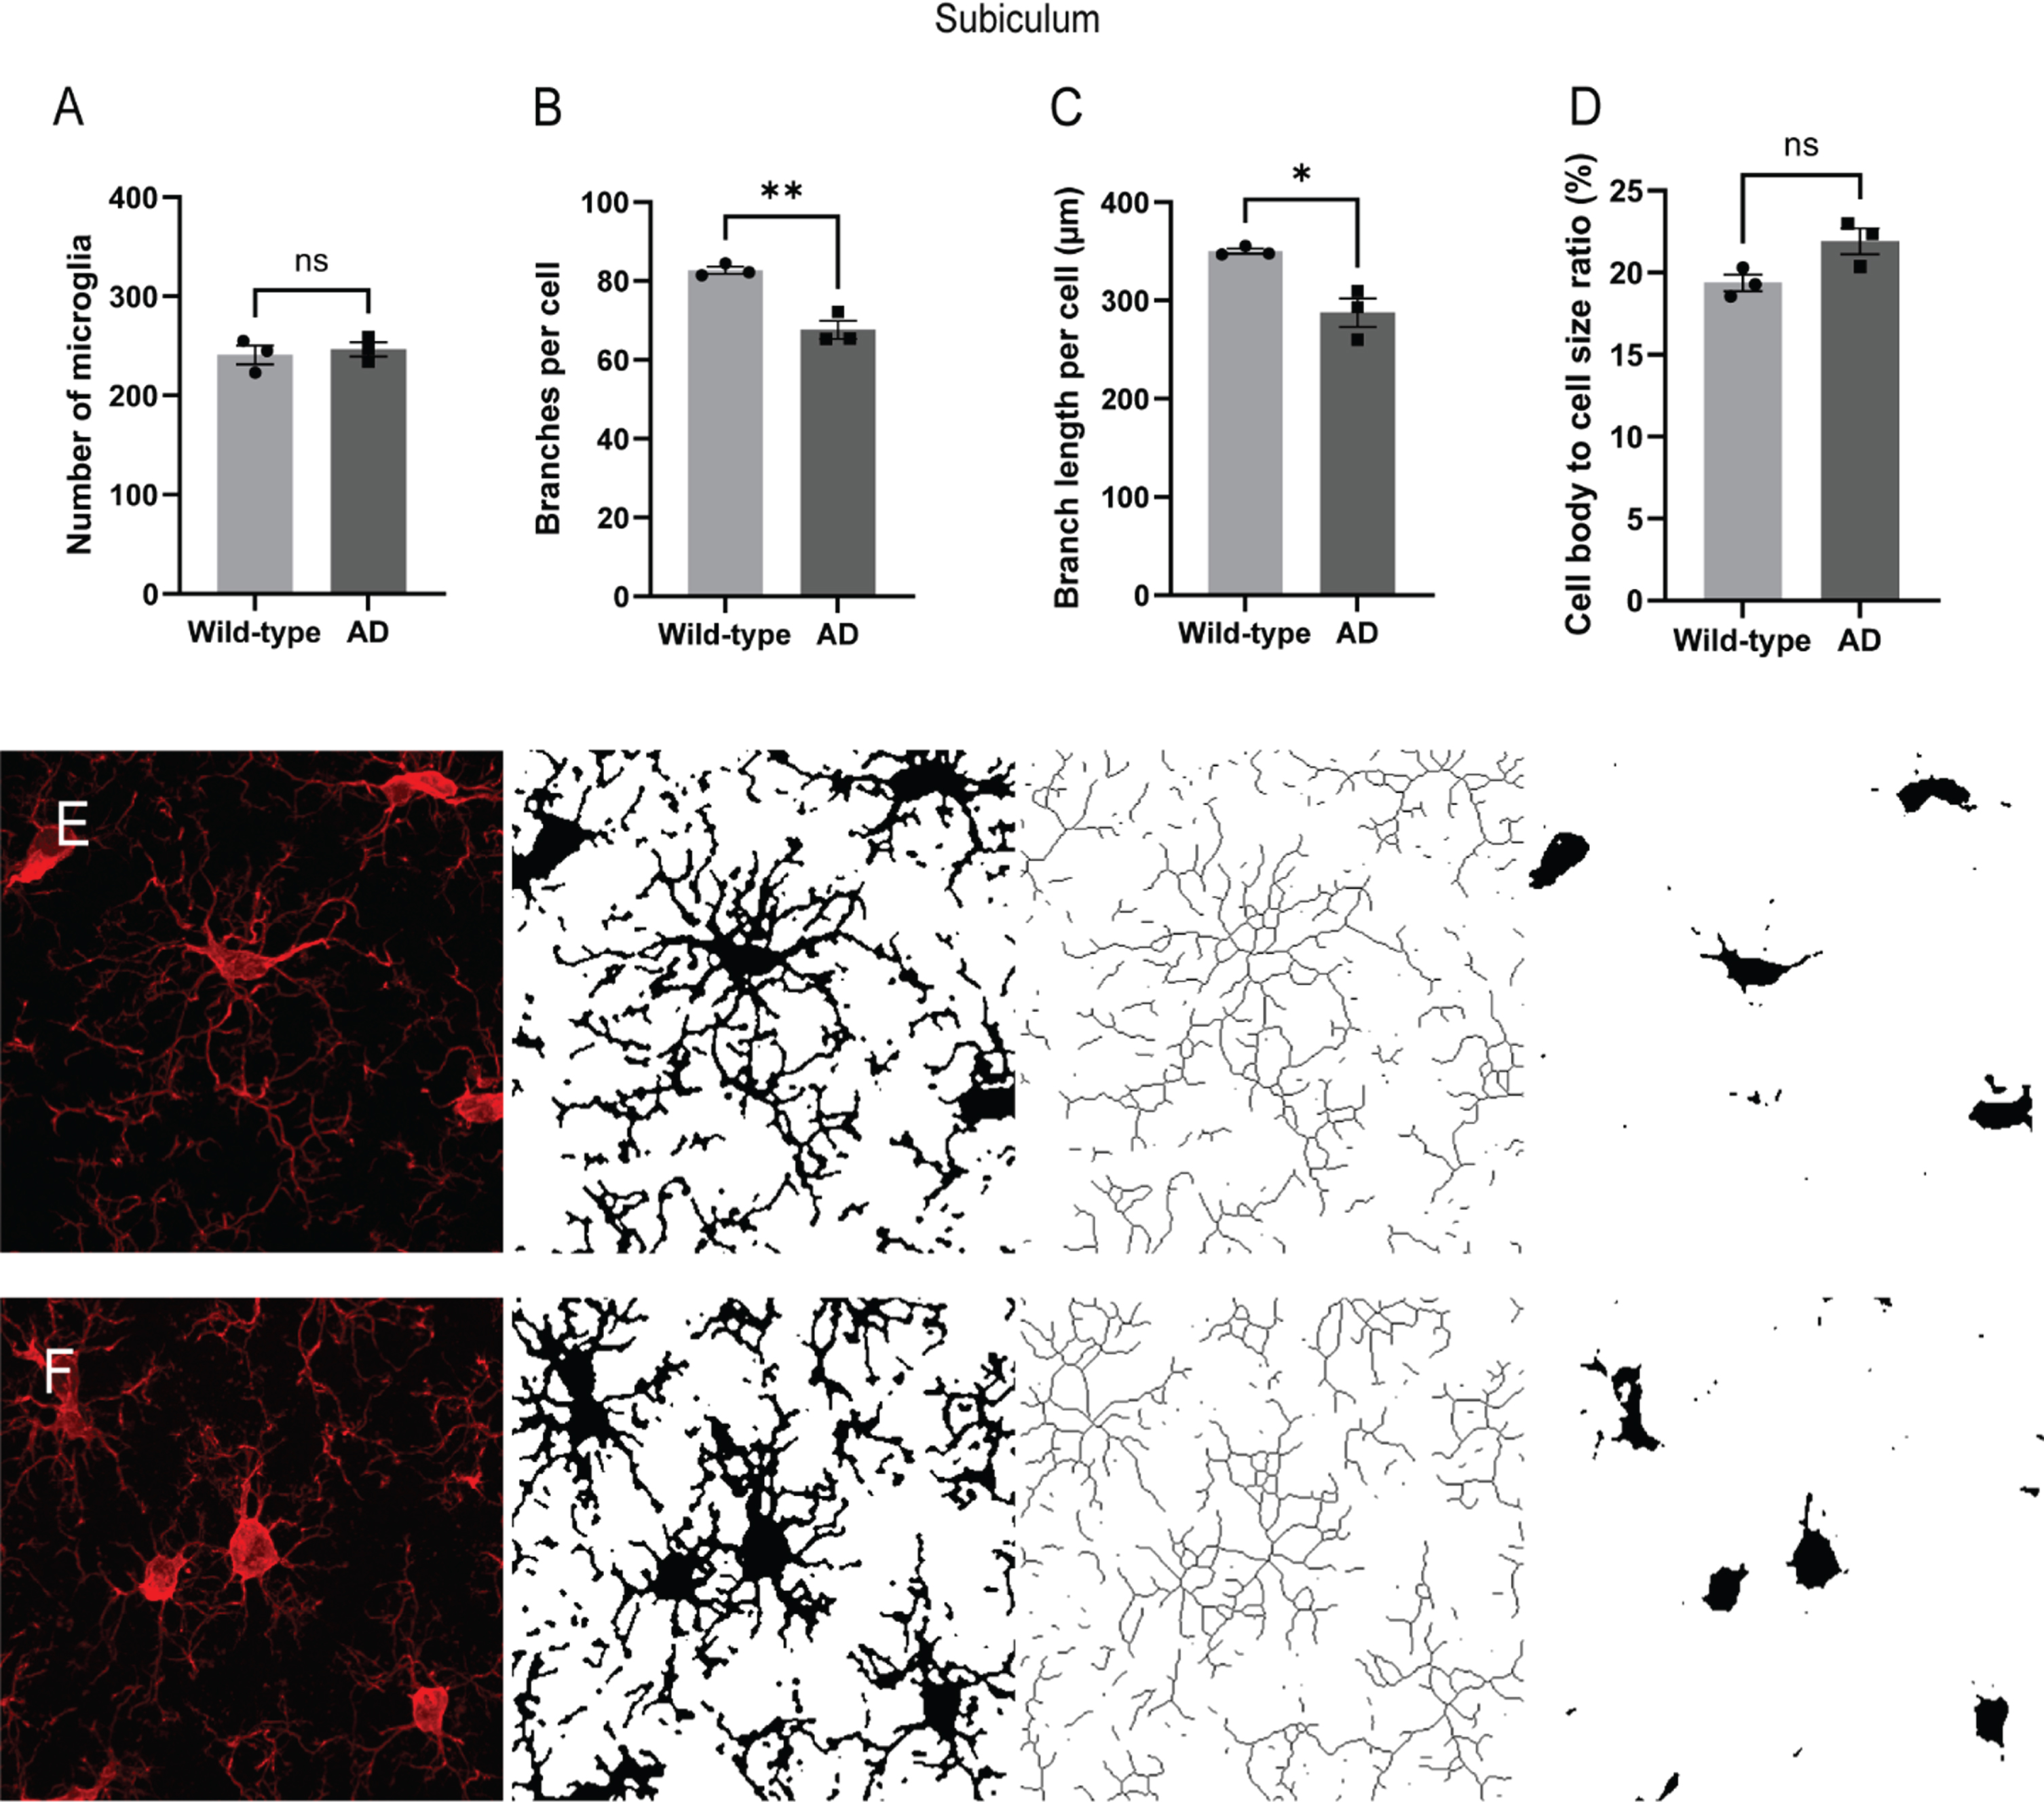
In the dorsal subiculum, there were no differences in the number of microglia between the AD rats and the wild-type rats (Fig. 2A). However, the total number and length of branches per microglia were significantly lower in the AD rats compared to the wild-type rats (Fig. 2B, p < 0.001; Fig. 2C, p < 0.05, respectively). There was also a noticeable trend toward a higher ratio of cell body to total microglia size in the subiculum of AD rats compared to wild-type rats (Fig. 2D, p = 0.055). Representative images of the analysis workflow are shown in Fig. 2E-F.
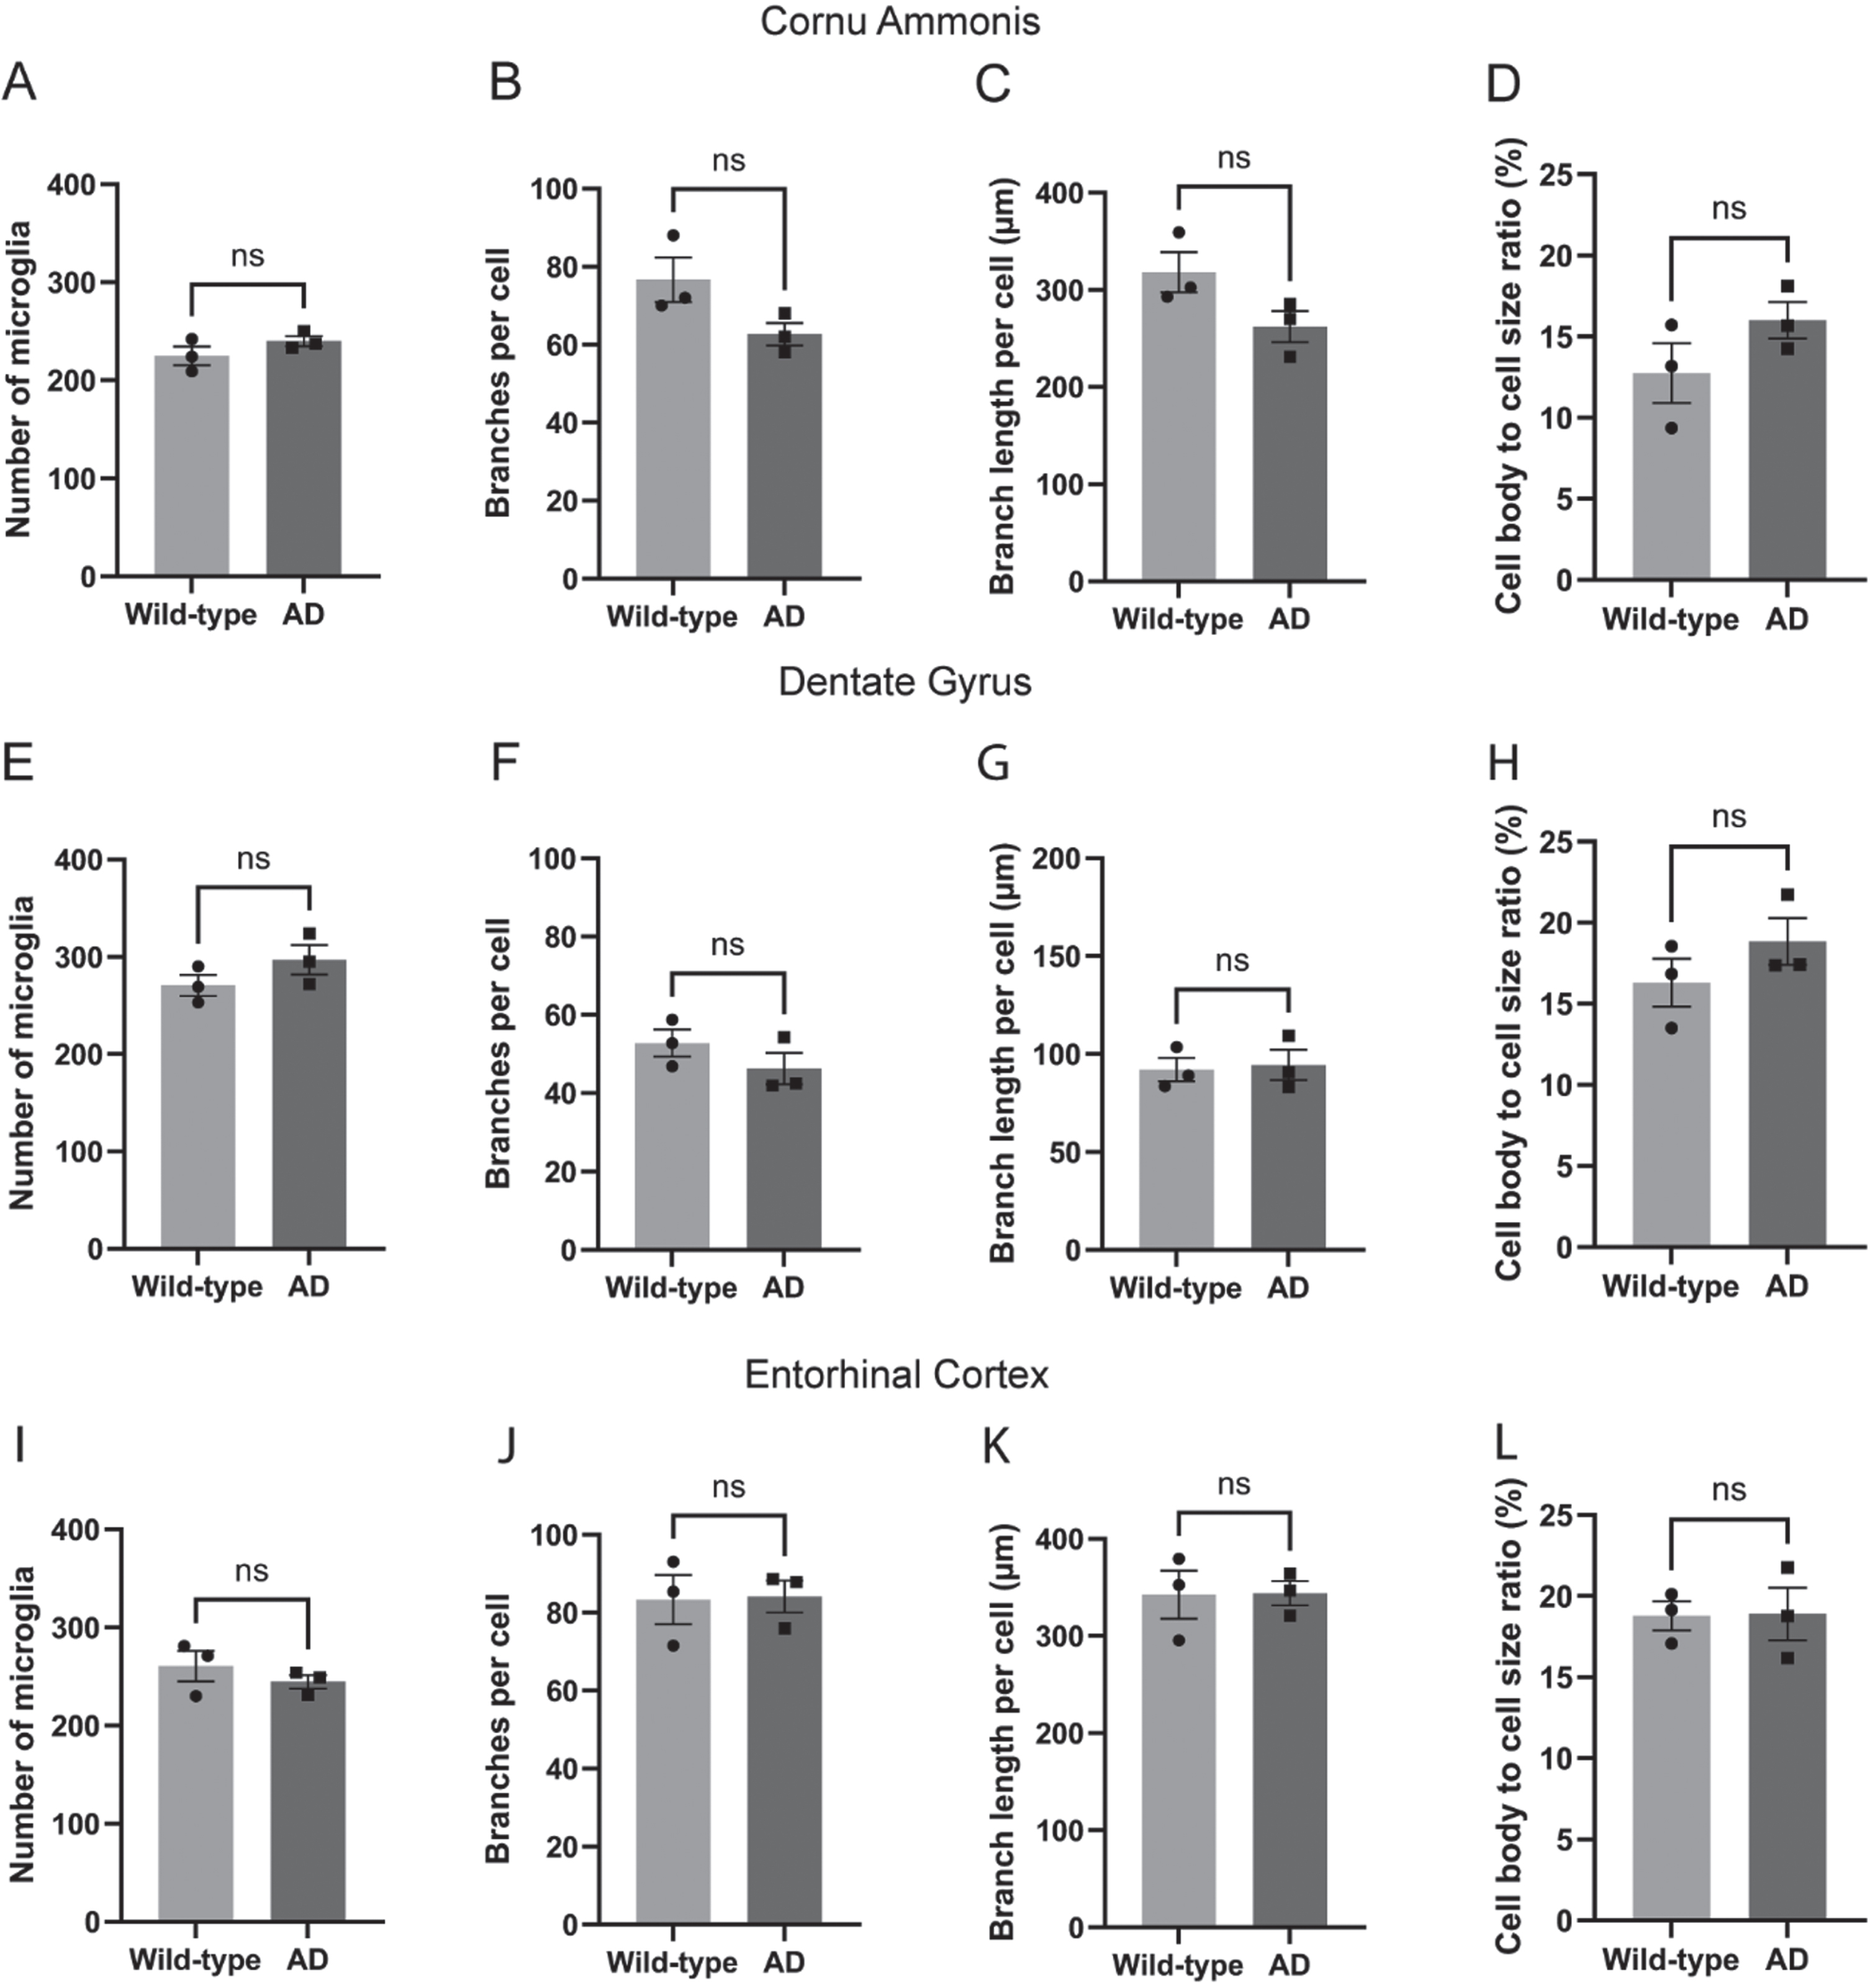
In the intermediate CA, microglial parameters exhibited a similar pattern to the subiculum. The number of microglia was comparable between the AD rats and the wild-type rats (Fig. 3A). Although the number of branches (Fig. 3B), total branch length (Fig. 3C), and cell body to total cell size ratio (Fig. 3D) showed patterns reminiscent of those observed in the subiculum, none of these were statistically significant. In the dorsal DG (Fig. 3E-H) and lateral EC regions (Fig. 3I-L), no significant differences were observed between the groups in terms of microglial count, branch number, total branch length, or the cell body to total cell size ratio.
Fig. 3
No other significant alterations in microglial morphology in the transgenic AD rats. The number of microglia and their morphological complexity was assessed also in intermediate cornu ammonis (A–D), dorsal dentate gyrus (E–H), and lateral entorhinal cortex (I–L) of the AD rats (n = 3) and the wild-type control rats (n = 3). Two-tailed unpaired t-test.
Effects on microglial morphology only from early-stage treatments
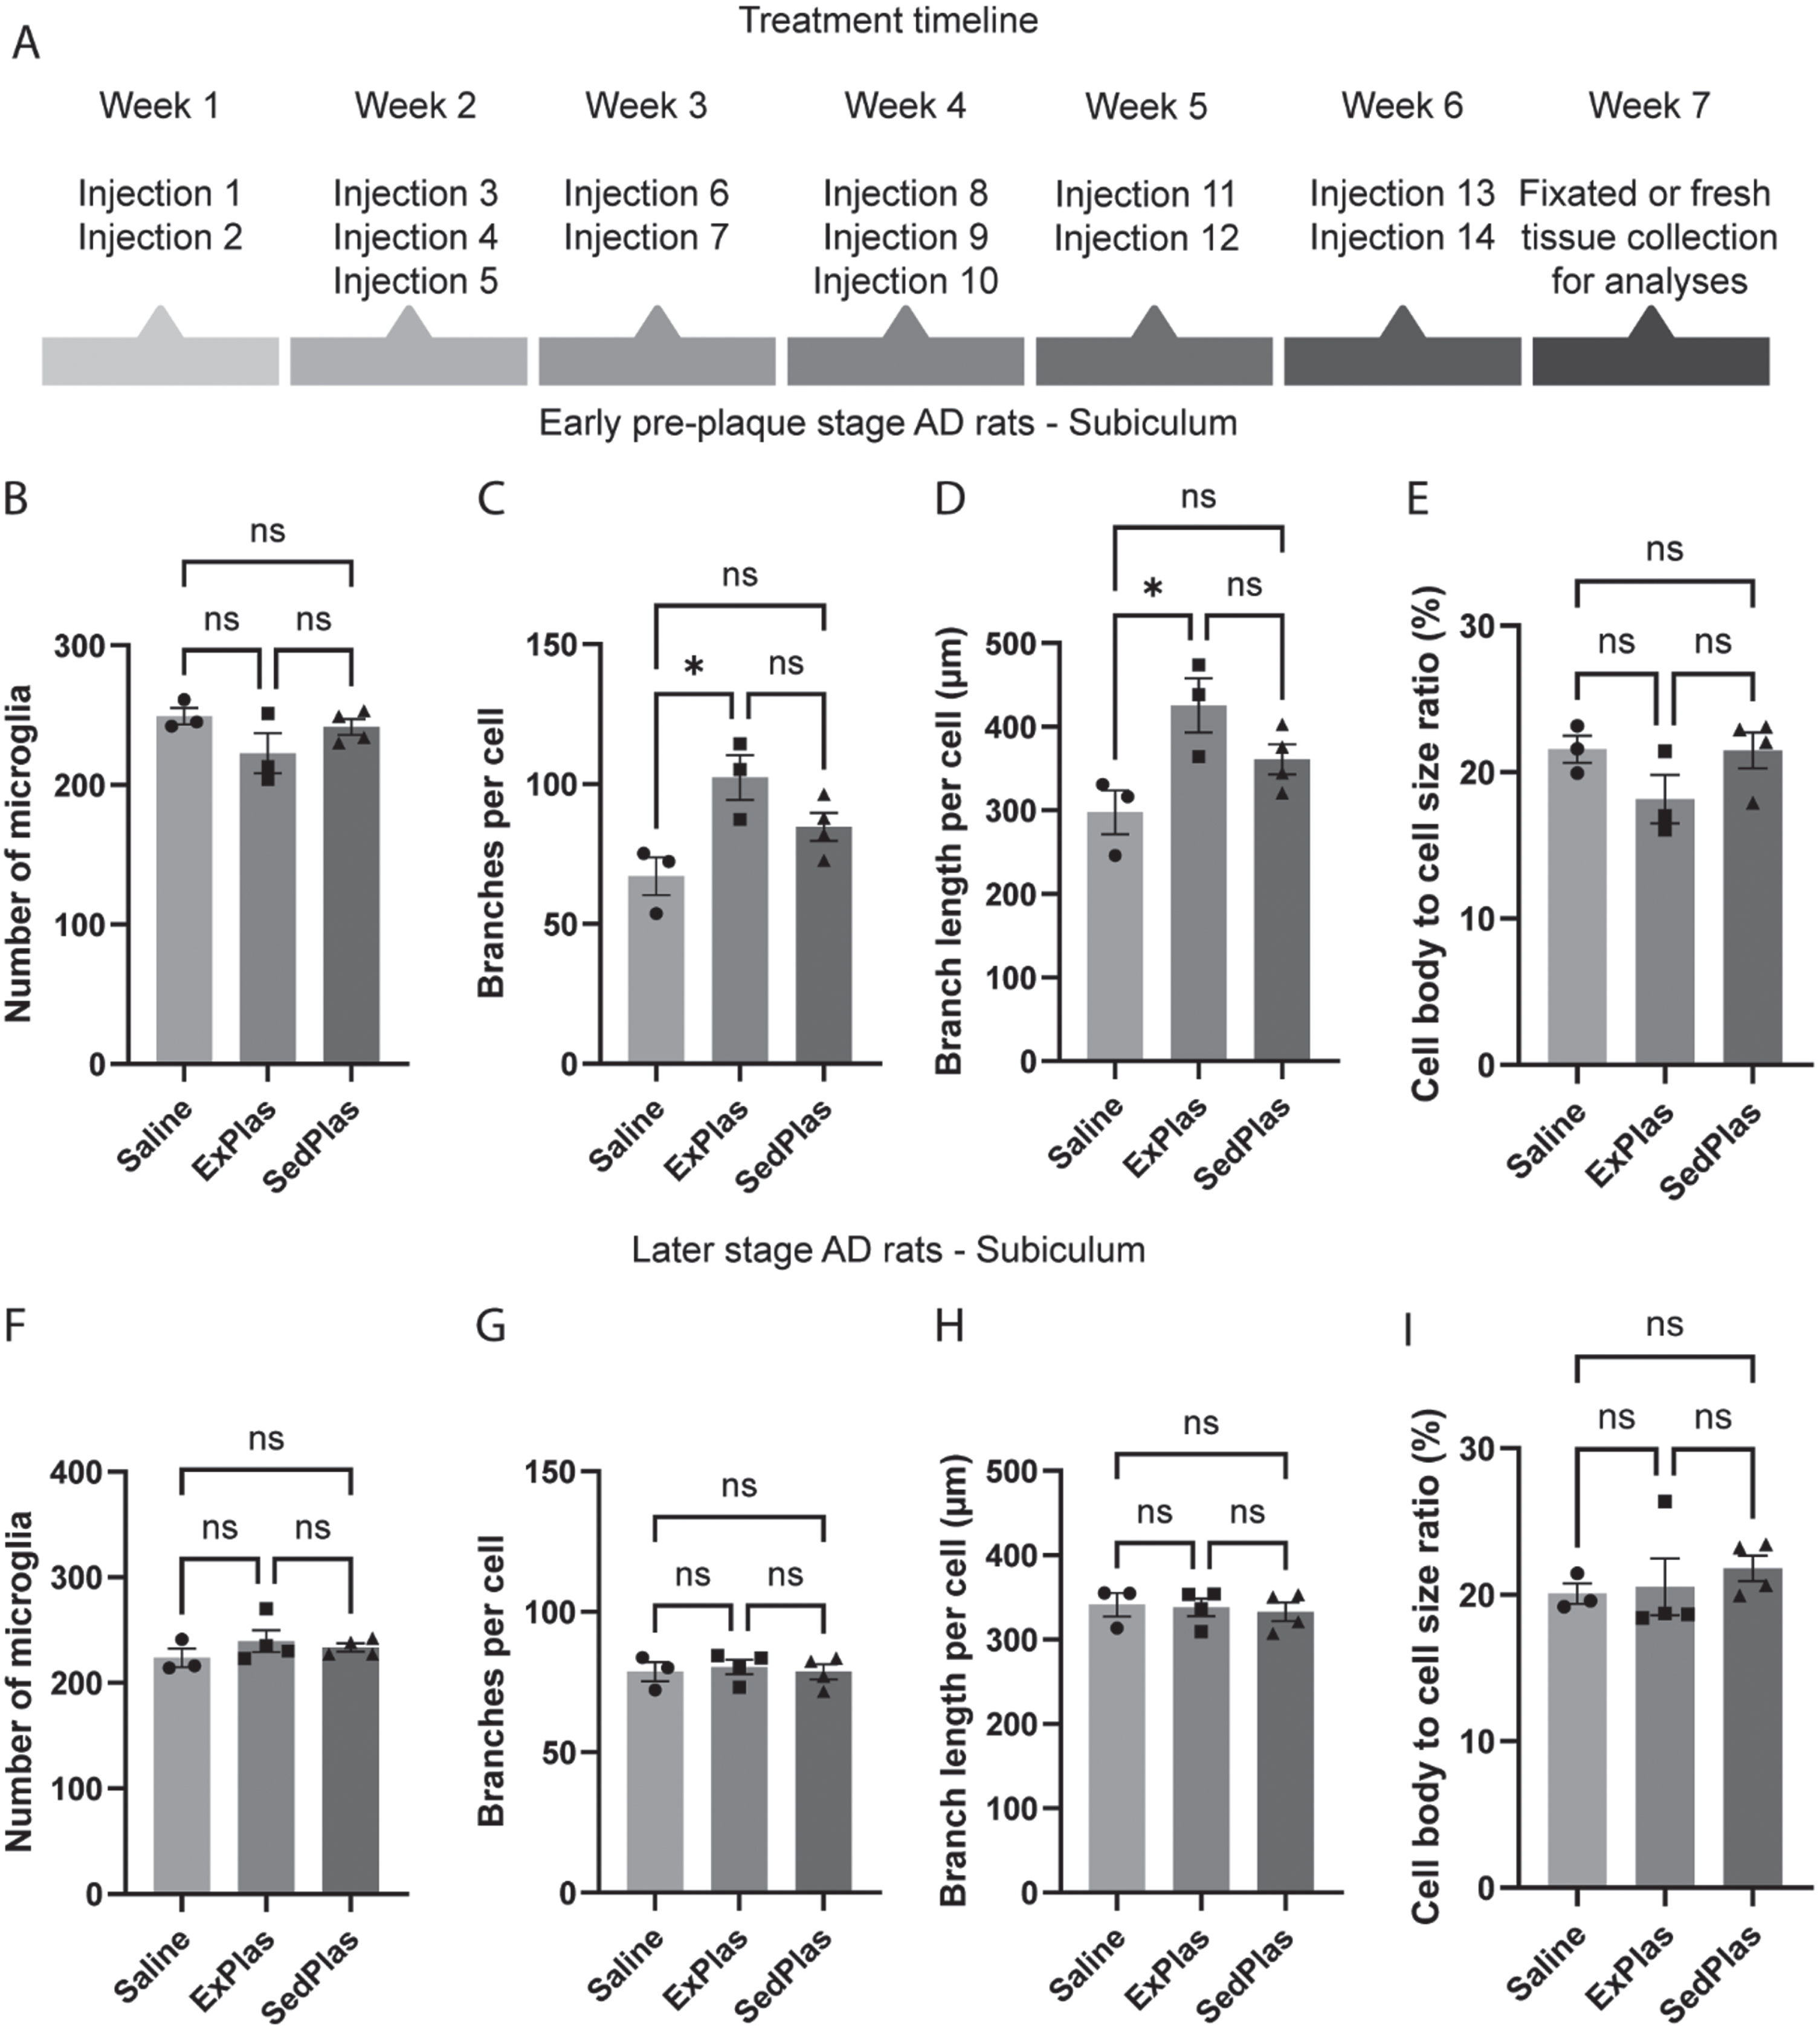
To evaluate the effects of frequent exercised plasma injections (Fig. 4A) on microglia, the same microglial parameters were assessed in male AD rats treated with intravenous injections of either ExPlas, SedPlas, or saline, at one of two different pathological stages, one preceding plaque pathology (early stage) and the other concurrent with initial plaque emergence (later stage). Recognition memory was similarly tested in these rats, but there were no statistically significant differences between these treatment groups (Supplementary Figure 1). In the dorsal subiculum of the early-stage AD rats, there were no differences in microglial number (Fig. 4B), but the number of branches per microglia was significantly greater in the ExPlas-treated group compared to the saline-treated group (Fig. 4C, p < 0.05). Total branch length per microglia was similarly greater in the ExPlas-treated group compared to the saline-treated group (Fig. 4D, p < 0.05). The cell body to total cell size ratio was, however, not significantly different between the groups (Fig. 4E). In the later-stage treatment groups, there were no significant differences in microglial number or any of the morphological parameters (Fig. 4F-I).
Fig. 4
Effects of ExPlas treatment on microglial morphology in the dorsal subiculum occurred only in the early-stage AD rats. The AD rats received a total of 14 injections over 6 weeks (A). The early-stage AD rats were 3.7±0.20 months old and the later-stage rats 6.6±0.20 months old at the end of injections. The number of microglia and their morphological complexity was assessed in dorsal subiculum of the rats treated with saline (n = 3 at pre-plaque stage, n = 3 at later stage), ExPlas (n = 3 at pre-plaque stage, n = 4 at later stage), or SedPlas (n = 4 at pre-plaque stage, n = 4 at later stage) injections at the early pre-plaque stage (B–E) or at the later stage with plaque pathology (F–I). One-way ANOVA with Tukey’s multiple comparisons test, *p < 0.05.
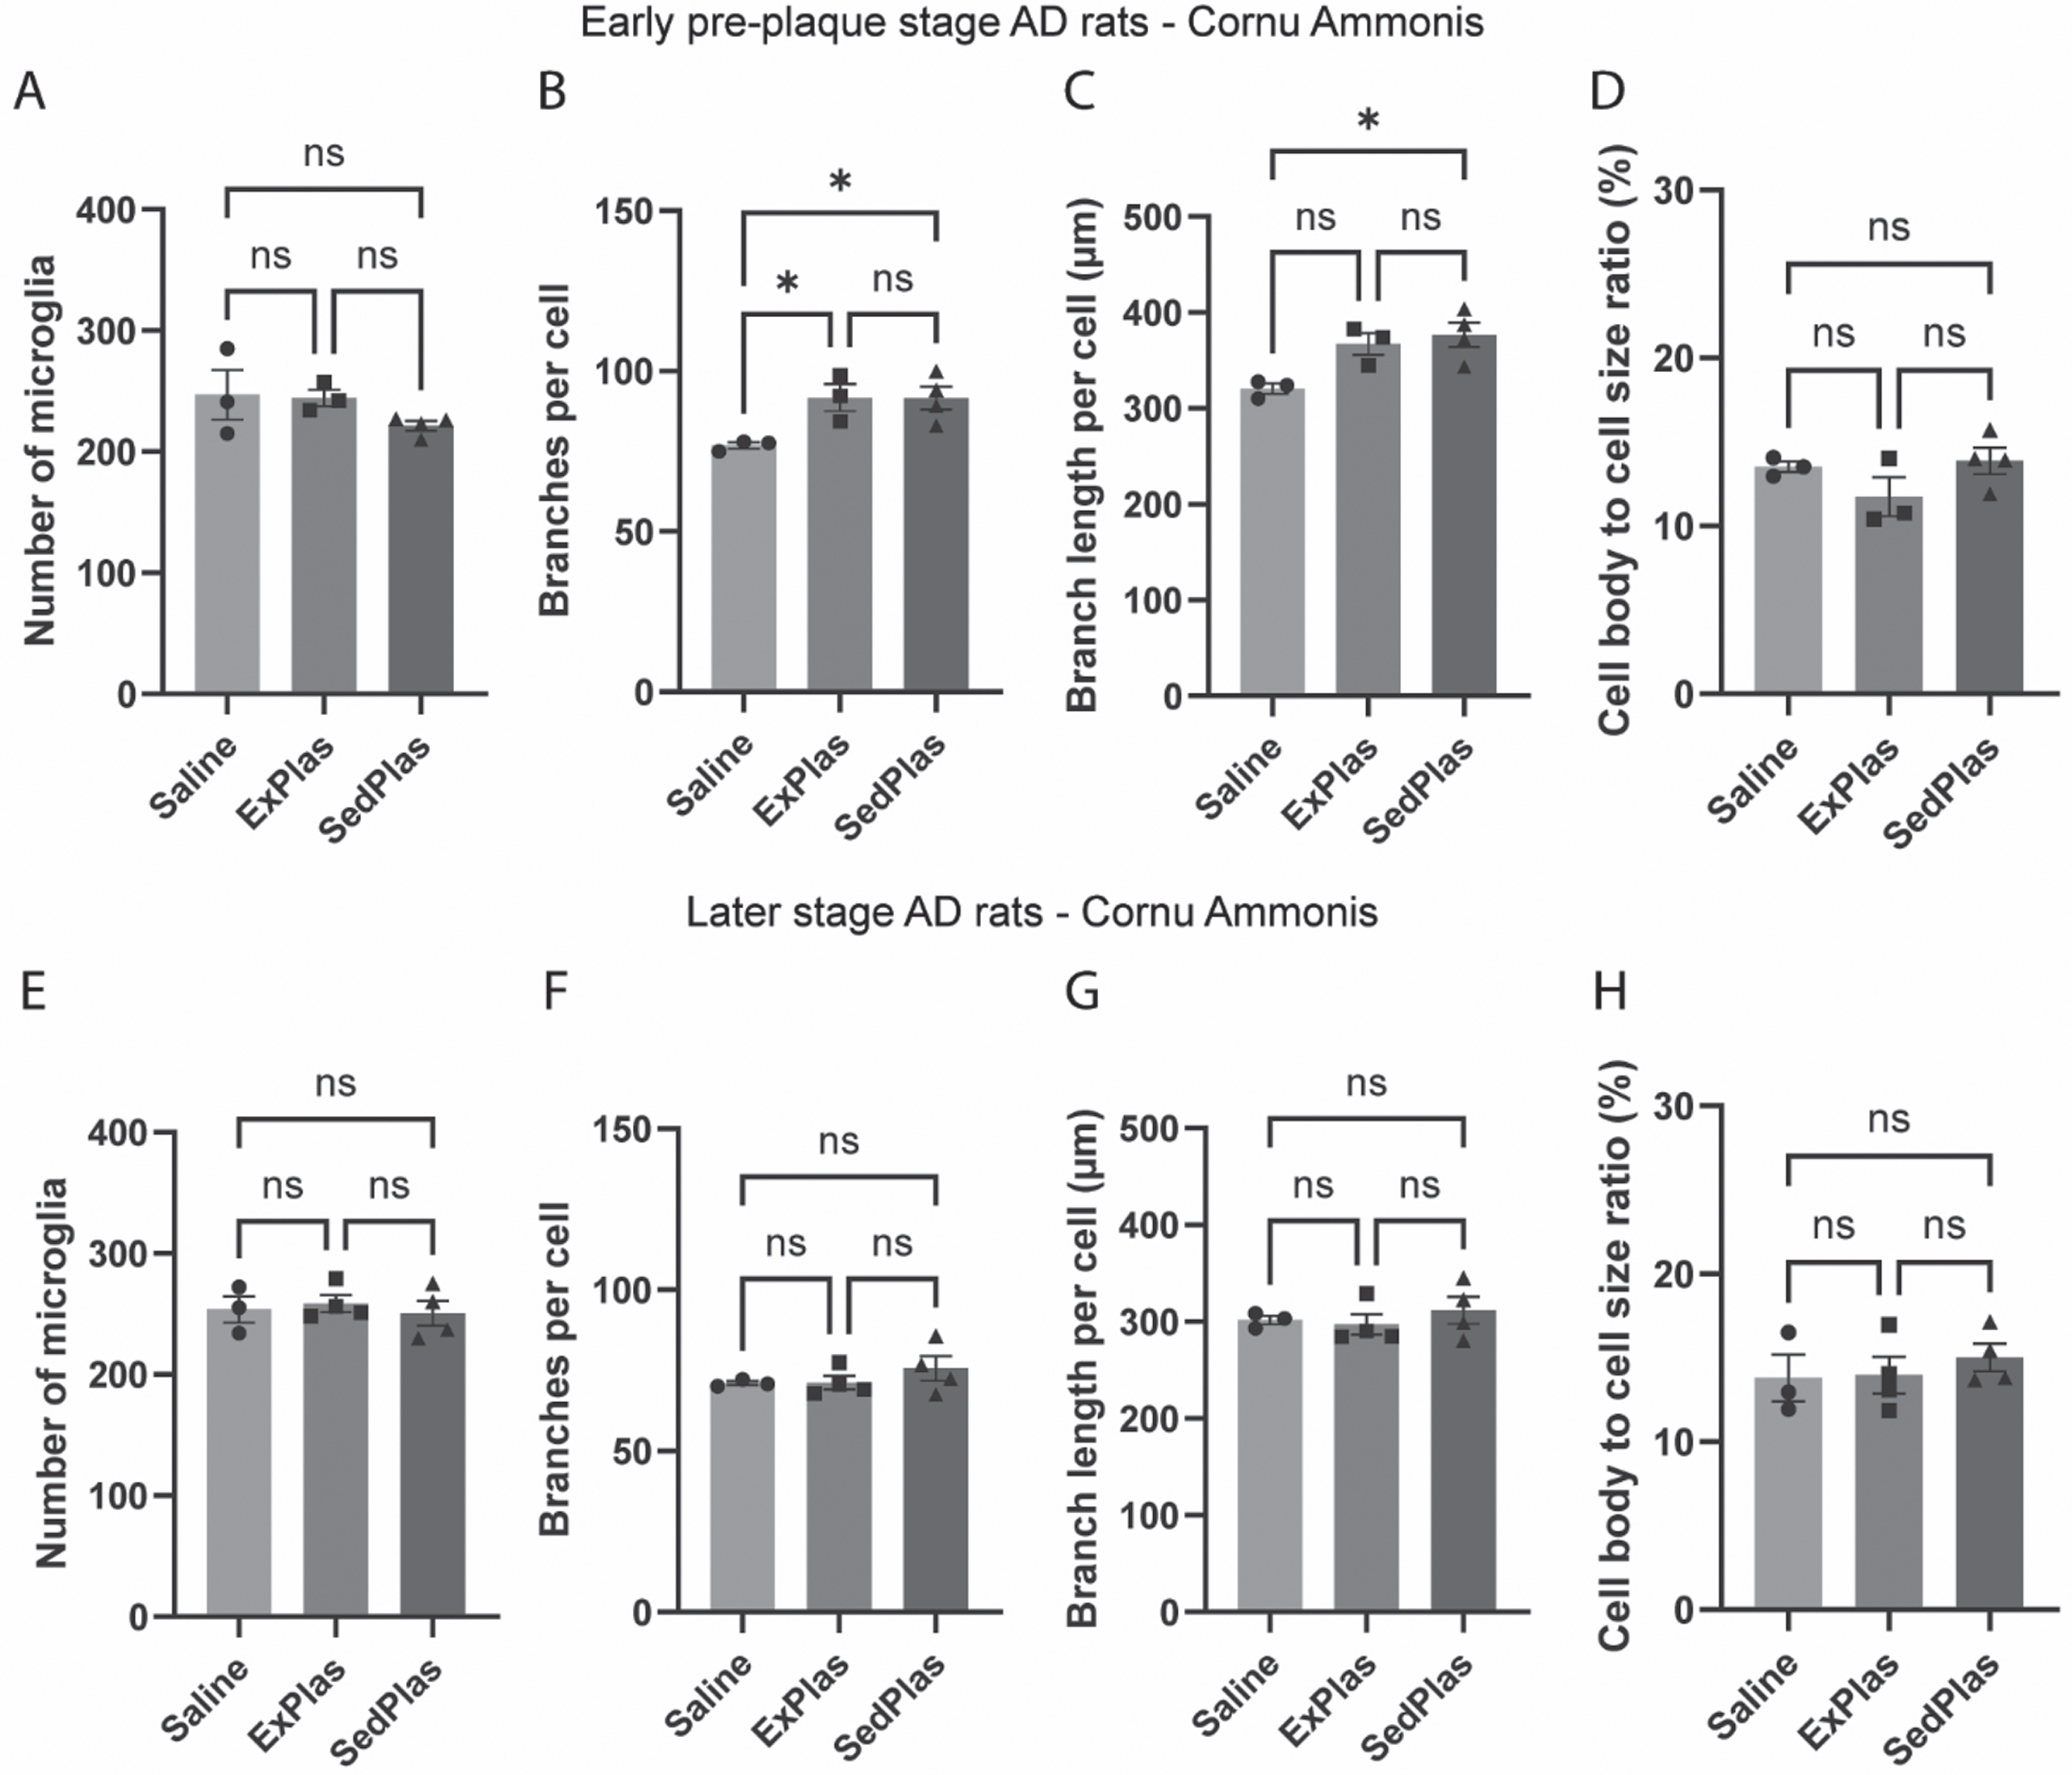
In the intermediate CA of early-stage AD rats, there were no differences in the number of microglia (Fig. 5A), but the number of branches per microglia was significantly greater in the ExPlas-treated and the SedPlas-treated rats compared to the saline-treated rats (Fig. 5B, both p < 0.05). Total branch length per microglia was significantly greater only in the SedPlas-treated group compared to the saline group (Fig. 5C, p < 0.05). The ratio of cell body size to total cell size was not significantly different between the groups (Fig. 5D). In the later-stage treated rats, there were no significant differences between the groups in either microglial number or morphology (Fig. 5E-G).
Fig. 5
Alterations in microglial morphology in the intermediate cornu ammonis in response to the plasma injections occurred only in the early-stage AD rats. The number of microglia and their morphological complexity was assessed in intermediate cornu ammonis of the rats treated with saline (n = 3 at pre-plaque stage, n = 3 at later stage), ExPlas (n = 3 at pre-plaque stage, n = 4 at later stage), or SedPlas (n = 4 at pre-plaque stage, n = 4 at later stage) injections at the early pre-plaque stage (A–D) or at the later stage with plaque pathology (E–H). One-way ANOVA with Tukey’s multiple comparisons test, *p < 0.05.
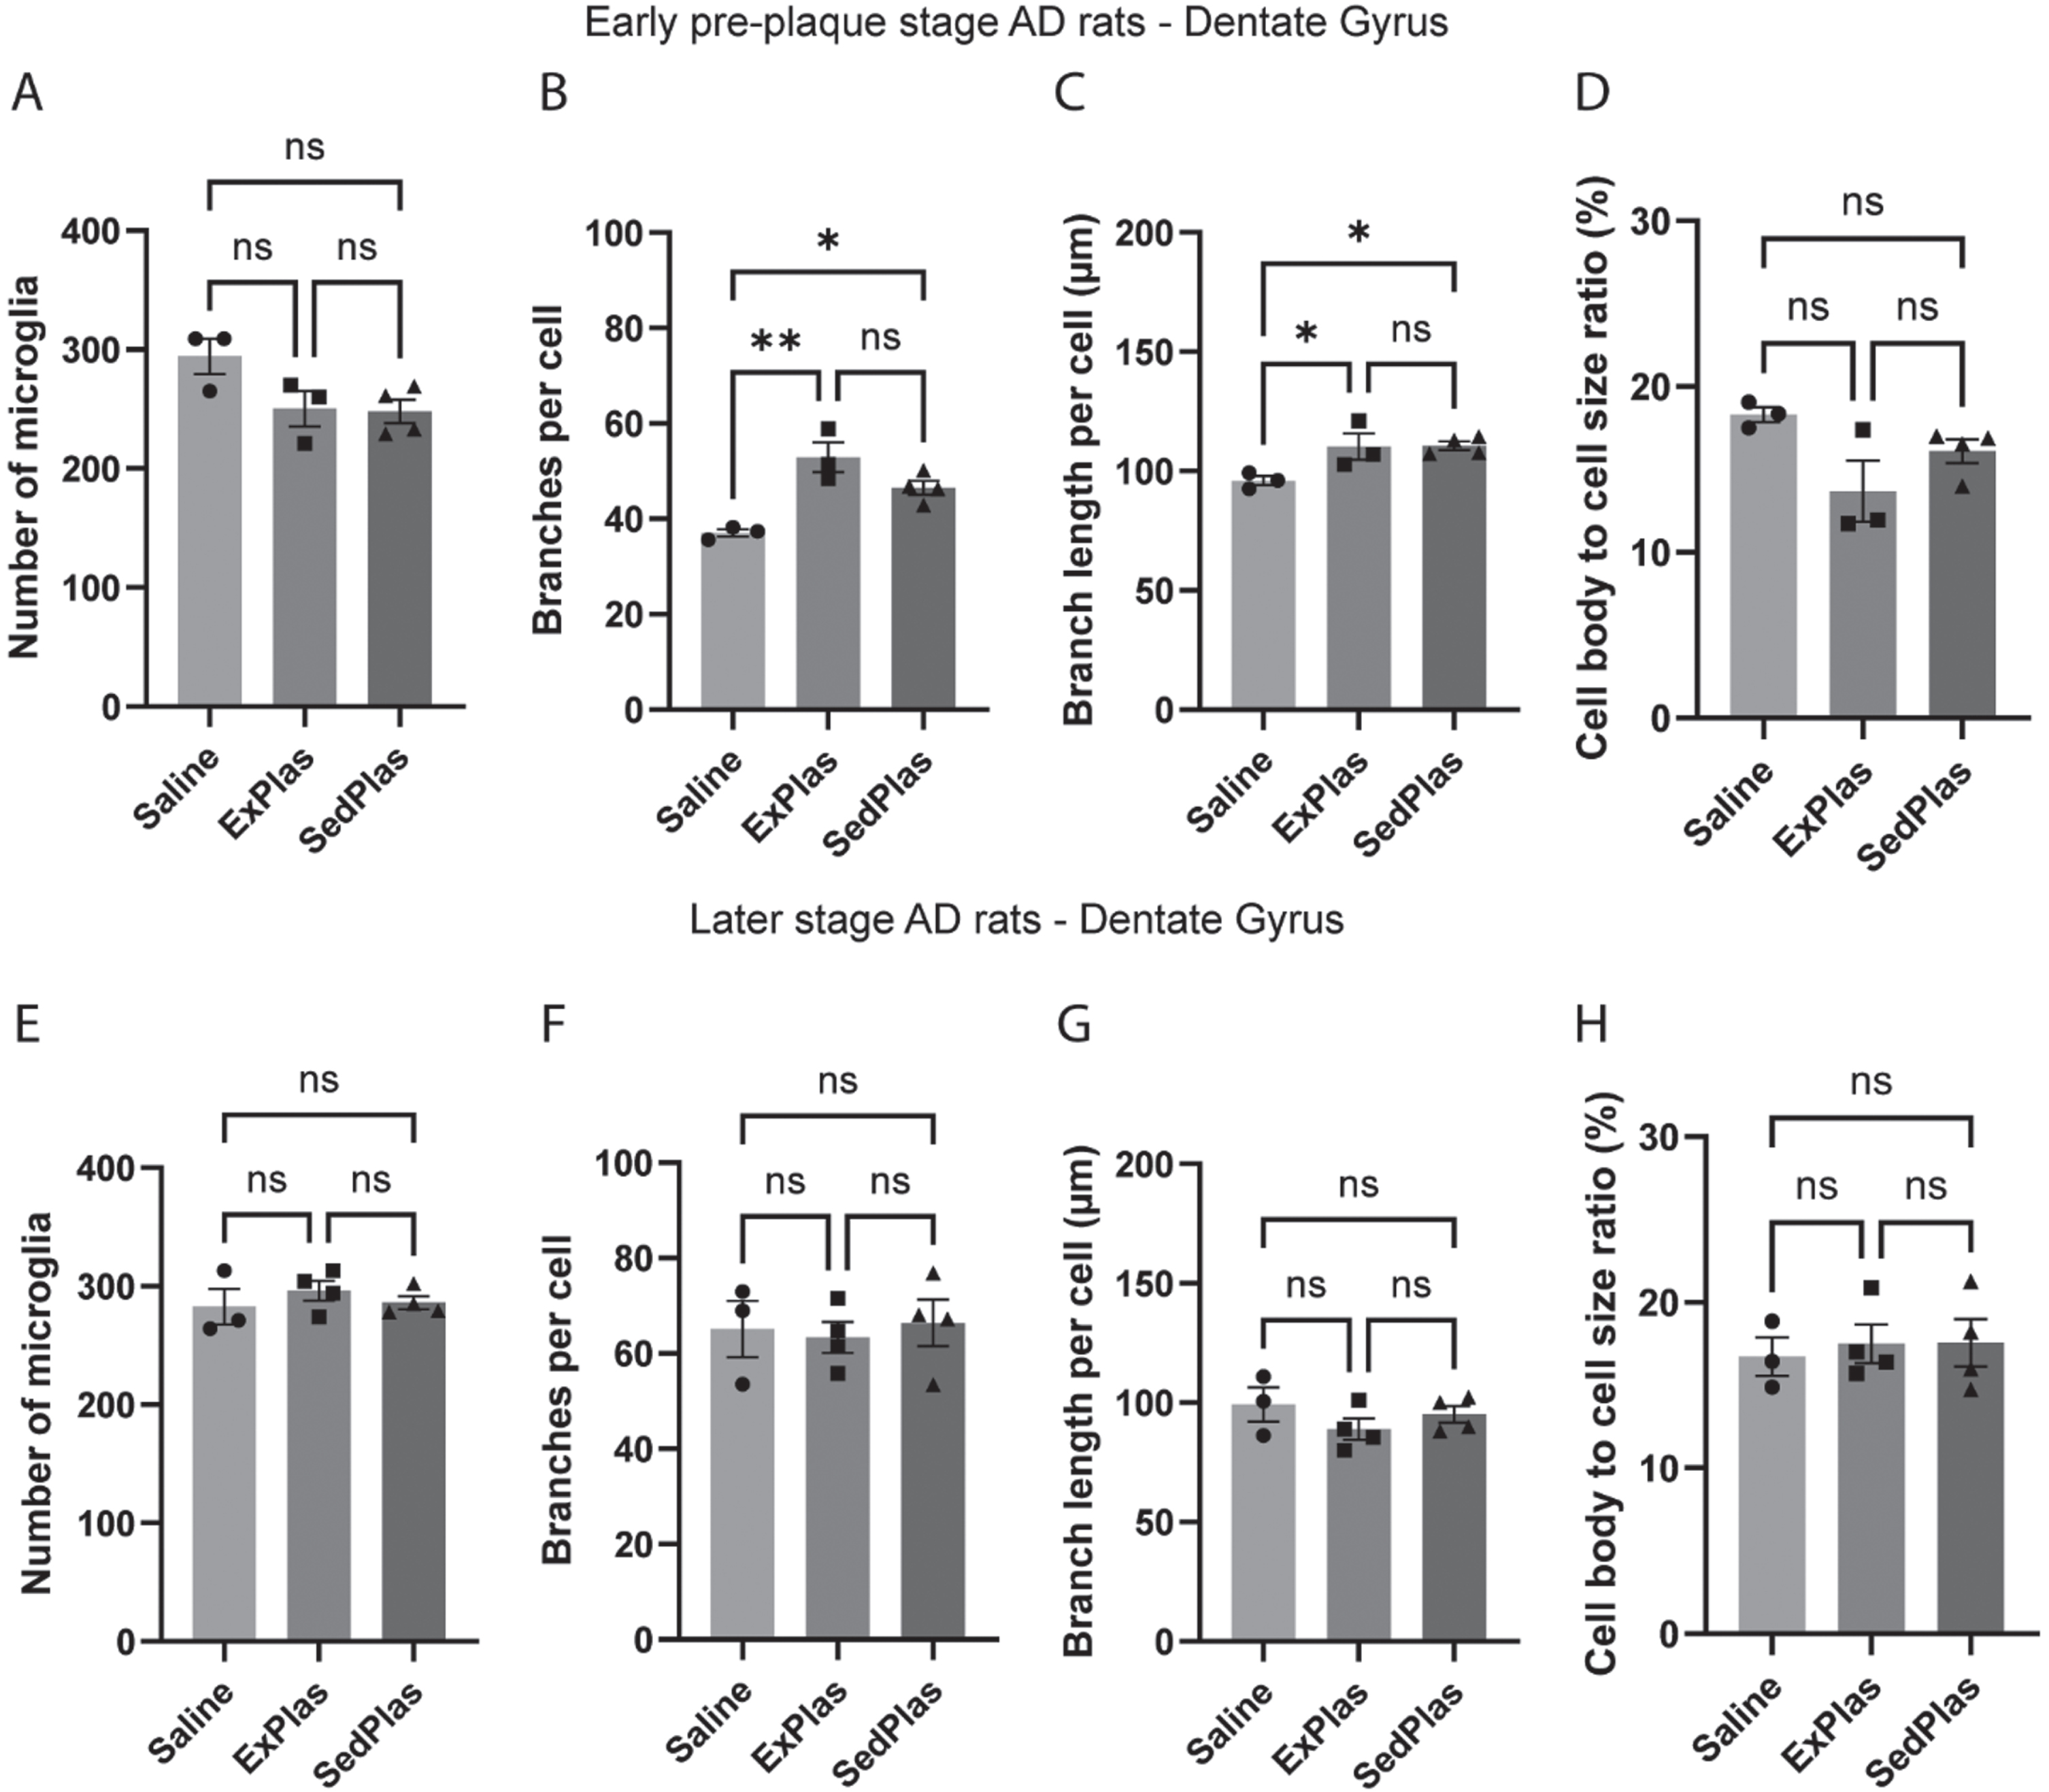
Similar to intermediate CA, there were no differences in the number of microglia in the dorsal dentate gyrus (Fig. 6A), but both the early-stage ExPlas- and SedPlas-treated rats had significantly more branches per microglia in this area when compared to saline-treated rats (Fig. 6B, p < 0.01 and p < 0.05, respectively). The total branch length per microglia was also significantly greater in the ExPlas and SedPlas-treated rats (Fig. 6C, both p < 0.05). Nevertheless, differences in cell body to total microglia size ratio were not statistically significant (Fig. 6D).
Fig. 6
Alterations in microglial morphology in the dorsal dentate gyrus in response to the plasma injections occurred only in the early-stage AD rats. The number of microglia and their morphological complexity was assessed in the hilar area of the dorsal dentate gyrus of the rats treated with saline (n = 3 at pre-plaque stage, n = 3 at later stage), ExPlas (n = 3 at pre-plaque stage, n = 4 at later stage), or SedPlas (n = 4 at pre-plaque stage, n = 4 at later stage) injections at the early pre-plaque stage (A–D) or at the later stage with plaque pathology (E–H). One-way ANOVA with Tukey’s multiple comparisons test, *p < 0.05, **p < 0.01.
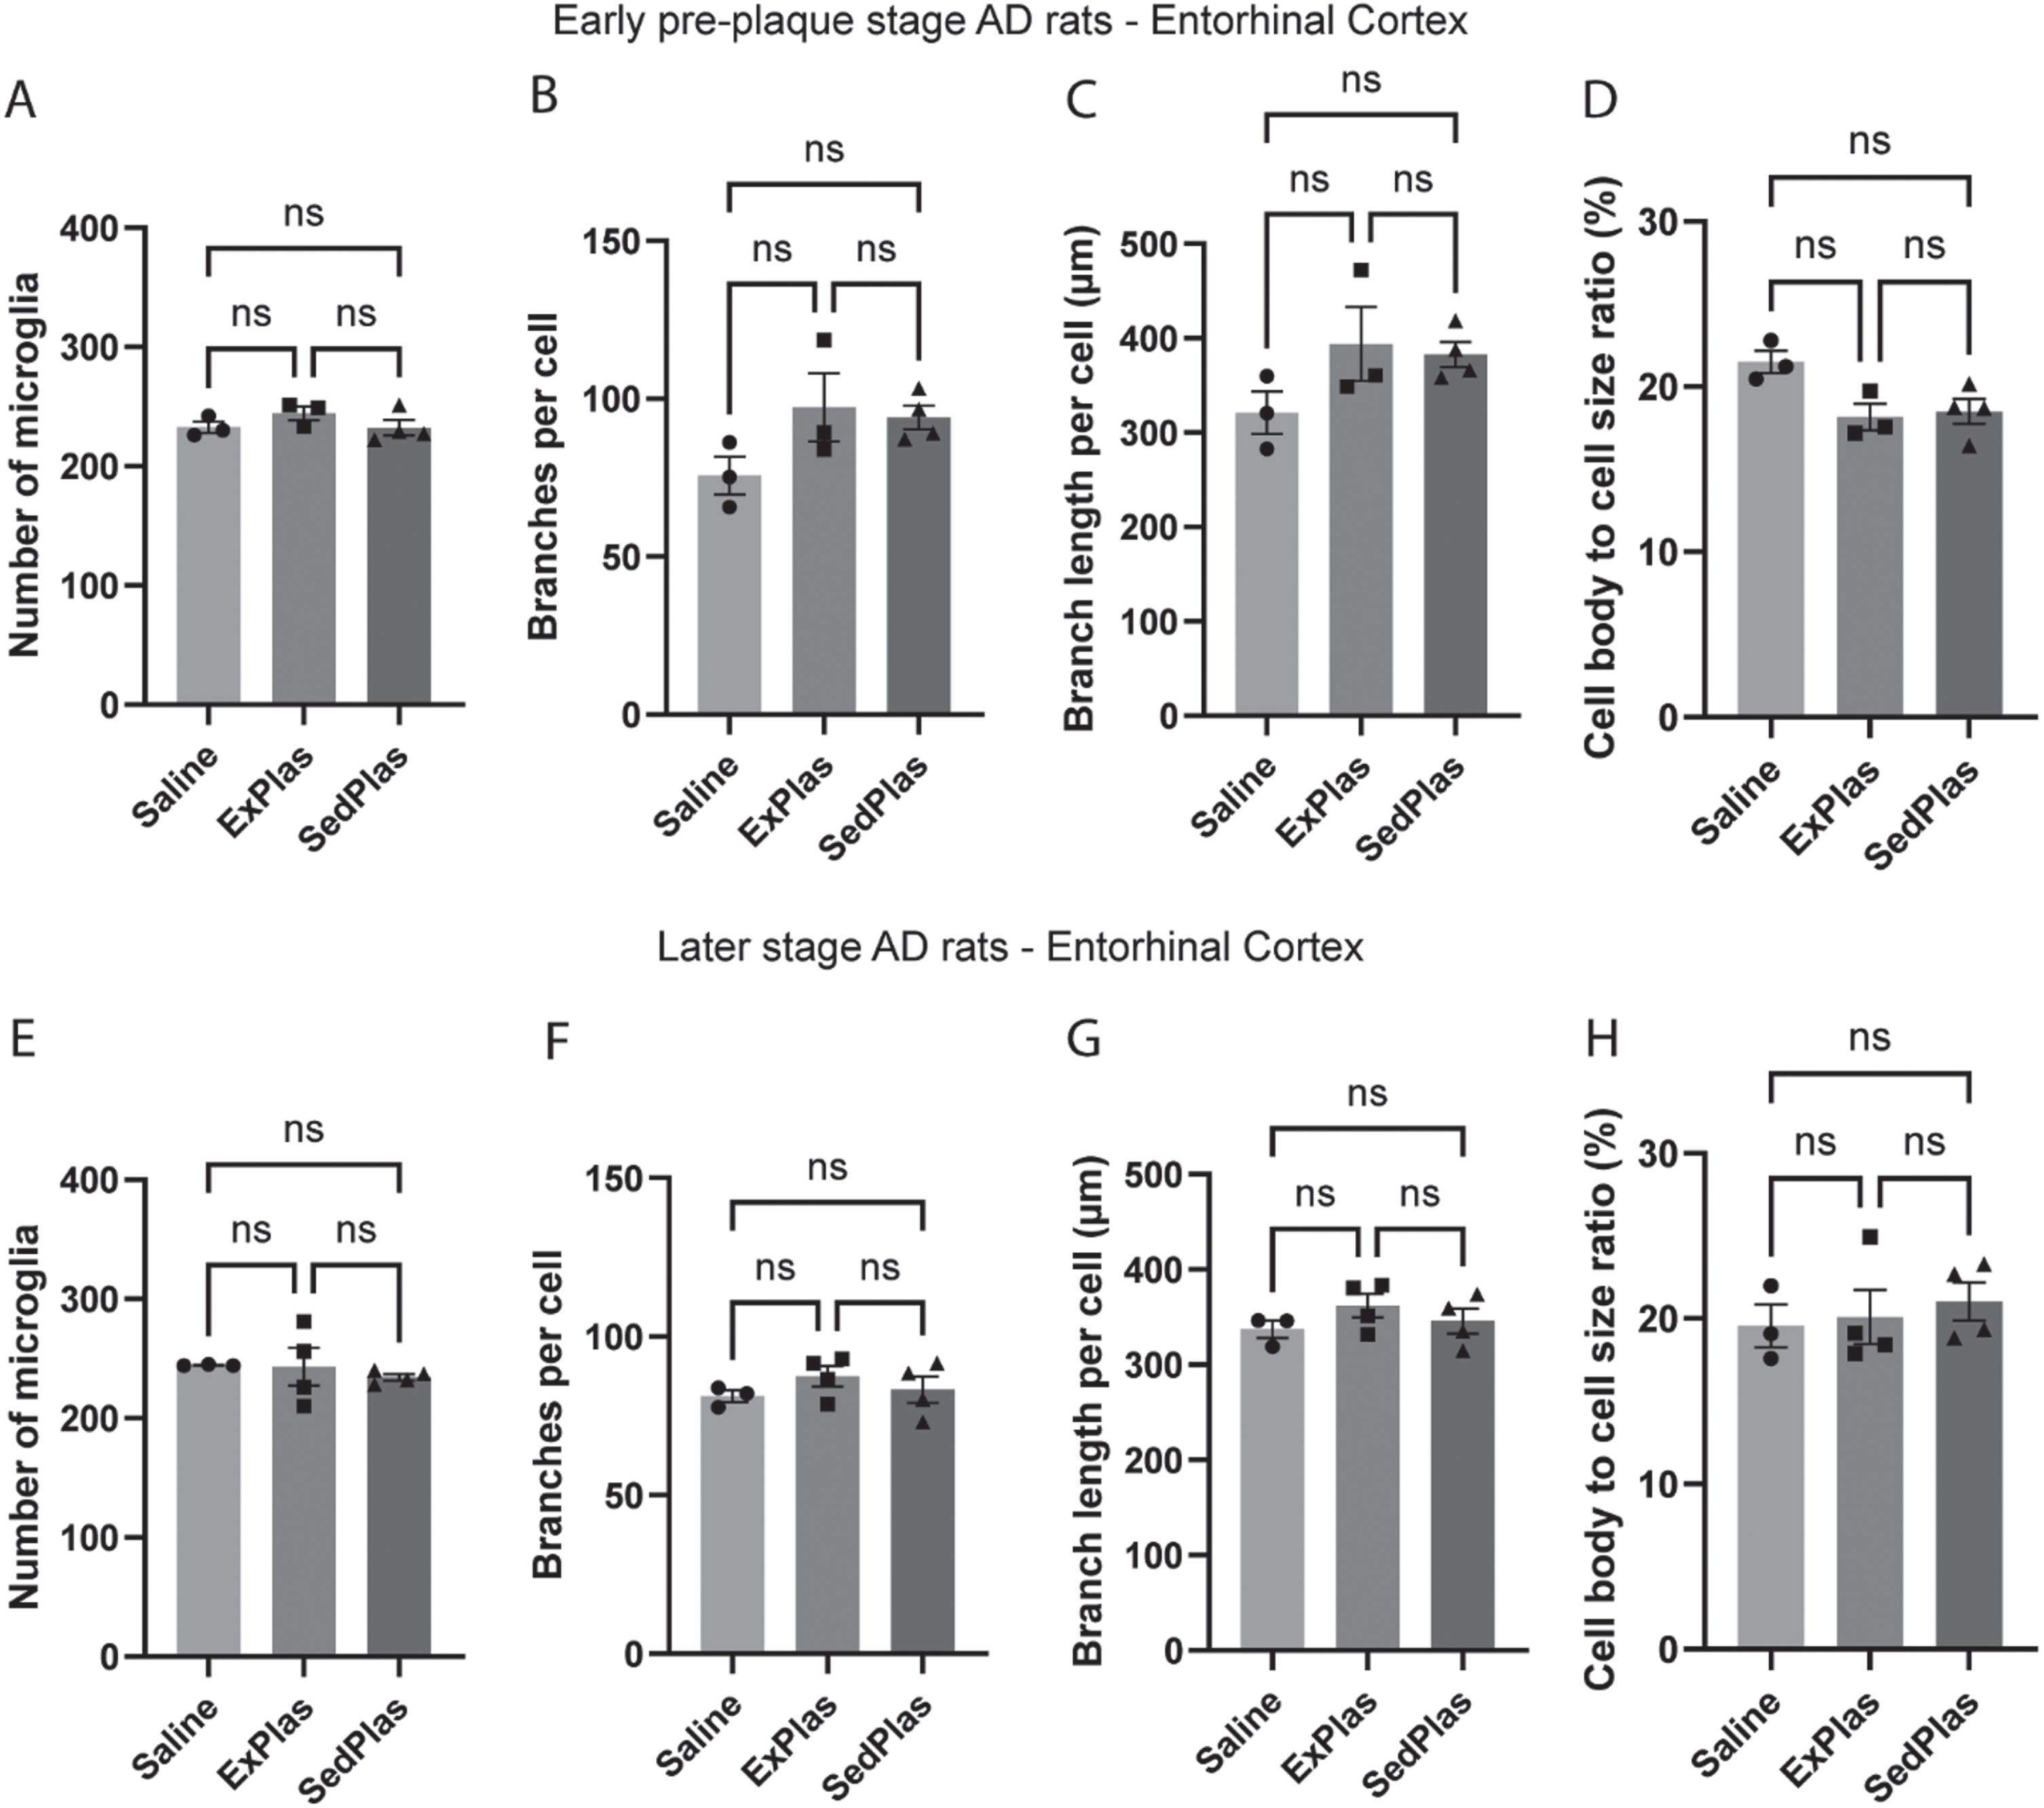
In the lateral EC, there were no significant differences between any of the early-stage or later-stage AD rat treatment groups in microglia count or morphology (Fig. 7).
Fig. 7
No effects of plasma injections on microglia count or morphology in the lateral entorhinal cortex. The number of microglia and their morphological complexity was assessed in lateral entorhinal cortex of the rats treated with saline (n = 3 at pre-plaque stage, n = 3 at later stage), ExPlas (n = 3 at pre-plaque stage, n = 4 at later stage), or SedPlas (n = 4 at pre-plaque stage, n = 4 at later stage) injections at the early pre-plaque stage (A–D) or at the later stage with plaque pathology (E–H). One-way ANOVA.
No differential effects of treatments on amyloid plaques
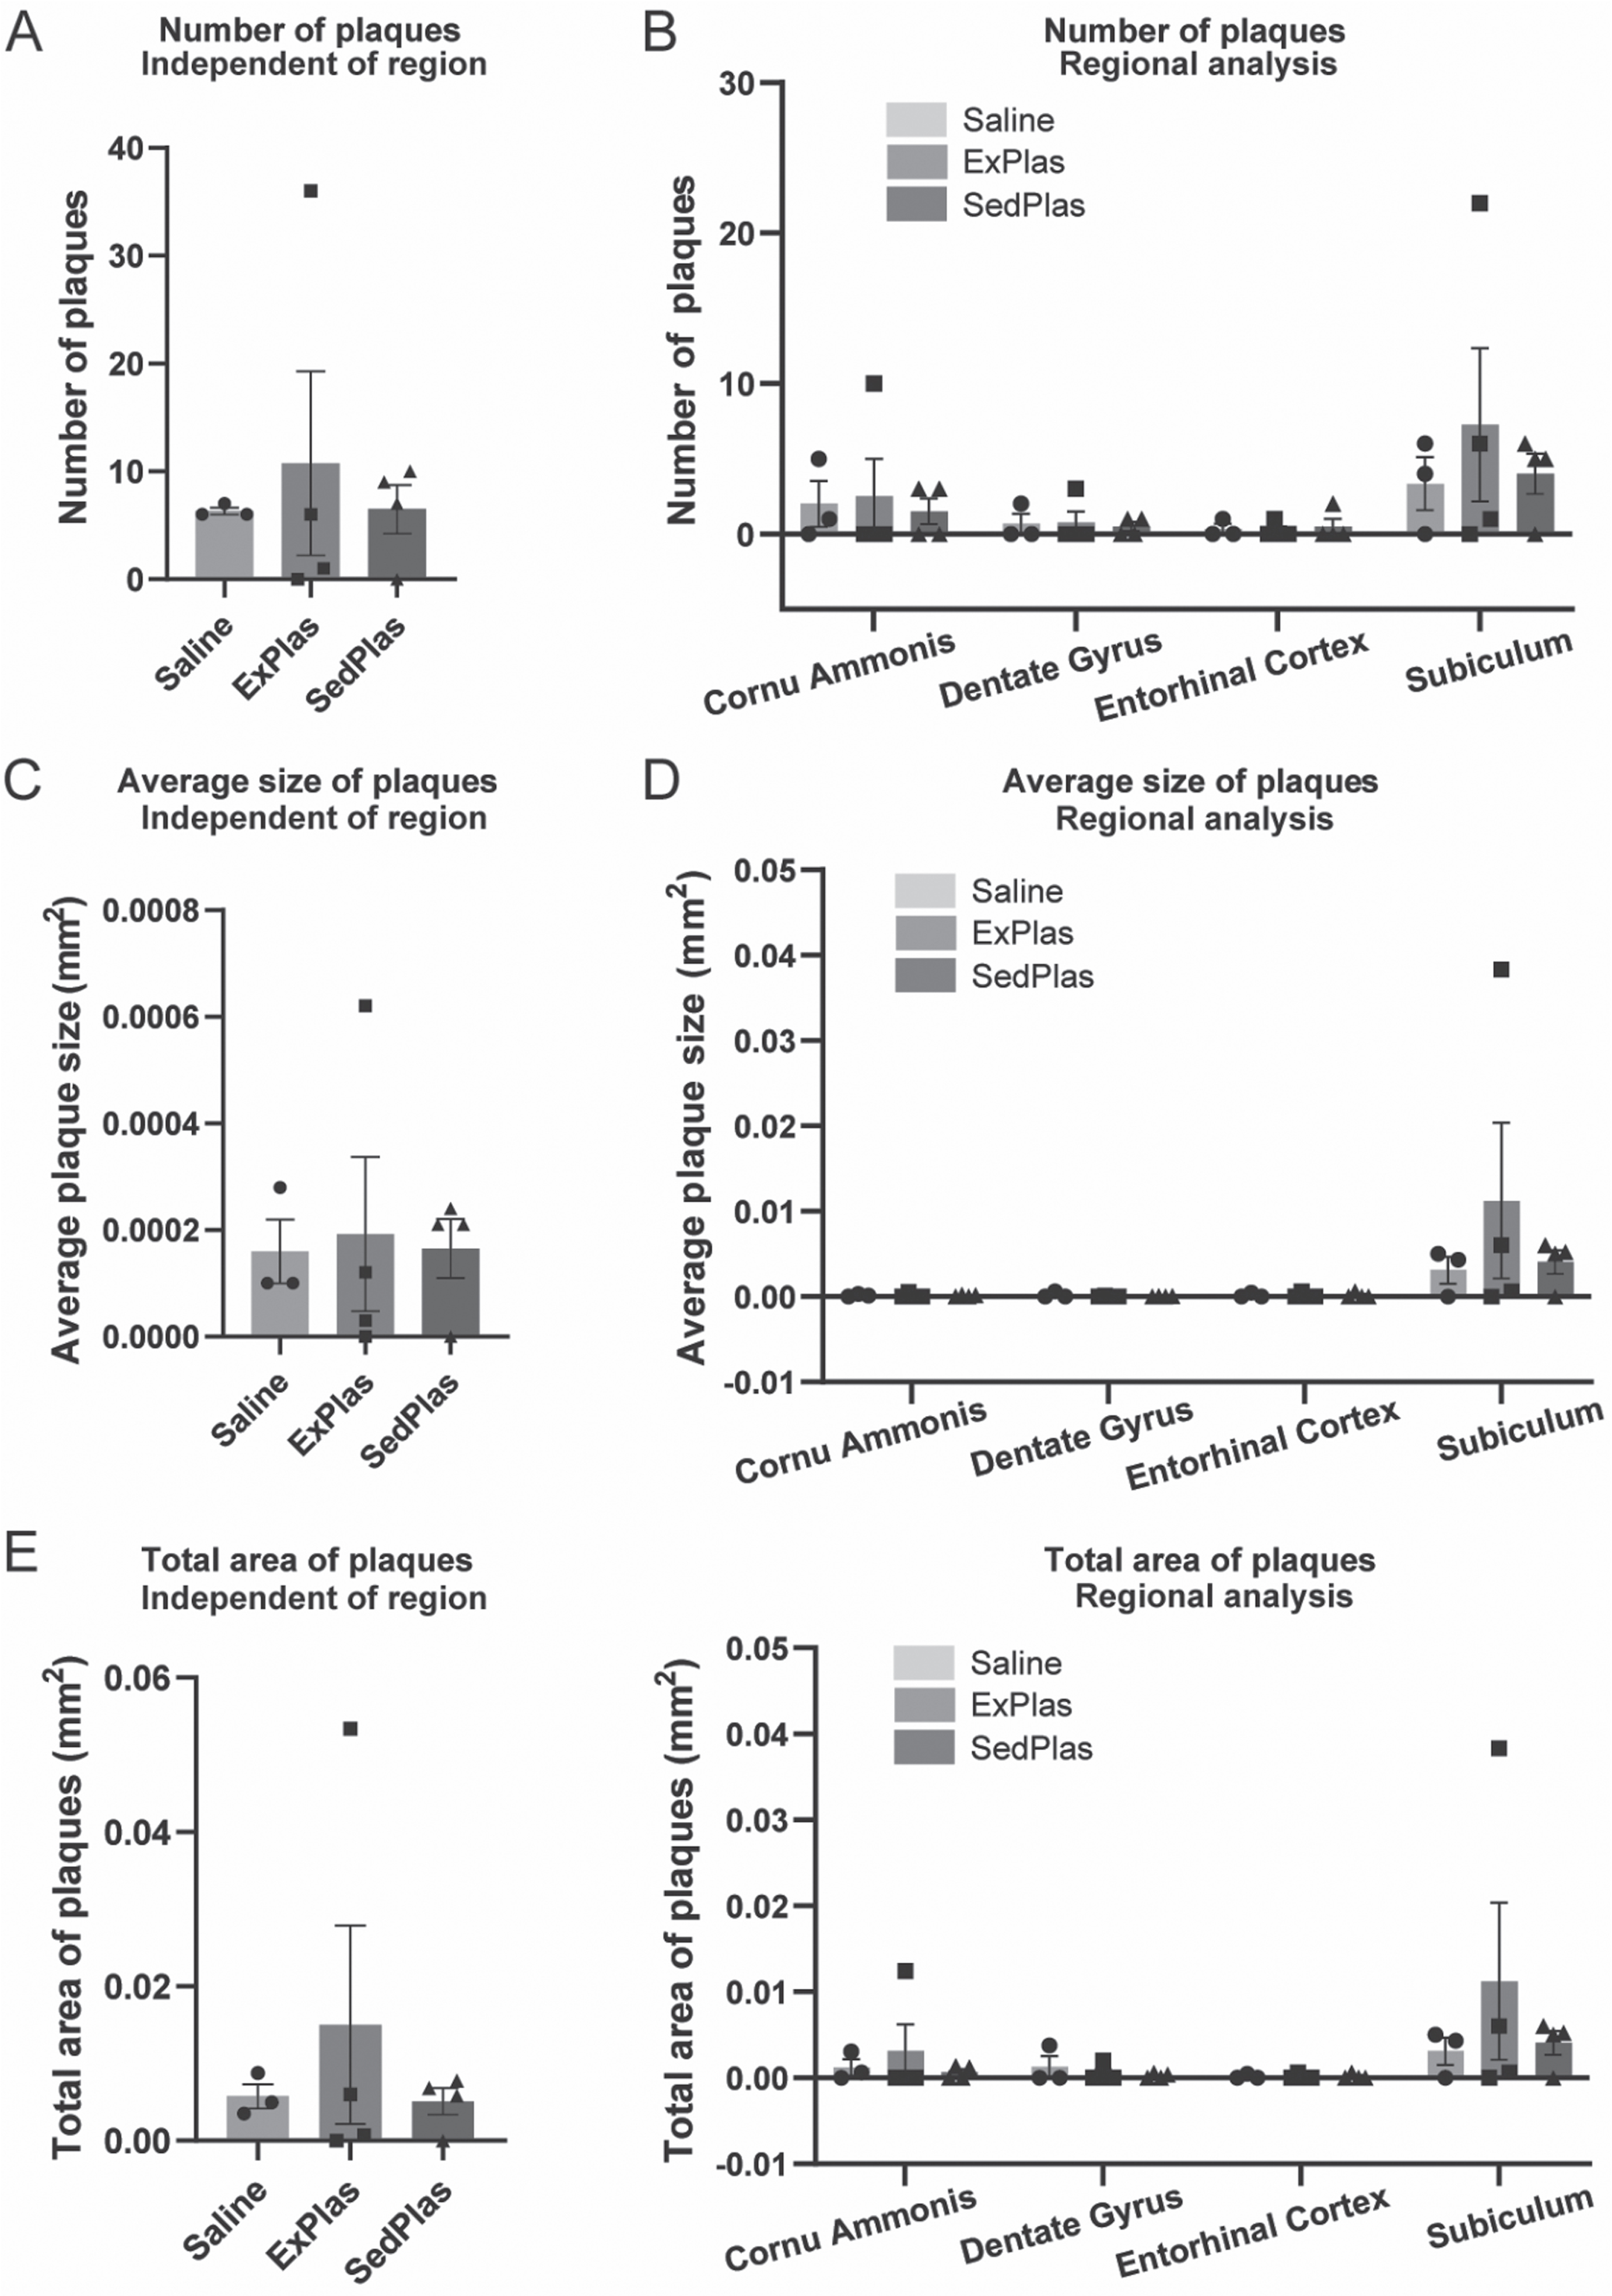
As microglia exhibit dynamic responses to amyloid pathology, the number and size of amyloid plaques were analyzed in the regions also assessed for microglia count and morphology. As expected, no plaques were found in the brains of the early-stage AD rats. Except for one rat treated with ExPlas and one with SedPlas, all other rats treated at the later stage had some plaques in at least one of the assessed brain regions (Supplementary Figure 2). However, there were no significant differences between any of the treatment groups in the total number (Fig. 8A-B), average size (Fig. 8C-D), or total area covered by plaques (Fig. 8E-F). This applied to both region-specific and region-independent comparisons.
Fig. 8
No effects of plasma injections on amyloid plaque pathology. Number, size, and total area of plaques were analyzed both independent of the region (A, C, E, respectively) and specific to the region (B, D, F, respectively) in McSA1-stained brain sections from the later-stage AD rats treated with saline (n = 3), ExPlas (n = 4), or SedPlas (n = 4). The regions of interest were cornu ammonis, dorsal dentate gyrus, lateral entorhinal cortex, and dorsal subiculum. One-way ANOVA.
Microglial parameters correlate with the number of plaques
To further assess the relationship between amyloid plaques and microglial responses, Spearman correlation analyses were performed using the data on amyloid plaque counts and the microglial parameters from respective areas in brain sections from all later-stage AD rats independent of treatment. Several correlations were found (Supplementary file). Specifically in subiculum, the number of plaques positively correlated with the number of microglia (correlation coefficient r = 0.670, p = 0.010) and negatively correlated with the number of branches per microglia (r = –0.655, p = 0.013) and the total branch length per microglia (r = –0.744, p = 0.003).
Early-stage treatments induced greater changes to cytokine levels in the intermediate CA
Cytokines are key players in neuroinflammation and important regulators of microglial function [2]. Given the important role of the CA in hippocampal circuits and cognitive function, along with previous findings in the AD rat model highlighting the vulnerability of synaptic function in CA1 to Aβ-induced impairment [33], and the upregulation of proinflammatory cytokines in CA in conjunction with Aβ accumulation [6, 34], we measured cytokine levels in the intermediate CA of male AD rats similarly treated with ExPlas, SedPlas, and saline at the two pathological stages.
In the early-stage AD rats, 5 out of 23 cytokines that were analyzed in the intermediate CA protein lysate were significantly altered with plasma injections when compared to saline injections (Fig. 8). The levels of granulocyte-macrophage colony-stimulating factor (GM-CSF; Fig. 9A), interleukin 18 (IL-18; Fig. 9B), and vascular endothelial growth factor (VEGF; Fig. 9C) were significantly higher in the ExPlas-treated rats compared to the saline-treated rats (all p < 0.05). The interleukin 10 (IL-10) levels, in contrast, were significantly higher only in the SedPlas-treated rats compared to the saline-treated rats (Fig. 9D; p < 0.05). The tumor necrosis factor alpha (TNF-α) levels were significantly higher in the SedPlas-treated rats compared to both the saline- and ExPlas-treated rats (Fig. 9E; both p < 0.05). All the cytokine concentrations measured in the intermediate CA of the early-stage AD rats are shown in Table 1. There were several positive correlations between the cytokines (Supplementary file).
Fig. 9
Significantly altered cytokines in the intermediate cornu ammonis of the early-stage AD rats. The levels of 23 cytokines were assessed in the intermediate cornu ammonis of early-stage AD rats treated with saline (n = 3), ExPlas (n = 4), or SedPlas (n = 3) injections. Only GM-CSF (A), IL-18 (B), VEGF (C), IL-10 (D), and TNF-α (E) showed significant differences between the treatment groups. One-way ANOVA with Tukey’s multiple comparisons test, *p < 0.05.
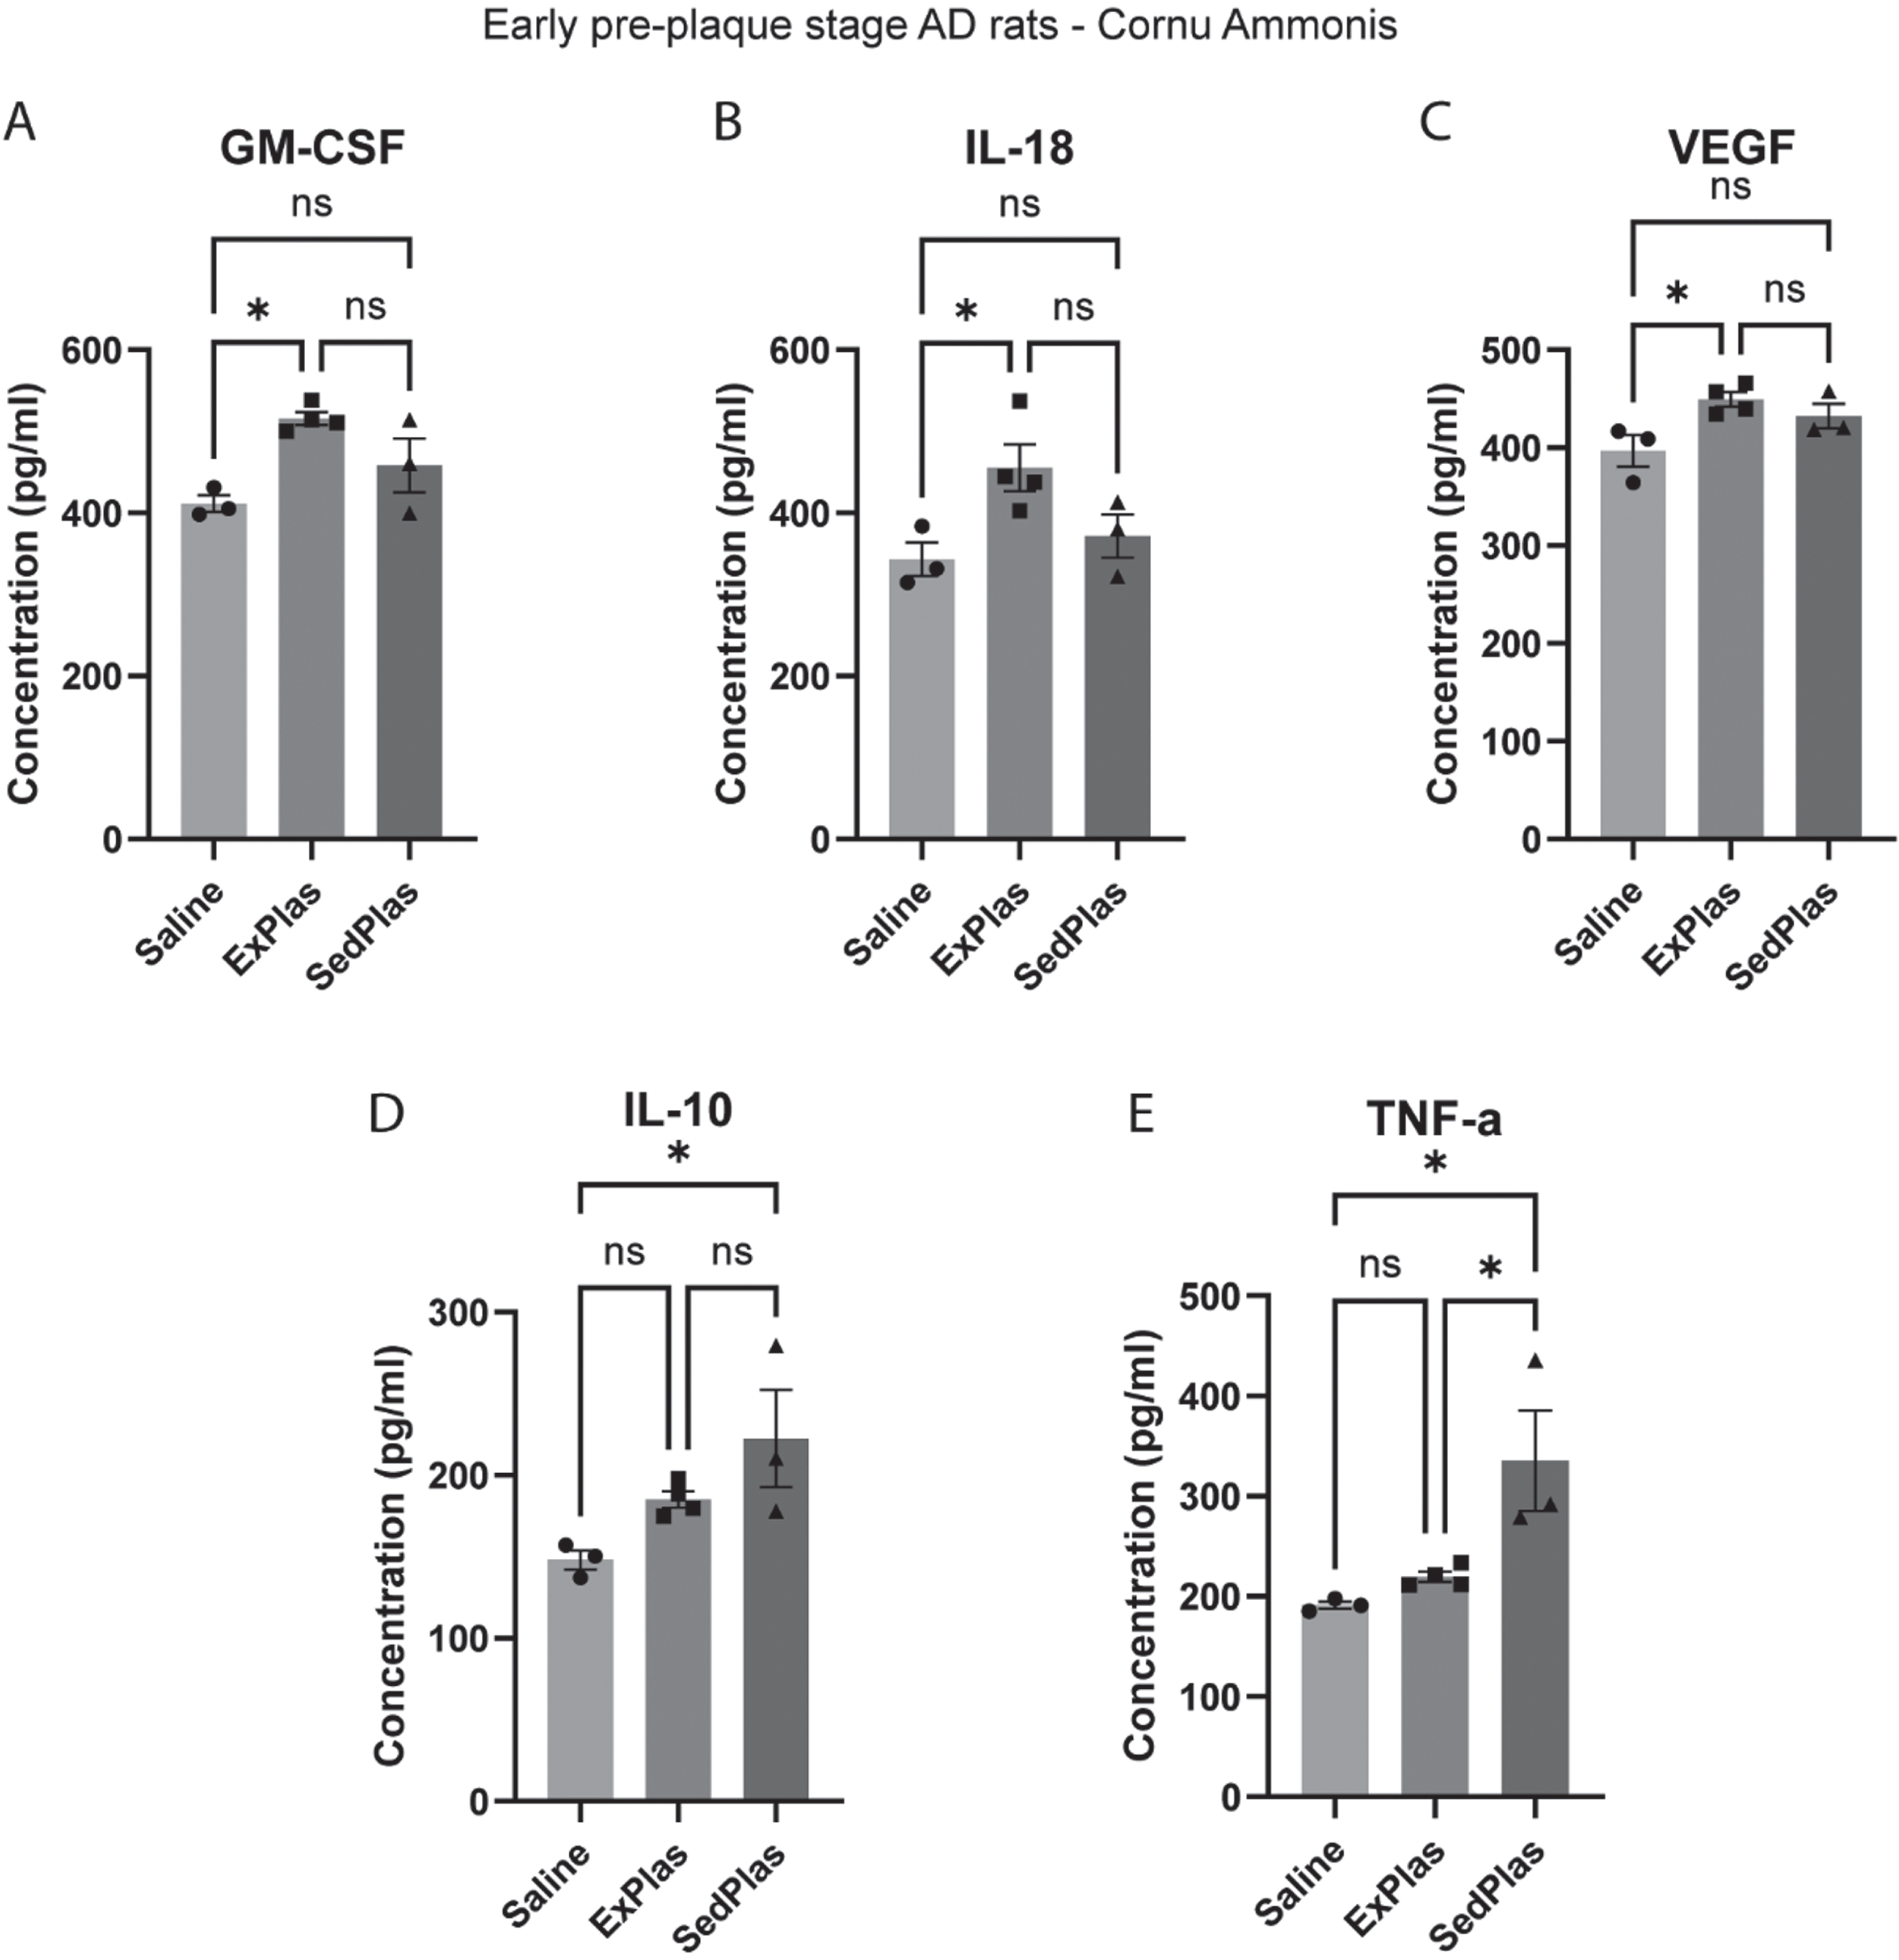
Table 1
Cytokines in the intermediate CA of the early-stage AD rats
| Mean concentration (pg/ml) per treatment group | |||
| Cytokine | Saline (n = 3) | ExPlas (n = 4) | SedPlas (n = 3) |
| G-CSF | 99.7 | 126.2 | 122.4 |
| GM-CSF | 411.4 | 515.8§ | 458.1 |
| GRO/KC | 254.2 | 285 | 278.4 |
| IFN-g | 122.8 | 173.4 | 161.0 |
| IL-1a | 124.9 | 155.3 | 146.4 |
| IL-1b | 390.9 | 435.0 | 459.7 |
| IL-2 | 128.5 | 146.3 | 181.7 |
| IL-4 | 116.0 | 139.4 | 155.7 |
| IL-5 | 72.7 | 93.8 | 90.0 |
| IL-6 | 160.0 | 194.1 | 187.7 |
| IL-7 | 321.9 | 368.7 | 363.9 |
| IL-10 | 148.1 | 185.2 | 222.5* |
| IL-12(p70) | 278.3 | 334.0 | 349.0 |
| IL-13 | 123.6 | 160.1 | 158.7 |
| IL-17 | 360.0 | 429.2 | 391.9 |
| IL-18 | 343.3 | 455.5$ | 371.7 |
| M-CSF | 172.9 | 197.8 | 202.5 |
| MCP-1 | 281.9 | 311.2 | 338.4 |
| MIP-1a | 201.8 | 252 | 249.1 |
| MIP-3a | 111.7 | 135.2 | 136.5 |
| RANTES | 143.3 | 163.7 | 157.1 |
| TNF-a | 191.4 | 219.5 | 335.5# |
| VEGF | 396.8 | 449.4‡ | 432.3 |
Abbreviations: G-CSF = Granulocyte colony-stimulating factor, GM-CSF = Granulocyte-macrophage colony-stimulating factor, GRO/KC = C-X-C motif chemokine ligand 1, IFN-g = Interferon gamma, IL-1a = Interleukin-1-alpha, IL-1b = Interleukin-1-beta, IL-2 = Interleukin-2, IL-4 = Interleukin-4, IL-5 = Interleukin-5, IL-6 = Interleukin-6, IL-7 = Interleukin-7, IL-10 = Interleukin-10, IL-12(p70) = Interleukin-12, IL-13 = Interleukin-13, IL-17 = Interleukin-17, IL-18 = Interleukin-18, M-CSF = Macrophage colony-stimulating factor, MCP-1 = Monocyte chemoattractant protein-1, MIP-1a = Macrophage inflammatory protein-1 alpha, MIP-3a = Macrophage inflammatory protein-3 alpha, RANTES = Chemokine ligand 5, TNF-a = Tumor necrosis factor alpha, VEGF = Vascular endothelial growth factor. §Higher in ExPlas vs. Saline (p < 0.05), *higher in SedPlas vs. Saline (p < 0.05), $higher in ExPlas vs. Saline (p < 0.05), #higher in SedPlas vs. other two groups (p < 0.05), ‡higher in ExPlas vs. Saline (p < 0.05). One-way ANOVA with Tukey’s multiple comparisons test.
In the later-stage AD rats, only 2 out of 23 cytokines were significantly altered with plasma injections when compared to saline injections (Fig. 9). The interleukin-17 (IL-17) levels were significantly higher in the ExPlas-treated rats compared to the saline-treated rats (Fig. 10A; p < 0.05). Similar to that in the early-stage treated rats, TNF-α levels were significantly higher in the later-stage SedPlas-treated rats compared to the saline-treated rats (Fig. 10B; p < 0.05). All cytokine concentrations measured in the intermediate CA of the later-stage AD rats are shown in Table 2. There were several positive correlations between the cytokines (Supplementary file).
Fig. 10
Significantly altered cytokines in the intermediate cornu ammonis of the later-stage AD rats. The levels of 23 cytokines were assessed in the intermediate cornu ammonis of later-stage AD rats treated with saline (n = 6), ExPlas (n = 3), or SedPlas (n = 3) injections. Only IL-17 (A) and TNF-α (B) showed significant differences between the treatment groups. One-way ANOVA with Tukey’s multiple comparisons test, *p < 0.05.
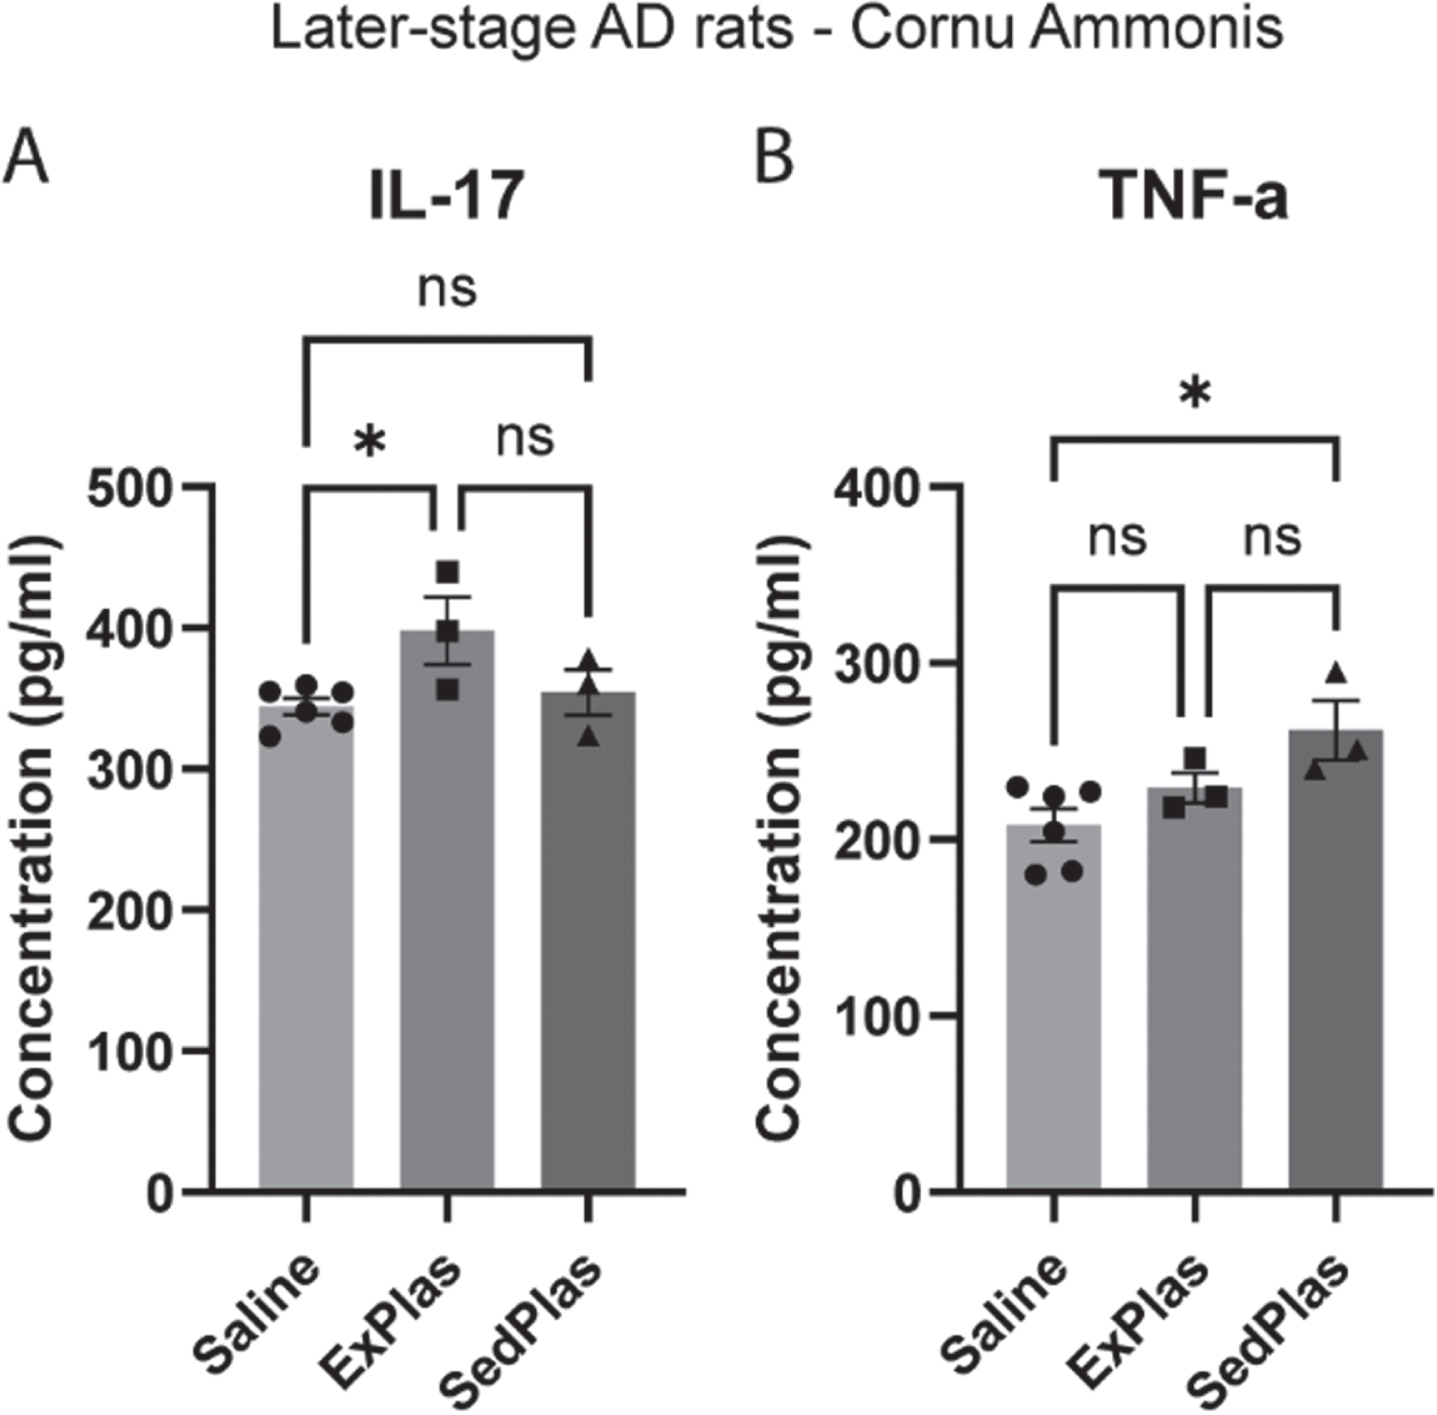
Table 2
Cytokines in the intermediate CA of the later-stage AD rats
| Mean concentration (pg/ml) per treatment group | |||
| Cytokine | Saline (n = 6) | ExPlas (n = 3) | SedPlas (n = 3) |
| G-CSF | 102.1 | 112.4 | 96.9 |
| GM-CSF | 399.4 | 419.3 | 429.5 |
| GRO/KC | 253.0 | 272.6 | 250.5 |
| IFN-g | 128.2 | 150.8 | 122.7 |
| IL-1a | 120.5 | 141.0 | 119.5 |
| IL-1b | 408.0 | 432.1 | 444.5 |
| IL-2 | 145.7 | 158.4 | 178.3 |
| IL-4 | 122.9 | 139.5 | 143.0 |
| IL-5 | 70.0 | 79.5 | 67.8 |
| IL-6 | 159.4 | 179.9 | 164.1 |
| IL-7 | 345.4 | 350.6 | 365.7 |
| IL-10 | 168.4 | 191.3 | 183.9 |
| IL-12(p70) | 295.0 | 308.7 | 300.4 |
| IL-13 | 127.9 | 145.2 | 115.9 |
| IL-17 | 344.2 | 398.0‡ | 354.3 |
| IL-18 | 355.2 | 341.8 | 356.5 |
| M-CSF | 179.0 | 198.6 | 179.2 |
| MCP-1 | 277.2 | 312.3 | 306.5 |
| MIP-1a | 196.3 | 223.7 | 195.4 |
| MIP-3a | 111.6 | 126.9 | 112.3 |
| RANTES | 133.7 | 154.7 | 138.6 |
| TNF-a | 208.1 | 229.4 | 262.0* |
| VEGF | 388.7 | 421.2 | 396.3 |
Abbreviations: G-CSF = Granulocyte colony-stimulating factor, GM-CSF = Granulocyte-macrophage colony-stimulating factor, GRO/KC = C-X-C motif chemokine ligand 1, IFN-g = Interferon gamma, IL-1a = Interleukin-1-alpha, IL-1b = Interleukin-1-beta, IL-2 = Interleukin-2, IL-4 = Interleukin-4, IL-5 = Interleukin-5, IL-6 = Interleukin-6, IL-7 = Interleukin-7, IL-10 = Interleukin-10, IL-12(p70) = Interleukin-12, IL-13 = Interleukin-13, IL-17 = Interleukin-17, IL-18 = Interleukin-18, M-CSF = Macrophage colony-stimulating factor, MCP-1 = Monocyte chemoattractant protein-1, MIP-1a = Macrophage inflammatory protein-1 alpha, MIP-3a = Macrophage inflammatory protein-3 alpha, RANTES = Chemokine ligand 5, TNF-a = Tumor necrosis factor alpha, VEGF = Vascular endothelial growth factor. ‡Higher in ExPlas vs. Saline (p < 0.05), *higher in SedPlas vs. Saline (p < 0.05). One-way ANOVA with Tukey’s multiple comparisons test.
DISCUSSION
Since microglia have emerged as significant players in early AD pathogenesis, we evaluated the effects of ExPlas injections on microglial count and morphology in the dorsal subiculum, intermediate CA, dorsal DG, and lateral EC of the McGill-R-Thy1-APP rat model of AD. Similar to observations regarding AD pathology in the human brain [6, 35], this rat model exhibits intraneuronal accumulation of soluble, oligomeric Aβ species beginning in these hippocampal and EC regions [25]. This precedes extracellular plaque deposition and can trigger neuronal dysfunction and inflammatory signaling that induces a microglial response and mobilization towards the affected neurons [6, 36]. Here, we showed that administration of plasma from exercise-trained and sedentary, young donor rats differentially modulate microglial morphology and cytokine levels in the AD rat model at an early pre-plaque stage of pathology but not at a later stage characterized by plaque emergence.
The AD rat model used has been characterized to exhibit intraneuronal Aβ accumulation throughout the hippocampal CA and subiculum areas and the EC at the age of 3 months and the earliest extracellular amyloid plaque pathology in the subiculum at the age of 6 months [24, 25]. Neurons of the subiculum and CA1 express elevated levels of monocyte chemoattractant protein-1 (MCP-1 also known as CCL2), macrophage inflammatory protein-1 alpha (MIP-1α also known as CCL3), macrophage colony-stimulating factor (M-CSF also known as CSF-1) as early as 5 months of age [6]. Several classical pro-inflammatory cytokines, such as TNF-α and interleukin-1-beta (IL-1β) were also previously found to increase in expression from 4 months to 12 months of age [34]. As the microglial response to Aβ and production of IL-1β is associated with morphological changes including loss of process length and branching [4, 5, 37], our finding that the microglia in the subiculum of the almost 7-month-old untreated AD rats have significantly fewer and shorter branches compared to those in the wild-type rats of the same age, likely reflects a microglial response to the observed amyloid plaque deposition. This conclusion is further supported by the positive correlation between the number of plaques and the number of microglia, as well as the negative correlation between the number of plaques and both the number of branches and the total branch length per microglia. A similar trend of microglial morphology changes was observed in the intermediate CA, but not in the lateral EC or dorsal DG, which aligns with the lower number of plaques found in these brain regions.
The greater number of branches and total branch length found for the microglia in the subiculum of the AD rats treated with ExPlas at the early, pre-plaque pathological stage may suggest treatment effects on intraneuronal Aβ and associated microglial response. The lack of similar changes to microglial morphology in the subiculum from SedPlas treatment emphasizes the role of exercise-induced changes in plasma mediating these effects. We previously found lower levels of several pro-inflammatory cytokines in ExPlas, collected 3 hours after the donor rats had finished their last exercise session, compared to SedPlas [24]. We also found that plasma collected from human donors 3 hours post-exercise increased viability of mouse hippocampal neuronal cells exposed to Aβ oligomers, suggesting acute exercise-induced changes in plasma may have a protective effect against Aβ-induced neurotoxicity [24]. To what extent the present findings may be caused by reduced levels of systemic inflammation or interaction between exercise-induced factors in plasma and Aβ (such as irisin [38] or clusterin [18, 39]), needs further investigation. Additionally, relative contributions of acute and chronic exercise effects in donor plasma remain unknown. Intriguingly, ExPlas and SedPlas showed similar effects on microglia in the intermediate CA of the early-stage AD rats. This discrepancy might be related to less progressed pathology in this region [24, 25], as there were no differential effects in the EC either.
In line with our results for amyloid plaques in both untreated and treated AD rats, DG has been shown to be less susceptible to Aβ accumulation and deposition up to the age of 6 months in the AD rat model [25]. Our observed differences in DG microglia in the early-stage treated rats are hence less likely to reflect Aβ-associated microglial responses. Beyond their responses to Aβ or other pathological insults, microglia also play a crucial role in the regulation of hippocampal neurogenesis within the dentate gyrus [40, 41]. The regulation of neurogenesis involves phagocytosis of newly born cells that fail to mature and integrate into the existing neural networks [41], but microglia can also secrete pro-inflammatory factors such as IL-1β and TNF-α that inhibit neurogenesis [42, 43]. The more branched appearance of microglia and lower levels of TNF-α (although measured in CA) in the ExPlas-treated rats may thus reflect less negative regulation of neurogenesis in these rats. However, considering that we previously detected ExPlas to similarly promote neurogenesis in the AD rat model independent of the treatment timing [24], it is intriguing that we did not observe similar morphological differences in microglial morphology between the later-stage AD rats.
Surprisingly, we found no significant differences in treatment effects on the microglia in any of the other assessed brain regions in the later-stage AD rats either. Notably, the lack of treatment effects on amyloid plaques in these regions may contribute to the absence of observable changes in microglia and vice versa. The pivotal role of microglia in AD is evident; however, the signals and interactions between microglia and extracellular amyloid plaques may substantially differ from those involving only intraneuronal Aβ peptides or oligomers [2]. It is therefore plausible that the same treatment may yield different effects depending on the treatment timing. Whether our findings may be partly attributed to the greater age difference between the donor and recipient rats or reduced responsiveness of the microglia [44], also requires further investigation. Nevertheless, plasma levels of several inflammatory mediators have been found at increased levels in aged animals, as well as in young animals exposed to an old systemic environment through heterochronic parabiosis [20]. This increase in systemic inflammation seems to impair hippocampal neurogenesis and cognitive function [20], which also aligns with the reports of upregulated inflammatory mediators found in plasma and cerebrospinal fluid of human AD patients as well as in the brain of the AD rat model used in the present study [6, 45].
The lower mean levels for nearly all cytokines in the saline-treated rats and the several significant differences between the plasma-treated and saline-treated rats independent of the timing of treatment demonstrates that injections of plasma from both exercised and sedentary donors can modulate hippocampal inflammatory signaling and emphasizes the role of systemic factors on central inflammatory processes. Our results complement a previous study in healthy mice and mice with lipopolysaccharide-induced neuroinflammation [18], which showed that exercised plasma transfusions could reduce inflammatory signaling in the brain. In that study, a total of eight retro-orbital vein injections of plasma, collected from voluntarily exercised 3–4-month-old male mice, were administered into sedentary male mice of similar age. The recipient mice were healthy or had peripherally induced neuroinflammation, and in both cases, exercised plasma transfusions reduced the expression of genes involved in inflammatory signaling in hippocampal tissue, compared to plasma collected from sedentary donors [18]. Our results provide further information on signaling molecules modulated by plasma injections and extend the knowledge into the context of early AD pathology.
We previously found significantly lower levels of several pro-inflammatory cytokines in ExPlas, compared to SedPlas [24]. Similar to our observation in ExPlas, a study in aged rats found exercise to reduce the levels of MCP-1 and C-X-C motif chemokine ligand 1 (GRO/KC or CXCL1) in serum [46]. Furthermore, just as we earlier found ExPlas injections to promote hippocampal neurogenesis [24], and here to upregulate hippocampal IL-18 and GM-CSF levels, that study [46] found exercise training to increase hippocampal IL-18, which strongly correlates with the effects of exercise on hippocampal neurogenesis. Similar to our results, there was also a strong positive correlation between IL-18 and GM-CSF levels, although GM-CSF was only detected in cortical samples [46].
GM-CSF (also known as CSF2) has been associated with protective response of microglia to prevent deleterious Aβ accumulation in AD models. For instance, intrahippocampal injections of recombinant GM-CSF were found to reduce amyloid plaque deposition in the double transgenic APP/PS1 mice [47]. Subcutaneously injected GM-CSF similarly increased the number of microglia in the hippocampus, reduced total Aβ load, and improved cognitive function in this mouse model of AD [47]. Another study further demonstrated that GM-CSF can stimulate microglial proliferation and clearance of Aβ reducing the plaque load in an ex vivo model with microglia of aged APP/PS1 mouse origin [44]. Even though we did not find significant effects of ExPlas injections on the number of microglia or the plaque load, the higher levels of GM-CSF and the greater number and length of microglial branches found in the early-stage injected rats may hence suggest beneficial modulation of microglial activity.
VEGF has been found to be a key mediator of exercise-induced increases in hippocampal neurogenesis and angiogenesis [48, 49]. Our finding of upregulated VEGF levels in the ExPlas-treated rats provides a possible mechanism for our earlier report of ExPlas treatment promoting hippocampal neurogenesis in this AD rat model [24]. VEGF has also been reported to be upregulated in correlation with IL-17 in response to exercise [46]. Further mimicking the effects of exercise training in the brain [50], ExPlas treatment resulted in lower levels of TNF-α than SedPlas in the early-stage rats. Remarkably, TNF-α is one of the proinflammatory cytokines upregulated in the AD rat model [34] and earlier reports in different models have shown elevated TNF-α levels to be associated with microglial reactivity, delayed increase in IL-10, suppressed clearance of Aβ peptides and subsequently promoted neuronal degeneration [51–53], which may again suggest an enhanced response of microglia to Aβ in the ExPlas-treated rats.
The major strength of the study is that we performed the same analyses in four different brain regions of the transgenic AD rat model at two different pathological stages of AD. We also performed wide cytokine analysis to accompany comprehensive morphological analysis of microglia. However, this was only done in the CA, and the responses in the subiculum, DG, and EC may differ. Therefore, the generalizability of the results to the entire hippocampus or other brain regions may be limited. The source of the cytokines is not known, leaving the uncertainty about whether they originate from neurons, astrocytes, endothelial cells, or microglia. Based on these data, it is not possible to draw conclusions on the functional implications of the observed modulation of microglial morphology and cytokine levels either. To complement the performed methods and address these limitations, future studies should consider employing additional techniques such as single-cell RNA sequencing to help identify the specific cell types producing the cytokines and examine the heterogeneity of microglia responses in different brain regions. Knockout models could also offer valuable information about the individual contributions of different cytokines and cell types to the observed responses and elucidating the functional implications of the results.
CONCLUSION
Intravenous injections of blood plasma from exercise-trained and sedentary donors differentially modulate microglial morphology and cytokine levels in the AD rat model at an early pre-plaque stage of pathology, demonstrating the significant impact systemic factors can have on the brain. The results suggest plasma from exercise-trained donors may reduce proinflammatory TNF-α signaling and promote microglial responses to early accumulation of Aβ. However, the lack of significant effects observed in later-stage treatments on microglia and amyloid plaques in the later-stage rats underscores the potential importance of timing considerations in interventions for AD treatments.
ACKNOWLEDGMENTS
We want to thank Grethe Mari Olsen and Bruno Monterotti for helping with brain tissue processing, Knut Sverre Grøn for assistance with intravenous injections, Laia Casas Manzanal for protein isolation from brain tissue and Liv Ryan and the Department of Clinical and Molecular Medicine (IKOM) for performing the multiplex cytokine assay.
FUNDING
The study was funded by The Norwegian Research Council, the Liaison Committee between the Central Norway Regional Health Authority and NTNU. RMS was funded by the Coordination for the Improvement of Higher Education Personnel –Brazil (Capes).
CONFLICTS OF INTEREST
The authors have no conflict of interest to report.
SUPPLEMENTARY MATERIAL
[1] The supplementary material is available in the electronic version of this article: https://dx.doi.org/10.3233/BPL-230154.
REFERENCES
[1] | 2022 Alzheimer’s disease facts and figures Alzheimers Dement. (2022) ;18: (4):700–89. |
[2] | Leng F , Edison P . Neuroinflammation and microglial activation in Alzheimer disease: Where do we go from here? Nat Rev Neurol. (2021) ;17: (3):157–72. |
[3] | Prinz M , Jung S , Priller J . Microglia Biology: One Century of Evolving Concepts. Cell. (2019) ;179: (2):292–311. |
[4] | Nimmerjahn A , Kirchhoff F , Helmchen F . Resting microglial cells are highly dynamic surveillants of brain parenchyma in vivo. Science. (2005) ;308: (5726):1314–8. |
[5] | Bolmont T , Haiss F , Eicke D , Radde R , Mathis CA , Klunk WE , et al. Dynamics of the microglial/amyloid interaction indicate a role in plaque maintenance. J Neurosci. (2008) ;28: (16):4283–92. |
[6] | Welikovitch LA , Do Carmo S , Maglóczky Z , Malcolm JC , Lőke J , Klein WL , et al. Early intraneuronal amyloidtriggers neuron-derived inflammatory signaling in APP transgenic rats and human brain. Proc Natl Acad Sci U S A. (2020) ;117: (12):6844–54. |
[7] | Hong S , Beja-Glasser VF , Nfonoyim BM , Frouin A , Li S , Ramakrishnan S , et al. Complement and microglia mediate early synapse loss in Alzheimer mouse models. Science. (2016) ;352: (6286):712–6. |
[8] | Wang C , Yue H , Hu Z , Shen Y , Ma J , Li J , et al. Microglia mediate forgetting via complement-dependent synaptic elimination. Science. (2020) ;367: (6478):688–94. |
[9] | Cacci E , Claasen JH , Kokaia Z . Microglia-derived tumor necrosis factor-alpha exaggerates death of newborn hippocampal progenitor cells in vitro . J Neurosci Res. (2005) ;80: (6):789–97. |
[10] | Huuha AM , Norevik CS , Moreira JBN , Kobro-Flatmoen A , Scrimgeour N , Kivipelto M , et al. Can exercise training teach us how to treat Alzheimer’s disease? Ageing Res Rev (2022) ;75: :101559. |
[11] | Maass A , Düzel S , Goerke M , Becke A , Sobieray U , Neumann K , et al. Vascular hippocampal plasticity afteraerobic exercise in older adults. Mol Psychiatry. (2015) ;20: (5):585–93. |
[12] | Erickson KI , Voss MW , Prakash RS , Basak C , Szabo A , Chaddock L , et al. Exercise training increases size of hippocampus and improves memory. Proc Natl Acad Sci U S A. (2011) ;108: (7):3017–22. |
[13] | van Praag H , Shubert T , Zhao C , Gage FH . Exercise enhances learning and hippocampal neurogenesis in aged mice. J Neurosci. (2005) ;25: (38):8680–5. |
[14] | Pereira AC , Huddleston DE , Brickman AM , Sosunov AA , Hen R , McKhann GM , et al. An in vivo correlate of exercise-induced neurogenesis in the adult dentate gyrus. Proc Natl Acad Sci U S A. (2007) ;104: (13):5638–43. |
[15] | Yuede CM , Zimmerman SD , Dong H , Kling MJ , Bero AW , Holtzman DM , et al. Effects of voluntary and forced exercise on plaque deposition, hippocampal volume, and behavior in the Tgmouse model of Alzheimer’s disease. Neurobiol Dis. (2009) ;35: (3):426–32. |
[16] | Zhang X , He Q , Huang T , Zhao N , Liang F , Xu B , et al. Treadmill exercise decreases Aβ deposition andcounteracts cognitive decline in APP/PS1 mice, possibly via hippocampal microglia modifications. Front AgingNeurosci. (2019) ;11: :78. |
[17] | Yang L , Wu C , Li Y , Dong Y , Wu CY , Lee RH , et al. Long-term exercise pre-training attenuates Alzheimer’s disease-related pathology in a transgenic rat model of Alzheimer’s disease. Geroscience. (2022) ;44: (3):1457–77. |
[18] | De Miguel Z , Khoury N , Betley MJ , Lehallier B , Willoughby D , Olsson N , et al. Exercise plasma boosts memory and dampens brain inflammation via clusterin. Nature. (2021) ;600: (7889):494–9. |
[19] | Tari AR , Norevik CS , Scrimgeour NR , Kobro-Flatmoen A , Storm-Mathisen J , Bergersen LH , et al. Are the neuroprotective effects of exercise training systemically mediated? Prog Cardiovasc Dis (2019) ;62: (2):94–101. |
[20] | Villeda SA , Luo J , Mosher KI , Zou B , Britschgi M , Bieri G , et al. The ageing systemic milieu negatively regulates neurogenesis and cognitive function. Nature. (2011) ;477: (7362):90–4. |
[21] | Villeda SA , Plambeck KE , Middeldorp J , Castellano JM , Mosher KI , Luo J , et al. Young blood reverses age-related impairments in cognitive function and synaptic plasticity in mice. Nat Med. (2014) ;20: (6):659–63. |
[22] | Horowitz AM , Fan X , Bieri G , Smith LK , Sanchez-Diaz CI , Schroer AB , et al. Blood factors transfer beneficial effects of exercise on neurogenesis and cognition to the aged brain. Science. (2020) ;369: (6500):167–73. |
[23] | Kim TW , Park SS , Park JY , Park HS . Infusion of plasma from exercised mice ameliorates cognitive dysfunction byincreasing hippocampal neuroplasticity and mitochondrial functions in 3×Tg-AD mice. Int J Mol Sci. (2020) ;21: (9):3291. |
[24] | Norevik CS , Huuha AM , Røsbjørgen RN , Bergersen L , Jacobsen K , Miguel-dos-Santos R , et al. Exercised blood plasma promotes hippocampal neurogenesis in the Alzheimer’s disease rat brain. Journal of Sport and Health Science. 2023. |
[25] | Leon WC , Canneva F , Partridge V , Allard S , Ferretti MT , DeWilde A , et al. A novel transgenic rat model with a full Alzheimer’s-like amyloid pathology displays pre-plaque intracellular amyloid-beta-associated cognitive impairment. J Alzheimers Dis. (2010) ;20: (1):113–26. |
[26] | Annelise Hem DME , Espen Engh & Adrian Smith. Laboratory Animal Science. 2001. |
[27] | Antunes M , Biala G . The novel object recognition memory: Neurobiology, test procedure, and its modifications. Cogn Process. (2012) ;13: (2):93–110. |
[28] | Paxinos G , Watson C . The rat brain : In stereotaxic coordinates. Compact 6th ed. ed. Amsterdam: Elsevier/AP; 2009. |
[29] | Schindelin J , Arganda-Carreras I , Frise E , Kaynig V , Longair M , Pietzsch T , et al. Fiji: An open-source platformfor biological-image analysis. Nat Methods. (2012) ;9: (7):676–82. |
[30] | Young K , Morrison H . Quantifying microglia morphology from photomicrographs of immunohistochemistry prepared tissue using imageJ. J Vis Exp. 2018(136). |
[31] | Arganda-Carreras I , Fernández-González R , Muñoz-Barrutia A , Ortiz-De-Solorzano C . 3D reconstructionof histological sections: Application to mammary gland tissue. Microsc Res Tech. (2010) ;73: (11):1019–29. |
[32] | Hovens I , Nyakas C , Schoemaker R . A novel method for evaluating microglial activation using ionized calciumbinding adaptor protein-1 staining: Cell body to cell size ratio. Neuroimmunology and Neuroinflammation. 2014: 82-8. |
[33] | Qi Y , Klyubin I , Harney SC , Hu N , Cullen WK , Grant MK , et al. Longitudinal testing of hippocampal plasticity reveals the onset and maintenance of endogenous human Aß-induced synaptic dysfunction in individual freely behaving pre-plaque transgenic rats: Rapid reversal by anti-Aßagents. Acta Neuropathol Commun. (2014) ;2: :175. |
[34] | Hanzel CE , Pichet-Binette A , Pimentel LS , Iulita MF , Allard S , Ducatenzeiler A , et al. Neuronal driven pre-plaque inflammation in a transgenic rat model of Alzheimer’s disease. Neurobiol Aging. (2014) ;35: (10):2249–62. |
[35] | Welikovitch LA , Do Carmo S , Maglóczky Z , Szocsics P , Lőke J , Freund T , et al. Evidence of intraneuronalAβ accumulation preceding tau pathology in the entorhinal cortex. Acta Neuropathol. (2018) ;136: (6):901–17. |
[36] | Yang T , Li S , Xu H , Walsh DM , Selkoe DJ . Large Soluble Oligomers of Amyloid β-Protein from AlzheimerBrain Are Far Less Neuroactive Than the Smaller Oligomers to Which They Dissociate. J Neurosci. (2017) ;37: (1):152–63. |
[37] | Madry C , Kyrargyri V , Arancibia-Cárcamo IL , Jolivet R , Kohsaka S , Bryan RM , et al. Microglial Ramification,Surveillance, and Interleukin-1β Release Are Regulated by the Two-Pore Domain K(+) Channel THIK-1. Neuron. (2018) ;97: (2):299–312.e6. |
[38] | Islam MR , Valaris S , Young MF , Haley EB , Luo R , Bond SF , et al. Exercise hormone irisin is a critical regulator of cognitive function. Nat Metab. (2021) ;3: (8):1058–70. |
[39] | de Retana SF , Marazuela P , Solé M , Colell G , Bonaterra A , Sánchez-Quesada JL , et al. Peripheraladministration of human recombinant ApoJ/clusterin modulates brain beta-amyloid levels in APP23 mice. AlzheimersRes Ther. (2019) ;11: (1):42. |
[40] | Kreisel T , Wolf B , Keshet E , Licht T . Unique role for dentate gyrus microglia in neuroblast survival and in VEGF-induced activation. Glia. (2019) ;67: (4):594–618. |
[41] | Sierra A , Encinas JM , Deudero JJ , Chancey JH , Enikolopov G , Overstreet-Wadiche LS , et al. Microglia shape adult hippocampal neurogenesis through apoptosis-coupled phagocytosis. Cell Stem Cell. (2010) ;7: (4):483–95. |
[42] | Monje ML , Toda H , Palmer TD . Inflammatory blockade restores adult hippocampal neurogenesis. Science. (2003) ;302: (5651):1760–5. |
[43] | Ji R , Tian S , Lu HJ , Lu Q , Zheng Y , Wang X , et al. TAM receptors affect adult brain neurogenesis by negative regulation of microglial cell activation. J Immunol. (2013) ;191: (12):6165–77. |
[44] | Daria A , Colombo A , Llovera G , Hampel H , Willem M , Liesz A , et al. Young microglia restore amyloid plaque clearance of aged microglia. Embo j. (2017) ;36: (5):583–603. |
[45] | Galimberti D , Schoonenboom N , Scheltens P , Fenoglio C , Bouwman F , Venturelli E , et al. Intrathecal chemokine synthesis in mild cognitive impairment and Alzheimer disease. Arch Neurol. (2006) ;63: (4):538–43. |
[46] | Speisman RB , Kumar A , Rani A , Foster TC , Ormerod BK . Daily exercise improves memory, stimulates hippocampalneurogenesis and modulates immune and neuroimmune cytokines in aging rats. Brain Behav Immun. (2013) ;28: :25–43. |
[47] | Boyd TD , Bennett SP , Mori T , Governatori N , Runfeldt M , Norden M , et al. GM-CSF upregulated in rheumatoid arthritis reverses cognitive impairment and amyloidosis in Alzheimer mice. J Alzheimers Dis. (2010) ;21: (2):507–18. |
[48] | Fabel K , Fabel K , Tam B , Kaufer D , Baiker A , Simmons N , et al. VEGF is necessary for exercise-induced adult hippocampal neurogenesis. Eur J Neurosci. (2003) ;18: (10):2803–12. |
[49] | Morland C , Andersson KA , Haugen ØP , Hadzic A , Kleppa L , Gille A , et al. Exercise induces cerebral VEGF andangiogenesis via the lactate receptor HCAR1. Nat Commun. (2017) ;8: :15557. |
[50] | Freitas DA , Rocha-Vieira E , Soares BA , Nonato LF , Fonseca SR , Martins JB , et al. High intensity interval training modulates hippocampal oxidative stress, BDNF and inflammatory mediators in rats. Physiol Behav. (2018) ;184: :6–11. |
[51] | Neniskyte U , Vilalta A , Brown GC . Tumour necrosis factor alpha-induced neuronal loss is mediated by microglial phagocytosis. FEBS Lett. (2014) ;588: (17):2952–6. |
[52] | Meda L , Cassatella MA , Szendrei GI , Otvos L, Jr. , Baron P. , Villalba M. , et al. Activation of microglial cells by beta-amyloid protein and interferon-gamma.. Nature. (1995) ;374: (6523):647–50. |
[53] | Yamamoto M , Kiyota T , Horiba M , Buescher JL , Walsh SM , Gendelman HE , et al. Interferon-gamma and tumor necrosis factor-alpha regulate amyloid-beta plaque deposition and beta-secretase expression in Swedish mutant APP transgenic mice. Am J Pathol. (2007) ;170: (2):680–92. |

