
Imaging Myelination In Vivo Using Transparent Animal Models
Abstract
Myelination by oligodendrocytes in the central nervous system (CNS) and Schwann cells in the peripheral nervous system is essential for nervous system function and health. Despite its importance, we have a relatively poor understanding of the molecular and cellular mechanisms that regulate myelination in the living animal, particularly in the CNS. This is partly due to the fact that myelination commences around birth in mammals, by which time the CNS is complex and largely inaccessible, and thus very difficult to image live in its intact form. As a consequence, in recent years much effort has been invested in the use of smaller, simpler, transparent model organisms to investigate mechanisms of myelination in vivo. Although the majority of such studies have employed zebrafish, the Xenopus tadpole also represents an important complementary system with advantages for investigating myelin biology in vivo. Here we review how the natural features of zebrafish embryos and larvae and Xenopus tadpoles make them ideal systems for experimentally interrogating myelination by live imaging. We outline common transgenic technologies used to generate zebrafish and Xenopus that express fluorescent reporters, which can be used to image myelination. We also provide an extensive overview of the imaging modalities most commonly employed to date to image the nervous system in these transparent systems, and also emerging technologies that we anticipate will become widely used in studies of zebrafish and Xenopus myelination in the near future.
INTRODUCTION
The ensheathment of axons with myelin is critical for nervous system function. Often compared to the plastic coating on electrical wires, myelin provides axons with “insulation” that allows saltatory conduction, which increases the speed of nerve impulses by up to 100-fold compared to unmyelinated axons [1]. However, over the past two decades it has become increasingly evident that myelin’s role is much more complex than just an “insulator”. The importance of myelin for long-term axonal integrity has been highlighted [2], including roles in providing metabolic support to axons [3, 4]. Modulation of the distribution, length and thickness of myelin sheaths (often referred to as the internodes) has been implicated in synchronizing the timing of signals in neuronal circuits [5, 6]. Furthermore, there is increasing evidence of myelin plasticity during adulthood [7], which has been suggested to be important for learning [8]. Loss of myelin and/or dysfunction of myelinating glia is a pathological feature of many neurological diseases, including multiple sclerosis, leukodystrophies, amyotrophic lateral sclerosis, Guillain-Barre syndrome, Huntington’s disease, and Down’s Syndrome [9–12], and changes to myelin are implicated in a range of psychiatric disorders, including schizophrenia [13]. Yet, despite the obvious importance of myelin, the mechanisms of myelination, myelin plasticity, and myelin repair remain poorly understood. Thus, there is a pressing need for good models to study these processes, particularly in vivo.
Myelinated axons with nodes of Ranvier (the short unmyelinated gaps between consecutive myelin sheaths where voltage gated sodium channels are clustered to propagate action potentials) are essentially a vertebrate specific innovation. Myelin sheaths are membrane rich elaborations of specialised glial cells called Schwann cells in the peripheral nervous system (PNS) and oligodendrocytes in the central nervous system (CNS). Much of what we currently know about myelin has come from observations made in fixed tissue samples from humans and rodents, as the inaccessibility of the nervous system (particularly the CNS) and long-time course of myelination in humans and rodents makes longitudinal studies of myelination in its native in vivo context challenging. Unfortunately, reliance on fixed tissue analyses limits insight into the cell-cell interactions that underlie myelin formation, regulation and regeneration, and is subject to the introduction of fixation artefacts. Therefore small and transparent zebrafish larvae and Xenopus tadpoles are becoming popular models to study mechanisms of myelination using intravital imaging in the living animal. Several excellent reviews have recently summarised the biological insights gained from studying myelination in vivo in zebrafish [14–16]. In this review we will focus on the tools available for live imaging these transparent models, and on imaging modalities that can be employed to gain novel insights into myelination.
ADVANTAGES OF ZEBRAFISH AND XENOPUS FOR LIVE-IMAGING STUDIES
Both zebrafish and Xenopus have several advantages that make them ideal for live-imaging studies. Their embryos develop outside the mother and are accessible for manipulation and imaging from the single cell stage. The small size and optical transparency of early zebrafish embryos and larvae and Xenopus tadpoles allow for non-invasive live-imaging of the intact animal, even by consecutive time-lapse imaging over days [17, 18]. In addition, after individual imaging sessions animals can be returned to their growth medium (simple buffered water) and be re-imaged days or weeks later, allowing one to follow the same region or specific cell for extended time courses, or before and after an experimental treatment. Imaging in older, larger animals does become more challenging, due to increased size and opacity. However, in zebrafish, several mutants have been described in which pigment formation is disrupted (ie. golden, nacre, casper), allowing for extended live-imaging studies as animals age [19–21]. The chemical PTU can also be used to prevent pigment formation; however, it has been linked to developmental defects and for this reason is often not the preferred method for many studies [22, 23].
Furthermore, both zebrafish and Xenopus are genetically tractable organisms allowing for the easy generation of transgenic animals expressing genes of interest, such as fluorescent reporters. Expression of transgenes can be restricted to desired cell-types through the use of specific gene promoter sequences. The cell specific expression can be mosaic (by injection into the fertilized egg), or uniform (by generating stable transgenic lines). Moreover, an array of tools has been developed to obtain temporal regulation of gene expression, allowing for further control of gene expression (described further below). In addition to expressing genes-of-interest/fluorescent reporters, there are now also several different systems in use for the generation of knockout animals, including Zinc fingers, TALENS, and CRISPR/Cas9, which enable imaging experiments assessing the role of specific genes [for recent review see 24, 25, 26]. These techniques are aided by the fact that the entire genome of the zebrafish was published in 2013, while ≥85% of Xenopus tropicalis and Xenopus laevis genomes have been sequenced to date [27–29]. Both zebrafish and Xenopus tropicalis are also amendable to forward genetic screens based on random mutagenesis, which can be used to identify novel genes involved in biological processes [30–32], including myelination [33, 34]. However, despite their better tractability for genetic manipulation (diploid genome), to our knowledge essentially no studies on myelination in Xenopus tropicalis have been carried out to date. Therefore, all references to Xenopus for the remainder of the review will refer to those carried out on Xenopus laevis (which have a tetraploid genome).
ADVANTAGES OF ZEBRAFISH AND XENOPUS FOR STUDYING MYELINATION
A major advantage of using zebrafish to study developmental events, including myelination, is their rapid embryonic development. Organogenesis is underway throughout the embryo by 2 days post-fertilization (dpf), and by 5 dpf complex swimming and feeding behaviours can be observed. In the PNS, Schwann cell precursors are observed along the posterior lateral line starting around 18 hours post-fertilization (hpf) [35], and myelination commences by just 2 dpf [36]. Similarly, in the CNS, the first oligodendrocyte precursor cells (OPCs) are observed around 36 hpf [37] and myelinating oligodendrocytes are observed from 60 hpf [38] (Fig. 1). Robust myelination of both the dorsal and ventral tracts of the hindbrain and spinal cord is achieved over the following days [39], with a slower rate of ongoing myelination observed into adulthood [40]. In contrast, myelination in rodents occurs over a longer time-course, and primarily at postnatal stages when the nervous system is already highly complex and largely inaccessible, making dynamic analyses of myelination in vivo technically much more challenging. Importantly, the structure and composition of myelin is generally well conserved between zebrafish and mammals, as are many of the molecular mechanisms controlling myelination. Some notable differences do exist however in terms of protein expression. Myelin protein zero is expressed in both the CNS and PNS of fish, as opposed to just the PNS of mammals [41]. Zebrafish also express some myelin proteins (36K, claudin K, Zwilling-A/B) for which no paralogs in rodents have currently been identified [42–44]. Detailed comparisons of fish and mammal myelin have recently been published [14, 16].
Compared to zebrafish, the time course and molecular mechanisms of myelination in Xenopus have not been investigated to the same degree, but appear broadly similar. Oligodendrocytes have been observed as early as stage 41-42 ( 3 dpf) in the brainstem of developing Xenopus tadpoles [45]. In the spinal cord ensheathment of axons is observed by stage 44/45 (∼4 dpf), with myelination throughout the ventral spinal cord by stage 46/47 (∼5 dpf) [46]. By stage 55 (∼32 dpf) robust myelination is observed throughout the brain, spinal cord, and optic nerve [45] (Fig. 1). Major myelin proteins in Xenopus are conserved with those in mammals [47–49]; however, as in zebrafish, P0 protein is also found in CNS myelin [50].
In addition to their rapid development, zebrafish and Xenopus tadpoles have a remarkable ability for regeneration [reviewed in 51, 52, 53], including remyelination [45, 54–56]. This capacity for myelin repair, together with the fact that they can be generated in large numbers (one mating can produce hundreds of offspring), be raised in small volumes of water, and be easily treated with bath application of drugs, makes both zebrafish and tadpoles highly amenable for pharmacological screens seeking compounds that promote or inhibit remyelination [57]. Furthermore, the ability to non-invasively and repetitive image the same animal over time is ideal for examining the dynamics of demyelination and remyelination in different disease and injury paradigms, free of fixation artefacts. In this review, we will discuss the tools available for live-imaging in zebrafish and tadpoles and how they have been used to unravel mechanisms of myelin formation, injury, and repair. We will also highlight up-and-coming techniques offering exciting prospective for future studies.
GENETIC TOOLS FOR THE EXPRESSION OF FLUORESCENT REPORTERS FOR LIVE-IMAGING
To date, almost all live imaging of myelin in zebrafish and tadpoles has been fluorescence-based. Although a small number of fluorescent vital dyes (e.g. CMC, Fluoromyelin) have been used to label myelin in other species [58, 59] and validated in fish tissue [60–62], the primary method to fluorescently label myelinating glia and/or myelin is by the expression of genetically encoded fluorescent reporter proteins using cell-specific promoters. This is primarily achieved by simply injecting constructs encoding reporters into very early embryos, usually at the 1-2 cell stage, which results in mosaic expression (Fig. 2A). As an alternative to early embryo injections, plasmids can also be introduced into cells at later stages of development via electroporation. Electroporation of single cells can be carried out by passing current through a DNA-filled glass micropipette placed against the cell of interest to transiently disrupt the plasma membrane and allow entry of the DNA [63–65]. Alternatively, large clusters of cells can be electroporated in the nervous system by injecting the DNA into the ventricle, then passing a current through the tissue using closely spaced platinum plate electrodes [66]. An advantage of electroporation is that it allows for more targeted selection of the cell(s) that expresses the construct, as opposed to the random mosaicism resulting from microinjection of constructs. Viral delivery of constructs is also feasible [67, 68], but not yet commonplace in zebrafish or Xenopus larvae/tadpoles, largely due to the facile nature of direct microinjection at early stages.
Mosaic expression of reporters is particularly useful when the experiment calls for observing the morphology and behaviour of single cells in great detail. For example, several studies have used the early stage plasmid injection technique for mosaic labelling to determine the number and length of myelin sheaths made by individual oligodendrocytes [38, 39], a feat which is simply not possible when all oligodendrocytes are labelled due to the high density of myelin sheaths along white matter tracts. Furthermore, multicolour mosaic labelling can be used to aid in the visualization of cell-cell interactions. For example, Kirby et al. injected two different fluorescent reporter constructs, meGFP and mRFP, to mosiacally label OPCs green (meGFP), red (mRFP), or yellow (meGFP + mRFP) depending on the constructs expressed. This allowed the authors to carefully examine the interactions between processes of neighbouring OPCs as they migrated throughout the spinal cord [37].
To obtain uniform rather than mosaic expression of reporter constructs, stable transgenic zebrafish are generated (Fig. 2B). To do this mosaic animals created via injection at the single cell stage are raised and their offspring screened for appropriate expression of the construct, indicating incorporation into the germline. Further analysis must then be done to determine whether these lines exhibit the desired pattern of expression, which might differ from expected due to the use of incomplete promoter/enhancer sequences or positional effects of the site of insertion. Several transgenic reporter lines have been published that label oligodendrocytes, Schwann cells, and/or myelin in the CNS and PNS (Table 1). This list continues to expand, thanks to the many tools that are now available to control expression in a spatial and temporal manner, as well as the ongoing development of new fluorescent proteins with expanding capabilities (such as photoconvertability). The following section provides a brief overview of tools available for the generation and expression of fluorescent reporters for live-imaging. We will focus on techniques used in zebrafish, which are currently more heavily used in the myelin field compared to tadpoles; however, the majority of techniques are also applicable in principle to Xenopus.
Generating cell type-specific fluorescent reporters
Cell type- and tissue-specific fluorescent reporter lines in zebrafish and Xenopus have been generated using three principle methods. The first method is by selecting a gene known to be specifically expressed in a cell type of interest and cloning its predicted promoter/enhancer elements upstream of a fluorescent reporter. To do this, many zebrafish labs make use of the Tol2kit, which harnesses the multi-site Gateway recombination cloning technique [69, 70] to assemble combinations of promoters, genes-of-interest and protein tags into a Tol2 transposon backbone [71]. In addition to being a rapid cloning method, Tol2 constructs benefit from the added advantage that the efficiency of genomic insertion can be increased by co-injection of mRNA encoding the Tol2 transposase [72]. While use of the Tol2Kit has streamlined the process of generating fluorescent reporters, other cloning strategies can also be employed to achieve the same means. Interestingly, promoters are sometimes conserved across species – for example, the mouse mbp promoter sequence has been used to express eGFP in myelinating oligodendrocytes of Xenopus and the mouse PLP promoter has been used to express eGFP in oligodendrocytes of zebrafish [45, 73].
One challenge of cloning promoters is identifying all the appropriate promoter/enhancer sequences regulating the desired expression pattern, as these can sometimes be scattered over large stretches of genomic DNA both upstream and downstream of the gene-of-interest [74]. In such cases, a second method called bacterial artificial chromosome (BAC)-transgenesis can be used [for review see 75]. BAC vectors contain large stretches of genomic DNA (>100 kb), which similar to plasmids can be injected and expressed in cells. Their sequences can be searched in online databases, such as the Zebrafish Information Network (ZFIN) (http://zfin.org), to identify clones that contain a gene with the expression pattern of interest. In many cases all the regulatory elements for that gene will also be contained within the BAC, due to its large size. Homologous recombination can be used to replace the gene with a fluorescent reporter cassette, with the goal of achieving an expression pattern for the reporter that mimics that of the replaced gene. For example, an olig2:GFP zebrafish reporter line, which labels oligodendrocyte lineage cells and motor neurons, was generating using BAC transgenesis [76].
A third method for obtaining cell-specific reporter lines relies on random integration of reporter cassettes into the genome using enhancer traps [for review see 77]. Typically, the reporter cassette contains a weak basal promoter and fluorescent protein gene, which is expressed when integrated in the proximity of an enhancer element. This will result in a spatio-temporal expression pattern that often, but not always, mimics the expression pattern of the gene closest to the insertion site. In the zebrafish community, large libraries of transgenic lines have been generated using enhancer traps, which can be screened for desired expression patterns [78–80]; however, to date no one has reported a myelinating cell specific enhancer trap line.
Despite which method is used to obtain cell-specificity, selecting the appropriate fluorescent reporter to express is critical for the success of imaging studies. A constantly expanding number of fluorescent reporters exist, each with their own advantages [reviewed in 81]. For example, deep-tissue live-imaging has benefited from the generation of far-red and near infrared fluorescent proteins, which use light wavelengths for excitation and emission that decrease light scattering and autofluorescence [82]. In addition to having different excitation and emission spectra, reporters also differ in their brightness, speed of folding, susceptibility to photobleaching, multimerization properties, and cytotoxicity. Some reporters have also been engineered to incorporate unique properties, such as photoactivatability, pH sensitivity, or ion sensitivity [83–85]. With the many options available, it is worth spending time to select the best reporter for the planned imaging project.
Another important consideration is how one wants the fluorescent reporter to be localized within the cell. For example, visualizing myelin requires membrane-targeted fluorescent proteins due to the extrusion of cytoplasm (and thus cytoplasmic reporters) from myelin during compaction. Membrane targeting can be achieved by adding a CAAX motif to the C-terminal of the fluorescent protein (where C is cysteine, A is aliphatic, and X is typically Met or Ser) [86]. This sequence is post-transcriptionally modified by the addition of a farnesyl group, which localizes the protein to the cytoplasmic face of the plasma membrane. Importantly, targeting fluorescent proteins in this way does not appear to disrupt myelin formation or cytoarchitecture. In cases where more specific reporter localization is required, fluorescent proteins can be fused in frame with a protein-of-interest, in order to target them to a specific structure or part of the cell where the protein-of-interest is normally is found. Care must be taken when choosing this approach however, as tagging proteins can interfere with their localization or function. For example, in rodents, expression of the myelin protein P0 fused to a myc-tag resulted in demyelination [87].
Use of the Gal4VP16/UAS system to amplify expression levels of reporters
Gal4 is a transcription factor, which recognizes and binds a specific DNA-binding site called an “upstream activating sequence” (UAS) that is not naturally present in multi-cellular organisms. Transgenic expression of Gal4 using a cell-specific promoter can be used to drive expression of genes placed downstream of UAS-sequences (plus a minimal promoter), which would otherwise not be expressed [88] (Fig. 3A). This system is often used to increase gene expression in cases where cell-specific promoters do not drive high enough expression on their own. It is particularly useful for live-imaging studies to drive high expression of fluorescent reporters that can then be imaged with lower laser intensities, reducing photodamage. For use in zebrafish, the Gal4 DNA binding domain has been fused to the minimal transcriptional activation domain of Herpes simplex virus protein 16 (VP16) to improve its activation ability [89]. More recently, the Gal4VP16 activator has been further optimized to generate the KalTA4 activator, which has increased expression levels and reduced toxicity in zebrafish [90]. To regulate gene expression in myelinating glial lineages, Gal4 activators have been placed downstream of the zebrafish claudin K, mbp, and sox10 promoters [54, 56, 91].
An interesting adaption of the Gal4/UAS system is the split Gal4 system [92]. This system uses two hemidrivers – one encoding the DNA-binding domain of Gal4 and one encoding the activation domain of Gal4. On their own, neither domain is functional, but when expressed in the same cell the two domains heterodimerize. This results in the formation of a functional protein that binds to UAS elements and drives transgene expression. By driving expression of each domain of Gal4 using a different promoter, expression of the reporter downstream of the UAS is restricted to those cells in which both promoters are expressed [92]. This is incredibly useful in cases where the desired cell specificity cannot be achieved using a single promoter. The split Gal4 system has been successfully applied in Drosophila, for example, to label specific subsets of neurons [92, 93]. Recently an adaptation of this system, the split KalTA4 system, was successful used in zebrafish [91]. In this case, a subset of neurons that were Sox10+ were labelled without also labelling the Sox10+ oligodendrocytes [91]. The use of such a system holds promise for controlling gene expression in difficult to target cell populations such as oligodendrocyteprecursors.
Expressing multiple reporter constructs
Several methods exist for expressing multiple genes-of-interest (e.g. fluorescent reporters) in the same cell. The simplest way is to simply inject two individual plasmids each encoding one of the reporters; however, the mosaic nature of expression means only a proportion of the cells will express both reporters. Alternatively, one can clone the two reporters, each driven by its own promoter, one after another in the same plasmid. While theoretically recombination into the genome should result in expression of both proteins, interference between the promoters can result in weak expression of one of the two transgenes or altered gene expression [94]. For this reason, vectors with a single bidirectional promoter have been generated that can be used to co-express two different reporter genes. These “Janus” vectors contain a series of UAS (Gal4 binding) sites, flanked on each side by an E1b minimal promoter [95, 96] (Fig. 3B). This has been reported to result in 97–99% of all cells expressing both transgenes, although the downstream reporter was found to be expressed at slightly higher levels than the upstream reporter [95]. Medusa vectors build upon Janus vectors, incorporating additional Janus sites or UAS sequences, allowing for expression of up to four transgenes from one plasmid [95].
An alternative approach to bidirectional vectors is the use of multicistronic vectors, which contain a single promoter followed by the coding sequence the two reporters separated by an internal ribosome entry site (IRES) sequence or a self-cleaving 2A-peptide sequence (Fig. 3C). IRES sequences function by recruiting a second ribosome to the mRNA, resulting in the translation of two separate proteins [97]. In contrast, 2A-peptide sequences cause ribosome skipping, resulting in a break in the peptide backbone when the ribosome reaches the 2A sequence, and consequently two protein products [98, 99]. Since 2A-peptide sequences are much shorter than IRES sequences and multiple 2A-peptide sequences exist, different 2A-peptides can be inserted between multiple transgenes in a row, allowing for the expression of 3+ transgenes at the same time [100]. An important difference between using IRES or 2A-peptide sequences is the expression levels of the two transgenes. Using the IRES sequence the second gene is usually expressed at lower levels, while using the 2A-peptide the transgenes are expressed in equal amounts [101, 102]. The latter is particularly useful in the scenario where 2A-peptides are used to generate an untagged protein and fluorescent reporter, since the reporter can then be used to measure the amount of untagged protein in the cell. For example, Czopka et al. used this technique to overexpress molecularly distinct forms of Fyn kinase together with eGFP in zebrafish and showed that constitutive activation of Fyn in myelinating oligodendrocytes increased myelin sheath number [39]. 2A-peptides have been shown to have an efficiency of almost 100% in zebrafish, making them the most reliable method to express multiple transgenes in the same cell [103]. However, it must be taken into consideration that this method results in 17–21 stretch of amino acids added to the C-terminal of the first protein, and a proline added to the N-terminal of the second protein, which could in principle interfere with protein localization or function.
Temporal regulation of gene expression
A common method to temporally control expression of fluorescent reporters in both zebrafish and Xenopus is with the hsp70 heat shock promoter [104–106] (Fig. 3D). At normal rearing temperatures (28°C for zebrafish, 21–25°C for Xenopus), this promoter is largely silent. It is activated by transferring the animals to warmer water (38°C for zebrafish, 34°C for Xenopus), resulting in gene expression. The downstream gene is usually expressed within 30 min; however, expression is transient since the gene stops being transcribed when animals are returned to normal temperatures. A downside to replacing cell-specific promoters with heat shock promoters is the loss of cell-specific expression; however, spatial control can be achieved by local heat sources, such as a thin copper soldering iron tip [107] or sub-lethal focused laser excitation [104]. Another potential way to achieve both cell-specific and temporal expression could be to incorporate an hsp70 heat shock promoter into the split KalTA4 system described above [91].
A second method to achieve temporal control of gene expression is with the CreERT2/loxP system [108, 109]. This is a combinatorial expression system which relies of the expression of two transgenes. The first transgene is cre-recombinase fused to a modified estrogen receptor ligand binding domain, which can be activated by binding the synthetic estrogen receptor ligand 4-hydroxytamoxifen. The second transgene is the reporter or gene of interest preceded by a stop codon flanked by two loxP sequences in the same orientation. CreERT2 alone is an inactive recombinase enzyme that can be activated by adding 4-hydroxytamoxifen or tamoxifen to the water [109]. Upon activation it catalyses excision of DNA sequences between loxP sites. In the case we have just described, activation would result in excision of the stop codon allowing expression of the fluorescent reporter/gene of interest. Spatial control can be added to this system by using cell-specific promoters to drive expression of the cre-recombinase or the reporter construct. Recent studies have developed numerous reagents for cre inducible control of gene expression in zebrafish [110, 111] and Xenopus.
The LexPR system (modification of LexA system in mice) is another combinatorial expression system that allows for chemical-inducible gene expression in zebrafish [113]. It uses a hybrid transcriptional factor, LexPR, which consists of the DNA-binding domain of the LexA repressor, a truncated ligand-binding domain of the progesterone receptor, and the activation domain of NF-KB. LexPR is activated via binding of the synthetic steroid mifepristone, and upon activation induces expression of genes with LexA binding sites within their promoter sequence [113].
A third combinatorial expression system that can be used to temporally induce gene expression is the tetON/OFF system [114]. This system uses a fusion of the tetracycline repressor and the VP16 activation domain. Two versions of this fusion protein exist, TetR and rTetR, both of which bind the compound doxycycline to become active. The difference is TetR binds tetO sequences and blocks transcription of genes, while rTetR binds tetO sequences to activate transcription of genes. An advantage of this system is that doxycycline can be washed-out rendering the system reversible. These systems have been validated in zebrafish [115] and Xenopus [116], but are not yet used as widely as heat shock promoters, which may simply reflect historical rather than technical reasons.
IMAGING MODALITIES TO OBSERVE MYELINATION IN VIVO
A wide array of imaging modalities, both fluorescent and label-free, have been used to visualize myelin in vivo. The following sections give an overview of the major techniques, which are summarized in Table 2.
Confocal imaging
To date the most common type of microscope used for live-imaging of myelin in zebrafish is the confocal microscope, in part owing to its wide availability and the user-friendliness of commercially available systems. Scanning confocal microscopes use a pinhole to eliminate out of focus light, which differs from traditional wide field microscopes that collect light emitted from the entire depth of the sample [117]. Three-dimensional images can be obtained by acquiring a series of 2D images at different focal planes along the z-axis (a z stack), which are reconstructed into a 3D image using imaging software. The main limitation to this method is the slow speed of acquisition, as well as photobleaching and phototoxicity caused by repeated excitation by laser light which illuminates a large out of focus region in addition to the focal plane.
Speed of acquisition can be improved 10–100 times by the use of spinning disk confocal microscopes, which rather than scanning a single point at a time use a rapidly rotating disk with thousands of pinholes to scan many points in the sample simultaneously [reviewed in 118]. This method also results in less photobleaching and phototoxicity of the sample compared to the traditional scanning confocal microscope. OPCs and early myelinating oligodendrocytes are highly dynamic cells, constantly sending out and retracting processes as they migrate and select axons to wrap [37, 39]. The ability to image these events at a higher temporal resolution with spinning disk confocal microscopes compared to point scanning confocal microscopes is a definite advantage in understanding the dynamics of these cells (Fig. 4).
Two photon excitation microscopy
While in confocal microscopy fluorescent molecules are excited with a single high-energy photon, two photon excitation microscopy uses two lower-energy photons that excite the fluorescent molecule simultaneously [119, reviewed in 120]. A long wavelength, pulsed laser is used to concentrate photons at the region of interest in the sample. Since simultaneous absorption of two photons is statistically most probable at the focal point, fluorescence excitation is localized only at that point, rather than along the entire beam path. This eliminates the need for a pinhole to get rid of out-of-focus light. The primary advantages of two photon excitation microscopy over confocal microscopy are reduced photodamage and the ability to image deeper in tissues, over 1 mm in some studies [121]. Two photon microscopy also reduces autofluorescence, photobleaching and phototoxicity compared to confocal microscopy by exciting only the focal point. Imaging in Xenopus tadpoles, which are larger and less transparent than zebrafish larvae, benefits greatly from two-photon based imaging. However, a drawback is that two photon microscopy typically has poorer resolution than confocal microscopy due to the longer excitation wavelengths used, given that the resolution is approximately 1/2 that of the excitation wavelength. Furthermore, like the scanning confocal microscope, this is a point scanning technique, so the speed of acquisition is slower than techniques like spinning disk confocal and light sheet microscopy (describedbelow).
It is important to note that despite being most suitable for live in vivo analyses, imaging of myelinating glia has not been restricted to naturally transparent animals. As two-photon microscopy can penetrate deep into tissue, studies on superficial layers of the rodent cortex [122] and spinal cord [123] have also been achieved. Although these methods require invasive surgical manipulation, they do also provide the opportunity for longitudinal studies, and will serve as important cross-validation/comparison modalities for imaging myelination.
Light sheet microscopy
Light sheet fluorescence microscopy, also known as Selective Plane Illumination Microscopy (SPIM), is an over century old concept [124] that has recently been rejuvenated [125] and taken the intravital imaging world by storm. Light sheet microscopy provides significant improvements for the speed of 3D image acquisition, while dramatically decreasing photobleaching and phototoxicity of samples (reviewed in 126). This technique uses two objectives – an excitation objective that projects a thin sheet of light to illuminate the sample from the side and an imaging objective orientated orthogonally to the excitation objective. Thus, optical sectioning of the sample is achieved by the excitation light path, rather than with a pinhole, as in confocal microscopy. Without the restriction of a pinhole, the entire focal plane is illuminated simultaneously, allowing the complete field of view to be imaged at once. This significantly increases imaging speed enabling observations of events such as heart beat, blood flow and neuronal activity in close to real time [127–130]. In addition, since light sheets excite only the imaging plane, rather than the large volume excited in confocal microscopy, photobleaching and phototoxicity are reduced. This reduction is also contributed to by the fact that less energy input is required, since all light contributes to a useful signal.
Amazingly, one study reported imaging functional activity throughout the entire zebrafish brain every 1.3 s, achieving cellular resolution for more than 80% of neurons, allowing for correlation of neuronal activity in different brain regions [127]. A more recent study has extended the speed of imaging even further, by the introduction of Spherical-aberration-assisted Extended Depth-of-field (SPED) light sheet microscopy, which eliminates the need to physically move the detection objective or specimen and consequently limits speed only by the acquisition rate of the camera [131]. In this study the authors were able to image the entire brain and spinal cord of living zebrafish at cellular resolution over 6 times per second.
One current disadvantage of light sheet microscopy is the spatial resolution that can be achieved in its most commonly implemented forms at present; however, the field is rapidly advancing to deal with this issue [see review by 132]. Many variations of the technique have been published throughout the literature including inverted SPIM, dual excitation SPIM, sample rotation SPIM, dual view SPIM, two-photon fluorescence SPIM, Bessel beam light sheet microscopy, and Airy beam light sheet microscopy [126, 133, 134]. The main differences between these techniques are changes to the imaging orientation and the type of excitation or light sheet used, in efforts to achieve better spatial or temporal resolution, as well as image deeper in tissues. Recently, Xiao and colleagues [135] were one of the first to image zebrafish myelin in vivo using light sheet microscopy. They used a variation of the technique called lattice light sheet microscopy, which uses light sheets generated from two-dimensional optical lattices, rather than the Gaussian beams used in conventional light sheet microscopy [136]. The advantage is that lattice light sheets are thinner than Gaussian light sheets, allowing for rapid three-dimensional in vivo imaging at higher, subcellular resolutions [136]. Light sheet microscopy has also be combined with label-free bright field contrast imaging (optimal tomography) to allow 3D reconstruction of the zebrafish anatomy, allowing one to visualize the outline and internal organs of the sample [137]. This is particularly useful when expression of fluorescent reporters is sparse, as it allows for orienting the reconstructed fluorescent data by putting it in the context of the surroundingtissue.
Super-resolution imaging
In recent years, a large number of microscopy techniques have been implemented to break the diffraction limit of light microscopy. These “super-resolution” techniques can broadly be divided into three categories: stimulation emission depletion microscopy (STED), structured illumination microscopy (SIM), and single molecule localization microscopy [reviewed in 138]. While single molecule localization microscopy techniques such as PALM and STORM are not suited to live in vivo imaging due to limitations of imaging depth, both STED and SIM have been successfully applied to in vivo live imaging studies, albeit with limited application to date.
Stimulation emission depletion (STED) is a technique that uses a secondary beam to selectively deactivate fluorescence around the edge of the excitation beam to sharpen fluorescence at the focal spot [139, 140]. Using this method, spatial resolutions up to 30 nm have been achieved [141]. To image deep within tissues, STED has been combined with two photon excitation [142]. STED has also been combined with light sheet microscopy (STED-SPIM), with one study in zebrafish reporting improvements of 17% and 30% in lateral and axial resolution respectively compared to SPIM alone [143]. However, STED imaging currently requires very high laser excitation and is not compatible with long term imaging, although the use of reversibly switchable fluorescent proteins can help overcome this issue [RESOLFT microscopy; 144]. For example, using RESOLFT, Testa et al. were able to live image dendritic spines within hippocampal brain slices over a period of several hours[145].
Structure illumination microscopy is a super-resolution technique that superimposes a grid pattern on the sample while capturing images to generate an interference pattern (Moire effect) that is exploited by software to generate a higher resolution image [146]. SIM doubles the spatial resolution in all three dimensions and has been optimized for live-cell imaging and in optically thick samples [147, 148]. It has also been combined with Bessel beam light (SR-SIM) and two photon excitation to achieve greater depth penetration for imaging living organisms and was shown to cause significantly less photodamage compared to confocal microscopy [149].
An alternative technique compatible with live in vivo imaging is a very recent adaption to confocal microscopy, the Zeiss Airyscan, which makes use of the fact that simple closing of the pinhole on a confocal microscope will improve axial and depth resolution [150]. The Airyscan uses an imaging array that incorporates 32 pinholes set to 0.2 Airy units in size, and combines image acquisition with post-hoc image deconvolution, to achieve imaging with a resolution of 140 nm in the x, y axis and 400 nm in the z axis, while functioning at the same speed and with the same depth as a standard confocal. The array of 32 detectors also means that lower laser light can be employed to image samples, increasing opportunities for time-lapse imaging at super-resolution [150]. We have recently employed this system to image myelination in zebrafish (Fig. 5). It is clear that future live imaging studies will continue to incorporatediffraction breaking techniques, which will provide further insights into biological mechanisms.
Correlative light-electron microscopy
Despite the ever-developing improvements to various modes of light microscopy, it remains true that many of the key features of myelinated axons are likely to remain beyond the resolution of light microscopy for the foreseeable future. Historically myelin ultrastructure has been viewed by electron microscopy, which is currently also undergoing something of a renaissance. This is in part due to innovations in tissue preservation techniques [151] and also important adaptations to automate many aspects of the once laborious processes of tissue sectioning and imaging [152–155]. Needless to say electron microscopy is not compatible with live imaging, and is typically restricted to very small single plane fields of view. However, recent advances have begun to address these two issues, through the development of methods to directly correlate live imaging by light microscopy with electron microscopy, and also with the emergence of electron microscopy techniques that can reconstruct large tissue volumes in 3D.
Seminal work by Bunge and colleagues provided the first direct evidence that the Schwann cell myelin sheath formed by movement of a process around the axon, rather than movement of the cell. This study was in fact an early example of correlative light microscopy, in that the authors first observed the movement of Schwann cell nuclei during myelination by light microscopy (no fluorescence) and then imaged how many wraps of myelin had been made by the same cells during that period using electron microscopy [156]. Today, a major goal is to combine sophisticated imaging of fluorescent reporters visualised in the living animal with subsequent electron microscopic analyses. However, one of the biggest challenges is that most often fluorescence does not survive the sample preparation required for electron microscopy. Similarly, antigenicity of proteins can also be destroyed, so what may have been a good signal for fluorescence microscopy ends up as just a few gold particles by immuno-EM, thus making it difficult to confidently identify the labelled cell or structure. Several protocols now exist to correlate fluorescence live-imaging with electron microscopy [for review see 157], which have been applied to zebrafish studies [158, 159], but these techniques are still are not routinely used in the field. Recently a new class of highly antigenic fluorescent reporters were reported called “spaghetti monster” fluorescent proteins (smFPs) [160], which may make correlative studies more common place. SmFPs are protein reporters engineered to combine a florescent protein scaffold (ie. super folder GFP), with 10–15 copies of single epitope tags (ie. Myc, HA, flag) inserted within loops of the fluorescent protein structure. These reporters are ideal for use in correlative light electron microscopy – the fluorescent protein allows for labelling of cells for live-imaging, while the epitope tags act as robust probes for antibody-targeted electron microscopy. In the original report, smFPs were detected with high levels of specific labelling by immuno-EM, allowing for 3D reconstruction of neurites within mouse brain tissue [160]. Alternative options also exist, including the possibility to drive expression of GFP in the same cells as membrane tethered Horseradish Peroxisdase (HRP), an enzyme that can be used to convert the substrate DAB (Diaminobenzidine) into electron dense products visible by electron microscopy. This method was first demonstrated using Xenopus and used to correlate live and ultrastructural imaging of dendrite morphogenesis [161]. Yet further possibilities for converting fluorescent molecules to substrates suitable for electron microscopy include mini-SOG [162] and apex2 [163]. Use of any of these correlative light electron microscopy probes to study of myelination in zebrafish and Xenopus may be valuable in the future.
The emergence of techniques to reconstruct large tissue volumes by electron microscopy is an important advancement for correlative light electron microscopy. Numerous insights into myelination have been drawn from heroic manual reconstructions of serial sections imaged by electron microscopy one at a time [164, 165]. However, it is now possible to automate the cutting and imaging of tissue for electron microscopy using techniques such as focussed ion beam scanning electron microscopy (SEM) [154] and serial block face imaging (FIB) [152]. Advances in SEM now allow imaging with a resolution in the x, y plane similar to transmission electron microscopy (<10 nm per pixel), and using the FIB milling technique one can reach a resolution on the order of 10 nm per pixel in the z axis [166]. Extraordinary community efforts are now underway to use 3D electron microscopy to reconstruct cell, and even whole tissue, volumes at ultrastructural resolution to better understand neuronal circuitry [e.g. 153]. Analysis of such datasets have already provided novel insights into the pattern of myelination along individual axons belonging to different neuronal sub-types [167]. However, there are major bottlenecks with respect to data acquisition, storage and processing that will need to be addressed in parallel, as the field of so-called “connectomics” matures [168]. Automated, and semi-automated options exist for analysing data from 3D electron microscopy, which have led to the development of a completely novel model of myelin sheath wrapping around the axon [169]. Indeed an important aspect of this new model of myelin wrapping involved comparing 3D electron microscopy data of myelin sheath ultrastructure from the optic nerve of rodents with live imaging data of myelin sheath wrapping from studies in zebrafish [see section 6]. Future studies that directly correlate live imaging in vivo with subsequent 2D and 3D ultrastructural imaging will provide further insights into myelination.
Label-free imaging of myelin
Label-free imaging techniques, such as third harmonic generation [170, 171], spectral confocal reflectance (ScoRe) microscopy [10, 172, 173], deep optical coherence microscopy [174], and coherent anti-stokes Raman scattering (CARS) microscopy [175], are emerging as powerful imaging modalities for imaging of myelin. The “label-free” nature of these techniques eliminates the problem of photobleaching, which can be a major impediment for fluorescent live-cell imaging, particularly when performing time-lapse studies. It also removes the risk of disrupting myelin structure with the expression of fluorescent reporters. Furthermore, unlike membrane tethered fluorescent reporters which label oligodendrocyte cell bodies, processes, and myelin, the label-free techniques published thus far detect only myelin, allowing for an unobstructed view of myelin sheaths along individual axons.
Third harmonic generation, deep optical coherence microscopy, and ScoRe microscopy all rely on the high refractive index of myelin (∼1.46) compared to its aqueous surroundings (∼1.33) to generate imaging contrast, although the imaging set-up and capabilities of each are quite different. Third harmonic generation is a three photon-based nonlinear microscopy technique that can be implemented on existing multiphoton microscopes with the addition of appropriate lasers and filters [170]. In contrast, optical coherence microscopy uses a high-numerical aperture infrared full-field optical coherence microscope to collect backscattered light [174], while ScoRE generates images by merging the simultaneously reflected signals from multiple confocal lasers of different wavelengths [173]. Both third harmonic generation and ScoRe achieve resolutions capable of visualizing myelin sub-structures including nodes of Ranvier and Schmidt-Lanterman incisures [171, 173]. Using third generation harmonics it has also been shown that the thickness of myelin can be estimated, allowing for visualization of hypo- and hypermyelination [171]. While this is a definite advantage, a drawback is that third harmonic generation is currently limited to imaging 50 μm into the tissue [170], compared to depths of 340 μm and 400 μm that can be achieved with optical coherence microscopy and ScoRe respectively [173, 174]. ScoRe has the additional advantage of using a conventional confocal microscope that is commonly found in most imaging labs, making the method potentially widely accessible. To date, only third harmonic generation has been used to image myelin in zebrafish [170].
CARS imaging differs from the other three label-free techniques to image myelin in that it is a type of vibrational microscopy that generates signals based on the characteristic vibration frequencies of chemical bonds [reviewed in 175, 176]. It is particularly sensitive for detecting lipid rich structures, such as myelin, due to the strong signal generated by phospholipid fatty acid chains. Phopholipids, the main component of myelin, each consist of two fatty acid chains 14–24 carbons in length [177]. The C-H bonds within these chains have a unique vibration frequency that generates a strong coherent Raman scattering signal, particularly when the bonds are present at high density, as in myelin. Consequently the vibration of the bonds can be harnessed to provide imaging contrast, allowing for the detection of myelin in live tissue at diffraction-limit resolution without the need for expressing fluorescent tags or adding lipophilic dyes [178]. Importantly, the signals can be captured using short exposure times and near-infrared wavelength lasers, reducing phototoxicity and allowing imaging at depths up to 1 mm. Of all the label-free technique, CARS has been most widely employed to image myelin.
Using CARS microscopy myelin can be imaged at sub-micron resolutions, allowing for not only the visualization of myelin internodes, but also nodes of Ranvier, paranodal loops, and Schmidt-Lanterman incisures [178–180]. In addition to imaging normal myelin, it has become a popular choice for imaging myelin in injury models [180–184], since in fixed tissue it is often hard to discriminate whether the observed changes in myelin structure are due to the injury or artefacts introduced during fixation and sample preparation. For example, CARS has been used to image paranode retractions in models of EAE, glutamate excitotoxicity, and high-frequency stimulation [179, 185, 186]. A unique advantage of CARS is that it can be used to directly quantify lipid levels giving readouts comparable to standard biochemical methods [187, 188]. Furthermore, by collecting images at different vibrational frequencies it is possible to determine relative levels of saturated and unsaturated lipids [179, 188]. Given that many myelinated fibers are oriented parallel to one another along myelinated tracts, CARS can also be used to determine the ordering degree of myelin by comparing the intensity of CARS signals when the excitation polarization beam is parallel or perpendicular to the myelinated fiber. Previous studies have shown that this ratio decreases after injury and prior to demyelination [182]. It has also been used to differentiate between normal myelin and regenerated myelin in models of EAE [179]. Another quantitative measure that can be made from CARS images is myelin thickness (often expressed as a g-ratio), which is not possible to accurately access by conventional light microscopy and otherwise has to be measured in fixed tissue by electron microscopy [178, 181].
To date live imaging of myelin using CARS microscopy has been primarily carried out on rodent tissues. However, due to the requirements for invasive surgery, impediments to imaging resulting from the formation of scar tissue, and motion artefacts arising from animal respiration, these studies remain challenging, particularly when imaging 3D volumes or time courses. Consequently the ability to perform non-invasive live-imaging of the nervous system in immobilized zebrafish larvae or tadpoles provides an attractive alternative animal model system to examine the dynamics of myelin using CARS. Recently, Hu et al. used a similar technique to CARS, called stimulated Raman scattering (SRS) microscopy, to image myelin in the optic nerve, spinal cord, and trochlear nerve of stage 49-50 Xenopus tadpoles. Using this technique, they were able to follow changes to the myelin over time, including the formation of nodes of Ranvier, as well as myelin degradation following cranial nerve transection [189].
The specificity, sensitivity, and quantitative nature of CARS holds a lot of potential for future in vivo live-imaging of myelin. The fast image acquisition times (25 frames/s), coupled with the ability to directly quantify lipid levels, could also make this an interesting technique for chemical or genetic screening in zebrafish or Xenopus to identify genes or compounds that affect myelin levels [176, 187]. In addition, it would be interesting to harness the ability to perform multimodal CARS imaging with two photon or confocal fluorescence microscopy to allow for dual imaging of fluorescently labelled proteins in conjunction with myelin lipids in zebrafish. Multi-model CARS and fluorescence microscopy have already been used by several groups, for example to label axonal domains or image microglia within EAE lesions in mice [179, 180]. However, it may also be interesting to use these techniques to study myelin protein – lipid interactions, which is an area that remains largely unexplored.
INSIGHTS INTO MYELIN FORMATION FROM LIVE IMAGING
Despite the extraordinary potential of the techniques noted above to image myelination, to date the majority of live imaging studies using zebrafish have relied on point scanning or spinning disk confocal approaches and focussed on analysis in the central nervous system. Time-lapse confocal microscopy of myelin formation in zebrafish has contributed critical insight into our understanding of how oligodendrocyte myelin sheaths wrap around axons. Using a membrane tethered GFP reporter, Snairdero et al. quantified the fluorescent profiles along growing myelin sheaths prior to any myelin compaction. They found that fluorescence was always brightest in the middle of these growing sheaths and decreased in a quantal step-wise fashion towards the lateral edges, suggesting differences in the number of myelin wraps along the growing internode [169]. Over time, as myelin sheaths extended laterally, the step-like pattern of fluorescence also extended outwards, indicative of longitudinal growth of each of the myelin layers. A further study went on to show accumulation of F-actin along the leading edge of the growing myelin sheath [190]. Live imaging of sheath formation revealed that this edge of F-actin moved in a spiral pattern longitudinally along the axon, eventually being restricted to the paranodal regions [190]. This data, together with electron microscopy data from experiments in rodents, was used to propose a model in which F-actin turnover drives the growth of myelin around the axon via wrapping of the inner tongue in a triangle like shape under the existing myelin. Meanwhile, the existing myelin layers grow laterally with their cytoplasmic edges extending helically towards the node, eventually forming the paranodal loops [169, 190].
In addition to visualizing membrane wrapping, time-lapse imaging elegantly captured the dynamics of single oligodendrocytes as they formed their myelin sheaths. To do this, the ability to mosiacally label single cells was harnessed. The sparse labelling of individual oligodendrocytes allows for detailed morphological analysis of their processes and myelin sheaths, which is simply not possible otherwise. For example, Czopka et al. used time-lapse confocal imaging to show that each oligodendrocyte initiates formation of all of its myelin sheaths within a five hour window of time [39]. They followed the same oligodendrocytes for 16 days, but never saw any additional myelin sheaths added. Furthermore, they were able to either increase or decrease the number of sheaths made by an individual oligodendrocyte by manipulating fyn activity; however, formation of these sheaths was still always initiated within the five hour window [39]. A second study examining individual oligodendrocytes found that their myelinating potential was determined by axons [38]. In the presence of additional large calibre neurons, individual oligodendrocytes produced more myelin in order to ensheath the extra axons. Furthermore, it was found that oligodendrocytes which usually only myelinate small calibre axons could also form myelin sheaths on the supernumerary large calibre axons [38]. Together this data showed that oligodendrocytes can change their myelinating capacity based on environmental cues.
To further elucidate how axons influence the myelinating behaviour of oligodendrocytes, two recent studies used live-imaging in zebrafish to show that neuronal activity regulates myelin sheath formation [191, 192]. Global block of vesicle release was found to decrease the number of sheaths made by individual oligodendrocytes, resulting in reduced total levels of myelin in the spinal cord [192]. Time-lapse imaging was able to differentiate that this was due to the generation of fewer myelin sheaths, rather than an increased number of myelin retractions [192], which was shown to be due to the fact that activity appeared to consolidate the formation of nascent contacts between axons and oligodendrocyte processes within the first 90 minutes of their engagement [191]. Interestingly, blocking synaptic vesicle release along individual axons also decreased the number of myelin sheaths made along those axons, as well as their length [191, 192], while suppressing neuronal excitability along individual axons only decreased sheath number [191]. This suggested that axon selection and sheath growth are regulated by two separate mechanisms.
Although transgenic reporters that label myelinating glia have provided novel insights into myelination, these reporters do not easily allow assessment of myelination along the length of individual axons, in large part due to the fact that myelinated axons are typically tightly bundled together in tracts. A recent study of the rodent cortex indicated that myelination along single axons may be quite diverse with respect to distinct neuronal subtype identity [167], but this study required analysis of large datasets of 3D reconstructed electron microscopy images, which clearly preclude any longitudinal analysis. To overcome this problem, Koudelka et al. recently developed a novel fluorescent reporter in zebrafish that allows observation of myelin sheath formation and remodelling along individual axons over time [193] (Fig. 6). This reporter, crucially expressed in neurons and localised along axons, consists of GFP fused to the extracellular domain of the GPI-linked axonal protein contactin1a. GFP-contactin-1a localizes along the entire length of axons prior to myelination. However, upon glial contact, GFP-contactin1a becomes extruded from the axonal membrane specifically at points of contact with glia and continues to be extruded as myelin sheaths grow longitudinally along the axon. Ultimately the GFP-contactin1a becomes specifically localised to unmyelinated nodes of Ranvier. When expressed in sparsely labelled neurons, this tool allows for easy visualization of the number and length of myelin sheaths along individual axons, and using live-imaging can be followed over time to assess the growth and refinement of individual myelin sheaths. Koudelka et al. used this tool to demonstrate distinct modes of myelination by two different neuronal subtypes in the larval zebrafish CNS. They showed that while one neuronal subtype, reticulospinal neurons, profoundly regulated myelination of their own axons in a vesicle release dependent manner, another neuronal sub-type (commissural primary ascending neurons) did not [193]. The ability to manipulate and visualise myelination from the point of view of neurons, as well as oligodendrocytes, further highlights the versatility of using zebrafish, and in principle Xenopus, for in vivo analyses of myelination.
Time lapse confocal microscopy coupled with laser ablation experiments has also been used to help further our understanding of earlier stages of myelinating glial cell development. For example in a seminal study, Kirby et al. used spinning disk confocal microscopy to characterize the migration of OPCs in the zebrafish spinal cord [37]. They found migrating OPCs displayed numerous highly branched processes, an unexpected observation given previous reports describing a unipolar or bipolar morphology for OPCs migrating in culture. Furthermore, their time-lapses allowed them to follow the remodelling of individual OPC processes, which were found to be highly dynamic, extending, retracting and forming new branches within a matter of minutes. Interestingly, they observed that while net migration was dorsal, OPCs actually changed direction frequently. These alterations in path often occurred after making contact with the processes of other OPCs, suggesting repulsive cell-cell interactions. The presence of these repulsive interactions was further supported by in vivo laser ablation experiments targeting individual OPCs [37]. Live-imaging showed that within 5 hours of ablation, surrounding OPCs re-populated the ablated site, first by extending processes into the ablated region, followed by migration of the cells. Together this data suggested OPCs use cell-cell interactions to uniformly space themselves throughout the CNS, prior to myelination [37]. Importantly, more recent studies using 2-photon based imaging of OPC behaviour in the adult rodent cortex found essentially the same cell behaviours, indicating conservation of function not only between species, but also between embryonic and adult stages [122]. Numerous additional studies have used the power of zebrafish for live imaging to gain insight into glial cell development, and have been reviewed extensively elsewhere [14–16, 194].
IMAGING DEMYELINATION AND REMYELINATION
As previously mentioned, zebrafish and tadpoles have remarkable capacities for regeneration and are highly amenable for pharmacological screens, making them interesting organisms with which to create models of demyelination and remyelination. To this end, Kaya et al. generated a transgenic Xenopus line in which myelinating oligodendrocytes could be conditionally ablated by using part of the MBP promoter to drive expression of eGFP-nitroreductase (NTR) [45]. Under normal conditions the NTR enzyme is benign. However, in the presence of the prodrug metronidazole (MTZ), NTR reduces MTZ to a cytotoxic metabolite that results in oligodendrocyte cell death, and consequently demyelination. Using two photon fluorescence microscopy to track GFP in the same tadpole over time, the authors were able to image the behaviour of oligodendrocytes following MTZ treatment and during recovery [45]. A three day treatment of tadpoles with MTZ resulted in a 50% depletion of GFP+ cells in the optic nerve, which returned to normal after 6 days of recovery in untreated water. This correlated with immunohistochemistry and electron microscopy time courses showing demyelination, followed by partial remyelination [45]. A second study went on to show that the remyelinating oligodendrocytes in this model originate from OPCs already present prior to demyelination, rather than from newly generated OPCs [195].
Following the development of this Xenopus model, two independent groups went on to generate very similar models in zebrafish. Chung et al. generated a transgenic line expressing UAS:NTR-mCherry, which was expressed by crosses with sox10:Gal4VP16 or mbp:Gal4VP16 transgenic lines, while Fang et al. generated a transgenic line expressing NTR-eGFP under the control of the MBP promoter [54, 55]. Similar to in Xenopus, treatments of zebrafish larvae or adult fish with Mtz resulted in the loss of oligodendrocytes and myelin, followed by remyelination after removal from MTZ [54, 55]. Interestingly, loss of myelin correlated with decreased locomotion in fish, which recovered on a similar time scale as the recovery of oligodendrocytes [55].
An interesting application of these models is for screening for novel compounds that promote myelin repair. As a proof of principle, Kaya et al. treated Xenopus larvae with retinoic acid, which was previously shown to increase remyelination in rodents [196], and found that it improved oligodendrocyte recovery after 11 days of treatment with MTZ [45]. In zebrafish, the anti-inflammatory drug sulfasalazine, previously used to treat rheumatoid arthritis and inflammatory bowel disease, was also found to promote recovery of oligodendrocyte numbers and myelin thickness following demyelination [197].
It should be noted that in all these studies, expression of the fluorescent reporters was cytoplasmic and therefore extruded from myelin; thus, direct visualization of demyelination and remyelination required fixation of samples for immunohistochemistry or electron microscopy. It would be interesting if similar models were generated using 2A peptides and membrane-tethered reporters to be able to visualize myelin loss and remyelination directly with time-lapse imaging. Live-imaging with additional reporters could also be incredibility informative in unravelling how the axon or microglia respond to demyelination for example.
The NTR-model of demyelination induces widespread demyelination throughout the CNS. Recently, a second model to induce focal demyelination in the optic nerve of adult zebrafish was developed using the myelinotoxin lysophosphatidylcholine (LPC) [56]. Reduced levels of myelin were readily observed by 8 days post lesion (dpl), with spontaneous recovery to normal levels of myelin by 28 dpl. Interestingly, remyelinated axons in young fish (4–7 months) displayed normal myelin thickness, while in older fish (>15 months) remyelinated axons had thinner myelin, indicating an age related decline in remyelination capacity, as has also been reported in humans and rodents [198]. With current techniques, live-imaging in this model would be challenging due to the depth within the tissue that must be imaged, but as microscopy techniques continue to improve, this may become more feasible.
FUTURE OUTLOOKS AND CONCLUSIONS
The research community has only begun to harness the power of zebrafish and Xenopus as in vivo models to study myelination. The current swathe of new and improved microscopy platforms will continue to offer improved spatial and temporal resolution, less photodamage, and the ability to image deeper within tissues. These improvements, coupled with the ongoing development of new reporters and tools, will continue to open new doors to ask new questions.
For example, the ability to study myelination at sub-cellular resolution in vivo using transparent models will represent an important avenue of exploration. Imaging of the actin cytoskeleton in the myelinating processes of zebrafish oligodendrocytes has already pointed towards the importance of actin polymerisation in driving myelin sheath morphogenesis [190]. Future investigations using fluorescent probes to follow cytoskeletal dynamics, as well as transport and trafficking of key molecules and organelles, within myelinating glia during myelin sheath formation, growth and maintenance holds exciting promise. Similarly, live imaging will provide important insights into the dynamics of cell-cell interactions. By live imaging molecules and organelles in labelled neurons one will be able to assess how myelin formation, damage and regeneration affect the underlying axon during the emergence and resolution of myelin pathologies. Imaging molecules that constitute key sub-cellular domains, such as nodes of Ranvier and paranodes, will also provide further insight into the mechanisms controlling myelinated axon structure and function. Furthermore, the expanding palette of fluorescent proteins means that more and more cells, structures and molecules can be imaged simultaneously in individual samples, which will provide more holistic insight into biological and pathological events.
In addition, the ability to assess neuronal and glial function using available genetically-encoded fluorescent Ca2+ and voltage indicators holds promise for directly assessing cellular communication and conduction speeds in vivo. Coupled with the ability to control neuronal (and in principle glial) function by light using optogentic tools, the myelin field is now poised to address critical questions related to neuronal regulation of myelin growth and plasticity. Optogenetics has already been employed to show that modulation of neuronal activity profoundly affects oligodendrocyte behaviour in vivo in rodents [199]. The application of similar approaches in small transparent models will allow for opportunities to control neuronal and glial function at single cell, and even sub-cellular, resolution in vivo. Optogenetic based methods can be employed not only to regulate cell excitability, but also to regulate intracellular organelle and protein localisation [200–202], capacities which will further enhance the range of mechanistic questions that can be addressed in living nervous system. Very importantly, with gene targeting technologies such as crispr-cas9 becoming routine in both zebrafish and Xenopus, we can expect to see increased interest in using these systems to combine live-image and genetic analyses of myelinating cell behaviour in the CNS and PNS in the future.
CONFLICT OF INTEREST
The authors declare no conflict of interest.
ACKNOWLEDGMENTS
We would like to thank members of the Lyons lab for their helpful comments on the manuscript. We would also like to thank members of the Lyons lab who contributed to figures: Rafael Almeida provided cartoons and an mbp:eGFP-CAAX image, Jill Williamson provided the single oligodendrocyte image, Marion Baraban provided spinning disk confocal data, Anna Klingseisen and Linde Kegel provided Airyscan images, and Sigrid Koudelka provided the GFP-contactin1a images. JMB is supported by a postdoctoral fellowship from the Canadian Institute of Health Research and an endMS Postdoctoral Fellowship from a partnership of the Fonds de la recherche du Quebec-Sante and the Multiple Sclerosis Society of Canada. Work in the Lyons lab is funded by the Wellcome Trust, The Lister Institute for Preventative Medicine, The Multiple Sclerosis Society and Biogen.
REFERENCES
[1] | Hartline DK , Colman DR . Rapid conduction and the evolution of giant axons and myelinated fibers. Curr Biol.R. (2007) ;17: (1):29–35. |
[2] | Nave KA , Trapp BD . Axon-glial signaling and the glial support of axon function. Annu Rev Neurosci. (2008) ;31: :535–61. |
[3] | Funfschilling U , Supplie LM , Mahad D , Boretius S , Saab AS , Edgar J , et al. Glycolytic oligodendrocytes maintain myelin and long-term axonal integrity. Nature. (2012) ;485: (7399):517–21. |
[4] | Lee Y , Morrison BM , Li Y , Lengacher S , Farah MH , Hoffman PN , et al. Oligodendroglia metabolically support axons and contribute to neurodegeneration. Nature. (2012) ;487: (7408):443–8. |
[5] | Seidl AH , Rubel EW . Systematic and differential myelination of axon collaterals in the mammalian auditory brainstem. Glia. (2016) ;64: (4):487–94. |
[6] | Ford MC , Alexandrova O , Cossell L , Stange-Marten A , Sinclair J , Kopp-Scheinpflug C , et al. Tuning of Ranvier node and internode properties in myelinated axons to adjust action potential timing. Nat Commun. (2015) ;6: :8073. |
[7] | Wang S , Young KM . White matter plasticity in adulthood. Neuroscience. (2014) ;276: :148–60. |
[8] | McKenzie IA , Ohayon D , Li H , de Faria JP , Emery B , Tohyama K , et al. Motor skill learning requires active central myelination. Science. (2014) ;346: (6207):318–22. |
[9] | Huang B , Wei W , Wang G , Gaertig MA , Feng Y , Wang W , et al. Mutant huntingtin downregulates myelin regulatory factor-mediated myelin gene expression and affects mature oligodendrocytes. Neuron. (2015) ;85: (6):1212–26. |
[10] | Olmos-Serrano JL , Kang HJ , Tyler WA , Silbereis JC , Cheng F , Zhu Y , et al. Down syndrome developmental brain transcriptome reveals defective oligodendrocyte differentiation and myelination. Neuron. (2016) ;89: (6):1208–22. |
[11] | Philips T , Rothstein JD . Glial cells in amyotrophic lateral sclerosis. Exp Neurol. (2014) ;262: (Pt B):111–20. |
[12] | Pouwels PJ , Vanderver A , Bernard G , Wolf NI , Dreha-Kulczewksi SF , Deoni SC , et al. Hypomyelinating leukodystrophies: Translational research progress and prospects. Ann Neurol. (2014) ;76: (1):5–19. |
[13] | Fields RD . White matter in learning, cognition and psychiatric disorders. Trends Neurosci. (2008) ;31: (7):361–70. |
[14] | Ackerman SD , Monk KR . The scales and tales of myelination: Using zebrafish and mouse to study myelinating glia. Brain Res. (2015) . |
[15] | Czopka T . Insights into mechanisms of central nervous system myelination using zebrafish. Glia. (2016) ;64: (3):333–49. |
[16] | Preston MA , Macklin WB . Zebrafish as a model to investigate CNS myelination. Glia. (2015) ;63: (2):177–93. |
[17] | Swinburne IA , Mosaliganti KR , Green AA , Megason SG . Improved Long-Term Imaging of Embryos with Genetically Encoded alpha-Bungarotoxin. PLoS One. (2015) ;10: (8):e0134005. |
[18] | Weber M , Mickoleit M , Huisken J . Multilayer mounting for long-term light sheet microscopy of zebrafish. J Vis Exp. (2014) (84):e51119. |
[19] | Lamason RL , Mohideen MA , Mest JR , Wong AC , Norton HL , Aros MC , et al. SLC24A5, a putative cation exchanger, affects pigmentation in zebrafish and humans. Science. (2005) ;310: (5755):1782–6. |
[20] | Lister JA , Robertson CP , Lepage T , Johnson SL , Raible DW . nacre encodes a zebrafish microphthalmia-related protein that regulates neural-crest-derived pigment cell fate. Development. (1999) ;126: (17):3757–67. |
[21] | White RM , Sessa A , Burke C , Bowman T , LeBlanc J , Ceol C , et al. Transparent adult zebrafish as a tool for in vivo transplantation analysis. Cell Stem Cell. (2008) ;2: (2):183–9. |
[22] | Elsalini OA , Rohr KB . Phenylthiourea disrupts thyroid function in developing zebrafish. Dev Genes Evol. (2003) ;212: (12):593–8. |
[23] | Wang WD , Wang Y , Wen HJ , Buhler DR , Hu CH . Phenylthiourea as a weak activator of aryl hydrocarbon receptor inhibiting 2,3,7,8-tetrachlorodibenzo-p-dioxin-induced CYP1A1 transcription in zebrafish embryo. Biochem Pharmacol. (2004) ;68: (1):63–71. |
[24] | Huang P , Zhu Z , Lin S , Zhang B . Reverse genetic approaches in zebrafish. J Genet Genomics. (2012) ;39: (9):421–33. |
[25] | Ma D , Liu F . Genome editing and its applications in model organisms. Genomics Proteomics Bioinformatics. (2015) ;13: (6):336–44. |
[26] | Schmitt SM , Gull M , Brandli AW . Engineering Xenopus embryos for phenotypic drug discovery screening. Adv Drug Deliv Rev. (2014) ;69-70: :225–46. |
[27] | Howe K , Clark MD , Torroja CF , Torrance J , Berthelot C , Muffato M , et al. The zebrafish reference genome sequence and its relationship to the human genome. Nature. (2013) ;496: (7446):498–503. |
[28] | Hellsten U , Harland RM , Gilchrist MJ , Hendrix D , Jurka J , Kapitonov V , et al. The genome of the Western clawed frog Xenopus tropicalis. Science. (2010) ;328: (5978):633–6. |
[29] | Riadi G , Ossandon F , Larrain J , Melo F . Towards the bridging of molecular genetics data across Xenopus species. BMC Genomics. (2016) ;17: (1):161. |
[30] | Driever W , Solnica-Krezel L , Schier AF , Neuhauss SC , Malicki J , Stemple DL , et al. A genetic screen for mutations affecting embryogenesis in zebrafish. Development. (1996) ;123: :37–46. |
[31] | Haffter P , Granato M , Brand M , Mullins MC , Hammerschmidt M , Kane DA , et al. The identification of genes with unique and essential functions in the development of the zebrafish, Danio rerio. Development. (1996) ;123: :1–36. |
[32] | Goda T , Abu-Daya A , Carruthers S , Clark MD , Stemple DL , Zimmerman LB . Genetic screens for mutations affecting development of Xenopus tropicalis. PLoS Genet. (2006) ;2: (6):e91. |
[33] | Pogoda HM , Sternheim N , Lyons DA , Diamond B , Hawkins TA , Woods IG , et al. A genetic screen identifies genes essential for development of myelinated axons in zebrafish. Dev Biol. (2006) ;298: (1):118–31. |
[34] | Snyder JL , Kearns CA , Appel B . Fbxw7 regulates Notch to control specification of neural precursors for oligodendrocyte fate. Neural Dev. (2012) ;7: :15. |
[35] | Lyons DA , Pogoda HM , Voas MG , Woods IG , Diamond B , Nix R , et al. erbb3 and erbb2 are essential for schwann cell migration and myelination in zebrafish. Curr Biol. (2005) ;15: (6):513–24. |
[36] | Raphael AR , Lyons DA , Talbot WS . ErbB signaling has a role in radial sorting independent of Schwann cell number. Glia. (2011) ;59: (7):1047–55. |
[37] | Kirby BB , Takada N , Latimer AJ , Shin J , Carney TJ , Kelsh RN , et al. In vivo time-lapse imaging shows dynamic oligodendrocyte progenitor behavior during zebrafish development. Nat Neurosci. (2006) ;9: (12):1506–11. |
[38] | Almeida RG , Czopka T , Ffrench-Constant C , Lyons DA . Individual axons regulate the myelinating potential of single oligodendrocytes in vivo . Development. (2011) ;138: (20):4443–50. |
[39] | Czopka T , Ffrench-Constant C , Lyons DA . Individual oligodendrocytes have only a few hours in which to generate new myelin sheaths in vivo . Dev Cell. (2013) ;25: (6):599–609. |
[40] | Jung SH , Kim S , Chung AY , Kim HT , So JH , Ryu J , et al. Visualization of myelination in GFP-transgenic zebrafish. Dev Dyn. (2010) ;239: (2):592–7. |
[41] | Brosamle C , Halpern ME . Characterization of myelination in the developing zebrafish. Glia. (2002) ;39: (1):47–57. |
[42] | Morris JK , Willard BB , Yin X , Jeserich G , Kinter M , Trapp BD . The 36K protein of zebrafish CNS myelin is a short-chain dehydrogenase. Glia. (2004) ;45: (4):378–91. |
[43] | Munzel EJ , Schaefer K , Obirei B , Kremmer E , Burton EA , Kuscha V , et al. Claudin k is specifically expressed in cells that form myelin during development of the nervous system and regeneration of the optic nerve in adult zebrafish. Glia. (2012) ;60: (2):253–70. |
[44] | Schaefer K , Brosamle C . Zwilling-A and -B, two related myelin proteins of teleosts, which originate from a single bicistronic transcript. Mol Biol Evol. (2009) ;26: (3):495–9. |
[45] | Kaya F , Mannioui A , Chesneau A , Sekizar S , Maillard E , Ballagny C , et al. Live imaging of targeted cell ablation in Xenopus: A new model to study demyelination and repair. J Neurosci. (2012) ;32: (37):12885–95. |
[46] | Yoshida M . Oligodendrocyte maturation in Xenopus laevis. J Neurosci Res. (1997) ;50: (2):169–76. |
[47] | Luo X , Cerullo J , Dawli T , Priest C , Haddadin Z , Kim A , et al. Peripheral myelin of Xenopus laevis: Role of electrostatic and hydrophobic interactions in membrane compaction. J Struct Biol. (2008) ;162: (1):170–83. |
[48] | Quarles RH , Sakuragawa N , Everly JL , Pasnak CF , Webster HD , Trapp BD . A biochemical comparison of Xenopus laevis and mammalian myelin from the central and peripheral nervous systems. J Neurobiol. (1978) ;9: (3):217–28. |
[49] | Schliess F , Stoffel W . Evolution of the myelin integral membrane proteins of the central nervous system. Biol Chem Hoppe Seyler. (1991) ;372: (9):865–74. |
[50] | Takei K , Uyemura K . Expression of a P0-like glycoprotein in central nervous system myelin of amphibians (Ambystoma mexicanus, Xenopus laevis and Rana catesbeiana). Comp Biochem Physiol B. (1993) ;106: (4):873–82. |
[51] | Beck CW , Izpisua Belmonte JC , Christen B . Beyond early development: Xenopus as an emerging model for the study of regenerative mechanisms. Dev Dyn. (2009) ;238: (6):1226–48. |
[52] | Gemberling M , Bailey TJ , Hyde DR , Poss KD . The zebrafish as a model for complex tissue regeneration. Trends Genet. (2013) ;29: (11):611–20. |
[53] | Shi W , Fang Z , Li L , Luo L . Using zebrafish as the model organism to understand organ regeneration. Sci China Life Sci. (2015) ;58: (4):343–51. |
[54] | Chung AY , Kim PS , Kim S , Kim E , Kim D , Jeong I , et al. Generation of demyelination models by targeted ablation of oligodendrocytes in the zebrafish CNS. Mol Cells. (2013) ;36: (1):82–7. |
[55] | Fang Y , Lei X , Li X , Chen Y , Xu F , Feng X , et al. A novel model of demyelination and remyelination in a GFP-transgenic zebrafish. Biol Open. (2014) ;4: (1):62–8. |
[56] | Munzel EJ , Becker CG , Becker T , Williams A . Zebrafish regenerate full thickness optic nerve myelin after demyelination, but this fails with increasing age. Acta Neuropathol Commun. (2014) ;2: :77. |
[57] | Buckley CE , Marguerie A , Roach AG , Goldsmith P , Fleming A , Alderton WK , et al. Drug reprofiling using zebrafish identifies novel compounds with potential pro-myelination effects. Neuropharmacology. (2010) ;59: (3):149–59. |
[58] | Monsma PC , Brown A . FluoroMyelin Red is a bright, photostable and non-toxic fluorescent stain for live imaging of myelin. J Neurosci Methods. (2012) ;209: (2):344–50. |
[59] | Wang C , Popescu DC , Wu C , Zhu J , Macklin W , Wang Y . In situ fluorescence imaging of myelination. J Histochem Cytochem. (2010) ;58: (7):611–21. |
[60] | Buckley CE , Marguerie A , Alderton WK , Franklin RJ . Temporal dynamics of myelination in the zebrafish spinal cord. Glia. (2010) ;58: (7):802–12. |
[61] | Czopka T , Lyons DA . Dissecting mechanisms of myelinated axon formation using zebrafish. Methods Cell Biol. (2011) ;105: :25–62. |
[62] | Kearns CA , Ravanelli AM , Cooper K , Appel B . Fbxw7 Limits Myelination by Inhibiting mTOR Signaling. J Neurosci. (2015) ;35: (44):14861–71. |
[63] | Bestman JE , Ewald RC , Chiu SL , Cline HT . In vivo single-cell electroporation for transfer of DNA and macromolecules. Nat Protoc. (2006) ;1: (3):1267–72. |
[64] | Haas K , Sin WC , Javaherian A , Li Z , Cline HT . Single-cell electroporation for gene transfer in vivo . Neuron. (2001) ;29: (3):583–91. |
[65] | Tawk M , Bianco IH , Clarke JD . Focal electroporation in zebrafish embryos and larvae. Methods Mol Biol. (2009) ;546: :145–51. |
[66] | Haas K , Jensen K , Sin WC , Foa L , Cline HT . Targeted electroporation in Xenopus tadpoles in vivo–from single cells to the entire brain. Differentiation. (2002) ;70: (4-5):148–54. |
[67] | Hsiao CD , Hsieh FJ , Tsai HJ . Enhanced expression and stable transmission of transgenes flanked by inverted terminal repeats from adeno-associated virus in zebrafish. Dev Dyn. (2001) ;220: (4):323–36. |
[68] | Fu Y , Kan D , Evans S . Transient transgenesis in Xenopus laevis facilitated by AAV-ITRs. Methods Mol Biol. (1999) ;127: :167–73. |
[69] | Cheo DL , Titus SA , Byrd DR , Hartley JL , Temple GF , Brasch MA . Concerted assembly and cloning of multiple DNA segments using in vitro site-specific recombination: Functional analysis of multi-segment expression clones. Genome Res. (2004) ;14: (10B):2111–20. |
[70] | Hartley JL , Temple GF , Brasch MA . DNA cloning using in vitro site-specific recombination. Genome Res. (2000) ;10: (11):1788–95. |
[71] | Kwan KM , Fujimoto E , Grabher C , Mangum BD , Hardy ME , Campbell DS , et al. The Tol2kit: A multisite gateway-based construction kit for Tol2 transposon transgenesis constructs. Dev Dyn. (2007) ;236: (11):3088–99. |
[72] | Kawakami K . Tol A versatile gene transfer vector in vertebrates. Genome Biol. (2007) ;8: (Suppl 1):S7. |
[73] | Yoshida M , Macklin WB . Oligodendrocyte development and myelination in GFP-transgenic zebrafish. J Neurosci Res. (2005) ;81: (1):1–8. |
[74] | Uemura O , Okada Y , Ando H , Guedj M , Higashijima S , Shimazaki T , et al. Comparative functional genomics revealed conservation and diversification of three enhancers of the isl1 gene for motor and sensory neuron-specific expression. Dev Biol. (2005) ;278: (2):587–606. |
[75] | Chatterjee S , Lufkin T . Fishing for function: Zebrafish BAC transgenics for functional genomics. Mol Biosyst. (2011) ;7: (8):2345–51. |
[76] | Shin J , Park HC , Topczewska JM , Mawdsley DJ , Appel B . Neural cell fate analysis in zebrafish using olig2 BAC transgenics. Methods Cell Sci. (2003) ;25: (1-2):7–14. |
[77] | Trinh le A , Fraser SE . Enhancer and gene traps for molecular imaging and genetic analysis in zebrafish. Dev Growth Differ. (2013) ;55: (4):434–45. |
[78] | Kawakami K , Abe G , Asada T , Asakawa K , Fukuda R , Ito A , et al. zTrap: Zebrafish gene trap and enhancer trap database. BMC Dev Biol. (2010) ;10: :105. |
[79] | Kondrychyn I , Teh C , Garcia-Lecea M , Guan Y , Kang A , Korzh V . Zebrafish Enhancer TRAP transgenic line database ZETRAP 2.0. Zebrafish. (2011) ;8: (4):181–2. |
[80] | Marquart GD , Tabor KM , Brown M , Strykowski JL , Varshney GK , LaFave MC , et al. A 3D searchable database of transgenic zebrafish Gal4 and cre lines for functional neuroanatomy studies. Front Neural Circuits. (2015) ;9: :78. |
[81] | Stepanenko OV , Stepanenko OV , Shcherbakova DM , Kuznetsova IM , Turoverov KK , Verkhusha VV . Modern fluorescent proteins: From chromophore formation to novel intracellular applications. Biotechniques. (2011) ;51: (5):313–4, 6, 8 passim. |
[82] | Hilderbrand SA , Weissleder R . Near-infrared fluorescence: Application to in vivo molecular imaging. Curr Opin Chem Biol. (2010) ;14: (1):71–9. |
[83] | Bizzarri R , Serresi M , Luin S , Beltram F . Green fluorescent protein based pH indicators for in vivo use: A review. Anal Bioanal Chem. (2009) ;393: (4):1107–22. |
[84] | Broussard GJ , Liang R , Tian L . Monitoring activity in neural circuits with genetically encoded indicators. Front Mol Neurosci. (2014) ;7: :97. |
[85] | Nienhaus K , Nienhaus GU . Fluorescent proteins for live-cell imaging with super-resolution. Chem Soc Rev. (2014) ;43: (4):1088–106. |
[86] | Reiss Y , Stradley SJ , Gierasch LM , Brown MS , Goldstein JL . Sequence requirement for peptide recognition by rat brain p21ras protein farnesyltransferase. Proc Natl Acad Sci U S A. (1991) ;88: (3):732–6. |
[87] | Previtali SC , Quattrini A , Fasolini M , Panzeri MC , Villa A , Filbin MT , et al. Epitope-tagged P(0) glycoprotein causes Charcot-Marie-Tooth-like neuropathy in transgenic mice. J Cell Biol. (2000) ;151: (5):1035–46. |
[88] | Brand AH , Perrimon N . Targeted gene expression as a means of altering cell fates and generating dominant phenotypes. Development. (1993) ;118: (2):401–15. |
[89] | Koster RW , Fraser SE . Tracing transgene expression in living zebrafish embryos. Dev Biol. (2001) ;233: (2):329–46. |
[90] | Distel M , Wullimann MF , Koster RW . Optimized Gal4 genetics for permanent gene expression mapping in zebrafish. Proc Natl Acad Sci U S A. (2009) ;106: (32):13365–70. |
[91] | Almeida RG , Lyons DA . Intersectional gene expression in zebrafish using the split KalTA4 system. Zebrafish. (2015) ;12: (6):377–86. |
[92] | Luan H , Peabody NC , Vinson CR , White BH . Refined spatial manipulation of neuronal function by combinatorial restriction of transgene expression. Neuron. (2006) ;52: (3):425–36. |
[93] | Tuthill JC , Nern A , Holtz SL , Rubin GM , Reiser MB . Contributions of the 12 neuron classes in the fly lamina to motion vision. Neuron. (2013) ;79: (1):128–40. |
[94] | Shimizu A , Shimizu N . Dual promoter expression system with insulator ensures a stringent tissue-specific regulation of two reporter genes in the transgenic fish. Transgenic Res. (2013) ;22: (2):435–44. |
[95] | Distel M , Hocking JC , Volkmann K , Koster RW . The centrosome neither persistently leads migration nor determines the site of axonogenesis in migrating neurons in vivo . J Cell Biol. (2010) ;191: (4):875–90. |
[96] | Paquet D , Bhat R , Sydow A , Mandelkow EM , Berg S , Hellberg S , et al. A zebrafish model of tauopathy allows in vivo imaging of neuronal cell death and drug evaluation. J Clin Invest. (2009) ;119: (5):1382–95. |
[97] | Stoneley M , Willis AE . Cellular internal ribosome entry segments: Structures, trans-acting factors and regulation of gene expression. Oncogene. (2004) ;23: (18):3200–7. |
[98] | de Felipe P , Luke GA , Hughes LE , Gani D , Halpin C , Ryan MD . E unum pluribus: Multiple proteins from a self-processing polyprotein. Trends Biotechnol. (2006) ;24: (2):68–75. |
[99] | Provost E , Rhee J , Leach SD . Viral 2A peptides allow expression of multiple proteins from a single ORF in transgenic zebrafish embryos. Genesis. (2007) ;45: (10):625–9. |
[100] | Szymczak AL , Workman CJ , Wang Y , Vignali KM , Dilioglou S , Vanin EF , et al. Correction of multi-gene deficiency in vivo using a single ‘self-cleaving’ 2A peptide-based retroviral vector. Nat Biotechnol. (2004) ;22: (5):589–94. |
[101] | Wong ET , Ngoi SM , Lee CG . Improved co-expression of multiple genes in vectors containing internal ribosome entry sites (IRESes) from human genes. Gene Ther. (2002) ;9: (5):337–44. |
[102] | Donnelly ML , Luke G , Mehrotra A , Li X , Hughes LE , Gani D , et al. Analysis of the aphthovirus 2A/2B polyprotein ‘cleavage’ mechanism indicates not a proteolytic reaction, but a novel translational effect: A putative ribosomal ‘skip’. J Gen Virol. (2001) ;82: (Pt 5):1013–25. |
[103] | Kim JH , Lee SR , Li LH , Park HJ , Park JH , Lee KY , et al. High cleavage efficiency of a 2A peptide derived from porcine teschovirus-1 in human cell lines, zebrafish and mice. PLoS One. (2011) ;6: (4):e18556. |
[104] | Halloran MC , Sato-Maeda M , Warren JT , Su F , Lele Z , Krone PH , et al. Laser-induced gene expression in specific cells of transgenic zebrafish. Development. (2000) ;127: (9):1953–60. |
[105] | Marsh-Armstrong N , Huang H , Berry DL , Brown DD . Germ-line transmission of transgenes in Xenopus laevis. Proc Natl Acad Sci U S A. (1999) ;96: (25):14389–93. |
[106] | Shoji W , Sato-Maeda M . Application of heat shock promoter in transgenic zebrafish. Dev Growth Differ. (2008) ;50: (6):401–6. |
[107] | Hardy ME , Ross LV , Chien CB . Focal gene misexpression in zebrafish embryos induced by local heat shock using a modified soldering iron. Dev Dyn. (2007) ;236: (11):3071–6. |
[108] | Feil R , Wagner J , Metzger D , Chambon P . Regulation of Cre recombinase activity by mutated estrogen receptor ligand-binding domains. Biochem Biophys Res Commun. (1997) ;237: (3):752–7. |
[109] | Hans S , Kaslin J , Freudenreich D , Brand M . Temporally-controlled site-specific recombination in zebrafish. PLoS One.e. (2009) ;4: (2):4640. |
[110] | Jungke P , Hans S , Brand M . The zebrafish CreZoo: An easy-to-handle database for novel CreER(T2)-driver lines. Zebrafish. (2013) ;10: (3):259–63. |
[111] | Jungke P , Hammer J , Hans S , Brand M . Isolation of novel CreERT2-driver lines in zebrafish using an unbiased gene trap approach. PLoS One. (2015) ;10: (6):e0129072. |
[112] | Love NR , Thuret R , Chen Y , Ishibashi S , Sabherwal N , Paredes R , et al. pTransgenesis: A cross-species, modular transgenesis resource. Development. (2011) ;138: (24):5451–8. |
[113] | Emelyanov A , Parinov S . Mifepristone-inducible LexPR system to drive and control gene expression in transgenic zebrafish. Dev Biol. (2008) ;320: (1):113–21. |
[114] | Zhu Z , Zheng T , Lee CG , Homer RJ , Elias JA . Tetracycline-controlled transcriptional regulation systems: Advances and application in transgenic animal modeling. Semin Cell Dev Biol. (2002) ;13: (2):121–8. |
[115] | Knopf F , Schnabel K , Haase C , Pfeifer K , Anastassiadis K , Weidinger G . Dually inducible TetON systems for tissue-specific conditional gene expression in zebrafish. Proc Natl Acad Sci U S A. (2010) ;107: (46):19933–8. |
[116] | Rankin SA , Zorn AM , Buchholz DR . New doxycycline-inducible transgenic lines in Xenopus. Dev Dyn. (2011) ;240: (6):1467–74. |
[117] | White JG , Amos WB , Fordham M . An evaluation of confocal versus conventional imaging of biological structures by fluorescence light microscopy. J Cell Biol. (1987) ;105: (1):41–8. |
[118] | Oreopoulos J , Berman R , Browne M . Spinning-disk confocal microscopy: Present technology and future trends. Methods Cell Biol. (2014) ;123: :153–75. |
[119] | Denk W , Strickler JH , Webb WW . Two-photon laser scanning fluorescence microscopy. Science. (1990) ;248: (4951):73–6. |
[120] | Christensen DJ , Nedergaard M . Two-photon in vivo imaging of cells. Pediatr Nephrol. (2011) ;26: (9):1483–9. |
[121] | Kobat D , Durst ME , Nishimura N , Wong AW , Schaffer CB , Xu C . Deep tissue multiphoton microscopy using longer wavelength excitation. Opt Express. (2009) ;17: (16):13354–64. |
[122] | Hughes EG , Kang SH , Fukaya M , Bergles DE . Oligodendrocyte progenitors balance growth with self-repulsion to achieve homeostasis in the adult brain. Nat Neurosci. (2013) ;16: (6):668–76. |
[123] | Nikic I , Merkler D , Sorbara C , Brinkoetter M , Kreutzfeldt M , Bareyre FM , et al. A reversible form of axon damage in experimental autoimmune encephalomyelitis and multiple sclerosis. Nat Med. (2011) ;17: (4):495–9. |
[124] | Siedentopf H , Zsigmondy R . Über Sichtbarmachung und Größenbestimmung ultramikoskopischer Teilchen, mit besonderer Anwendung auf Goldrubingläser. Ann Phys. (1902) ;315: :1–39. |
[125] | Keller PJ , Schmidt AD , Wittbrodt J , Stelzer EH . Reconstruction of zebrafish early embryonic development by scanned light sheet microscopy. Science. (2008) ;322: (5904):1065–9. |
[126] | Adams MW , Loftus AF , Dunn SE , Joens MS , Fitzpatrick JA . Light Sheet Fluorescence Microscopy (LSFM). Curr Protoc Cytom. (2015) ;71: :12 37 1–12 37 15. |
[127] | Ahrens MB , Orger MB , Robson DN , Li JM , Keller PJ . Whole-brain functional imaging at cellular resolution using light-sheet microscopy. Nat Methods. (2013) ;10: (5):413–20. |
[128] | Panier T , Romano SA , Olive R , Pietri T , Sumbre G , Candelier R , et al. Fast functional imaging of multiple brain regions in intact zebrafish larvae using selective plane illumination microscopy. Front Neural Circuits. (2013) ;7: :65. |
[129] | Park OK , Kwak J , Jung YJ , Kim YH , Hong HS , Hwang BJ , et al. 3D Light-Sheet Fluorescence Microscopy of Cranial Neurons and Vasculature during Zebrafish Embryogenesis. Mol Cells. (2015) ;38: (11):975–81. |
[130] | Arrenberg AB , Stainier DY , Baier H , Huisken J . Optogenetic control of cardiac function. Science. (2010) ;330: (6006):971–4. |
[131] | Tomer R , Lovett-Barron M , Kauvar I , Andalman A , Burns VM , Sankaran S , et al. SPED light sheet microscopy: Fast mapping of biological system structure and function. Cell. (2015) ;163: (7):1796–806. |
[132] | Keller PJ , Ahrens MB . Visualizing whole-brain activity and development at the single-cell level using light-sheet microscopy. Neuron. (2015) ;85: (3):462–83. |
[133] | Truong TV , Supatto W , Koos DS , Choi JM , Fraser SE . Deep and fast live imaging with two-photon scanned light-sheet microscopy. Nat Methods. (2011) ;8: (9):757–60. |
[134] | Vettenburg T , Dalgarno HI , Nylk J , Coll-Llado C , Ferrier DE , Cizmar T , et al. Light-sheet microscopy using an Airy beam. Nat Methods. (2014) ;11: (5):541–4. |
[135] | Xiao Y , Faucherre A , Pola-Morell L , Heddleston JM , Liu TL , Chew TL , et al. High-resolution live imaging reveals axon-glia interactions during peripheral nerve injury and repair in zebrafish. Dis Model Mech. (2015) ;8: (6):553–64. |
[136] | Chen BC , Legant WR , Wang K , Shao L , Milkie DE , Davidson MW , et al. Lattice light-sheet microscopy: Imaging molecules to embryos at high spatiotemporal resolution. Science. (2014) ;346: (6208):1257998. |
[137] | Bassi A , Schmid B , Huisken J . Optical tomography complements light sheet microscopy for in toto imaging of zebrafish development. Development. (2015) ;142: (5):1016–20. |
[138] | Yamanaka M , Smith NI , Fujita K . Introduction to super-resolution microscopy. Microscopy (Oxf). (2014) ;63: (3):177–92. |
[139] | Klar TA , Jakobs S , Dyba M , Egner A , Hell SW . Fluorescence microscopy with diffraction resolution barrier broken by stimulated emission. Proc Natl Acad Sci U S A. (2000) ;97: (15):8206–10. |
[140] | Westphal V , Hell SW . Nanoscale resolution in the focal plane of an optical microscope. Phys Rev Lett. (2005) ;94: (14):143903. |
[141] | Schmidt R , Wurm CA , Punge A , Egner A , Jakobs S , Hell SW . Mitochondrial cristae revealed with focused light. Nano Lett. (2009) ;9: (6):2508–10. |
[142] | Takasaki KT , Ding JB , Sabatini BL . Live-cell superresolution imaging by pulsed STED two-photon excitation microscopy. Biophys J. (2013) ;104: (4):770–7. |
[143] | Friedrich M , Gan Q , Ermolayev V , Harms GS . STED-SPIM: Stimulated emission depletion improves sheet illumination microscopy resolution. Biophys J. (2011) ;100: (8):L43–5. |
[144] | Grotjohann T , Testa I , Leutenegger M , Bock H , Urban NT , Lavoie-Cardinal F , et al. Diffraction-unlimited all-optical imaging and writing with a photochromic GFP. Nature. (2011) ;478: (7368):204–8. |
[145] | Testa I , Urban NT , Jakobs S , Eggeling C , Willig KI , Hell SW . Nanoscopy of living brain slices with low light levels. Neuron. (2012) ;75: (6):992–1000. |
[146] | Gustafsson MG , Shao L , Carlton PM , Wang CJ , Golubovskaya IN , Cande WZ , et al. Three-dimensional resolution doubling in wide-field fluorescence microscopy by structured illumination. Biophys J. (2008) ;94: (12):4957–70. |
[147] | Hirano Y , Matsuda A , Hiraoka Y . Recent advancements in structured-illumination microscopy toward live-cell imaging. Microscopy (Oxf). (2015) ;64: (4):237–49. |
[148] | Shaw M , Zajiczek L , O’Holleran K . High speed structured illumination microscopy in optically thick samples. Methods. (2015) ;88: :11–9. |
[149] | Gao L , Shao L , Higgins CD , Poulton JS , Peifer M , Davidson MW , et al. Noninvasive imaging beyond the diffraction limit of 3D dynamics in thickly fluorescent specimens. Cell. (2012) ;151: (6):1370–85. |
[150] | Huff J . The Airyscan detector from ZEISS: Confocal imaging with improved signal-to-noise ratio and super-resolution. Nat Methods. (2015) ;12. |
[151] | Mobius W , Nave KA , Werner HB . Electron microscopy of myelin: Structure preservation by high-pressure freezing. Brain Res. (2016) . |
[152] | Denk W , Horstmann H . Serial block-face scanning electron microscopy to reconstruct three-dimensional tissue nanostructure. PLoS Biol. (2004) ;2: (11):e329. |
[153] | Kasthuri N , Hayworth KJ , Berger DR , Schalek RL , Conchello JA , Knowles-Barley S , et al. Saturated Reconstruction of a Volume of Neocortex. Cell. (2015) ;162: (3):648–61. |
[154] | Knott G , Marchman H , Wall D , Lich B . Serial section scanning electron microscopy of adult brain tissue using focused ion beam milling. J Neurosci. (2008) ;28: (12):2959–64. |
[155] | Mikula S , Denk W . High-resolution whole-brain staining for electron microscopic circuit reconstruction. Nat Methods. (2015) ;12: (6):541–6. |
[156] | Bunge RP , Bunge MB , Bates M . Movements of the Schwann cell nucleus implicate progression of the inner (axon-related) Schwann cell process during myelination. J Cell Biol. (1989) ;109: (1):273–84. |
[157] | Loussert Fonta C , Humbel BM . Correlative microscopy. Arch Biochem Biophys. (2015) ;581: :98–110. |
[158] | Armer HE , Mariggi G , Png KM , Genoud C , Monteith AG , Bushby AJ , et al. Imaging transient blood vessel fusion events in zebrafish by correlative volume electron microscopy. PLoS One. (2009) ;4: (11):e7716. |
[159] | Luby-Phelps K , Ning G , Fogerty J , Besharse JC . Visualization of identified GFP-expressing cells by light and electron microscopy. J Histochem Cytochem. (2003) ;51: (3):271–4. |
[160] | Viswanathan S , Williams ME , Bloss EB , Stasevich TJ , Speer CM , Nern A , et al. High-performance probes for light and electron microscopy. Nat Methods. (2015) ;12: (6):568–76. |
[161] | Li J , Erisir A , Cline H . In vivo time-lapse imaging and serial section electron microscopy reveal developmental synaptic rearrangements. Neuron. (2011) ;69: (2):273–86. |
[162] | Shu X , Lev-Ram V , Deerinck TJ , Qi Y , Ramko EB , Davidson MW , et al. A genetically encoded tag for correlated light and electron microscopy of intact cells, tissues, and organisms. PLoS Biol. (2011) ;9: (4):e1001041. |
[163] | Lam SS , Martell JD , Kamer KJ , Deerinck TJ , Ellisman MH , Mootha VK , et al. Directed evolution of APEX2 for electron microscopy and proximity labeling. Nat Methods. (2015) ;12: (1):51–4. |
[164] | Remahl S , Hildebrand C . Relations between axons and oligodendroglial cells during initial myelination. II. The individual axon. J Neurocytol. (1990) ;19: (6):883–98. |
[165] | Remahl S , Hildebrand C . Relation between axons and oligodendroglial cells during initial myelination. I. The glial unit. J Neurocytol. (1990) ;19: (3):313–28. |
[166] | Blazquez-Llorca L , Hummel E , Zimmerman H , Zou C , Burgold S , Rietdorf J , et al. Correlation of two-photon in vivo imaging and FIB/SEM microscopy. J Microsc. (2015) ;259: (2):129–36. |
[167] | Tomassy GS , Berger DR , Chen HH , Kasthuri N , Hayworth KJ , Vercelli A , et al. Distinct profiles of myelin distribution along single axons of pyramidal neurons in the neocortex. Science. (2014) ;344: (6181):319–24. |
[168] | Lichtman JW , Pfister H , Shavit N . The big data challenges of connectomics. Nat Neurosci. (2014) ;17: (11):1448–54. |
[169] | Snaidero N , Mobius W , Czopka T , Hekking LH , Mathisen C , Verkleij D , et al. Myelin membrane wrapping of CNS axons by PI(3,4,5)P3-dependent polarized growth at the inner tongue. Cell. (2014) ;156: (1-2):277–90. |
[170] | Farrar MJ , Wise FW , Fetcho JR , Schaffer CB . In vivo imaging of myelin in the vertebrate central nervous system using third harmonic generation microscopy. Biophys J. (2011) ;100: (5):1362–71. |
[171] | Lim H , Sharoukhov D , Kassim I , Zhang Y , Salzer JL , Melendez-Vasquez CV . Label-free imaging of Schwann cell myelination by third harmonic generation microscopy. Proc Natl Acad Sci U S A. (2014) ;111: (50):18025–30. |
[172] | Hill RA , Grutzendler J . In vivo imaging of oligodendrocytes with sulforhodamine 101. Nat Methods. (2014) ;11: (11):1081–2. |
[173] | Schain AJ , Hill RA , Grutzendler J . Label-free in vivo imaging of myelinated axons in health and disease with spectral confocal reflectance microscopy. Nat Med. (2014) ;20: (4):443–9. |
[174] | Ben Arous J , Binding J , Leger JF , Casado M , Topilko P , Gigan S , et al. Single myelin fiber imaging in living rodents without labeling by deep optical coherence microscopy. J Biomed Opt. (2011) ;16: (11):116012. |
[175] | Schie IW , Krafft C , Popp J . Applications of coherent Raman scattering microscopies to clinical and biological studies. Analyst. (2015) ;140: (12):3897–909. |
[176] | Yu Y , Ramachandran PV , Wang MC . Shedding new light on lipid functions with CARS and SRS microscopy. Biochim Biophys Acta. (2014) ;1841: (8):1120–9. |
[177] | Manzoli FA , Stefoni S , Manzoli-Guidotti L , Barbieri M . The fatty acids of myelin phospholipids. FEBS Lett. (1970) ;10: (5):317–20. |
[178] | Wang H , Fu Y , Zickmund P , Shi R , Cheng JX . Coherent anti-stokes Raman scattering imaging of axonal myelin in live spinal tissues. Biophys J. (2005) ;89: (1):581–91. |
[179] | Fu Y , Frederick TJ , Huff TB , Goings GE , Miller SD , Cheng JX . Paranodal myelin retraction in relapsing experimental autoimmune encephalomyelitis visualized by coherent anti-Stokes Raman scattering microscopy. J Biomed Opt. (2011) ;16: (10):106006. |
[180] | Imitola J , Cote D , Rasmussen S , Xie XS , Liu Y , Chitnis T , et al. Multimodal coherent anti-Stokes Raman scattering microscopy reveals microglia-associated myelin and axonal dysfunction in multiple sclerosis-like lesions in mice. J Biomed Opt. (2011) ;16: (2):021109. |
[181] | Belanger E , Henry FP , Vallee R , Randolph MA , Kochevar IE , Winograd JM , et al. In vivo evaluation of demyelination and remyelination in a nerve crush injury model. Biomed Opt Express. (2011) ;2: (9):2698–708. |
[182] | Fu Y , Wang H , Huff TB , Shi R , Cheng JX . Coherent anti-Stokes Raman scattering imaging of myelin degradation reveals a calcium-dependent pathway in lyso-PtdCho-induced demyelination. J Neurosci Res. (2007) ;85: (13):2870–81. |
[183] | Henry FP , Cote D , Randolph MA , Rust EA , Redmond RW , Kochevar IE , et al. Real-time in vivo assessment of the nerve microenvironment with coherent anti-Stokes Raman scattering microscopy. Plast Reconstr Surg. (2009) ;123: (2 Suppl):123S–30S. |
[184] | Shi Y , Zhang D , Huff TB , Wang X , Shi R , Xu XM , et al. Longitudinal in vivo coherent anti-Stokes Raman scattering imaging of demyelination and remyelination in injured spinal cord. J Biomed Opt. (2011) ;16: (10):106012. |
[185] | Fu Y , Sun W , Shi Y , Shi R , Cheng JX . Glutamate excitotoxicity inflicts paranodal myelin splitting and retraction. PLoS One. (2009) ;4: (8):e6705. |
[186] | Huff TB , Shi Y , Sun W , Wu W , Shi R , Cheng JX . Real-time CARS imaging reveals a calpain-dependent pathway for paranodal myelin retraction during high-frequency stimulation. PLoS One. (2011) ;6: (3):e17176. |
[187] | Wang MC , Min W , Freudiger CW , Ruvkun G , Xie XS . RNAi screening for fat regulatory genes with SRS microscopy. Nat Methods. (2011) ;8: (2):135–8. |
[188] | Yen K , Le TT , Bansal A , Narasimhan SD , Cheng JX , Tissenbaum HA . A comparative study of fat storage quantitation in nematode Caenorhabditis elegans using label and label-free methods. PLoS One. (2010) ;5: (9). |
[189] | Hu CR , Zhang D , Slipchenko MN , Cheng JX , Hu B . Label-free real-time imaging of myelination in the Xenopus laevis tadpole by in vivo stimulated Raman scattering microscopy. J Biomed Opt. (2014) ;19: (8):086005. |
[190] | Nawaz S , Sanchez P , Schmitt S , Snaidero N , Mitkovski M , Velte C , et al. Actin filament turnover drives leading edge growth during myelin sheath formation in the central nervous system. Dev Cell. (2015) ;34: (2):139–51. |
[191] | Hines JH , Ravanelli AM , Schwindt R , Scott EK , Appel B . Neuronal activity biases axon selection for myelination in vivo . Nat Neurosci. (2015) ;18: (5):683–9. |
[192] | Mensch S , Baraban M , Almeida R , Czopka T , Ausborn J , El Manira A , et al. Synaptic vesicle release regulates myelin sheath number of individual oligodendrocytes in vivo . Nat Neurosci. (2015) ;18: (5):628–30. |
[193] | Koudelka S , Voas MG , Almeida RG , Baraban M , Soetaert J , Meyer MP , et al. Individual neuronal subtypes exhibit diversity in CNS myelination mediated by synaptic vesicle release. Curr Biol. (2016) ;26: (11):1447–55. |
[194] | Raphael AR , Talbot WS . New insights into signaling during myelination in zebrafish. Curr Top Dev Biol. (2011) ;97: :1–19. |
[195] | Sekizar S , Mannioui A , Azoyan L , Colin C , Thomas JL , Du Pasquier D , et al. Remyelination by resident oligodendrocyte precursor cells in a xenopus laevis inducible model of demyelination. Dev Neurosci. (2015) ;37: (3):232–42. |
[196] | Huang JK , Jarjour AA , Nait Oumesmar B , Kerninon C , Williams A , Krezel W , et al. Retinoid X receptor gamma signaling accelerates CNS remyelination. Nat Neurosci. (2011) ;14: (1):45–53. |
[197] | Kim S , Lee YI , Chang KY , Lee DW , Cho SC , Ha YW , et al. Promotion of remyelination by sulfasalazine in a transgenic zebrafish model of demyelination. Mol Cells. (2015) ;38: (11):1013–21. |
[198] | Franklin RJ . Why does remyelination fail in multiple sclerosis? Nat Rev Neurosci. (2002) ;3: (9):705–14. |
[199] | Gibson EM , Purger D , Mount CW , Goldstein AK , Lin GL , Wood LS , et al. Neuronal activity promotes oligodendrogenesis and adaptive myelination in the mammalian brain. Science. (2014) ;344: (6183):1252304. |
[200] | Ballister ER , Ayloo S , Chenoweth DM , Lampson MA , Holzbaur EL . Optogenetic control of organelle transport using a photocaged chemical inducer of dimerization. Curr Biol. (2015) ;25: (10):R407–8. |
[201] | Buckley CE , Moore RE , Reade A , Goldberg AR , Weiner OD , Clarke JD . Reversible optogenetic control of subcellular protein localization in a live vertebrate embryo. Dev Cell. (2016) ;36: (1):117–26. |
[202] | van Bergeijk P , Adrian M , Hoogenraad CC , Kapitein LC . Optogenetic control of organelle transport and positioning. Nature. (2015) ;518: (7537):111–4. |
[203] | Bai Q , Parris RS , Burton EA . Different mechanisms regulate expression of zebrafish myelin protein zero (P0) in myelinating oligodendrocytes and its induction following axonal injury. J Biol Chem. (2014) ;289: (35):24114–28. |
[204] | Ng AN , de Jong-Curtain TA , Mawdsley DJ , White SJ , Shin J , Appel B , et al. Formation of the digestive system in zebrafish: III. Intestinal epithelium morphogenesis. Dev Biol. (2005) ;286: (1):114–35. |
[205] | Schebesta M , Serluca FC . olig1 Expression identifies developing oligodendrocytes in zebrafish and requires hedgehog and notch signaling. Dev Dyn. (2009) ;238: (4):887–98. |
[206] | Kucenas S , Snell H , Appel B . nkx2. 2a promotes specification and differentiation of a myelinating subset of oligodendrocyte lineage cells in zebrafish. Neuron Glia Biol. (2008) ;4: (2):71–81. |
[207] | Zannino DA , Appel B . Olig2+ precursors produce abducens motor neurons and oligodendrocytes in the zebrafish hindbrain. J Neurosci. (2009) ;29: (8):2322–33. |
[208] | Dutton JR , Antonellis A , Carney TJ , Rodrigues FS , Pavan WJ , Ward A , et al. An evolutionarily conserved intronic region controls the spatiotemporal expression of the transcription factor Sox10. BMC Dev Biol. (2008) ;8: :105. |
[209] | Prendergast A , Linbo TH , Swarts T , Ungos JM , McGraw HF , Krispin S , et al. The metalloproteinase inhibitor Reck is essential for zebrafish DRG development. Development. (2012) ;139: (6):1141–52. |
[210] | Gilmour DT , Maischein HM , Nusslein-Volhard C . Migration and function of a glial subtype in the vertebrate peripheral nervous system. Neuron. (2002) ;34: (4):577–88. |
[211] | Glenn TD , Talbot WS . Analysis of Gpr126 function defines distinct mechanisms controlling the initiation and maturation of myelin. Development. (2013) ;140: (15):3167–75. |
Figures and Tables
Fig.1
Timeline of developmental myelination in zebrafish larvae and Xenopus tadpoles. Schematic indicates rapid development of zebrafish and Xenopus embryos from one cell stage (left) to larvae (right) with myelinated axons. hpf = hours post fertilisation. dpf = days post fertilisation.
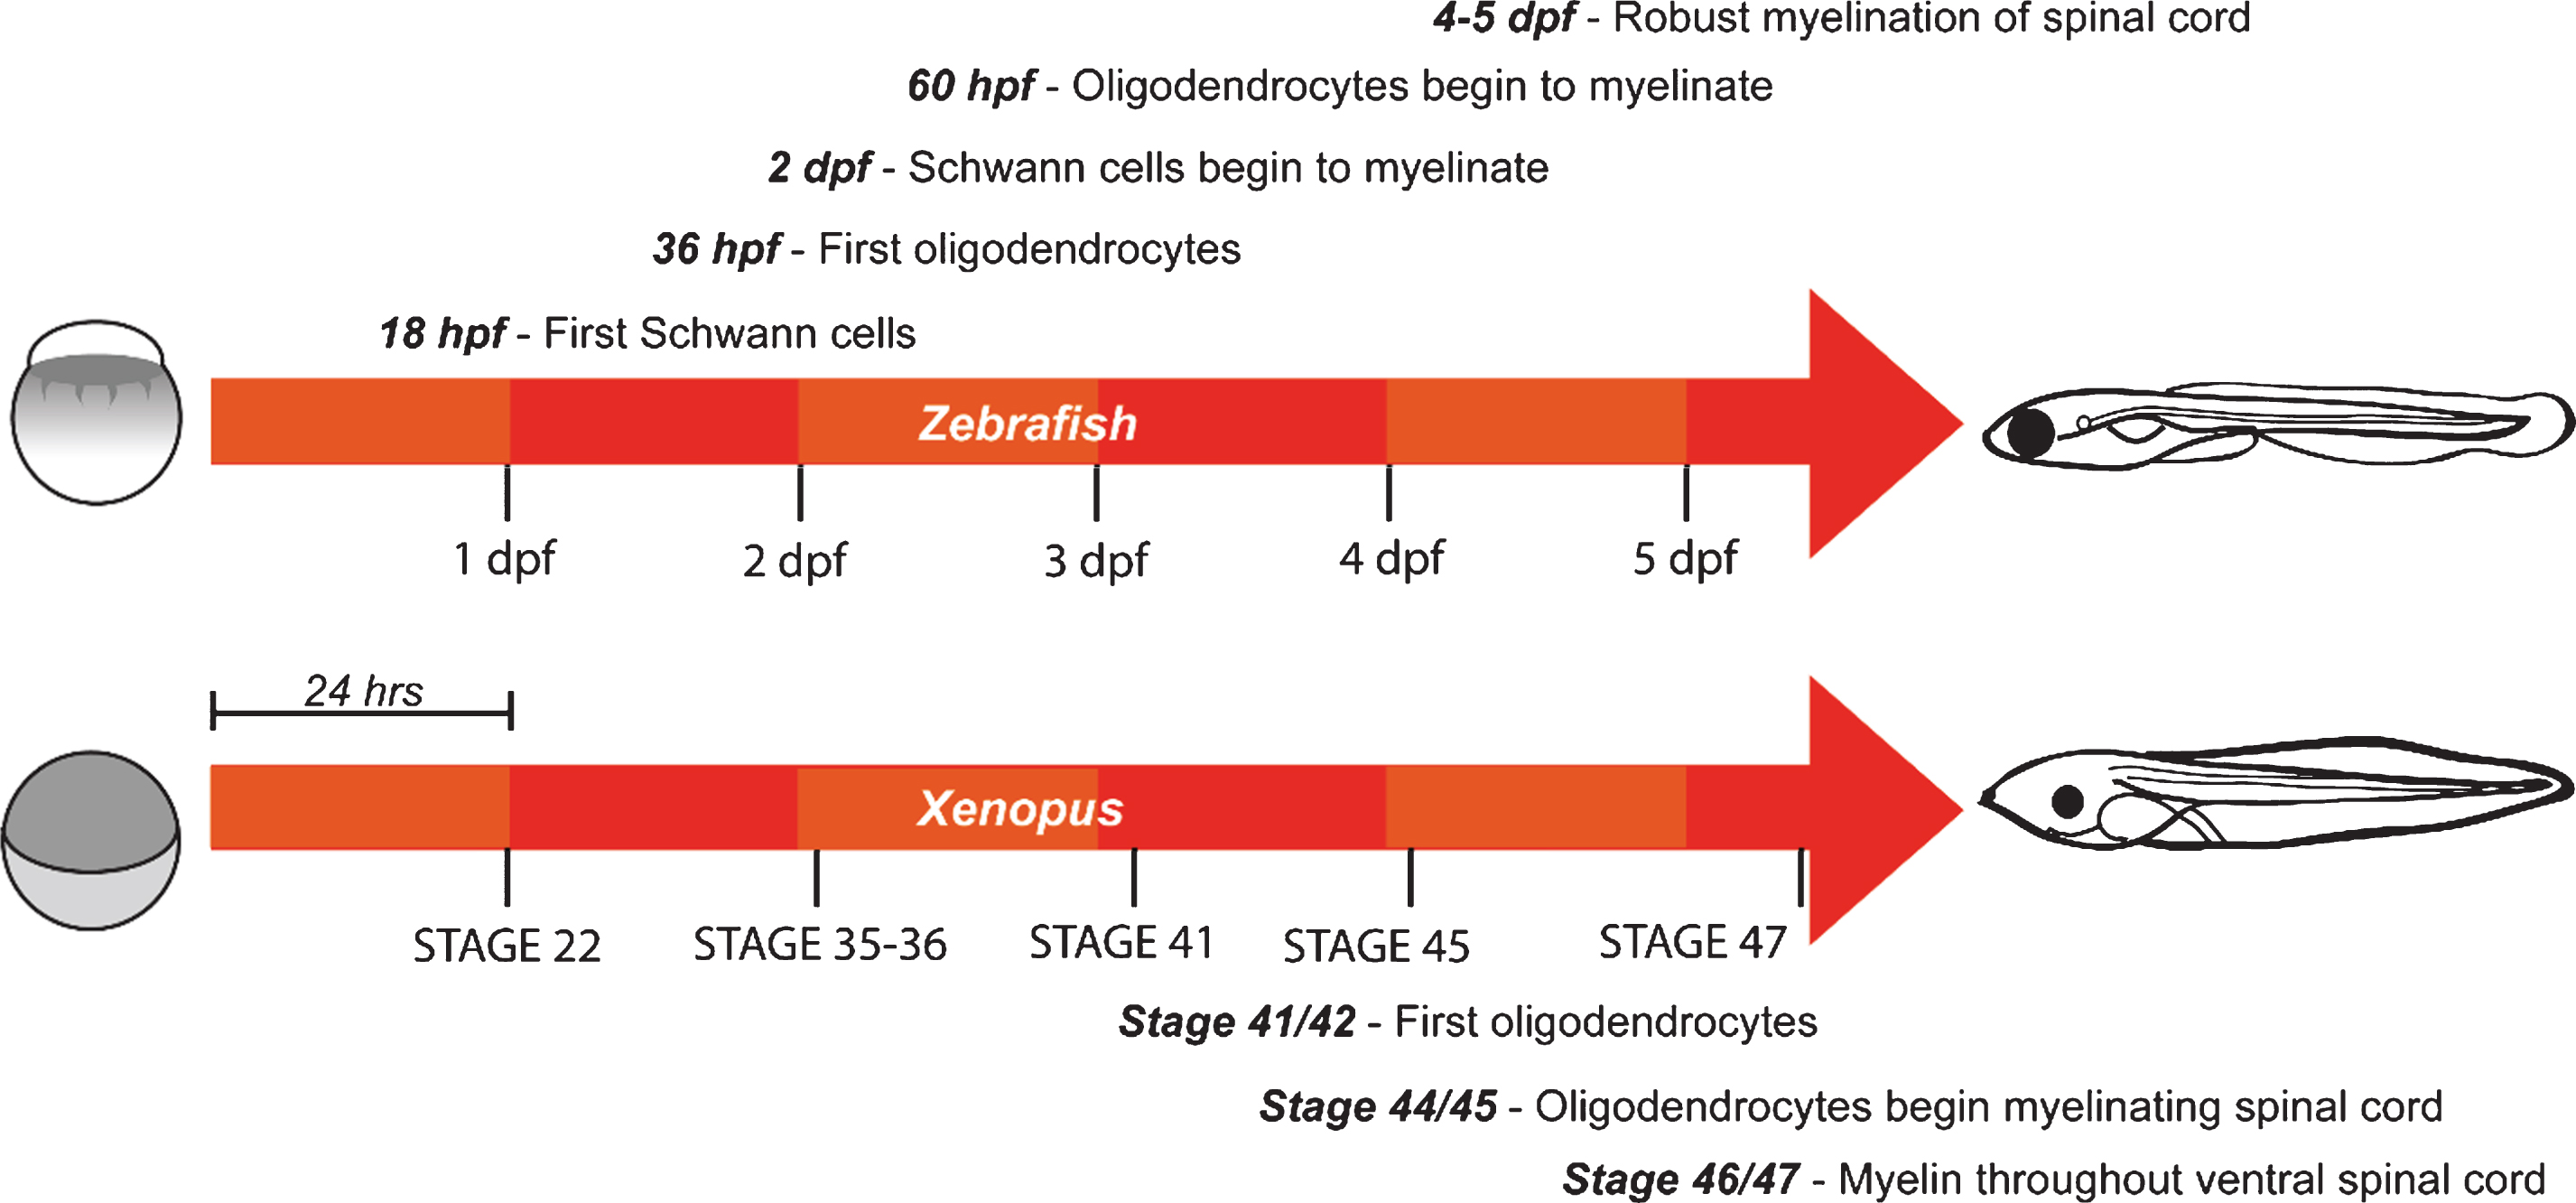
Fig.2
Generation of transgenic zebrafish to visualize myelinating oligodendrocytes. A) Transgenic animals with mosaic fluorescent reporter expression in myelinating oligodendrocytes can be generated by injection of plasmid at the one cell stage, and visualized in the injected animals at early larval stages. B) Transgenic animals with stable expression of a transgene that labels all myelin in the animal are first injected with plasmid as in A, then grown to adulthood. Adults are bred with non-transgenic animals to identify those in which plasmid integration has occurred in the germ-line and which can generate offspring with expression in all myelinating oligodendrocytes.
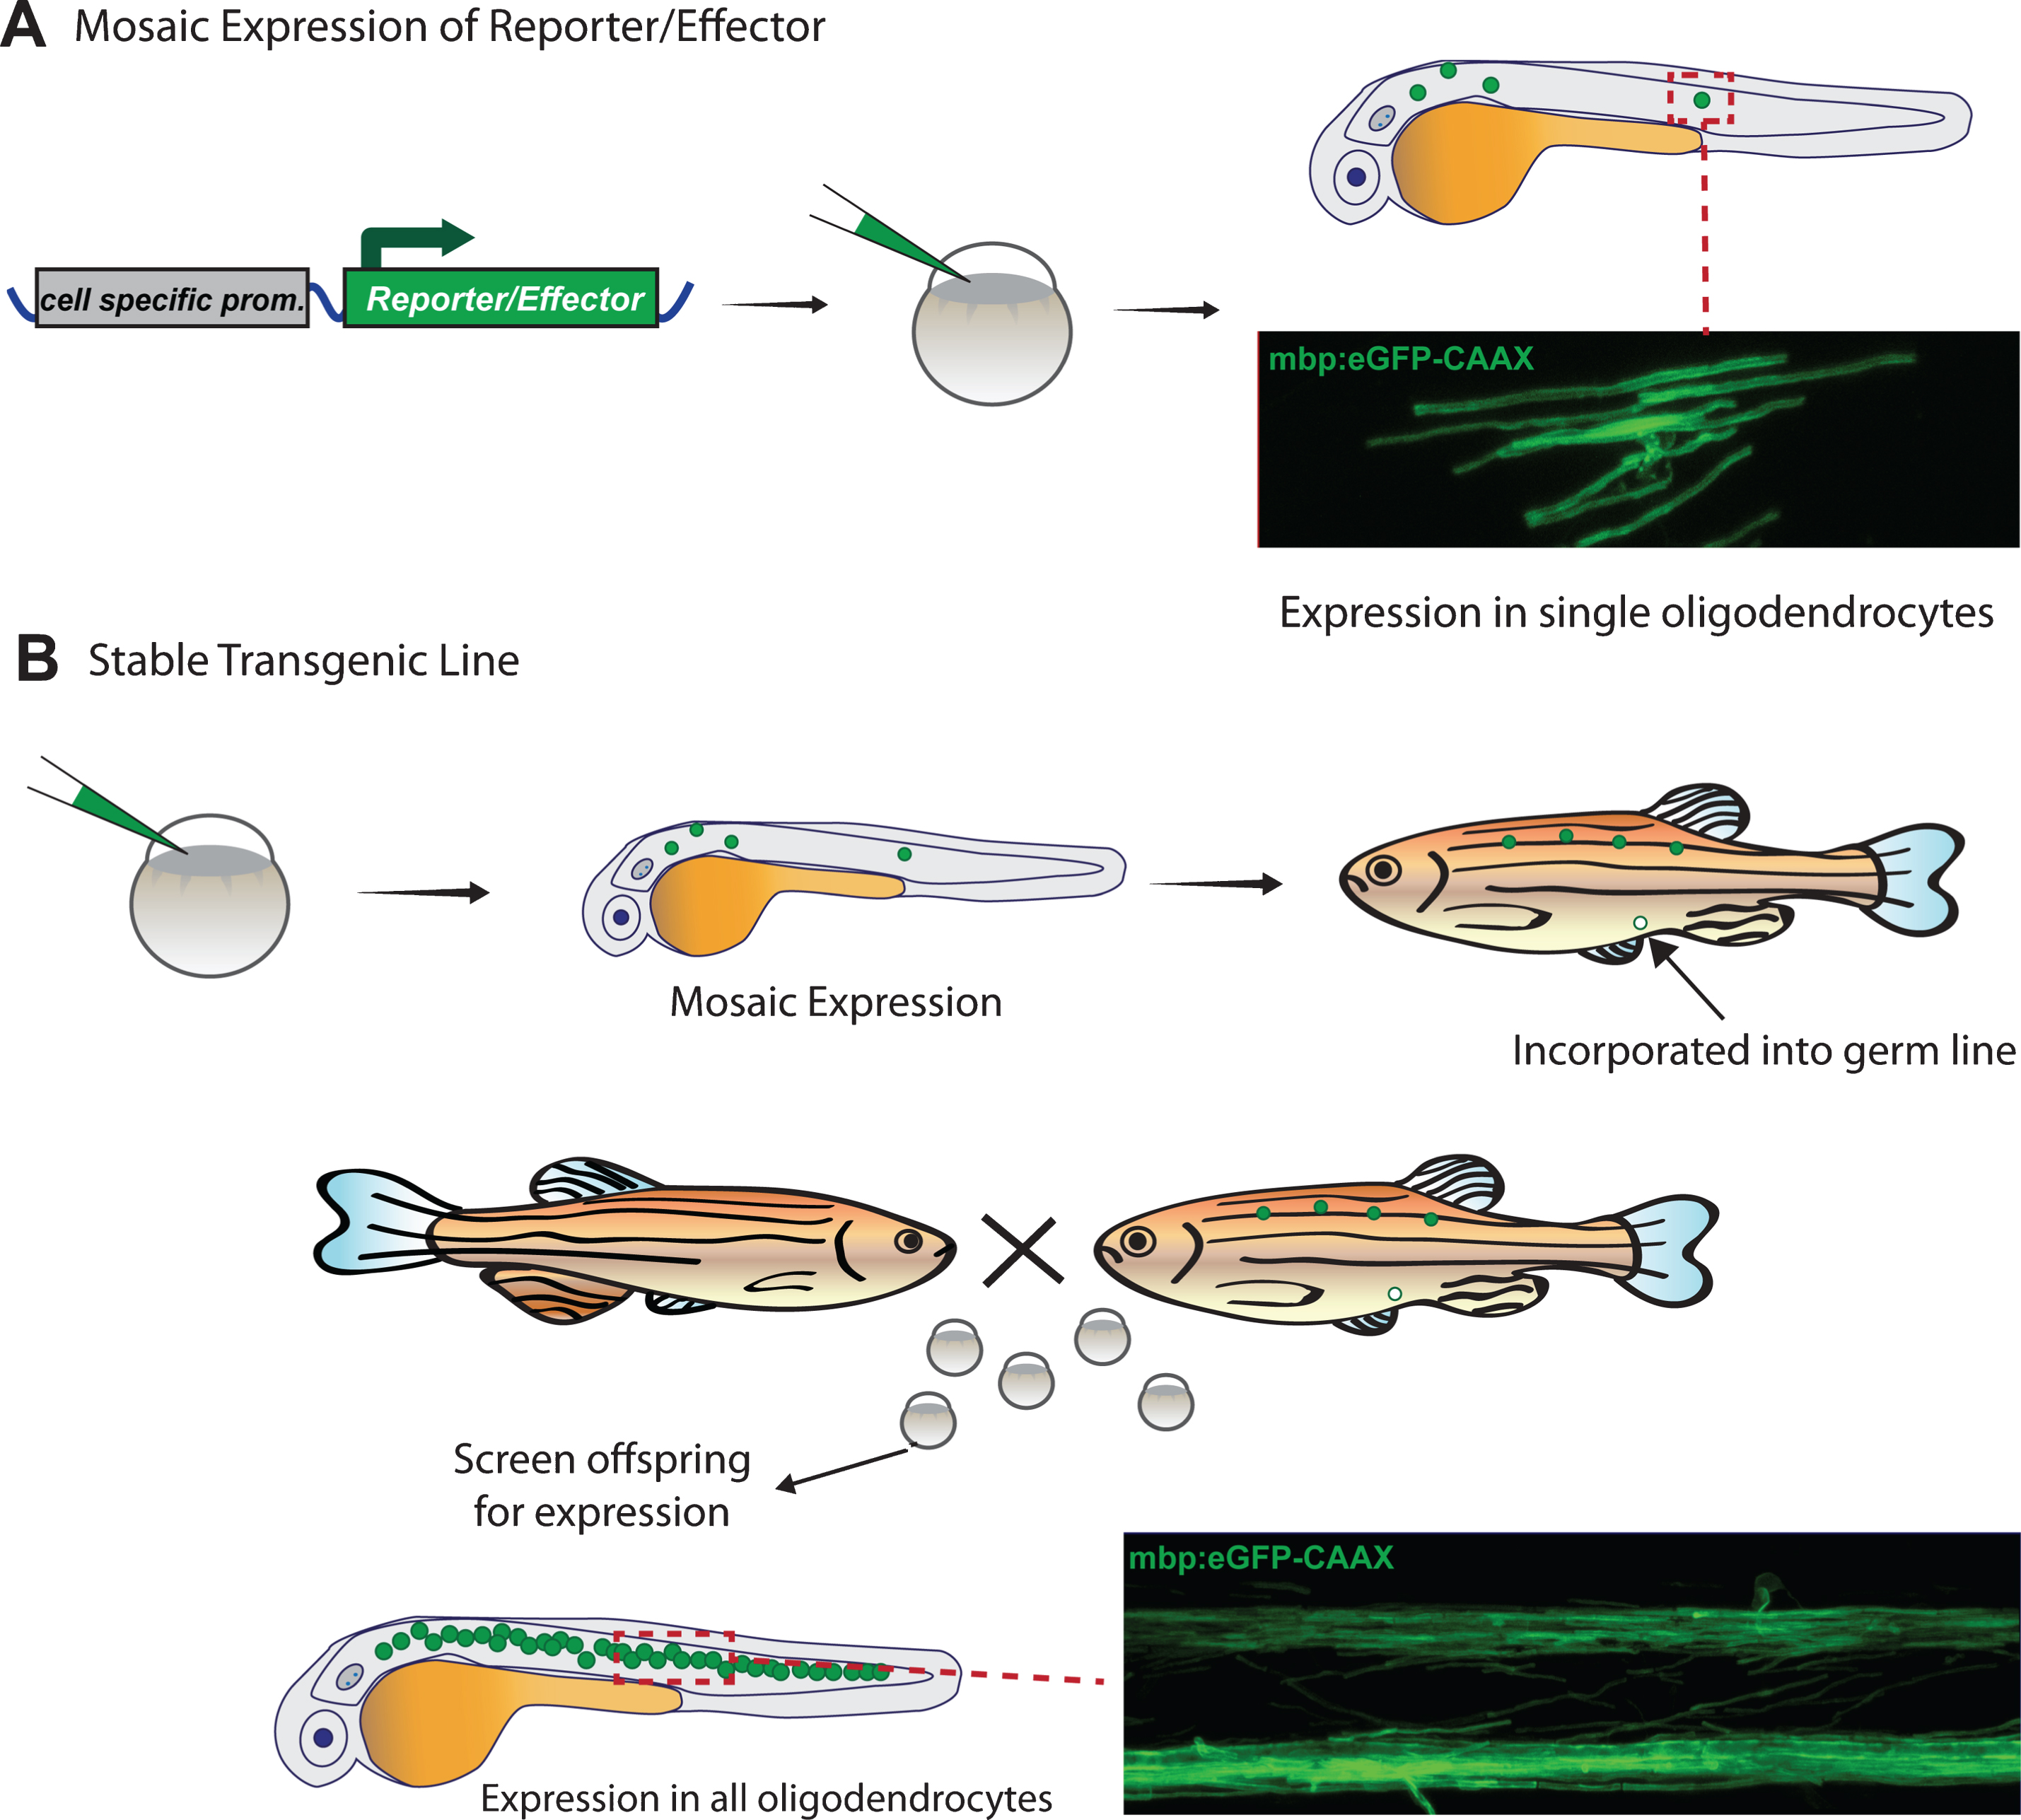
Fig.3
Example strategies to control gene expression in zebrafish and Xenopus. A) Plasmids that can drive expression of the transcriptional activator Gal4-VP16 can be co-injected into embryos together with plasmids that encode genes-of-interest downstream of Upstream Activator Sequences (UAS). Gal4 trans-activates UAS and can amplify gene expression. When injected in this way, it leads to mosaic gene expression. Stable transgenic lines expressing Gal4 in specific cell types or UAS effectors can be generated as in Fig. 1. B) The Gal4-UAS system can be modified to control expression of multiple genes from one plasmid. In the Janus system Gal4 trans-activates UAS, which drives gene expression in both directions, if minimal promoters are present upstream of the genes of interest. C) Alternative strategies exist to express two genes from one construct including the self-cleaving 2A peptide sequence, which can be placed between two open reading frames in one mRNA, which is then translated as two polypeptides due to ribosome skipping. D) Temporal control of gene expression can be mediated by the use of heat sensitive promoters, which are only active at specific temperatures.
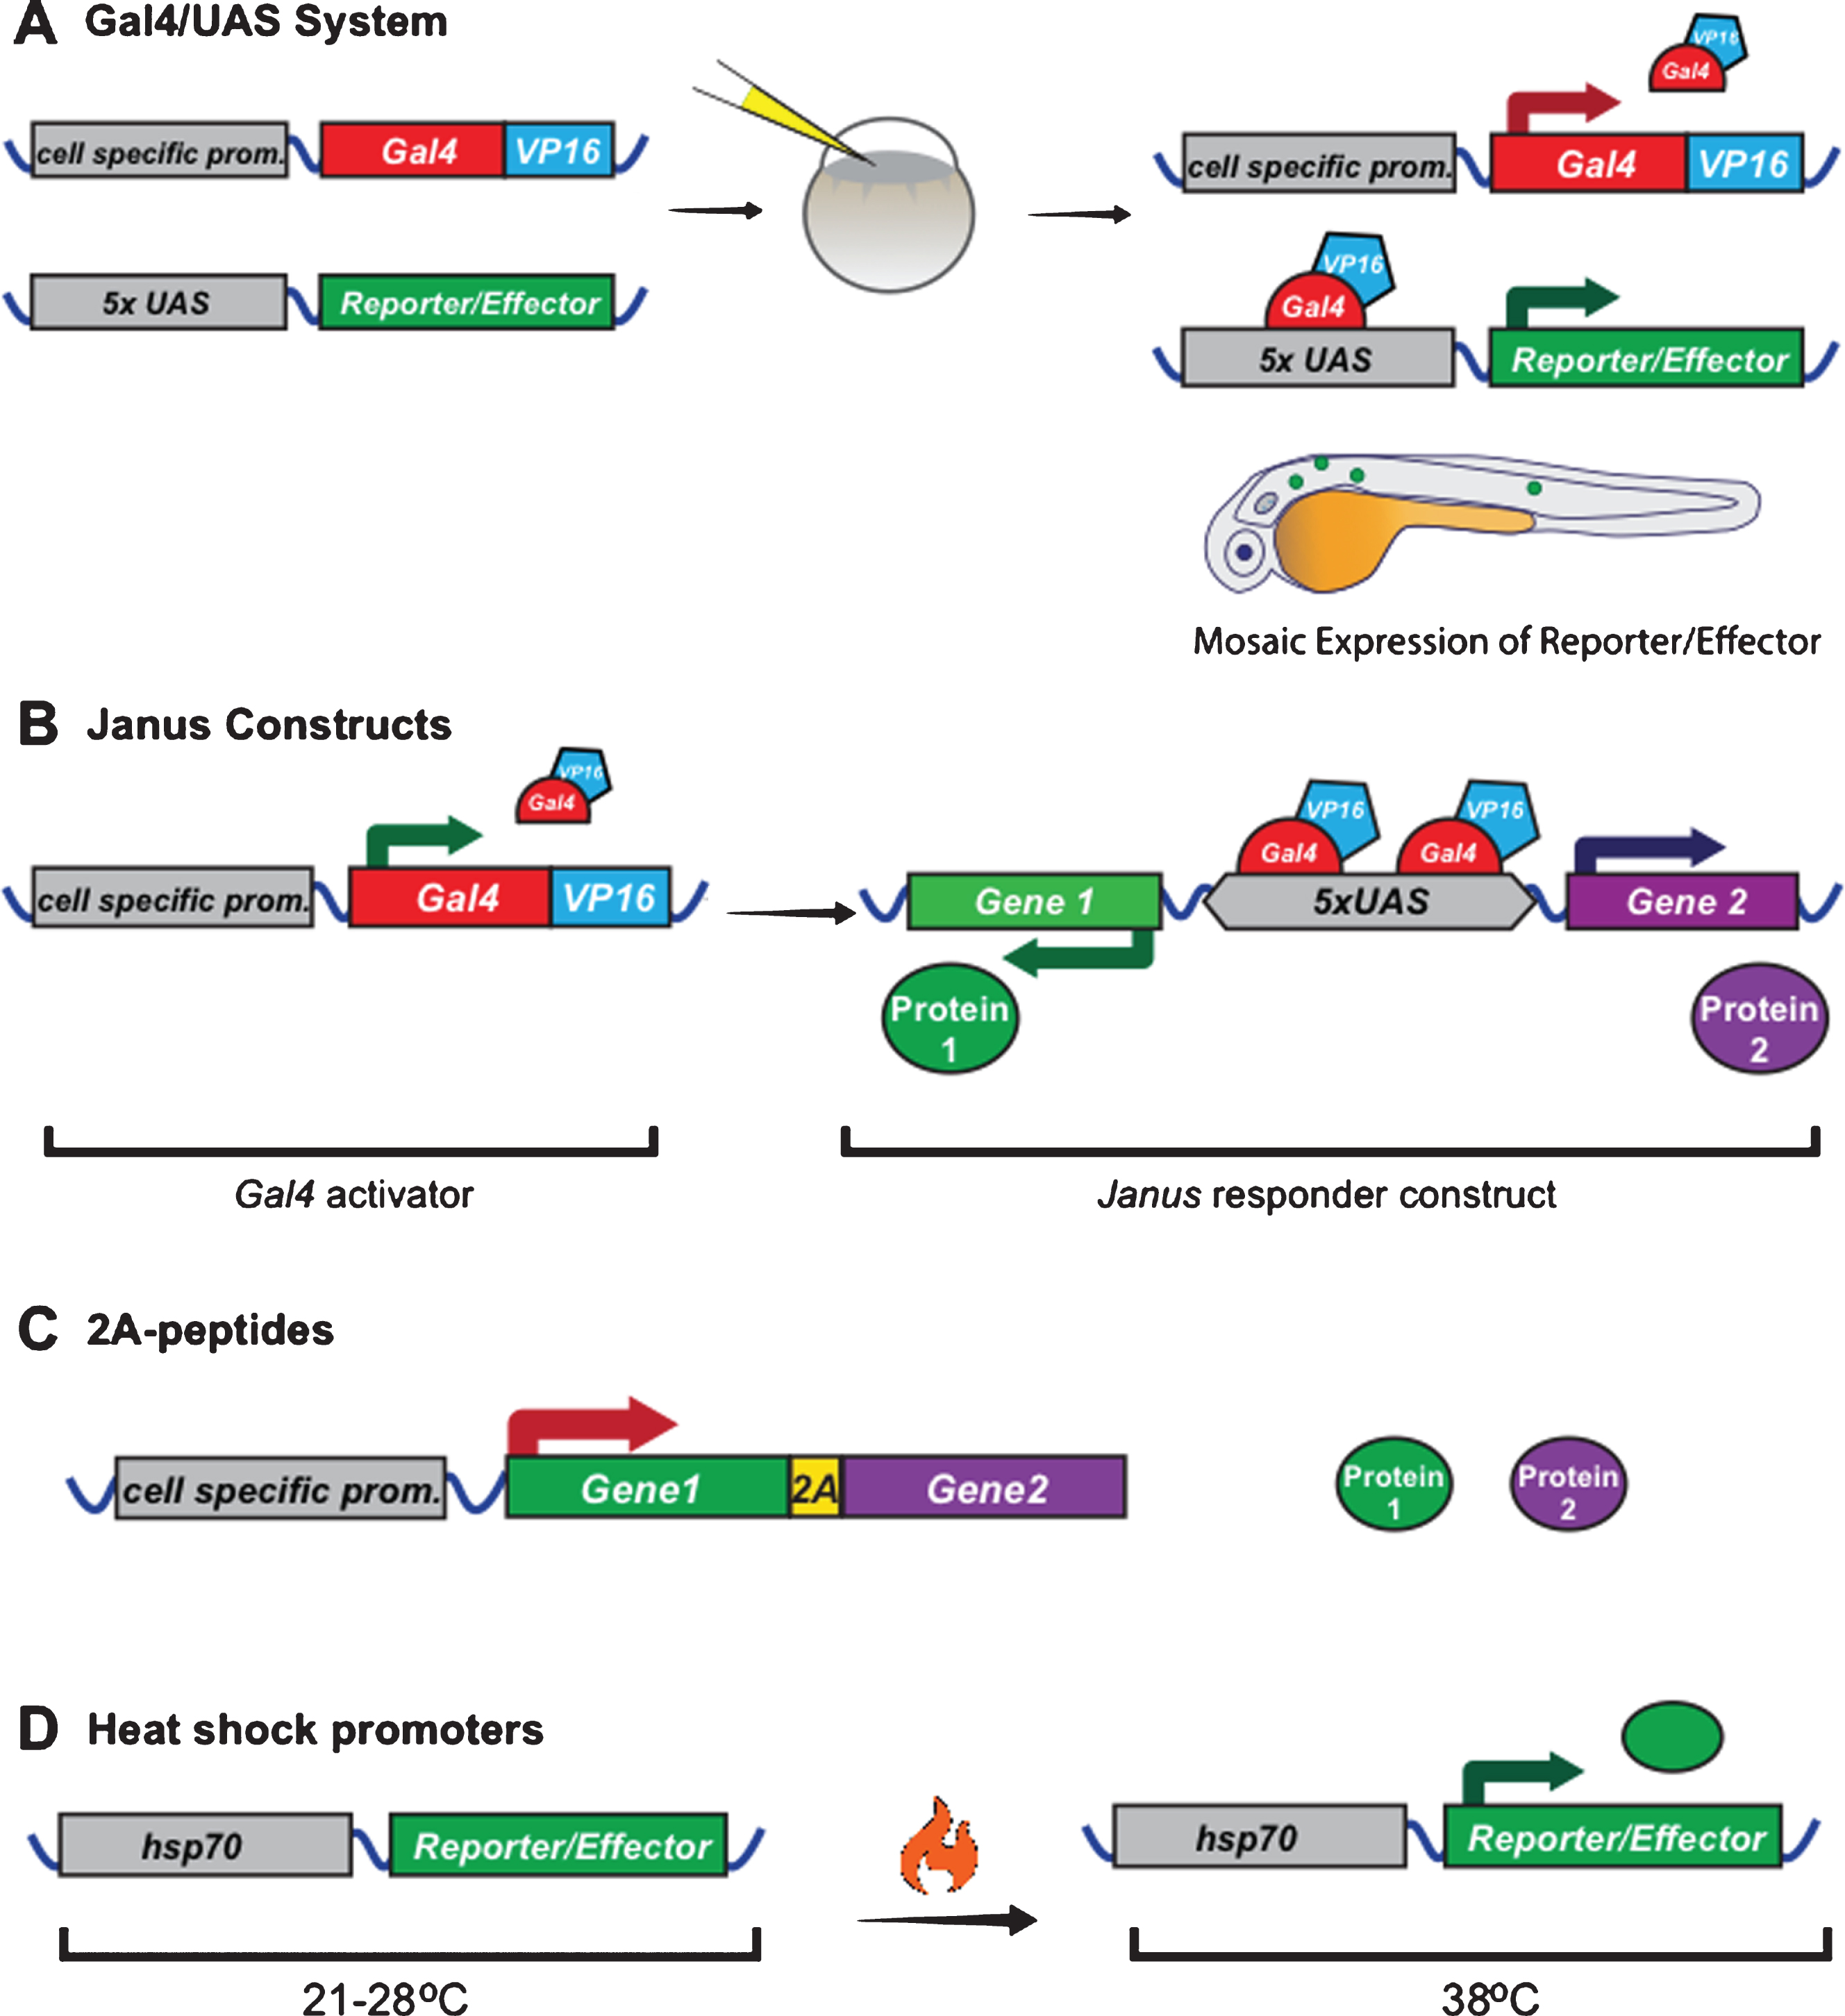
Fig.4
Time-lapse microscopy reveals dynamic behavior of oligodendrocytes. A and B show images from a time-lapse made on a spinning disk confocal microscope, using the stable zebrafish transgenic line Tg(nkx2.2a:meGFP) as a reporter, exemplifying the rapid dynamics of oligodendrocyte processes. Scale bars = 5 μm. A shows a cell in the process of initiating myelination. Arrowhead points to an elongated membrane rich process that may represent at nascent myelin sheath that remains stable for the frames shown, whereas the arrow points to a similar elaboration of membrane that is resorbed during the same short period. B shows an oligodendrocyte with a process (arrowhead) that acutely transitions in morphology from a profile indicative of a nascent myelin sheath (0’ and 8’) to that of an exploratory process (4’, 12’, 16’ and 20’).
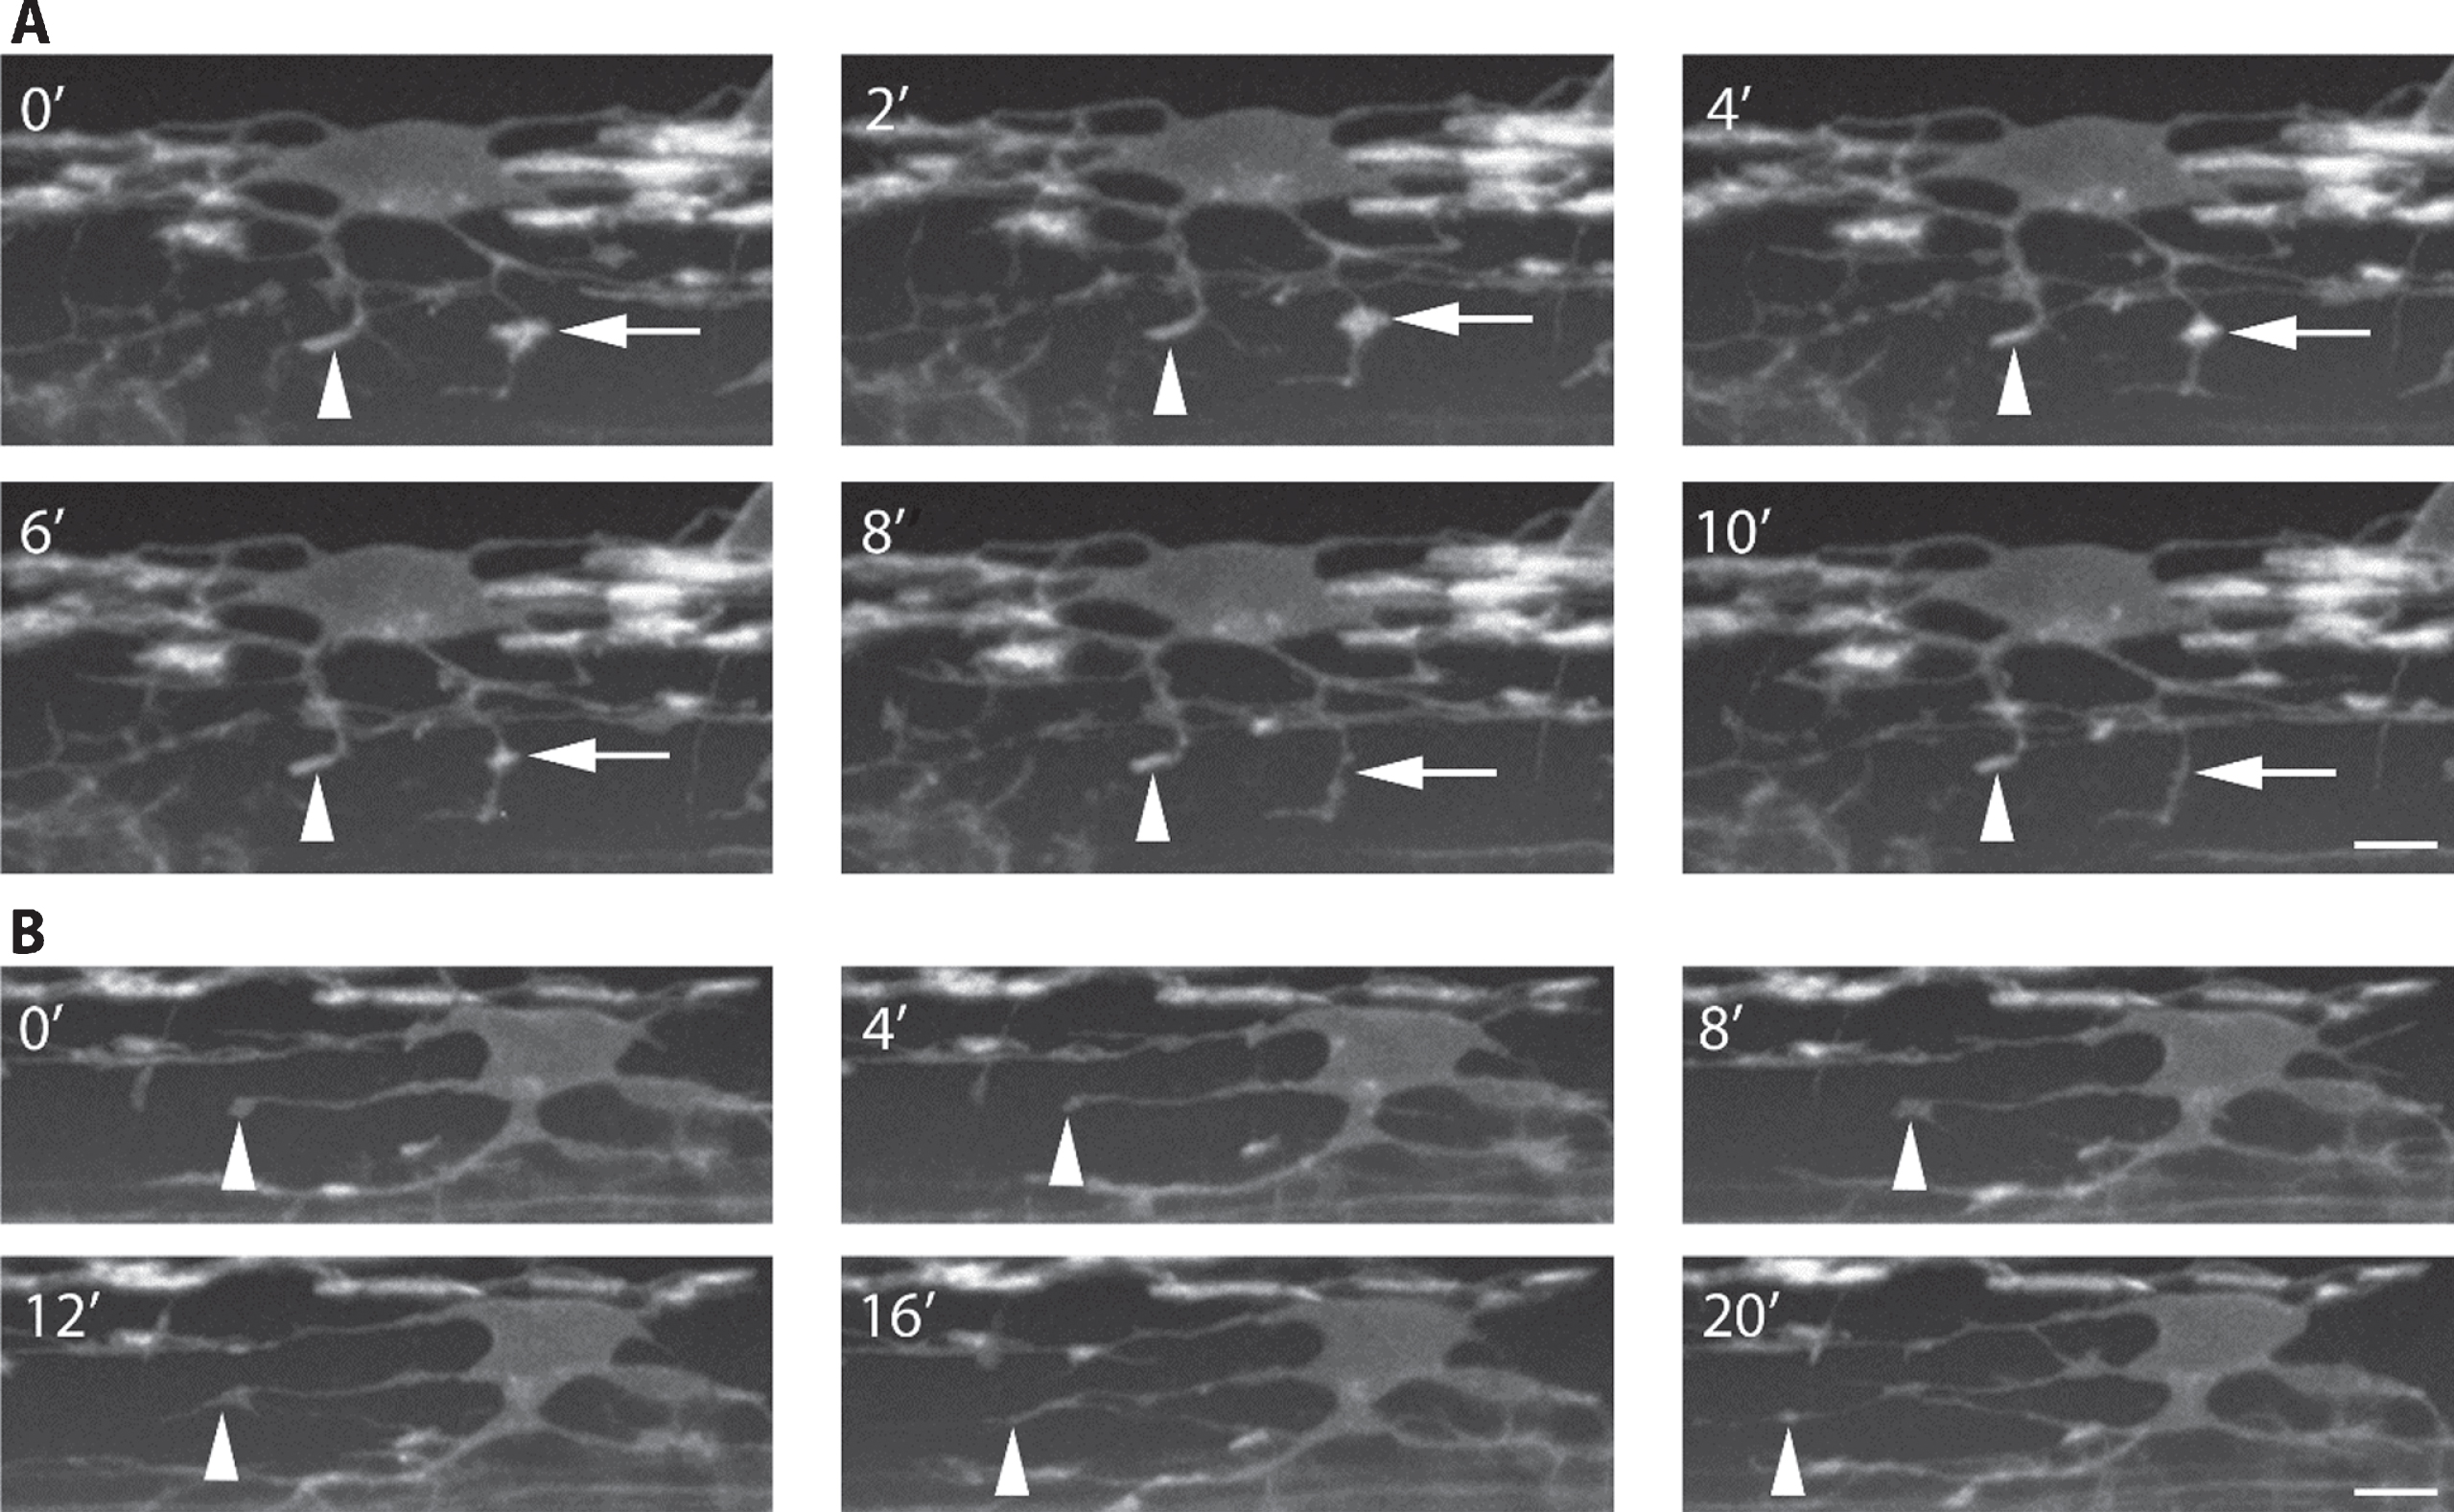
Fig.5
Confocal super-resolution imaging. A+B are images of the stable transgenic reporter mbp:eGFP-CAAX, which labels myelin sheaths, taken in confocal (A) and Airyscan (B) modes. A clear improvement in resolution in the X-Y plan is observed. C indicates improvement in z-axis resolution in Airyscan mode. The red line indicates the position where the Y-Z projections on the right were taken. Definitive circular rings of myelin membrane are observable in the Airyscan mode. Scale bars = 5 μm.
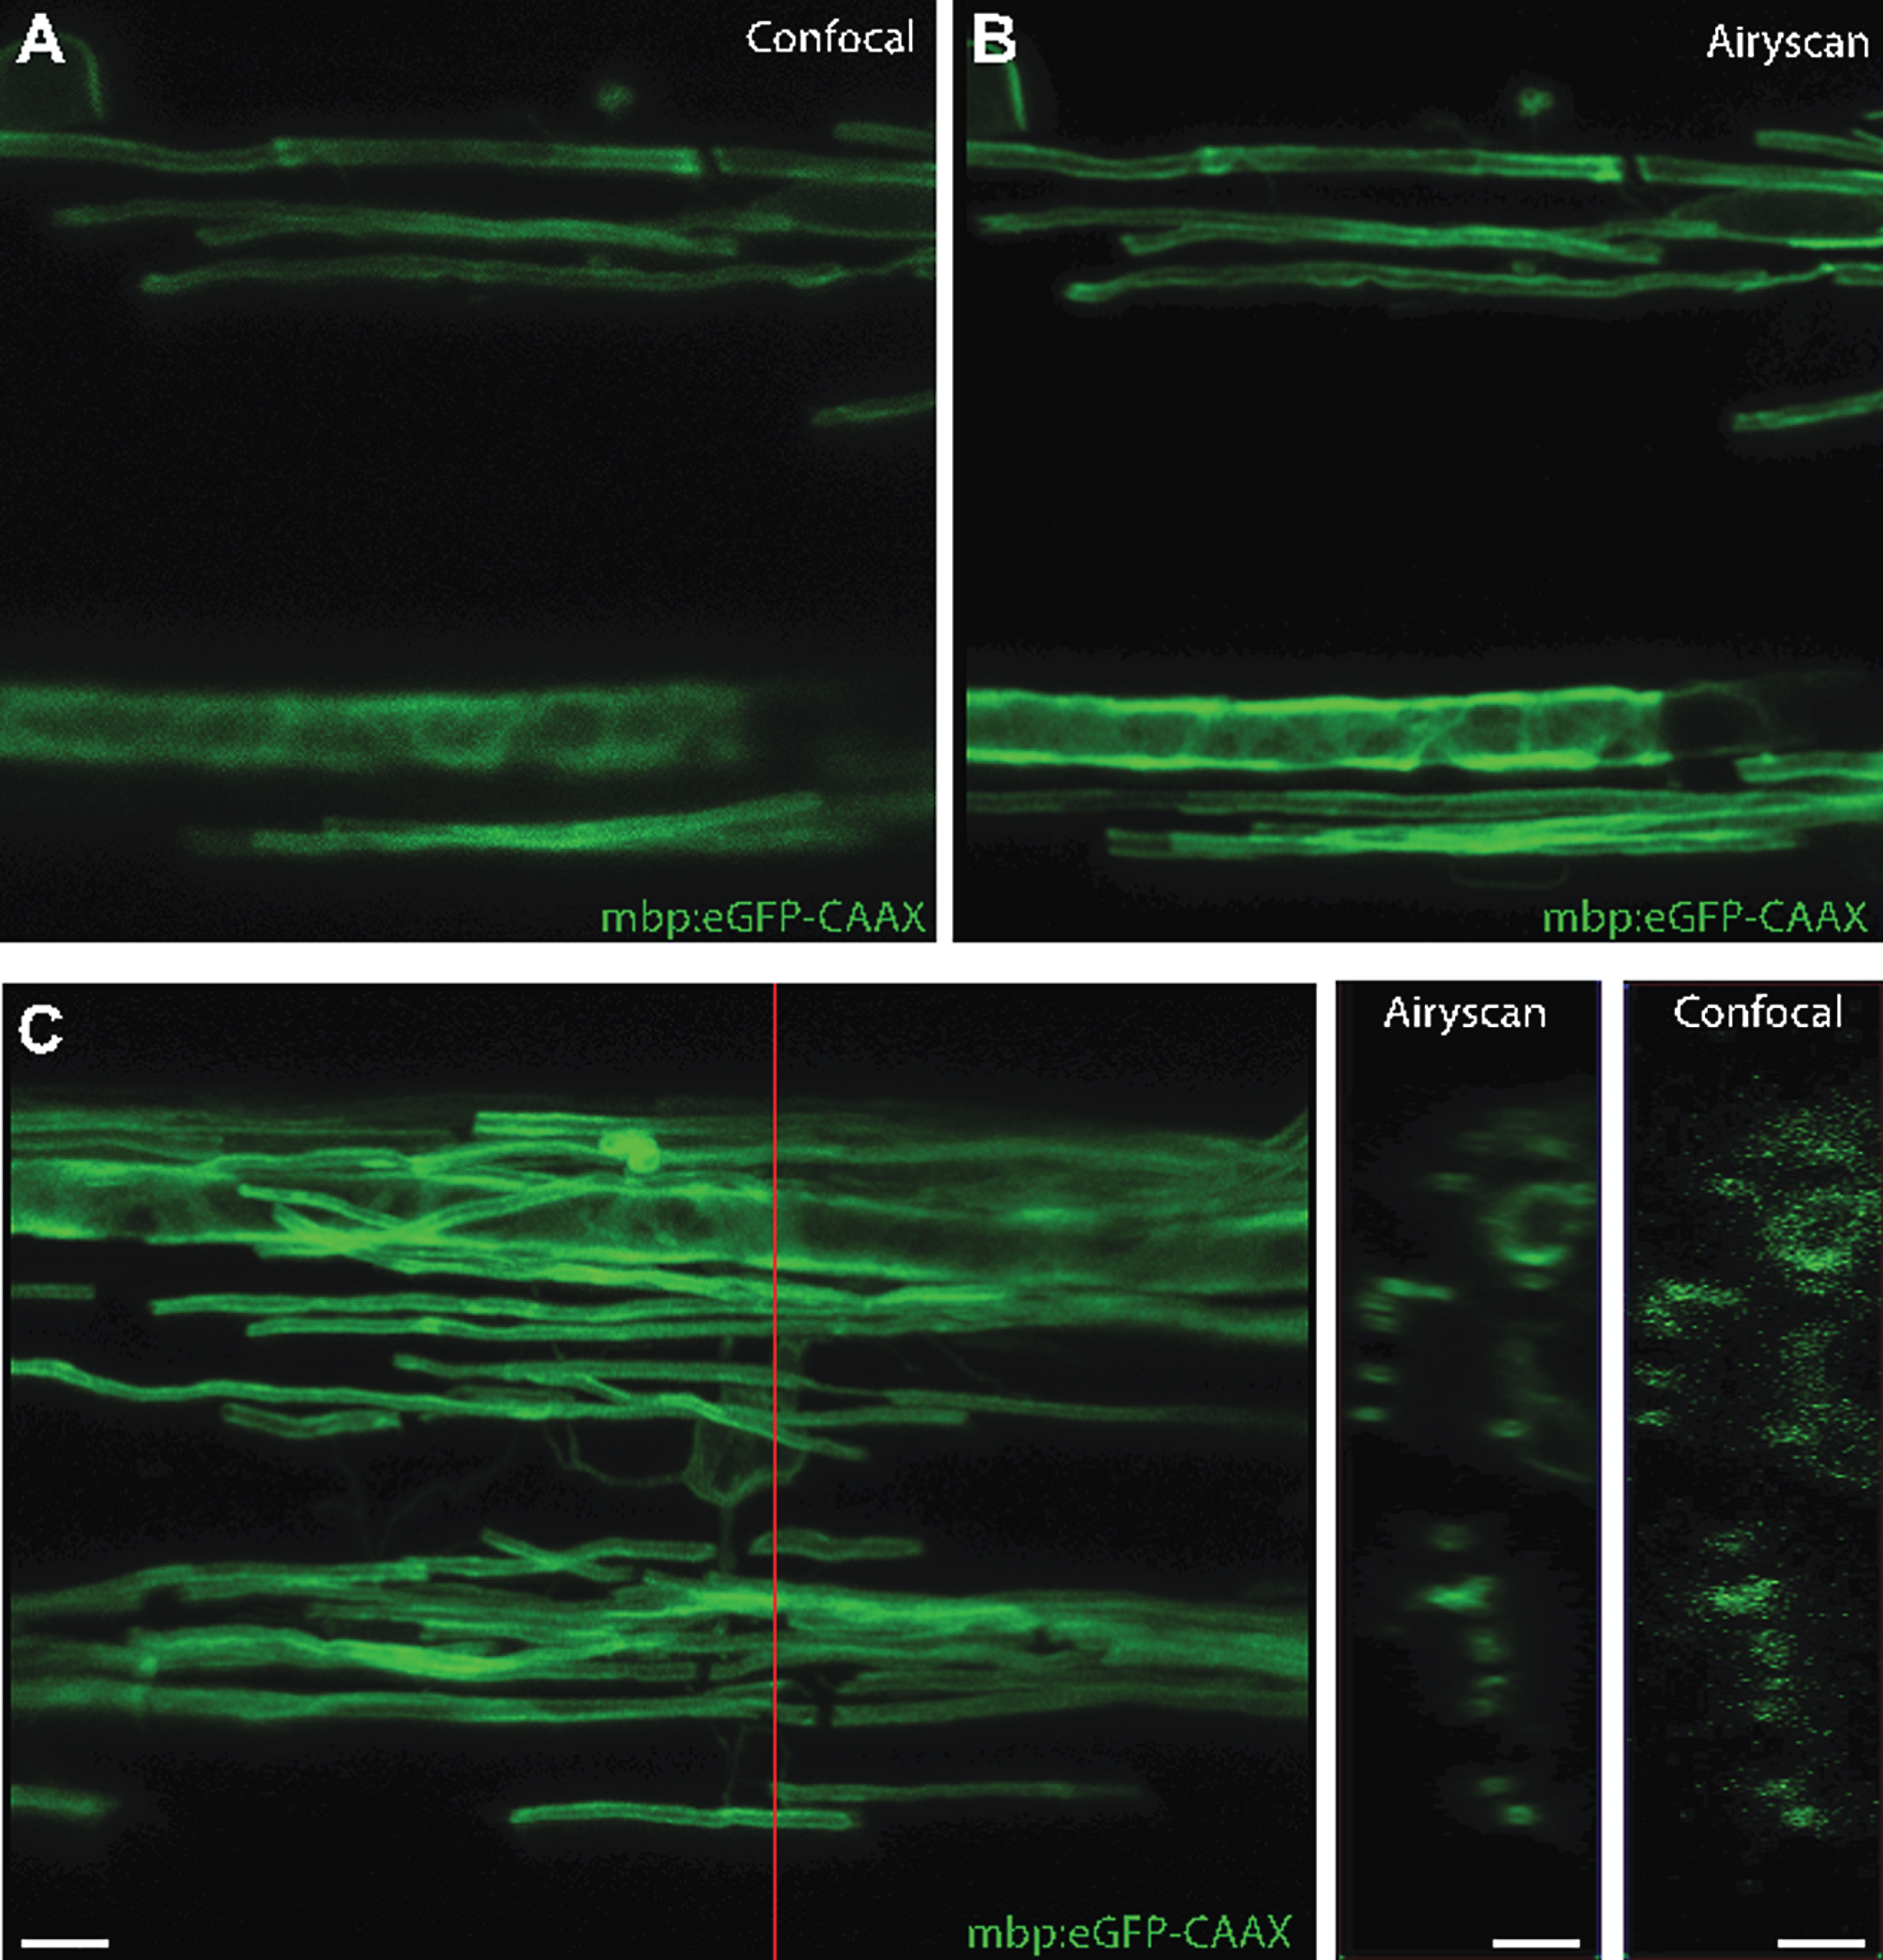
Fig.6
Transgenic tool to visualize myelin along individual axons in vivo. A fluorescent fusion of GFP with the GPI anchored axonal protein contactin1a can be expressed in individual neurons together with a fluorescent protein that labels the entire cell, e.g. Tandem dimer (Td) Tomato (A). Gaps in GFP-Cntn1a localisation along axons (A+B) correspond to the locations of myelin sheaths, as shown in (C) where all myelin is labelled using the sox10:mRFP reporter. Scale bars: A = 20 μm, B+C = 5 μm.
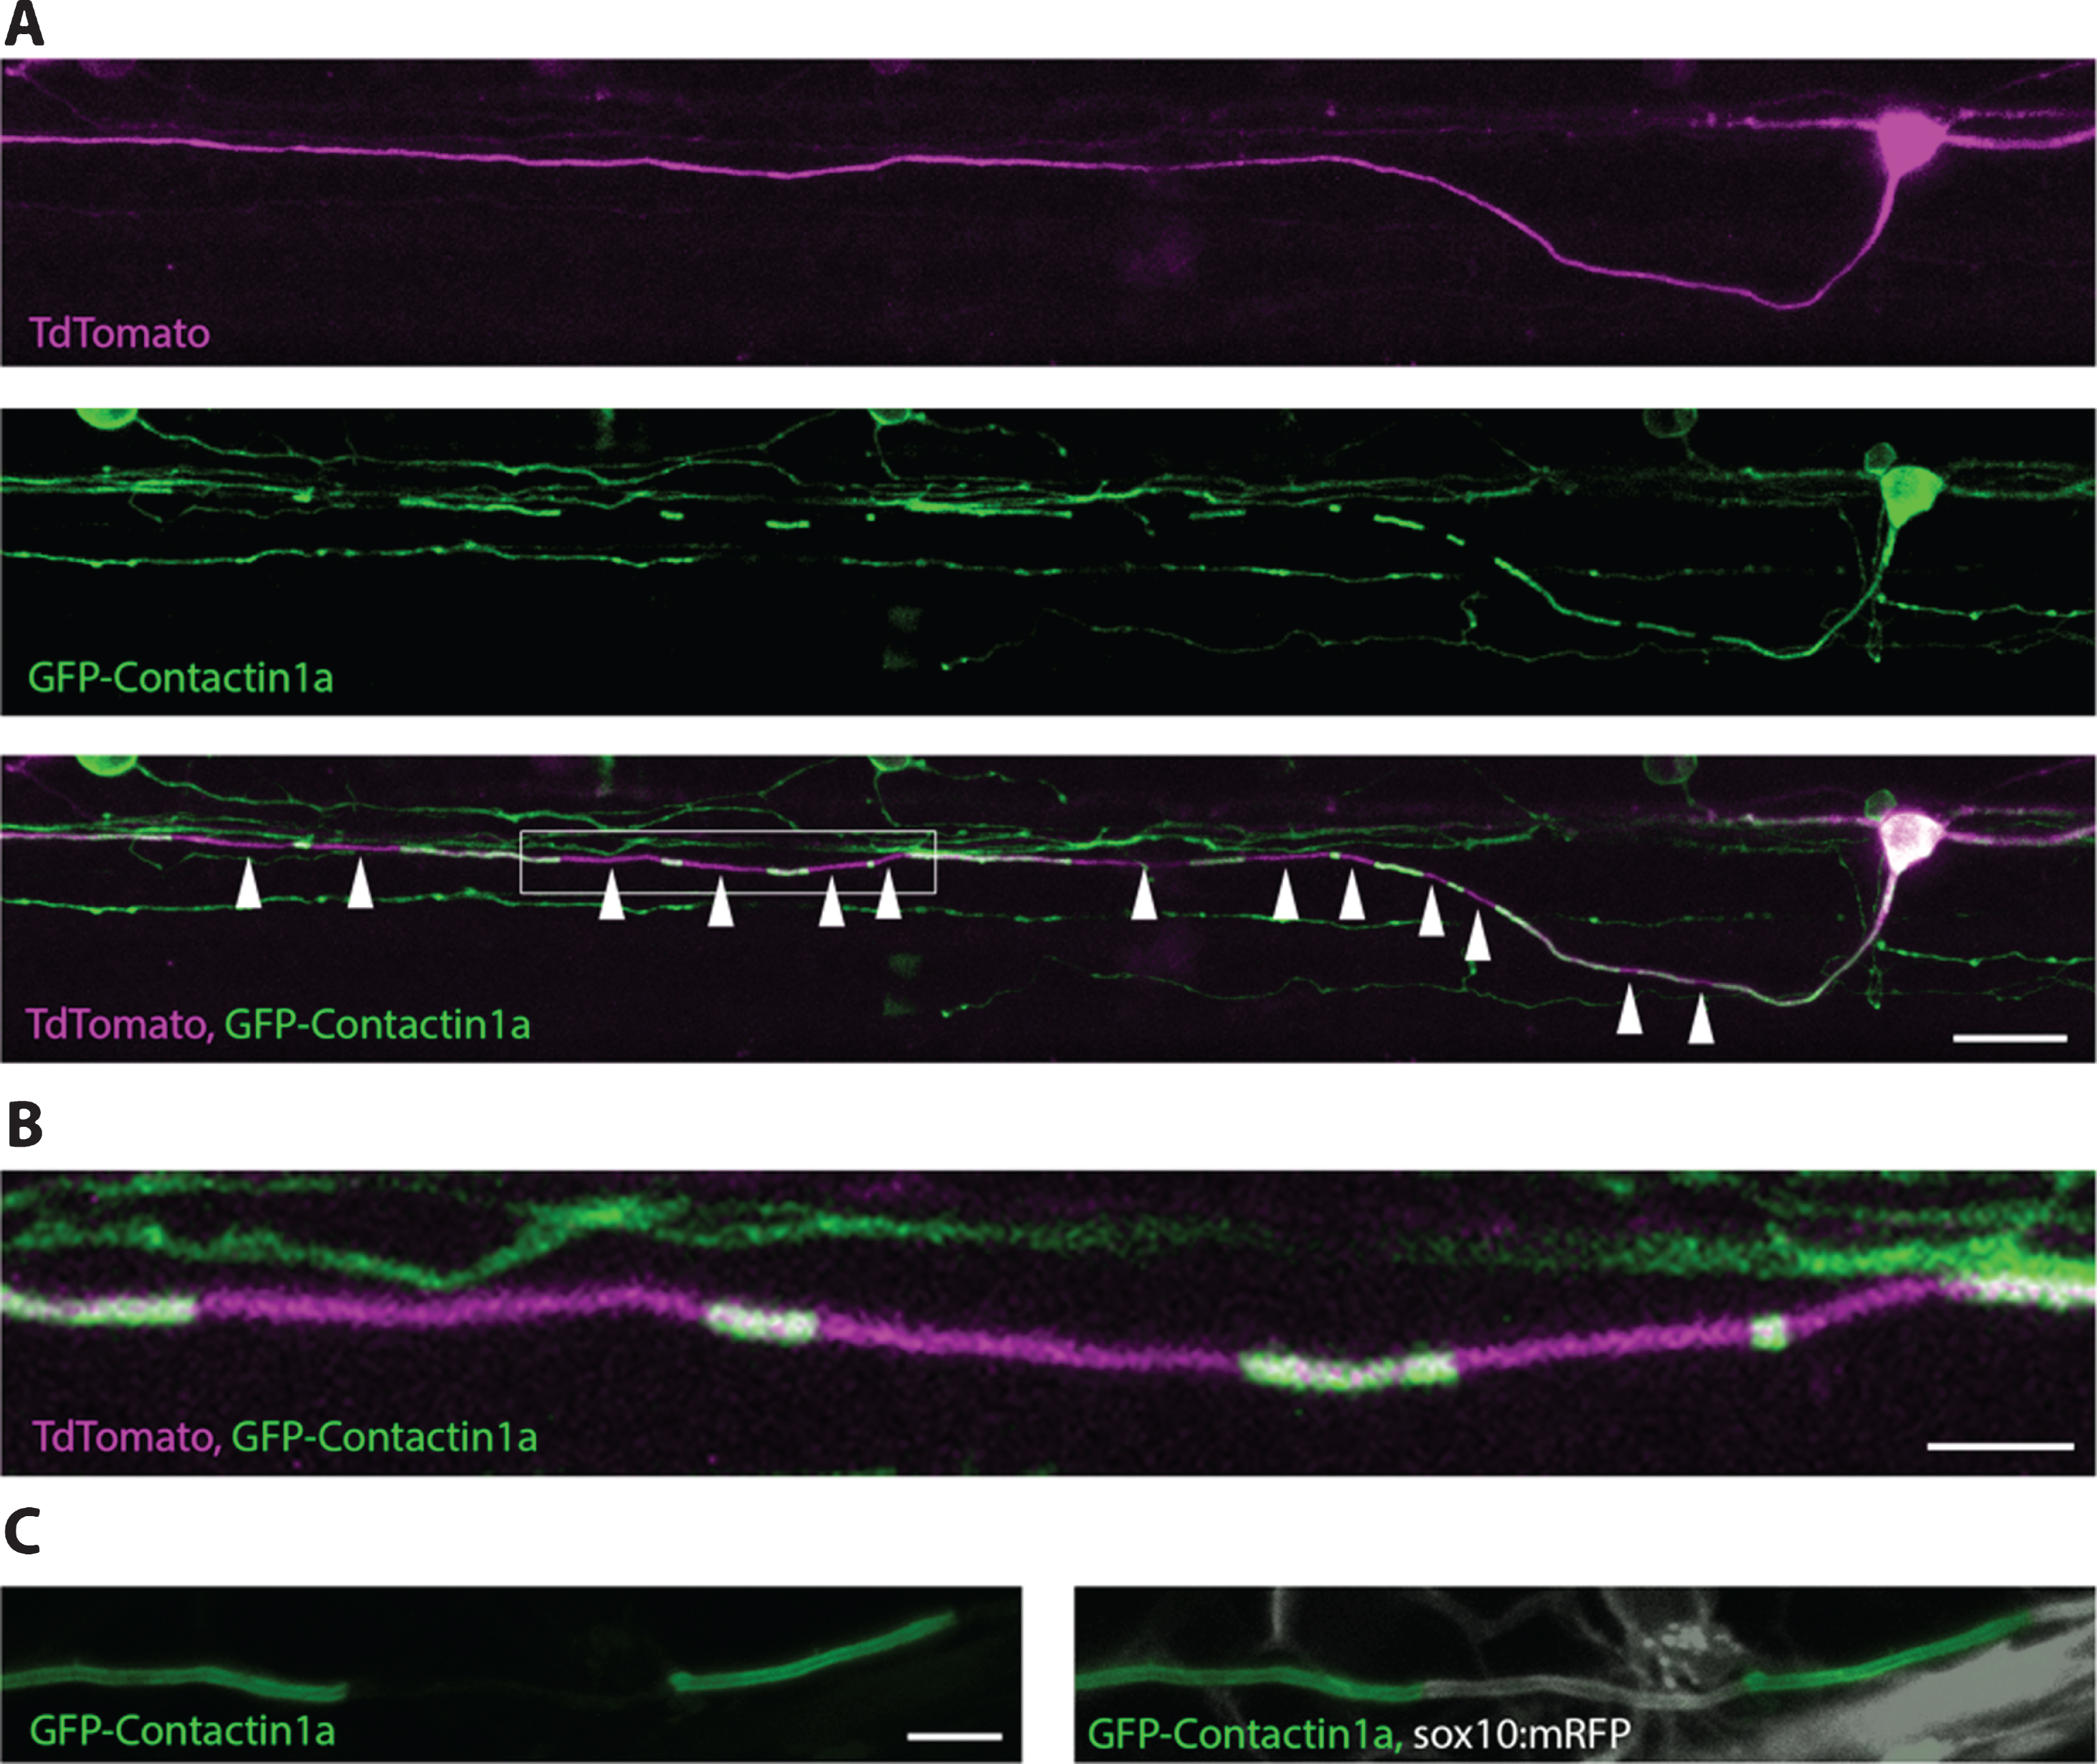
Table 1
List of transgenic zebrafish and Xenopus lines used to visualize myelinating cells and myelin in vivo
| Reporter | Labelled Cell Type | Original | Imaging | Cellular | Notes |
| Reference | Modality | Localization | |||
| of Reporter | |||||
| Zebrafish | |||||
| mbp:EGFP | OLs and SCs | [40] & [38] | Laser Scanning Confocal Microscope | Cytoplasmic | Two independent lines |
| mbp:EGFP-CAAX | OLs and SCs | [38] | Laser Scanning Confocal Microscope | Membrane | – |
| mpz:EGFP | OLs, some non-myelinating cell types | [203] | Laser Scanning Confocal Microscope | Cytoplasmic | – |
| nkx2.2a:mEGFP | Subset of OPCs and early myelinating OLs, some non-myelinating cell types | [204] | Laser Scanning Confocal Microscope | Membrane | BAC transgenic |
| olig1:mEGFP | OL lineage cells | [205] | Not defined | Membrane | – |
| olig2:EGFP | OL lineage cells, motor neurons | [76] | Laser Scanning Confocal Microscope | Cytoplasmic | BAC transgenic |
| olig2:dsRed2 | OL lineage cells, motor neurons | [206] | Spinning Disk Confocal Microscope | Cytoplasmic | BAC transgenic |
| olig2:Kaede | OL lineage cells, motor neurons | [207] | Spinning Disk Confocal Microscope | Cytoplasmic | BAC Transgenic |
| Photoconvertible | |||||
| plp1:EGFP | Ols, some non-myelinating cell types | [73] | Laser Scanning Confocal Microscope | Cytoplasmic | Mouse PLP promoter |
| sox10:mRFP | OL lineage cells, SCs, some interneurons, neural-crest cells | [37] | Spinning Disk Confocal Microscope | Membrane | – |
| sox10:EGFP | OL lineage cells, SCs, some interneurons, neural-crest cells | [208] | Not defined | Cytoplasmic | – |
| sox10:Eos* sox10:nls-Eos** | OL lineage cells, SCs, some interneurons, neural-crest cells | [209] | Spinning Disk confocal microscope | *Cytoplasmic **Nuclear | – |
| foxD3:GFP | SC precursors, SCs, some non-myelinating cell types | [210] | Laser Scanning Confocal Microscope | Cytoplasmic | – |
| MSE-EGFP | SCs, some non-myelinating cell types | [211] | Laser Scanning Confocal Microscope | Cytoplasmic | Enhancer sequence for the mouse krox20 gene. |
| Expression high during initiation of myelination and decreases with time. | |||||
| cldk:Gal4 | OLs and SCs | [43] | Laser Scanning Confocal Microscope | – | Gal4 activator line |
| sox10:KalTA4 | OL lineage cells, SCs, some interneurons, neural-crest cells | [91] | Laser Scanning Confocal Microscope | – | Optimized gal4 activator line |
| mbp:Gal4; UAS:NTR-mCherry | OLs and SCs | [54] | Not defined | Cytoplasmic | Gal4 driving expression of NTR-mCherry fusion protein. Induces cell death in presence of Mtz. |
| sox10:Gal4; UAS:NTR-mCherry | OL lineage cells, SCs, some interneurons, neural-crest cells | [54] | Not defined | Cytoplasmic | Gal4 driving expression of NTR-mCherry fusion protein. Induces cell death in presence of Mtz. |
| mbp:NTR-EGFP | OLs and SCs | (55) | Laser Scanning Confocal Microscope | Cytoplasmic | Direct regulation of NTR-EGFP expression using mbp promoter. Less mosaicism than Gal4-UAS. |
| Label-Free | Myelin | (170) | Third Harmonic Generation | – | – |
| Xenopus laevis | |||||
| mbp:EGFP-NTR | OLs | (45) | Two photon excitation microscopy | Cytoplasmic | Fusion protein, induces cell death upon exposure to Mtz. |
| Label Free | Myelin | (189) | Stimulated Raman Scattering | – | Visualized both healthy and degrading myelin. |
OL = Oligodendrocyte, OPC = Oligodendrocyte precursor cells, SC = Schwann cells, NTR = nitroreductase, MTZ = metronidazole.
Table 2
Overview of imaging modalities for in vivo live-imaging
| Brief Description | Pros | Cons | |
| Fluorescent Imaging Modalities | |||
| Point Scanning Confocal Microscopy | Pinhole used to eliminate out of focus light | •Widely available and user-friendly | •Slow speed of acquisition |
| •Good spatial resolution | •Phototoxicity and photobleaching due to repeated excitation of large out of focus regions | ||
| •Good spectral separation | |||
| •Versatile | |||
| Spinning Disk Confocal Microscopy | Multiple pinholes used to scan many points simultaneously | •High speed of imaging | •Lower spatial resolution than point scanning confocal, particularly z axis |
| •Lower phototoxicity and photobleaching than point scanning confocal, but still excites out of focus regions | •Less versatile than point scanning confocal | ||
| 2 Photon Excitation Microscopy | Two photon excitation used to excite a localized focal point | •Capable of deep tissue imaging | •Slow speed of acquisition |
| •Low phototoxicity and photobleaching due to only exciting the focal plane | •Typically lower resolution than confocal microscopy | ||
| Light Sheet Microscopy | Excitation objective projecting a thin sheet of light orientated orthogonally to the imaging objective | •High speed of imaging | •Lower spatial resolution, but quickly improving |
| •Low phototoxicity and photobleaching due to only exciting focal plane and reduced light input | •Limited ability to selectively activate regions of interest | ||
| Super-Resolution Imaging Modalities | |||
| Stimulation Emission Depletion (STED) | Secondary laser beam used to selective deactivate fluorescence around the edge of the excitation beam | •Resolution beyond the diffraction limit of light | •Phototoxicity and photobleaching from high laser excitation |
| •Can be combined with imaging modalities capable of imaging deep in tissue | •Slow speed | ||
| Structure Illumination Microscopy | Grid pattern superimposed on sample to generate an interference pattern exploited by software to generate a higher resolution image | •Resolution beyond the diffraction limit of light | •Slow speed, due to need to image with multiple grid patterns |
| •Can image depths comparable to confocal | •Resolution increase not as significant as STED | ||
| Airyscan Microscopy | Imaging array incorporating 32 pinholes set to 0.2 Airy units in size, combined with post-hoc image deconvolution | •Resolution beyond the diffraction limit of light | •Very large datasets (each pixel imaged 32X) |
| •Uses lower laser intensities than confocal microscopy | •Resolution increase not as significant as STED | ||
| Label-Free Imaging Modalities | |||
| Coherent Anti-Stokes Raman Scattering | Generates signals based on the characteristic vibration frequencies of chemical bonds | •Little to no phototoxicity | •Currently needs expert engineers to implement |
| •Deep tissue imaging ( 1 mm) | |||
| •Capable of quantitative measures, including g-ratio, lipid levels, and lipid ordering | |||
| •Can be combined with conventional light microscopy | |||
| Third Harmonic Generation | Non-linear, three photon based technique that detects changes in the refractive index of tissue | •Little to no phototoxicity | •Currently needs expert engineers to implement |
| •Can be combined with conventional light microscopy | •Not amenable for imaging deep in tissue (up to 50 μm) | ||
| Deep Optical Coherence Microscopy | High-numerical aperture infrared optical coherence microscope used to collect light backscattered due to refractive index variations in the sample | •Little to no phototoxicity | •Currently needs expert engineers to implement |
| •Can be combined with conventional light microscopy | |||
| Spectral Confocal Reflectance Microscopy | Generates images by merging simultaneously reflected signals from multiple lasers of different wavelengths | •Uses conventional confocal microscope (no extra set-up required) | •Limited application |
| •Needs validation | |||

