
Predicting Recurrence and Progression in Patients with Non-Muscle-Invasive Bladder Cancer: Systematic Review on the Performance of Risk Stratification Models
Abstract
BACKGROUND:
Several classifications have been reported to stratify non-muscle-invasive bladder cancer (NMIBC) in risk groups according to the probability of recurrence and progression.
OBJECTIVE:
To systematically review the current evidence regarding risk stratification of NMIBC.
METHODS:
The systematic review was performed in accordance with the PRISMA statement. Studies providing data on development and/or external validation cohorts of models and risk stratification tables for recurrence and/or progression for patients with NMIBC, reporting at least one discrimination measure (AUC or C-Index) were included.
RESULTS:
Twenty-five studies involving 22,737 patients were included. Six classifications were identified, three of them were predictive models (EORTC, CUETO, EAU 2021) and three were based on expert opinion (EAU 2020, AUA, NCCN). A high risk of bias was present in the majority of the studies. Certain heterogenicity was found among the studies regarding adjuvant therapy, postoperative instillation or second resection. The definition of oncological outcomes was not standardized in the included studies. CUETO and EORTC scoring systems are the most validated. In general, validations showed a poor discrimination capability to predict recurrence, slightly better for progression. The EAU 2021 model overestimates the risk of progression in patients treated with BCG. Carcinoma in situ is underrepresented in all the studies analyzed.
CONCLUSIONS:
The existing classifications show poor discrimination capability for recurrence and possibly helpful discrimination capability for progression in NMIBC patients. These results highlight the unmet need to develop novel accurate risk models for patients with NMIBC, which could be improved with the combination of clinicopathological and molecular information.
INTRODUCTION
Non-muscle-invasive bladder cancer (NMIBC) accounts for approximately 75% of all newly diagnosed bladder cancers [1]. Despite the treatment based on transurethral resection of the bladder tumor (TURBT) and intravesical therapy, patients with NMIBC exhibit significant heterogeneity in outcomes, showing recurrence and progression rates as high as 50–70% and 10–40%, respectively [1]. These data highlight the need for continuous and expensive surveillance, positioning bladder carcinoma as the most expensive neoplasm per patient.
As is well known, intravesical therapy is important for the oncological control of NMIBC due to the improvement that is achieved in the recurrence and progression rates [1]. In this regard, there is evidence showing the superiority of bacillus Calmette-Guérin (BCG) immunotherapy over chemotherapy for this purpose [2]. Nevertheless, there are some concerns: BCG immunotherapy has non-negligible toxicity; therefore, a proportion of patients withdraw from the treatment early [3]. In addition, in the current era of BCG shortage, demand for BCG exceeds its production capacity, which makes its availability difficult; thus, BCG should be reserved for patients who have a higher risk of recurrence and progression [4].
For risk-adapted management of patients with NMIBC and to provide recommendations on adjuvant treatment and surveillance, different international urological organizations, such as the European Organization for Research and Treatment of Cancer (EORTC) [5], Club Urológico Español de Tratamiento Oncológico (CUETO) [6], the European Association of Urology (EAU) [1], the American Urological Association (AUA) [7], and the National Comprehensive Cancer Network (NCCN) [8], have provided different evidence-based predictive models or expert opinion risk stratification. However, in studies performed for the construction of predictive models, the patients did not receive a single postoperative intravesical dose of chemotherapy, second transurethral resection (TURBT) was not performed, the BCG maintenance schedule differed from the current recommendation, and the World Health Organization (WHO) 2004/2016 grading classification system was not used. All of these preclude a potential lead-time bias and limit use of the aforementioned predictive models and risk stratifications in current clinical practice.
In this context, it is uncertain which of these tools is better for the purpose of risk stratification of NMIBC. Therefore, the present study aims to systematically review the literature on the state of the art of risk stratification of patients with NMIBC.
MATERIALS AND METHODS
A systematic review was performed in accordance with the Preferred Reporting Items for Systematic Reviews and Meta-Analyses statement (PRISMA) [9]. The PICO (Population, Intervention, Comparator, Outcome) approach was used to summarize our research strategy (Table 1). The search was performed using the databases PubMed/Medline and Embase.
Table 1
PICO (Population, Intervention, Comparator, Outcome) approach
| Clinical question: How should NMIBC be stratified in 2022? |
| Population: (1) Human, (2) adults, (3) patients with NMIBC |
| Intervention: Risk stratification using risk models |
| Comparison: EORTC risk tables vs CUETO risk tables vs AUA groups vs EAU groups (until 2020 and 2021 versions) vs NCCN groups |
| Outcomes: Risk of recurrence and progression in patients with NMIBC based on existing scoring models |
| Types of study: All available clinical, prospective, and retrospective comparative and non-comparative observational studies |
| Databases searched: PubMed, Embase |
| Keywords: CUETO and non-muscle-invasive bladder cancer or bladder neoplasm, EORTC and non-muscle-invasive bladder cancer or bladder neoplasm, CUETO risk tables and non-muscle-invasive bladder cancer or bladder neoplasm, EORTC risk tables and non-muscle-invasive bladder cancer or bladder neoplasm, CUETO score and non-muscle-invasive bladder cancer or bladder neoplasm, EORTC score and non-muscle-invasive bladder cancer or bladder neoplasm, EAU risk groups and non-muscle-invasive bladder cancer or bladder neoplasm, AUA risk groups and non-muscle-invasive bladder cancer or bladder neoplasm, EAU score and non-muscle-invasive bladder cancer or bladder neoplasm, Nomogram and non-muscle-invasive bladder cancer or bladder neoplasm, Scoring models and non-muscle-invasive bladder cancer or bladder neoplasm |
| Manual search: Page-by-page examination in peer-reviewed journals |
| Eligibility criteria: (1) development and/or external validation cohorts of models that assessed more than one clinicopathological factor for recurrence and/or progression for patients with NMIBC, (2) external validation for expert opinion risk stratification tables, and (3) reporting of at least one discrimination measure for the risk model [area under the curve (AUC) and/or c-index]. |
| Exclusion criteria: (1) Studies including molecular signatures for NMIBC, (2) studies including biomarkers to improve the predictive performance of existing models |
| Risk of bias assessment: PROBAST tool |
A combination of the following keywords was used: EORTC, CUETO, EAU, non-muscle-invasive bladder cancer, progression, recurrence, survival, risk stratification, scoring system, scoring model, risk tables, risk calculator. Boolean operators (AND, OR) were used to refine the search (Supplementary Material).The search included articles published between January 2000 and January 2022 and was limited to English language studies. The automatic search was complemented by a manual search to identify relevant articles for the page-by-page examination of the last 10 years’ issues of the following journals: European Urology, European Urology Focus, European Urology Oncology, The Journal of Urology, World Journal of Urology, British Journal of Urology International, Urologic Oncology: Seminars and Original Investigations, and Urology.
Inclusion criteria and study eligibility
Three reviewers (FGR, JDS, and ORF) screened all abstracts and full-text articles independently. Disagreement was resolved by a discussion between them. Articles that fulfilled the following criteria were included for the evidence synthesis: (1) development and/or external validation cohorts of models that assessed more than one clinicopathological factor for recurrence and/or progression for patients with NMIBC, (2) external validation for expert opinion risk stratification tables, and (3) reporting of at least one discrimination measure for the risk model [area under the curve (AUC) and/or c-index]. We excluded studies with molecular features because they did not include clinicopathological variables or did not report any discrimination measure for the model. Case reports, editorials, letters, review articles, and meeting abstracts were not eligible and thus were also excluded during the systematic review process.
Data extraction
The data were extracted by three reviewers independently (FGR, JDS, and ORF), who consensually established as extractable data: (1) authors, year of publication, country, study design, sample size, number of institutions, name of the model assessed, (2) clinicopathological and NMIBC management data of the cohort included in the risk model, (3) absolute recurrence and/or progression of the cohort, (4) probability of recurrence and/or progression of the cohort according to the risk group strata for the model assessed, and (5) discrimination measure (AUC and/or c-index) for each outcome assessed (recurrence and/or progression) in the model. We used a predefined form for data extraction and any disagreements were resolved by discussion and consensus.
Quality assessment
The quality of the included studies was analyzed independently by three reviewers (FGR, JDS, and ORF) using the prediction model risk of bias assessment tool (PROBAST) [10]. We assessed the reporting quality of predictive modeling studies using the Transparent Reporting of a multivariable prediction model for Individual Prognosis Or Diagnosis (TRIPOD) statement [11].
Data analysis
A narrative synthesis of the included studies was performed. Frequencies and percentages were used to report categorical variables. Continuous data were described using mean and standard deviation, or, alternatively, median and range/interquartile range. Crude rates and the probability of recurrence and progression of each cohort when patients were stratified using risk groups for each proposed model at available time points were presented.
In the case of overlapping data assessing two or more risk models in different manuscripts using the same cohort of patients, we selected the one with the largest sample size for evidence synthesis.
RESULTS
Evidence synthesis
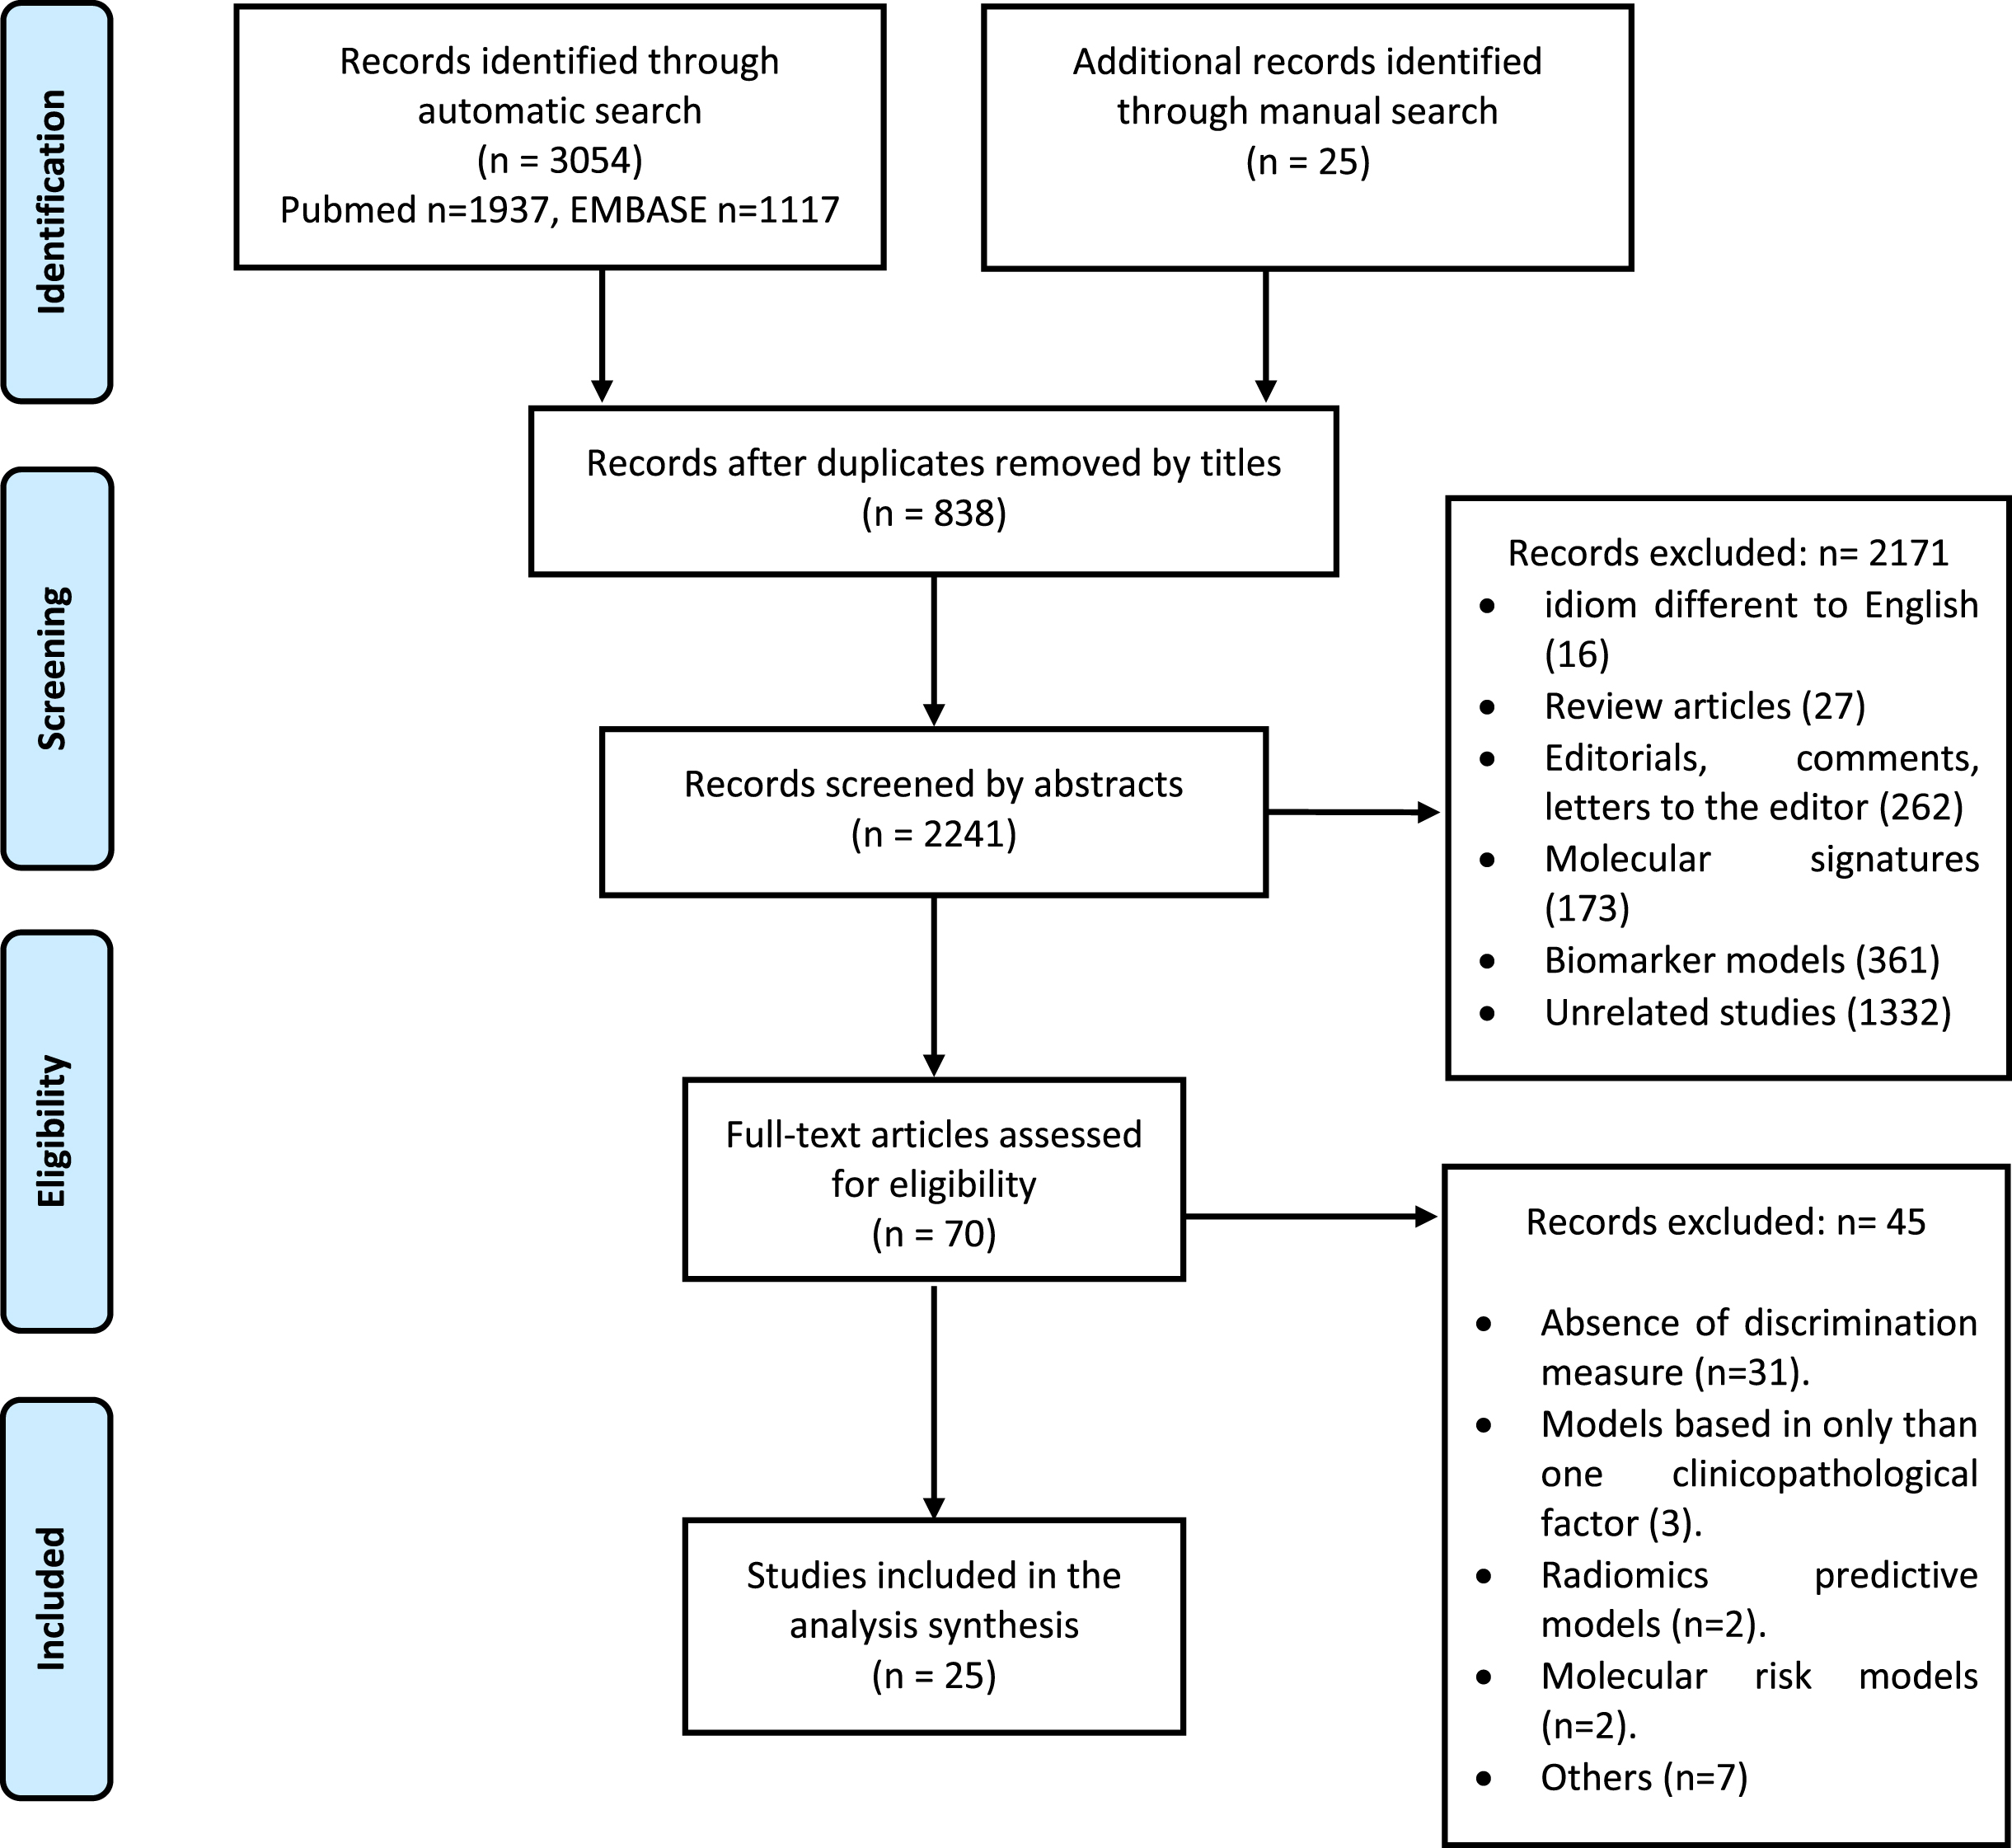
Figure 1 shows the flow diagram of the studies. A total of 3,079 references were found through the literature search strategy (3,054 automatic search and 25 manual search), of which 838 were duplicates; the remaining 2,241 were screened by title and abstract. Of these, 2,206 were excluded and 70 were selected for full-text screening. Finally, 25 studies were considered eligible for inclusion [5, 6, 12–34].
Fig. 1
Quality assessment
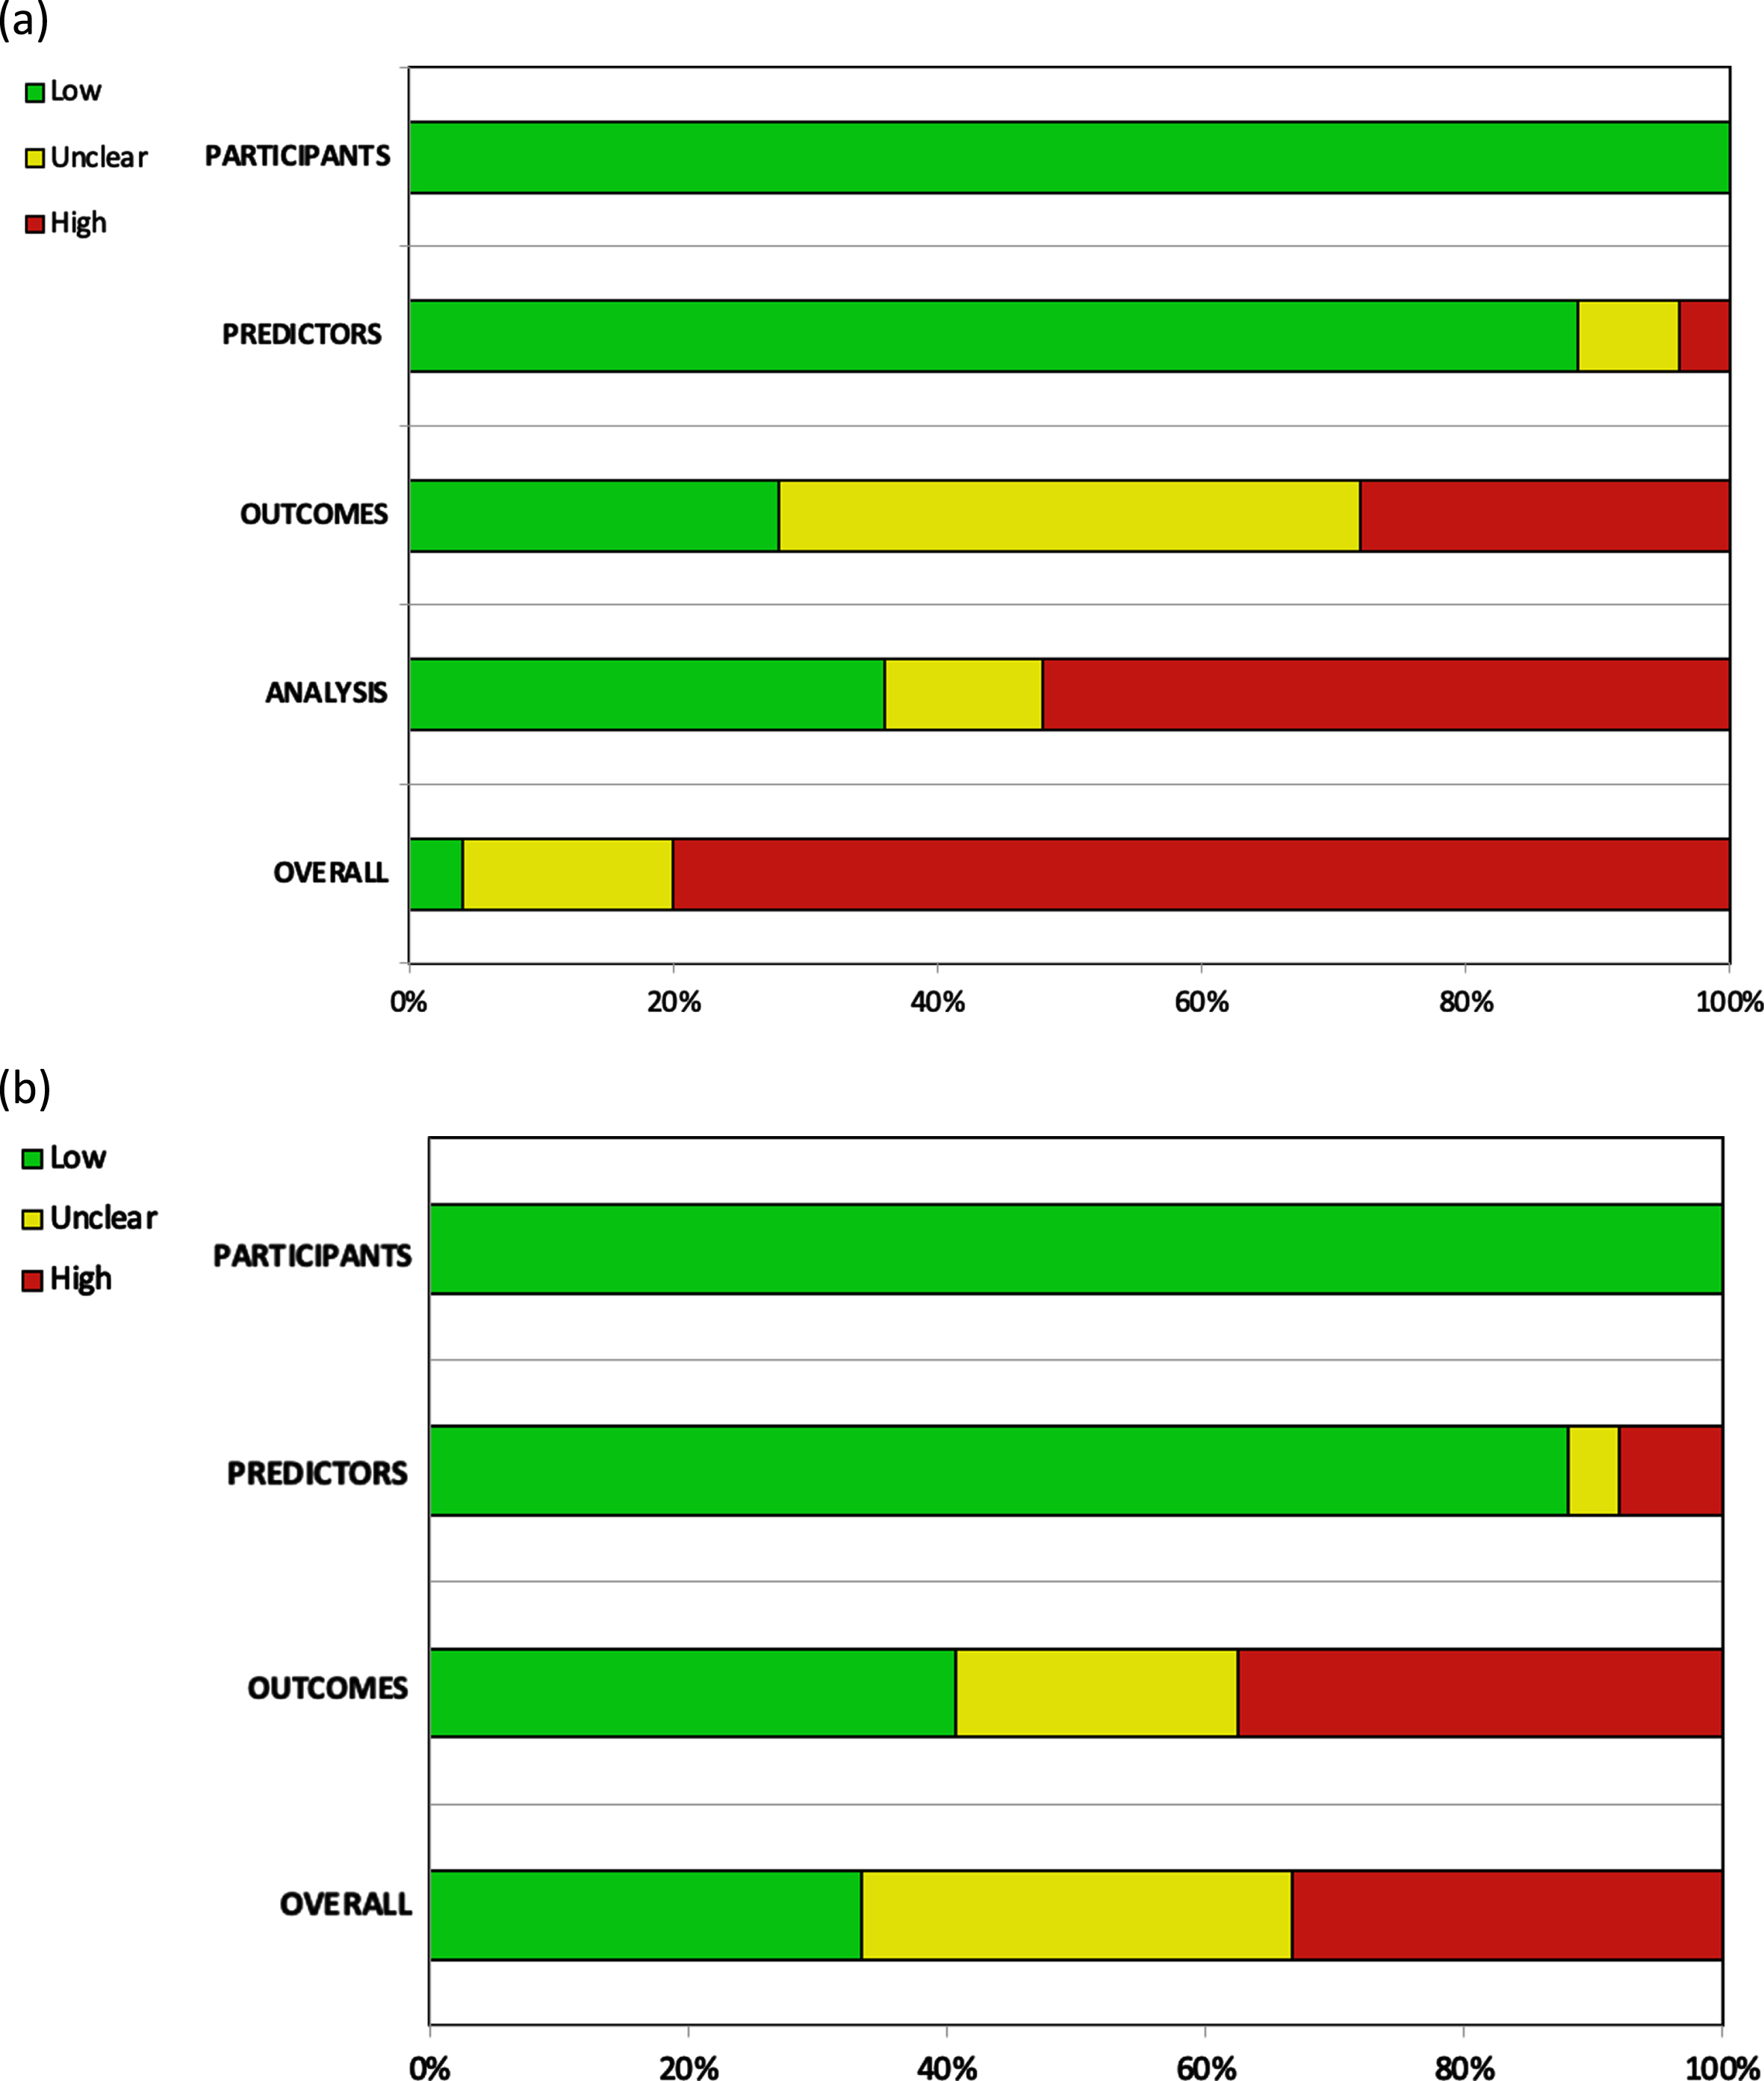
Twenty of the 25 included studies were judged to be at high risk of bias (RoB) [5, 12–34], and only one article was judged to be at low RoB [6]. Overall high RoB was mainly caused by high RoB in the analysis domain (13/25 studies) [12–14, 17–19, 24, 26–28, 31, 32, 34], followed by a high (7/25 studies) [14, 15, 20, 22, 24, 29, 33] and unclear (11/25 studies) [5, 12, 16, 17, 23, 26–28, 30–32] RoB in the outcomes domain. The other two domains contributed little to the overall high RoB (Fig. 2).
Fig. 2
Assessment of the (a) risk of bias and (b) applicability according to PROBAST.
Patient and study characteristics
Study characteristics are summarized in Table 2. The 25 studies comprised a total of 22,737 patients. The geographical distribution was: 14 European studies [5, 6, 15–17, 19–21, 23, 26, 30, 31, 33, 34], 5 American studies [24, 25, 27–29], 4 Asian studies [14, 18, 22, 32], and 2 Brazilian studies [3, 12]. All analyses were retrospective. In the construction cohorts of the EORTC [5] and CUETO models [6], prospectively collected data from various clinical trials were used. Eleven studies were multi-institutional. Three studies consisted of prediction model development without external validation [5, 6, 30] and 22 studies were external validations of existing models [12–29, 31–34].
Table 2
Summary of baseline characteristics of the studies included in the systematic review
| Author /year | Study design | Enrollment period | No. of institutions | Country | No. of patients | Follow-up (median; months) | Study type according to TRIPODS | Type of prognostic model | Evaluated prediction model |
| Sylvester, 2006 | Retrospective | 1979–1989 | Multi-institutional | Netherlands and Belgium | 2,596 | 46.8 | 1ba | Prediction model development | EORTC |
| Fernández-Gómez 2009 | Retrospective | 1990–1999 | Multi-institutional | Spain | 69 | 1ba | Prediction model development | CUETO | |
| Pillai, 2011 | Retrospective | 1983–1985 | Single institution | UK | 109 | 60 | 4 | External validation | EORTC |
| Fernández-Gómez 2011 | Retrospective | 1990–1999 | Multi-institutional | Spain | 1,062 | 69 | 4 | External validation | EORTC |
| Hernández 2011 | Retrospective | 1998–2008 | Single institution | Spain | 417 | 59 | 3 | External validation | EORTC |
| Xylinas, 2013 | Retrospective | 2000–2007 | Multi-institutional | France, USA, Germany, Italy, Sweden, Canada, Austria | 4,689 | 57 | 4 | External validation | EORTC, CUETO |
| Xu, 2013 | Retrospective | 2003–2010 | Single institution | China | 363 | 36 | 4 | External validation | EORTC, CUETO |
| Vedder, 2014 | Retrospective | 1979–2012 | Multi-institutional | Denmark, Netherlands, Spain | 1,892 | 120 | 4 | External validation | EORTC, CUETO |
| Choi 2014 | Retrospective | 1985–2011 | Single institution | Korea | 531 | 58 | 4 | External validation | EORTC, CUETO |
| Almeida 2016 | Retrospective | 2003–2010 | Single institution | Brazil | 63.6 | 4 | External validation | EORTC | |
| Busato 2016 | Retrospective | 2003–2010 | Single institution | Brazil | 205 | 63.6 | 4 | External validation | EORTC |
| Kilinç 2017 | Retrospective | 2002–2010 | Single institution | Turkey | 348 | 55.25 | 3 | External validation | EORTC |
| Ravvaz, 2017 | Retrospective | 2006–2016 | Multi-institutional | USA | 1,333 | 37 | 4 | External validation | EORTC, CUETO, NCCN |
| Dalkilic 2018 | Retrospective | 2007–2016 | Single institution | Turkey | 400 | 60.6 | 4 | External validation | EORTC, CUETO |
| Krajewski 2019 | Retrospective | 1986–2016 | Multi-institutional | Poland/Spain | 414 | 68 | 3 | External validation | CUETO |
| Leo 2019 | Retrospective | 1990–2014 | Multi-institutional | USA | 1,404 | 25 (recurrence) 50 (progression) | 3 | External validation | EORTC, NCCN |
| Kim 2019 | Retrospective | 2000–2013 | Single institution | Korea | 970 | 38 | 3 | External validation | EORTC |
| Zhang, 2019 | Retrospective | 2003–2011 | Single institution | Germany | 479 | 60 | 4 | External validation | EORTC, CUETO |
| Jobczyk 2019 | Retrospective | 2005–2015 | Single institution | Poland | 322 | 48 | 3 | External validation | EORTC, CUETO, EAU until 2020 |
| Ravvaz, 2019 | Retrospective | 2006–2016 | Multi-institutional | USA | 38 | 4 | External validation | AUA | |
| Fujita 2020 | Retrospective | 1993–2019 | Single institution | Japan | 480 | 51 | External validation | EUA until 2020 | |
| Ritch, 2020 | Retrospective | 2001–2017 | Single institution | USA | 398 | 37 | 4 | External validation | AUA |
| Sylvester, 2021 | Retrospective | 1990–2018 | Multi-institutional | Netherlands, Spain, France, Italy, Czech Republic, Germany, Austria, Canada | 3,401 | 46.8 | 1ba | Prediction model development | EAU 2021 |
| Dovey 2021 | Retrospective | 1995–1996 | Multi-institutional | Sweden | 395 | 123 | 4 | External validation | EAU 2021 |
| Lobo 2021 | Retrospective | 2000–2018 | Single institution | USA | 529 | 47.3 | 3 | External validation | EORTC, CUETO, EAU 2021 |
The gender of patients was specified in 23 of the 25 studies (92%) [5, 12–16, 18–34] involving 21,638 patients, of whom 17,155 (79.3%) were male and 4,483 (20.7%), female. Age was described in 17 of the 25 studies (68%) [5, 6, 12–17, 21–30, 32, 34] involving 11,335 patients; 7,006 (61.8%) were younger than 70 years and 4,329 (38.2%) were 70 years or older. Regarding pathological features, the primary or recurrent tumor status could be extracted from 22 of the studies (88%) [5, 12–15, 17–28, 30, 32, 34] involving 17,921 patients; 13,631 (76.1%) of the patients had primary tumors (in six studies only patients with primary tumors were recruited) [20, 22, 25, 29–31]and 4,290 (23.9%) had recurrent tumors. The temporality of recurrent tumors was documented in 13 of the studies (52%) [5, 12–15, 19, 21, 24, 26–28, 32, 33] involving 3,964 patients; 2,202 (55.5%) recurrences occurred before 1 year of follow-up and 1,762 (44.5%) at more than 1 year of follow-up. The number of tumors could be extracted in 23 of the studies (92%) [5, 6, 12–22, 24, 26–34] involving 21,435 patients; 13,318 (62.1%) were solitary and 8,117 (37.9%), multiple. Tumor size could be extracted from 24 of the studies (96%) [5, 6, 12–22, 24–34] involving 21,109 patients; 15,073 (71.4%) tumors were smaller than 3 cm and 6,036 (28.6%) were 3 cm or larger. Tumor stage could be extracted from all 25 studies [5, 6, 12–34] involving 22,737 patients; 13,928 (61.25) were Ta and 8,809 (38.75) were T1. According to the WHO 1973 grading system, tumor grade was extractable in 22 of the studies (88%) [5, 6, 12–24, 27, 30–34] involving 21,868 patients; 15,901 (72.7%) tumors were G1/G2 and 5,967 (27.3%), G3. WHO 2004/2016 tumor grade was extractable in six studies (24%) [16, 25, 27–30] involving 6,052 patients; 3,501 (57.8%) tumors were low grade (LG) and 2,551 (42.2%) were high grade (HG). The presence of carcinoma in situ (CIS) was communicated in 24 of the studies (96%) [5, 6, 12–17, 19–34] involving 22,257 patients, of whom 1,540 (6.9%) showed the presence of associated CIS. The performance of re-TURBT could be extracted from ten studies (40%) [15, 16, 18, 23, 25, 27–30, 34] involving 7,580 patients; re-TURBT was performed in 1,862 (24.6%) patients and no studies described the stage at re-TURBT (Table 3).
Table 3
Clinicopathological features of the patients recruited through the systematic review
| Variable | No. (%) |
| Gender | |
| Female | 4,483 (20.7) |
| Male | 17,155 (79.3) |
| Age | |
| <70 years | 7,006 (61.8) |
| ≥70 years | 4,329 (38.2) |
| Tumor status | |
| Primary | 13,631 (76.1) |
| Recurrent | 4,290 (23.9) |
| Temporarity of recurrent tumors | |
| <1 year | 2,202 (55.5) |
| ≥1 year | 1,762 (44.5) |
| Number of tumors | |
| Solitary | 13,318 (62.1) |
| Multiple | 8,117 (37.9) |
| Tumor size | |
| <3 cm | 15,073 (71.4) |
| ≥3 cm | 6,036 (28.6) |
| Tumor stage | |
| Ta | 13,928 (61.2) |
| T1 | 8,809 (38.8) |
| Tumor grade; WHO 1973 | |
| G1/G2 | 15,901 (72.7) |
| G3 | 5,967 (27.3) |
| Tumor grade; WHO 2004 | |
| Low-grade | 3,501 (57.8) |
| High-grade | 2,551 (42.2) |
| Concomitant CIS | |
| Present | 1,540 (6.9) |
| Absent | 20,717 (93.1) |
| Re-TURBT | |
| Yes | 1,862 (24.6) |
| No | 5,718 (75.4) |
| Intravesical therapy | |
| Single postoperative chemotherapy instillation | 4,820 (41.3) |
| BCG immunotherapy | 5,333 (23.5) |
| Adjuvant chemotherapy | 5,423 (37.4) |
Regarding intravesical therapy, single postoperative chemotherapy instillation was reported in 11 of the studies (44%) [5, 15, 18, 19, 21, 23, 25–27, 32, 33] involving 11,678 patients, among whom 4,820 (41.3%) received it. On the other hand, adjuvant BCG immunotherapy instillation was reported in all studies [5, 6, 12–34], with 5,333 (23.5%) patients having received BCG, of whom only 1,068 (4.7%) received a maintenance schedule. Adjuvant chemotherapy information could be extracted from 15 studies (60%) [5, 12, 13, 15, 16, 19, 21, 22, 27–32, 34] involving 14,494 patients, of whom 5,423 (37.4%) received adjuvant chemotherapy instillations.
The number of patients stratified according to the different models that could be extracted was as follows: EORTC model from 11 out of 25 studies (44%) [5, 12, 16, 17, 19, 21, 22, 24, 26, 27, 32], n = 7,929; CUETO model from 5 of 25 studies (20%) [6, 16, 23, 27, 32], n = 3,567; EAU until 2020 from 3 of 25 studies (12%) [18, 25, 30], n = 4,388; EAU from 2021 from 3 of 25 studies (12%) [16, 25, 30], n = 8,121; AUA from 3 of 25 studies (12%) [16, 28, 29], n = 2,090; and NCCN from 2 of 25 studies (8%) [24, 28], n = 2,894. Table 4 shows the stratification of patients through risk models.
Table 4
Stratification of patients through risk models
| Scoring model | Recurrence | Progression | ||
| EORTC (n = 7,929) | 0 | 905 | 0 | 1,121 |
| 1–4 | 3,213 | 2–6 | 3,147 | |
| 5–9 | 3,139 | 7–13 | 2,626 | |
| 10–17 | 672 | 14–23 | 679 | |
| CUETO (n = 3,567) | 0 –4 | 1,740 | 0–4 | 1,706 |
| 5–6 | 937 | 5–6 | 441 | |
| 7–9 | 697 | 7–9 | 805 | |
| 10–16 | 193 | 10–14 | 615 | |
| EAU until 2020 (n = 4,388) | Low | 663 | Low | 663 |
| Intermediate | 1,978 | Intermediate | 1,978 | |
| High | 1,747 | High | 1,747 | |
| EAU 2021, WHO 1973 (n = 8,121) | Low | 1,036 | ||
| Intermediate | 1,913 | |||
| High | 758 | |||
| Very high | 89 | |||
| EAU 2021, WHO 2004 (n = 8,121) | Low | 1,865 | ||
| Intermediate | 1,058 | |||
| High | 1,160 | |||
| Very high | 242 | |||
| AUA (n = 2,090) | Low | 519 | Low | 519 |
| Intermediate | 778 | Intermediate | 778 | |
| High | 793 | High | 793 | |
| NCCN (n = 2,894) | TaLG | 1,579 | TaLG | 1,579 |
| TaHG | 390 | TaHG | 390 | |
| T1 any | 626 | T1 any | 626 | |
| CIS any | 229 | CIS any | 229 | |
Oncological outcomes
Overall recurrence rate was reported in 24 (96%) of the 25 studies [5, 6, 12–29, 31–34]. Of 22,208 patients analyzed, 9,648 (43.4%) presented recurrence. One- and 5-year recurrence probabilities according to EORTC risk groups were reported in 14 (56.0%) [5, 12, 14–17, 19–21, 24, 26, 27, 32, 34] of the studies, and 1- and 5-year recurrence probabilities according to CUETO risk groups were reported in nine (36.0%) studies [6, 14–16, 20, 23, 26, 27, 32, 34] (Tables 5 and 6). For EORTC risk groups, median 1-year recurrence probability was 6.7% in group I, 19.0% in group II, 38.0% in group III, and 76.0% in group IV. In EORTC risk groups, median 5-year recurrence probability was 27.5% in group I, 49.0% in group II, 66.8% in group III, and 88.0% in group IV. For CUETO risk groups, median 1-year recurrence probability was 8.6% in group I, 20.0% in group II, 41.5% in group III, and 43.9% in group IV. In CUETO risk groups, median 5-year recurrence probability was 38.5% in group I, 44.5% in group II, 63.0% in group III, and 85.0% in group IV. One- and 5-year recurrence probabilities according to AUA risk groups were reported in three (12.0%) of the studies [16, 28, 29], and 1- and 5-year recurrence probabilities according to NCCN risk groups were reported in two (8.0%) of the studies [24, 28]. For AUA, 1-year recurrence probability risk was 11.6% for low risk, 48.9% for intermediate risk, and 47.9% for high risk. Five-year recurrence probability was 31.6% for low risk, 67.0% for intermediate risk, and 70.3% for high risk. In NCCN risk groups, 1-year recurrence probability was 20.0% for Ta low grade (TaLG), 33.0% for Ta high grade (TaHG), 40.0% for T1, and 39.0% for CIS. Five-year recurrence probability was 42.0% for TaLG, 52.0% for TaHG, 51.0% for T1, and 56.0% for CIS.
Table 5
Oncological outcome domains reported in the 25 included studies
| Studies | Tumor-related outcomes | Survival | ||
| Recurrence | Progression | OMR | OCSMR | |
| Almeida, 2016 | x | x | x | x |
| Busato, 2016 | x | x | x | |
| Choi, 2014 | x | x | ||
| Dalkilic, 2018 | x | x | ||
| Dovey, 2021 | x | x | ||
| Fernández-Gómez, 2009 | x | x | ||
| Fernández-Gómez, 2011 | x | x | ||
| Fujita, 2020 | x | x | x | |
| Hernández, 2011 | x | x | ||
| Jobazyk, 2019 | x | x | ||
| Kilinç, 2017 | x | x | ||
| Kim, 2019 | x | x | ||
| Krajewsky, 2019 | x | x | ||
| Leo, 2019 | x | x | ||
| Lobo, 2021 | x | |||
| Pillai, 2011 | x | x | x | |
| Zheng, 2019 | x | x | ||
| Xu, 2013 | x | x | ||
| Vedder, 2014 | x | x | x | x |
| Xylinas, 2013 | x | x | ||
| Sylvester, 2006 | x | x | x | x |
| Sylvester, 2021 | x | |||
| Ritch, 2020 | x | x | ||
| Ravvaz, 2019 | x | x | ||
| Ravvaz, 2017 | x | x | ||
OMR, Overall mortality rate; OCSMR, overall cancer-specific mortality rate.
Table 6
Recurrence and progression probability (median) reported in the 25 included studies
| Recurrence | Progression | ||||
| Probability (median) | Probability (median) | ||||
| 1 yr (%) | 5 yr (%) | 1 yr (%) | 5 yr (%) | ||
| EORTC | I | 6.7 | 27.5 | 0 | 0 |
| II | 19 | 49 | 1 | 5.8 | |
| III | 38 | 66.8 | 4 | 18.5 | |
| IV | 76 | 88 | 21.2 | 36.5 | |
| CUETO | I | 8.6 | 38.5 | 0 | 3.5 |
| II | 20 | 44.5 | 3 | 11.7 | |
| III | 41.5 | 63 | 6 | 22 | |
| IV | 43.9 | 85 | 18 | 35.4 | |
| AUA | Low | 11.6 | 31.6 | 0.1 | 1.1 |
| Interm. | 48.9 | 67 | 3 | 11.6 | |
| High | 47.9 | 70.3 | 20 | 44.3 | |
| NCCN | TaLG | 20 | 42 | 0.2 | 1.3 |
| TaHG | 33 | 52 | 0.9 | 4.7 | |
| T1 any | 40 | 51 | 6.3 | 11 | |
| CIS any | 39 | 56 | 8.8 | 16 | |
| EAU (previous) | Low | 0 | 0.1 | ||
| Interm. | 1 | 3.5 | |||
| High | 3.9 | 9.7 | |||
| Very high | 6.9 | 16.7 | |||
| EAU 21 (WHO 1973) | Low | 0.4 | 1.3 | ||
| Interm. | 2 | 5.6 | |||
| High | 11.5 | 21.0 | |||
| Very high | 28.4 | 51 | |||
| EAU 21 (WHO 2004/2016) | Low | 0.4 | 1.5 | ||
| Interm. | 1.3 | 4.1 | |||
| High | 3.5 | 9.6 | |||
| Very high | 16 | 40 | |||
EORTC, European Organization for Research and Treatment of Cancer; CUETO, Club Urológico Español de Tratamiento Oncológico; AUA, American Urological Association; NCCN, National Comprehensive Cancer Network; EAU, European Association of Urology; yr, year.
Overall progression rate was reported in 24 (96.0%) of the 25 studies [3, 5, 6, 12–17, 19, 21–34]. From 22,208 patients analyzed, 2,627 (11.8%) presented progression (Tables 5 and 6). One- and 5-year progression probabilities according to EORTC risk groups were reported in 14 (56.0%) of the studies [5, 12, 14–17, 19–21, 24, 26, 27, 32, 34] of the studies, and 1- and 5-year recurrence probabilities according to CUETO risk groups were reported in nine (36.0%) studies [6, 14–16, 20, 23, 26, 27, 32, 34], and 1- and 5-year progression probabilities according to CUETO risk groups were reported in nine (36.0%) studies [6, 14–16, 20, 23, 26, 27, 32, 34]. In EORTC risk groups, median 1-year progression probability was 0.0% in group I, 1.0% in group II, 4.0% in group III, and 21.2% in group IV. For EORTC risk groups, median 5-year progression probability was 0.0% in group I, 5.8% in group II, 18.5% in group III, and 36.5% in group IV. In CUETO risk groups, median 1-year progression probability was 0.0% in group I, 3.0% in group II, 6.0% in group III, and 18.0% in group IV. For CUETO risk groups, median 5-year progression probability was 3.5% in group I, 11.7% in group II, 22.0% in group III, and 35.4% in group IV. There was information from two studies regarding EAU risk groups from 2020 and previously [25, 30]. Median 1-year progression probability was 0.0% for low risk, 1.0% for intermediate risk, 3.85% for high risk, and 6.9% for very high risk. Moreover, median 5-year progression probability was 0.1% for low risk, 3.5% for intermediate risk, 9.7% for high risk, and 16.7% for very high risk. Information was available from three studies regarding EAU 2021 WHO 1973 risk groups [16, 25, 30]. Median 1-year progression rate was 0.4% for low risk, 2.0% for intermediate risk, 11.5% for high risk, and 28.4% for very high risk. There was also information from three studies regarding EAU 2021 WHO 2004/2016 risk groups [16, 25, 30]. Median 1-year progression probability was 0.4% for low risk, 1.3% for intermediate risk, 3.5% for high risk, and 16.0% for very high risk. Median 5-year progression rate for EAU 2021 WHO 1973 was 1.3% for low risk, 5.6% for intermediate risk, 21.0% for high risk, and 51.0% for very high risk. Median 5-year progression probability was 1.5% for low risk, 4.1% for intermediate risk, 9.6% for high risk, and 40.0% for very high risk. One- and 5-year progression probabilities according to AUA risk groups were reported in three (12.0%) of the studies [16, 28, 29], and 1- and 5-year progression probabilities according to NCCN risk groups were reported in two (8.0%) studies [24, 28]. AUA 1-year progression risk was 0.1% for low risk, 3.0% for intermediate risk, and 20.0% for high risk. Five-year recurrence probability was 1.1% for low risk, 11.6% for intermediate risk, and 44.3% for high risk. In the case of NCCN risk groups, 1-year progression probability was 0.2% for TaLG, 0.9% for TaHG, 6.3% for T1, and 8.8% for CIS. Five-year progression probability was 1.3% for TaLG, 4.7% for TaHG, 11.0% for T1, and 16.0% for CIS.
Overall mortality rate (OMR) was reported in six (24.0%) of the 25 studies [5, 12, 13, 18, 26, 31]. Among 5,491 patients analyzed, OMR was 28.3% (1,553 patients). Overall cancer-specific mortality rate (OCSMR) was reported in five (20.0%) studies [5, 12, 13, 30, 31]. Among 8,299 patients analyzed, OCSMR was 5.6% (467 patients).
Validation and discrimination measures
We identified wide heterogeneity among the studies with respect to reporting of validation and discrimination measures for NMIBC stratification, the period of assessment, and the discrimination method used (c-index or AUC).
For the EORTC scoring system [5], and with respect to recurrence prediction (Fig. 3), 6 of 25 studies (24%) [5, 12, 17, 20, 26, 27], with 5,627 patients, assessed c-index at 1 year, with a range of 0.62–0.72; eight studies (32%) [5, 12, 15–17, 20, 26, 27], with 6,422 patients, reported c-index at 5 years, with a range of 0.59–0.777, and another eight studies (32%) [14, 21, 23, 24, 31–34] assessed c-index at final follow-up (median 25.2–120 months), including 10,120 patients, with a range of 0.597–0.817. Two of 25 studies (8%) [19, 20], including 739 patients, analyzed AUC at 1 year (Fig. 4), with a reported range of 0.557–0.61, while three studies (12%) [19, 20, 22], including 1,709 patients, reported AUC at 5 years, with a range of 0.547–0.7, and another three studies (12%) [14, 19, 21], including 1,296 patients, analyzed AUC at overall follow-up (median 55.3–59 months), reporting a range of 0.773–0.832.
Fig. 3
External validations with c-index for EORTC discrimination of recurrence risk (*refers to the model construction series).
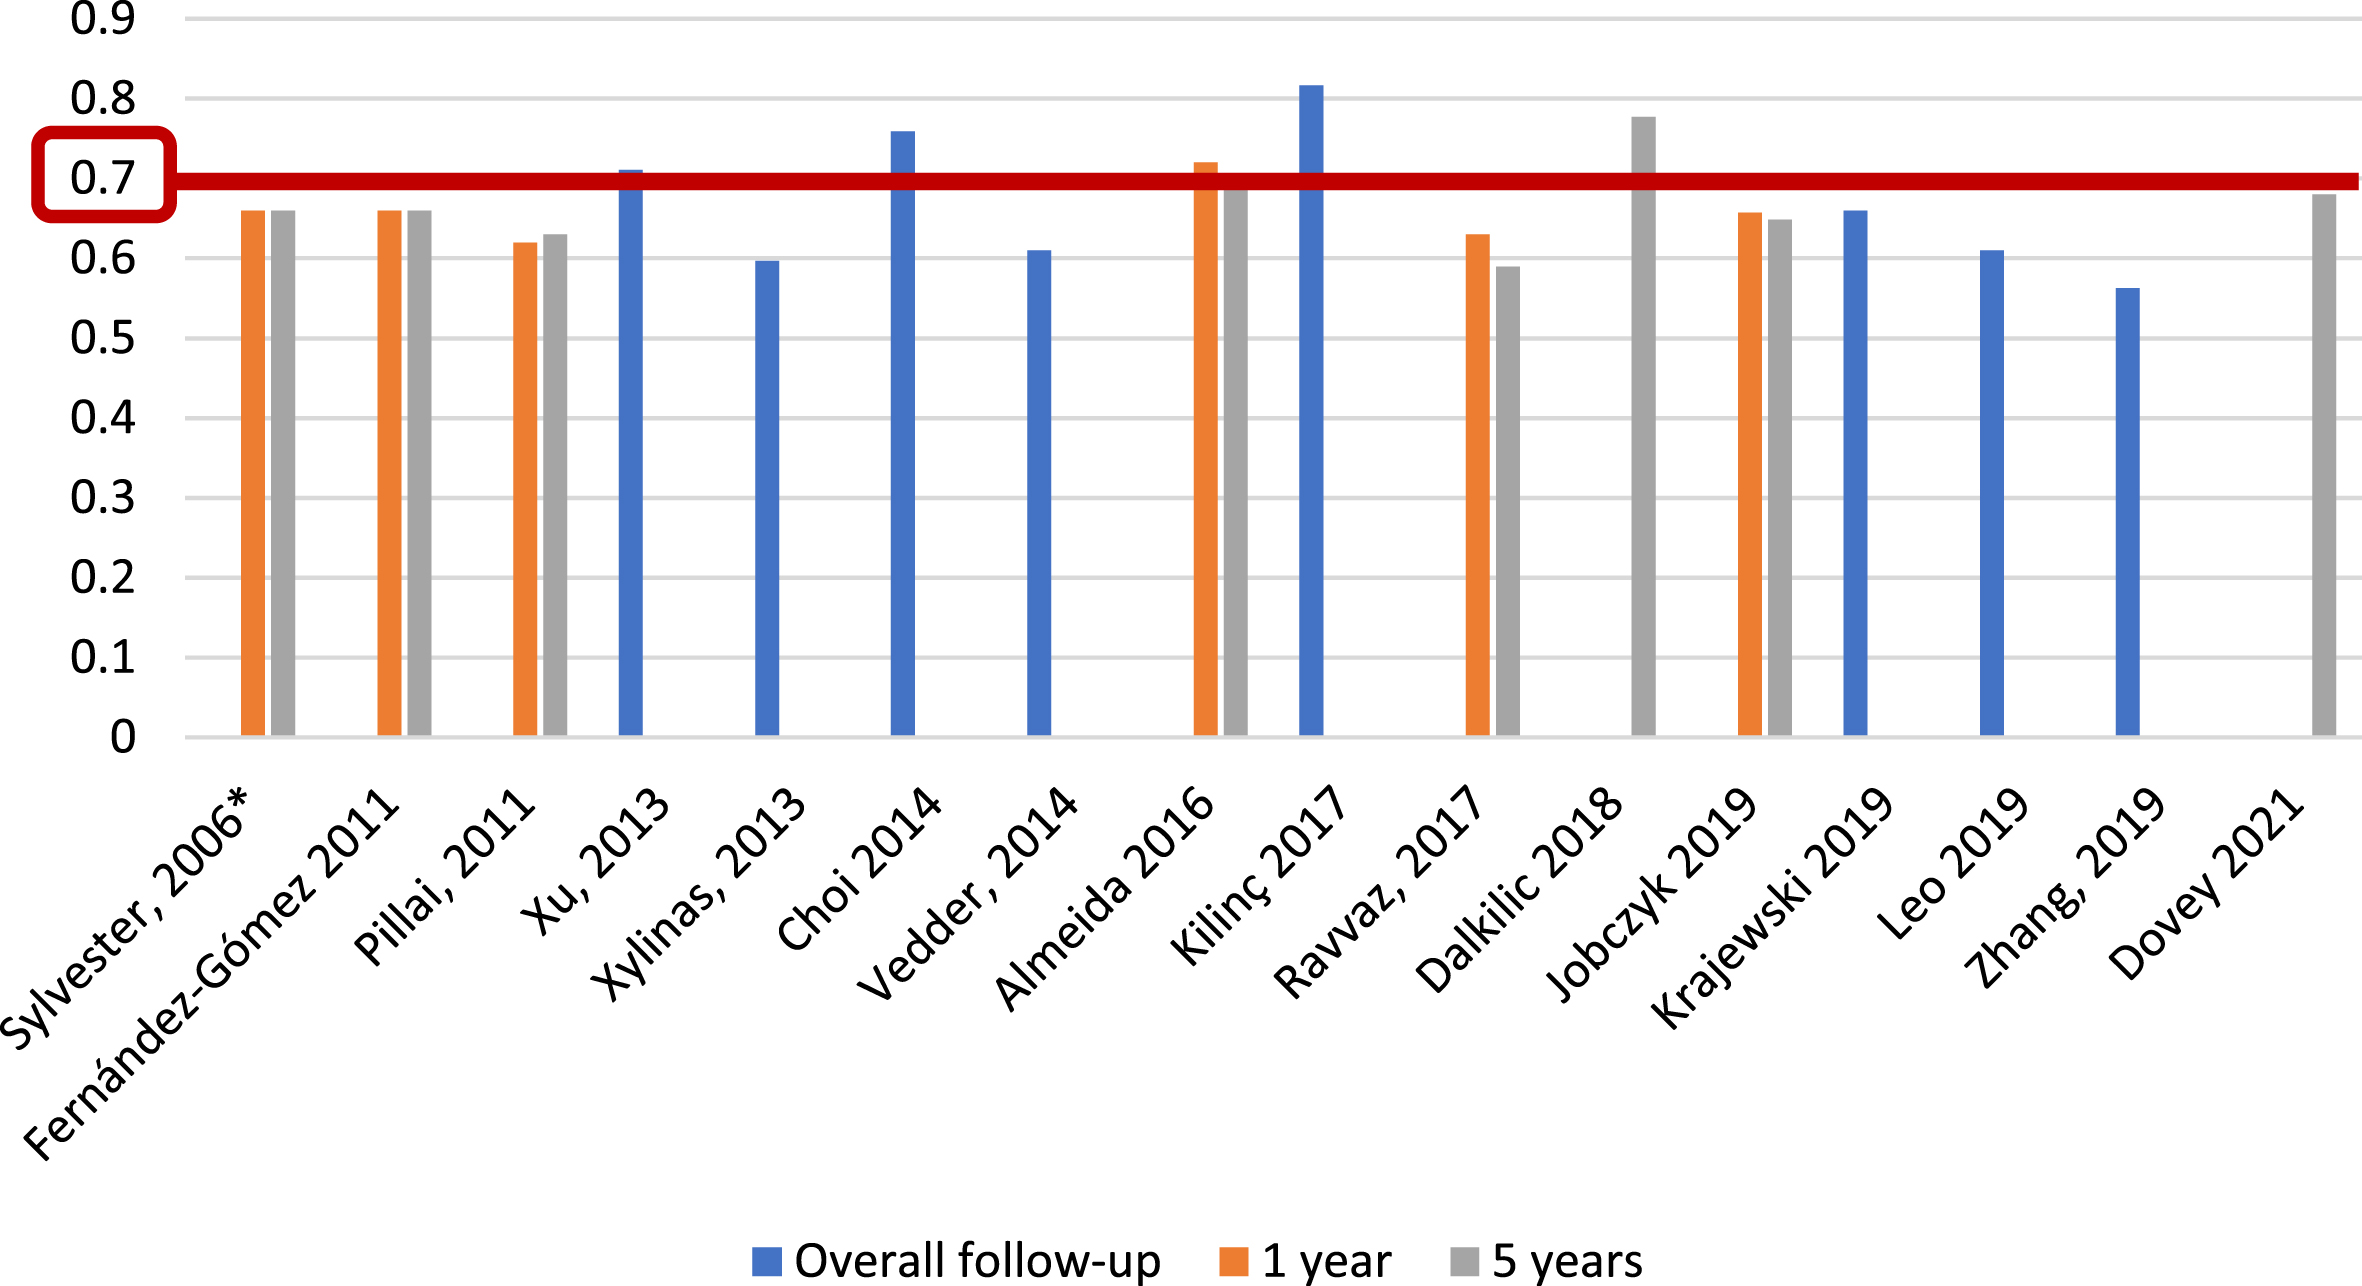
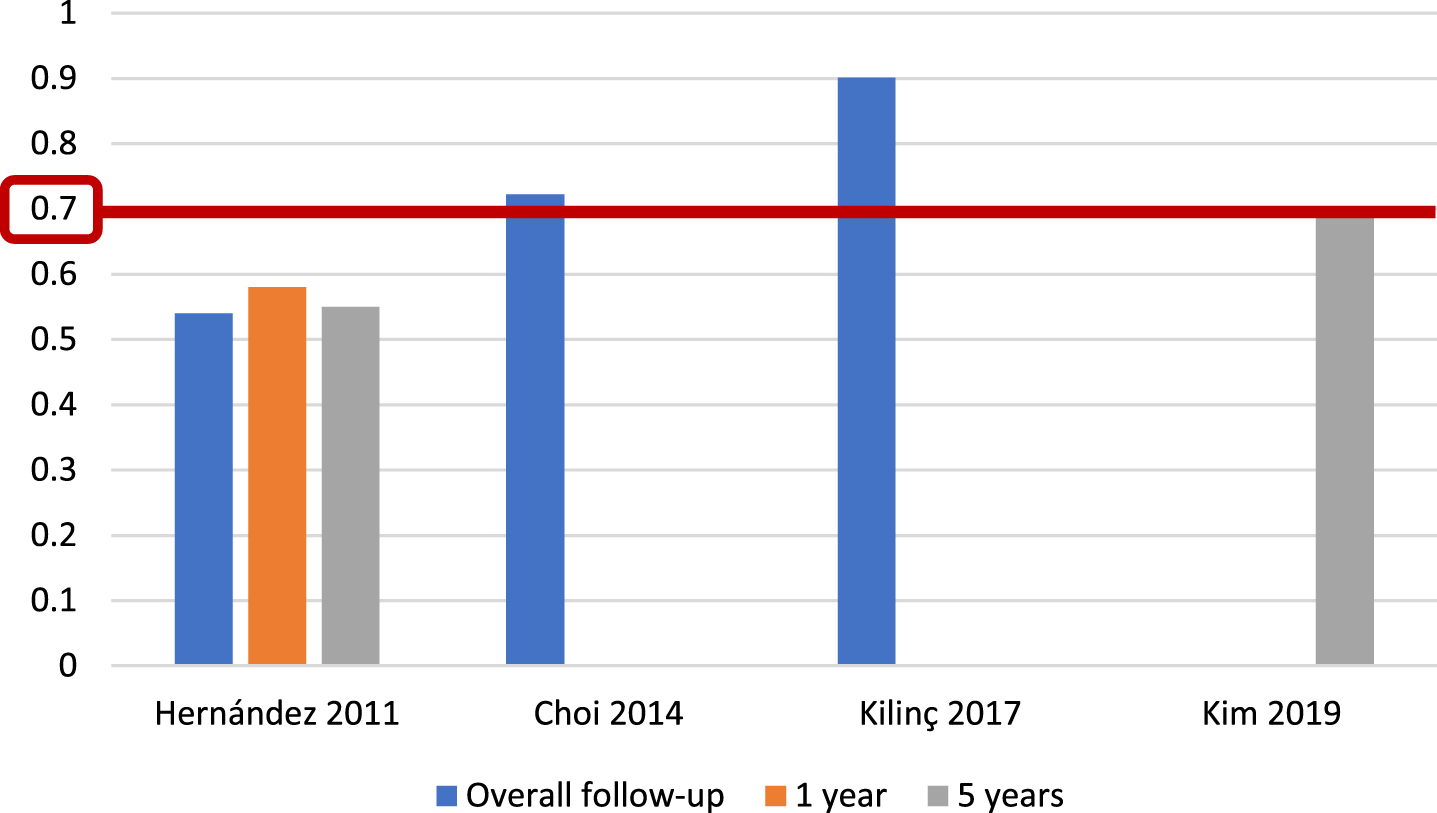
Fig. 4
External validations with AUC for EORTC discrimination of recurrence risk.
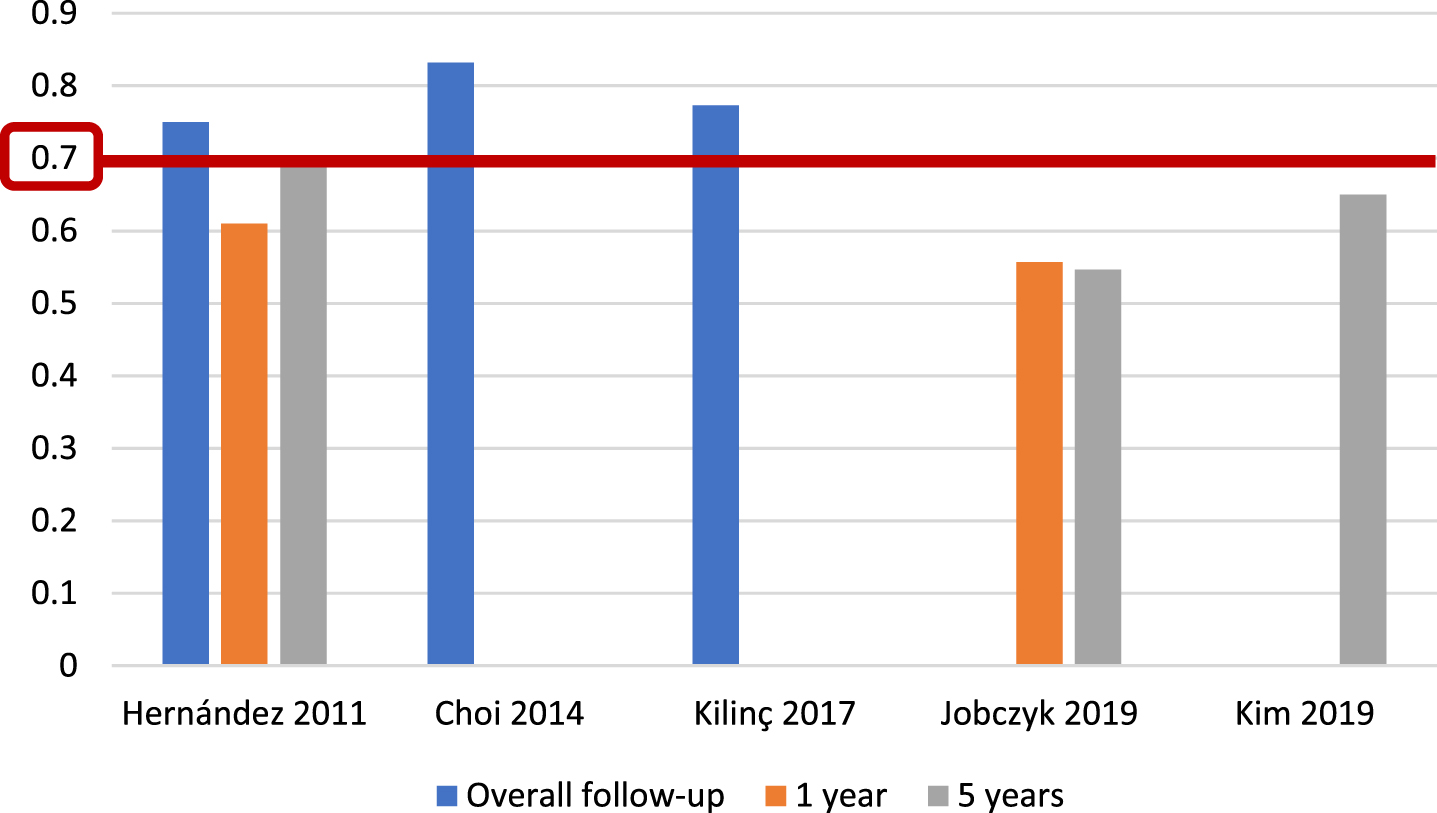
Regarding EORTC progression prediction (Fig. 5), 5 of 25 studies (20%) [5, 13, 17, 26, 27], with 5,305 patients, reported c-index at 1 year, with a range of 0.65–0.86; 7 of 25 studies (28%) [5, 13, 15–17, 27], including 6,100 patients, reported the c-index at 5 years, with a range of 0.67–0.82, and another eight studies (32%) [14, 21, 23, 24, 31–34], with 10,120 patients, analyzed the c-index at overall follow-up (median 25.2–120 months), with a range of 0.662–0.939. We identified only one study (4%) [19], based on 417 patients, that reported an AUC for progression at 1 year, with a value of 0.58; two studies (8%) [19, 22], with a total of 765 patients, analyzed AUC at 5 years, reporting values of 0.55 and 0.70, and three studies (12%) [14, 19, 21], with 1,296 patients, reported AUC at overall follow-up (55.3–59 months), with a range of 0.773–0.832 (Fig. 6).
Fig. 5
External validations with c-index for EORTC discrimination of progression risk (*refers to the model construction series).
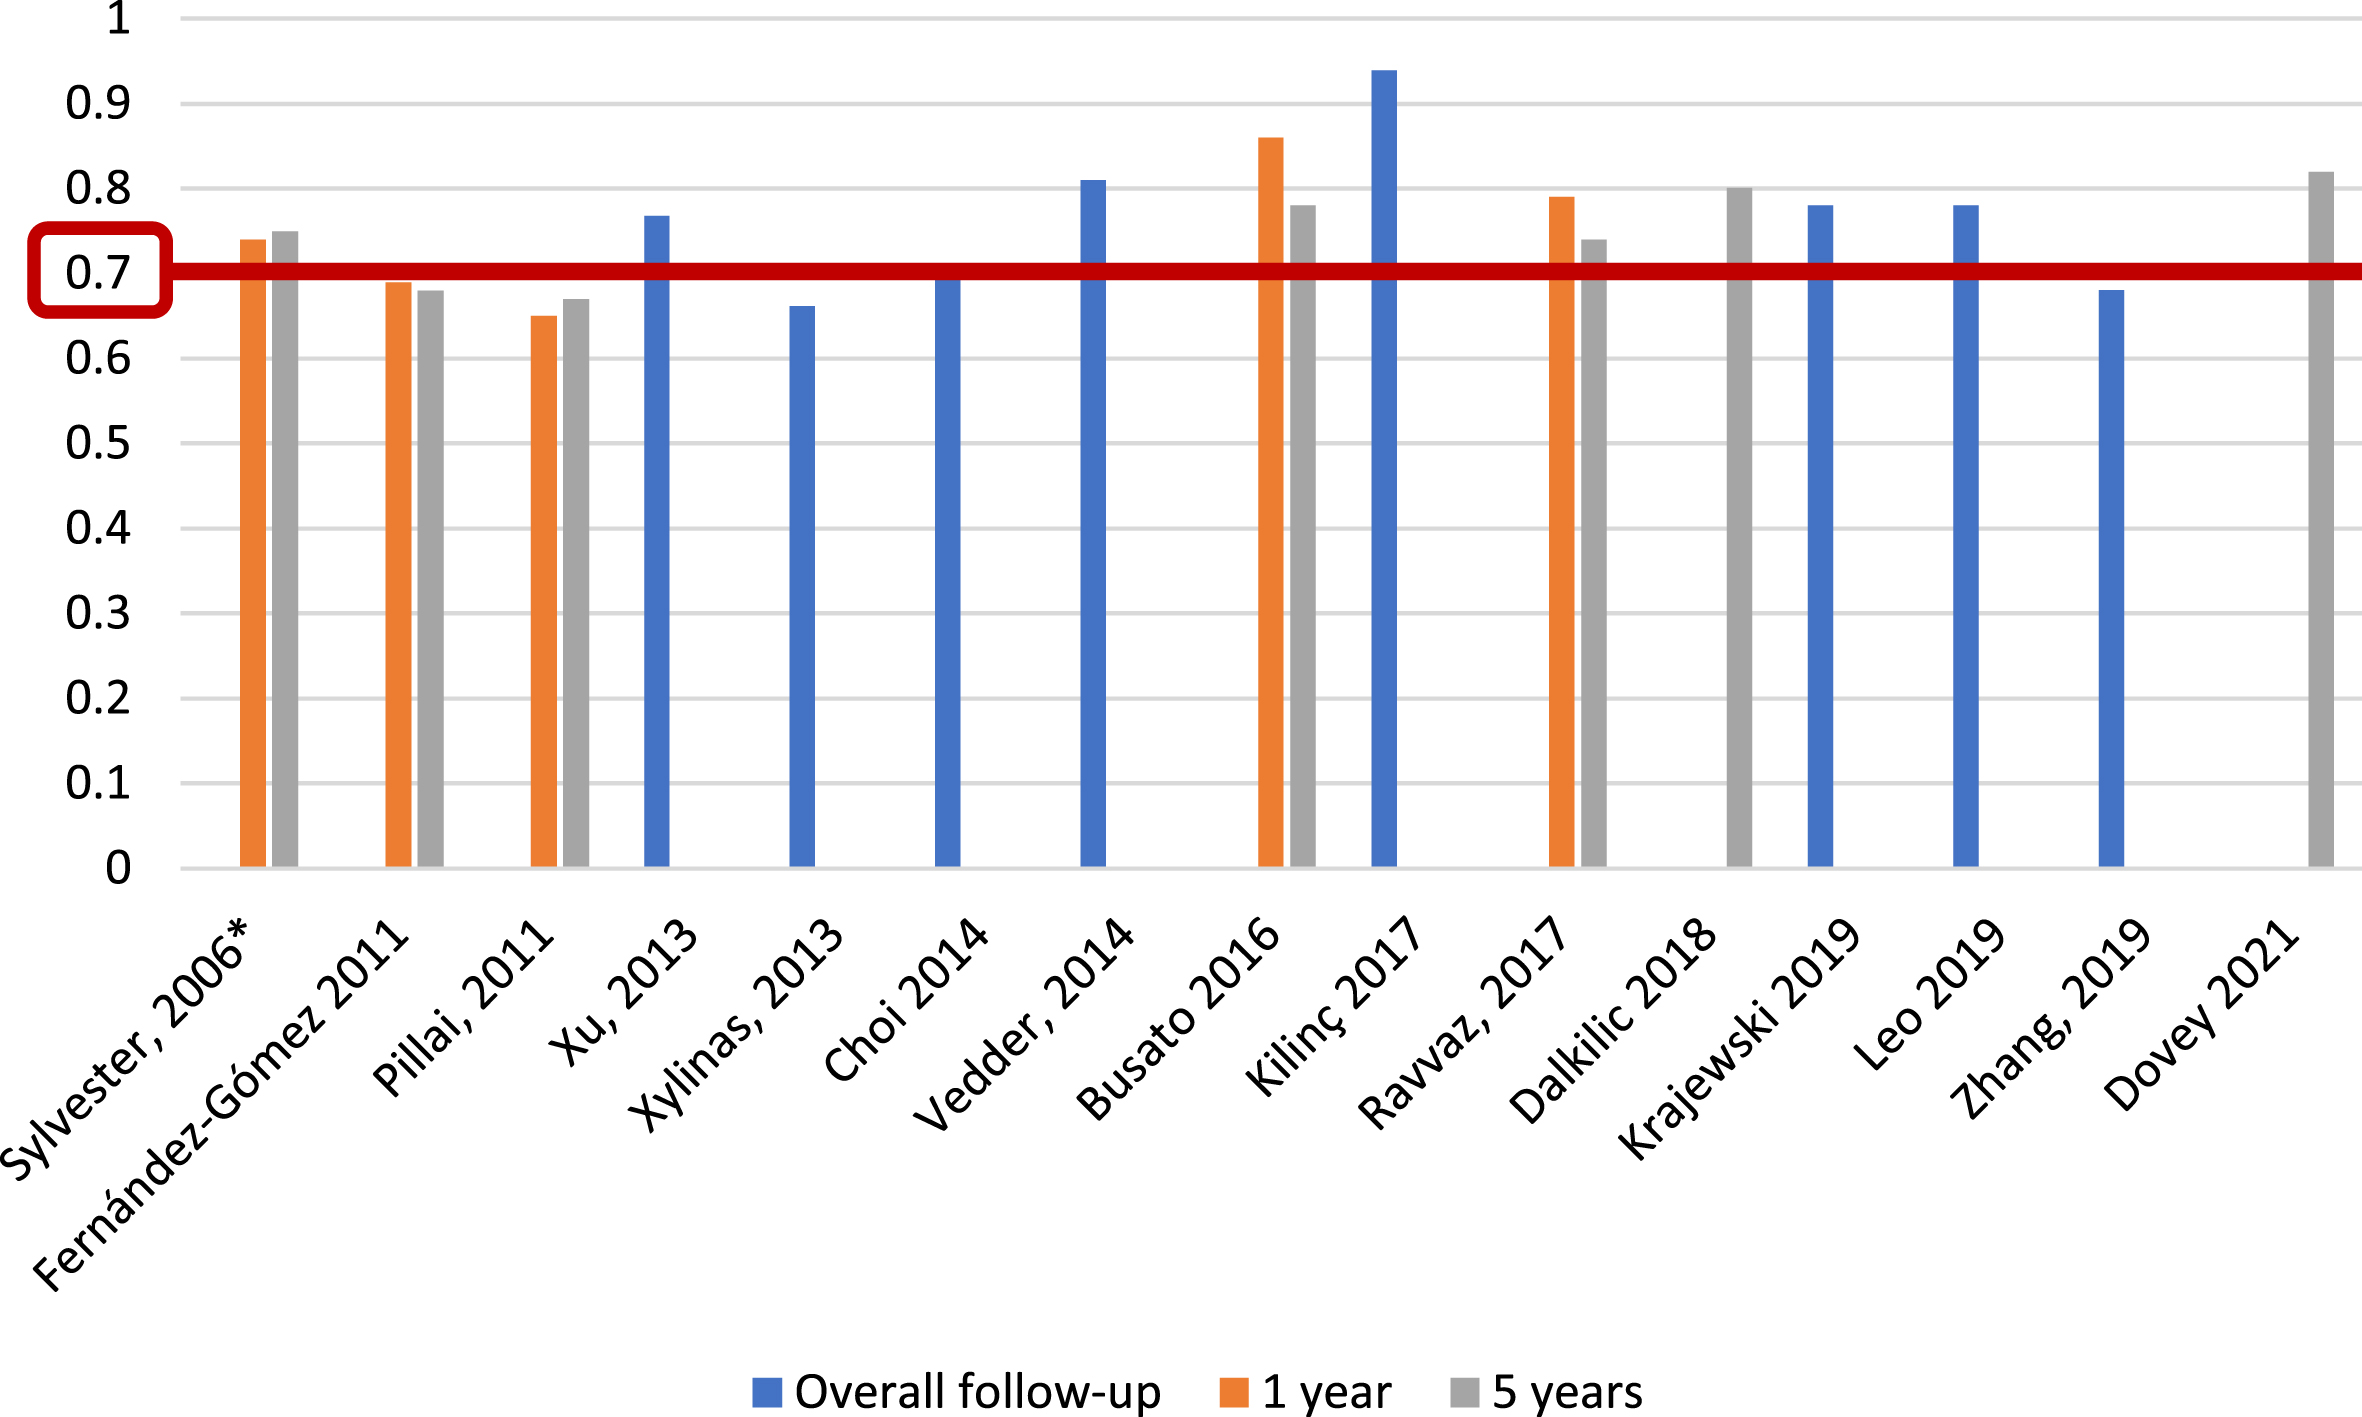
Fig. 6
External validations with AUC for EORTC discrimination of progression risk.
For CUETO recurrence risk assessment tables [6], we identified 3 of 25 studies (12%) [6, 23, 27], including 2,809 patients, that reported c-index at 1 year, with a range of 0.657–0.72; five studies (20%) [6, 15, 16, 23, 27], with 3,604 patients, analyzed c-index at 5 years, with a range of 0.56–0.705, and six studies (24%) [14, 23, 31–34], including 8,368 patients, reported c-index at overall follow-up (median 36–120 months), with a range of 0.516–0.836 (Fig. 7). Only Choi et al. [14] reported an AUC, with a value of 0.894, for CUETO recurrence risk tables, based on 531 individuals with a median follow-up of 58 months.
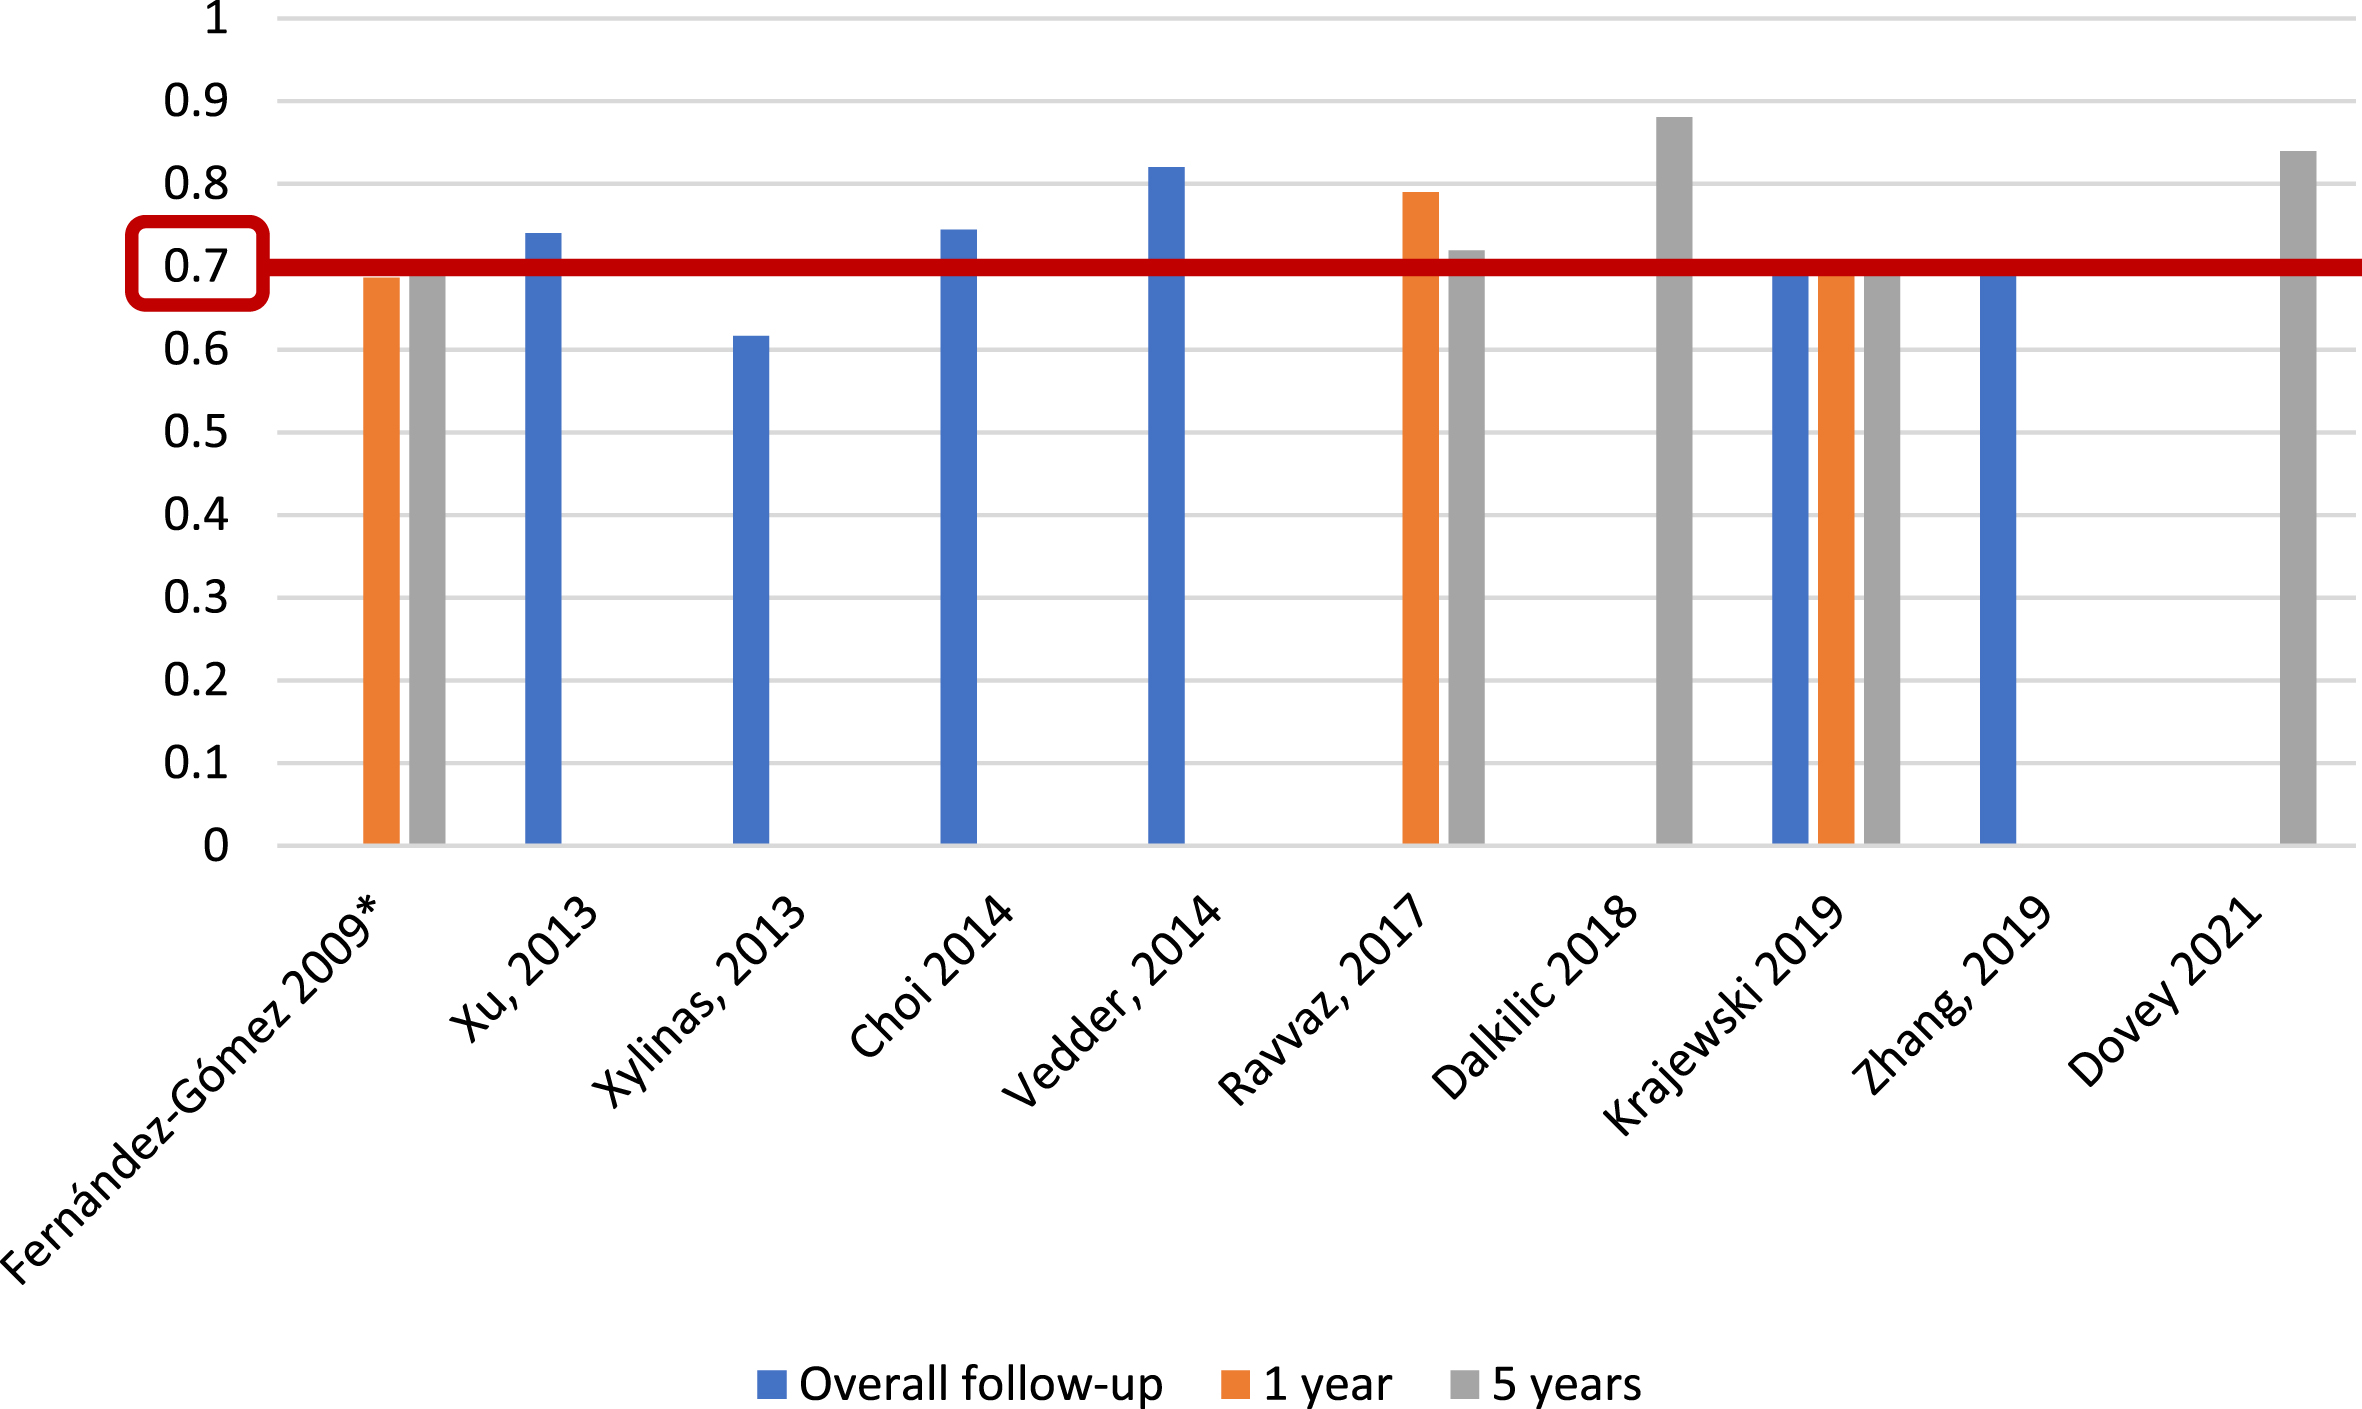
Fig. 7
External validations with c-index for CUETO discrimination of recurrence risk (*refers to the model construction series).
With respect to CUETO progression prediction, 3 of 25 studies (12%) [6, 23, 27], including 2,809 patients, reported c-index for progression risk at 1 year, with a range of 0.687–0.79; five studies (20%) [6, 15, 16, 23, 27], with 3,604 patients, reported c-index at 5 years, with a range of 0.697–0.881, and six studies (24%) [14, 23, 31–34], including 8,368 individuals, reported c-index at overall follow-up (36–120 months), with a range of 0.616–0.82 (Fig. 8). As for recurrence, only Choi et al. [14] reported an AUC, with a value of 0.724, for CUETO progression risk tables, based on 531 individuals with a median follow-up of 58 months.
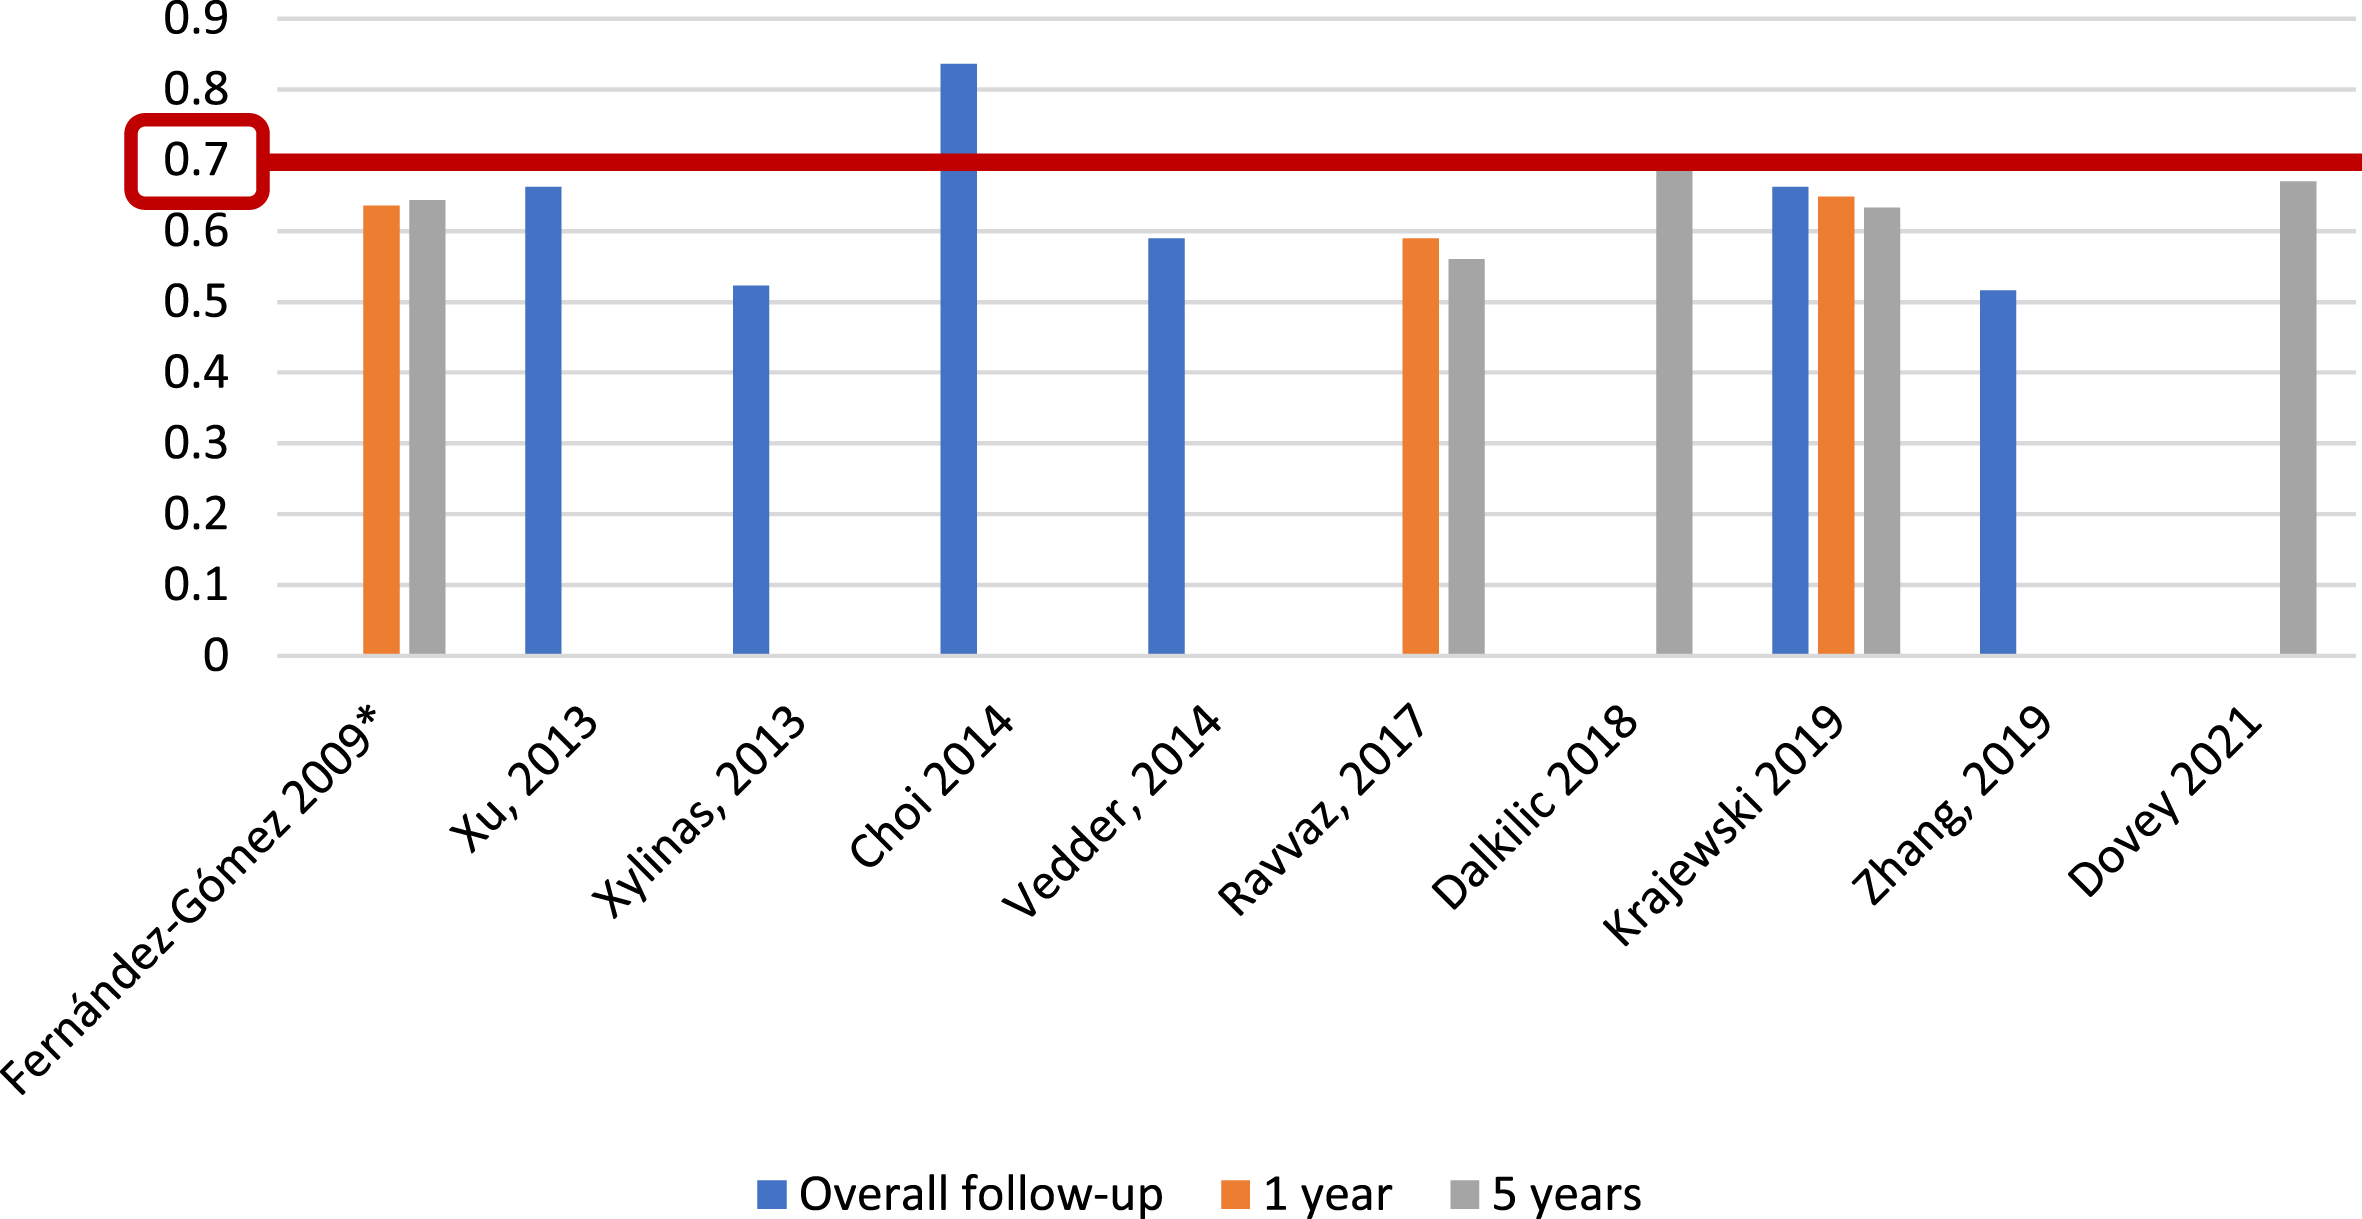
Fig. 8
External validations with c-index for CUETO prediction of progression (*refers to the model construction series).
EAU risk tables in their previous versions (until 2020) have been validated by only one group, who performed a retrospective analysis of 322 patients with a median follow-up of 48 months [20]. In the overall series, the authors found a c-index of 0.639 and 0.631, respectively, for recurrence at 1 and 5 years; when only patients treated with BCG were considered, the c-index for recurrence at 1 and 5 years was 0.560 and 0.540, respectively. For progression, c-index at 1 and 5 years in the overall sample was 0.811 and 0.785, respectively, and for those individuals who received BCG it was 0.696 and 0.635 at 1 and 5 years, respectively.
Regarding EAU 2021 risk groups, internal validation with 3,401 patients revealed a c-index of 0.80 for 5-year progression prediction for both WHO 1973 and 2004/2016 grading systems in patients not treated with BCG [30]. Just Dovey et al. [16] externally validated these data in their retrospective series of 295 Swedish patients (25.6% of patients under BCG, with unspecified schedule), reporting a c-index for progression at 5 years of 0.83, again for WHO 1973 and 2004/2016 grading systems.
For the AUA stratification system [7], only the group of Ravvaz et al. [28] reported an external validation, based on retrospective data of 1,297 patients; c-index for recurrence was 0.63, 0.61, and 0.61 at 1-year, 5-year, and overall (median 38 months) follow-up, respectively. In the same way, they reported a c-index for progression of 0.77 at 1 and 5 years and also at overall follow-up (median 38 months).
Finally, for NCCN risk tables [8], two studies (8%) [24, 28] based on retrospective data of 2,701 patients reported external validation; with a median follow-up of 38 and 47.3 months, these studies reported a c-index of 0.54 and 0.61 for recurrence and a c-index of 0.62 and 0.74 for progression. In their 1,297 patients, Ravvaz et al. [24, 28] also found a c-index for recurrence of 0.61 and 0.56 at 1 and 5 years, respectively, and a c-index of 0.75 for progression at 1 year.
DISCUSSION
NMIBC often progresses to MIBC after multiple recurrences, and NMIBCs differ in terms of their tumor characteristics, including histological grade, T stage, tumor number, tumor size, and tumor location in each recurrence [1]. Given this aspect of NMIBC, multiple-event analytical techniques should be used. Time-dependent covariate analysis is more accurate than time-fixed analysis [35], but the latter is used in most studies predicting the prognosis and outcome of NMIBC patients.
Based on the above considerations, risk tables for NMIBC have been designed to cover the clinical need for individualization and optimization of therapy for NMIBC patients [1, 5–8, 30]. These risk tables are indeed the best currently available prognostic models, and their use, as recommended by various guidelines, has become the standard of care [1, 7, 8]. In this context, external validation of these prognostic models is crucial to assess their discrimination capability, accuracy, and generalizability on more contemporaneous patient datasets.
In the present study, six classification systems were identified; three of them (EORTC, CUETO, and EAU 2021) were patient dataset-constructed predictive models [5, 6, 30], and three (AUA, EAU until 2020, and NCCN) were risk groups based on expert opinion [1, 7, 8]. In summary, we found a poor discrimination capability in most of the validations of these risk models and the expert opinion risk groups. In addition, when BCG-treated patients are introduced into models such as EORTC or EAU 2021, recurrence and progression tend to be overestimated and their discrimination capability is impaired [17, 25, 33].
The most validated predictive model is that from the EORTC [5]. The EORTC study included data of 2,596 patients from seven EORTC phase III trials, but less than 200 patients were treated with BCG (and no maintenance schedule was administered). That is why validation of the EORTC tables by Fernández-Gómez et al. [17] indicated that they were associated with an overestimation of the risk of recurrence in all risk categories and overestimation of the risk of progression in high-risk patients when they had been treated with BCG. Similarly, the EORTC scoring system overestimated the risk of progression in the data analyzed in this systematic review [6, 17, 30]. According to the data reviewed, the actual progression rate among NMIBC patients receiving BCG therapy was lower than the probability of progression reported in the EORTC risk tables, especially in the high-risk tumor category.
In the case of AUA risk tables, progression was far more likely in high-risk cases than in intermediate- and low-risk cases, particularly in the first year [16]. Accordingly, the AUA risk groups’ discrimination capability for progression, with a c-index of 0.77, is comparable to that of the EORTC and CUETO risk models, at 0.77 and 0.78 respectively. Moreover, the AUA risk groups also demonstrate a c-index similar to that of the NCCN risk groups, which is 0.79. The AUA low-risk group was comparable to the EORTC score in identifying patients with a solitary, low-grade, <3 cm Ta lesion [16]. These patients demonstrated a significant reduction in the risk of recurrence (20% lower risk of recurrence at 5 years) compared with the intermediate- and high-risk groups. Similarly, patients considered low risk by the AUA risk tables showed only 1% probability of NMIBC progression at 5 years and had a less than 1% probability of progression prior to death.
In the present systematic review, we found significant heterogeneity in the assessment of discrimination capability; therefore, a direct pooled analysis of dataset predictive models and expert opinion-based risk groups was not possible. Both EORTC [5] and CUETO [6] scores are the most validated models and those that achieve the highest discrimination capability for recurrence and progression at overall follow-up; however, modest discrimination capability was reported when a time-dependent c-index/AUC (at 1 or 5 years) was assessed.
When assessing the discrimination capability of predictive models, an AUC or c-index of less than 0.70 reflects poor performance [36]. In the present study, we found that Choi et al. [14] reported an AUC of 0.894 for the CUETO scoring model and Killinç et al. [21] reported a c-index of 0.817 for the EORTC scoring model for recurrence outcome. However, in most of the external validations included for these predictive models (13 studies) [5, 16, 17, 20, 21, 23, 25–27, 31–34], we found a poor discrimination capability (AUC or c-index under 0.7). Based on these data, we can state that these two predictive models have a poor discrimination capability for recurrence in patients with NMIBC.
Regarding progression, a better discrimination capability was reported by Killinç et al. [21] for the EORTC scoring model, with a c-index of 0.939, and by Dalkilic et al. [15] for the CUETO scoring model, with a c-index of 0.881. Furthermore, while in the present review we identified five studies with an AUC or c-index under 0.7 [6, 19, 23, 26, 33], 12 studies reported an AUC or c-index of at least 0.7 [13–16, 20–22, 27, 31, 32, 34], and in six cases the AUC or c-index exceeded 0.8 [14–16, 20, 28, 31]. These results highlight that both models (EORTC and CUETO) seem to present a better discrimination capability for progression than for recurrence. This fact is relevant for daily practice; moreover, it explains why progression has been the only outcome used for the construction of the updated EAU prognostic factor risk groups [30].
On the other hand, with the twin aim of updating their previous risk groups based on expert opinion from the EORTC scoring model and incorporating the WHO 2004/2016 tumor grading system, the EAU NMIBC guidelines panel has designed a new predictive model based on an individual patient data analysis involving 3,401 patients treated with TURBT with or without adjuvant chemotherapy [30]. An important concern with respect to this model, however, is the exclusion of patients treated with BCG.
In a recent external validation of the updated EAU 2021 model, Dovey et al. [16] showed a good discrimination capability (c-index 0.83 for both WHO 73 and WHO 04/16 scoring models) in a retrospective series of 295 patients in all stages of NMIBC, 25.6% of whom were treated with BCG. By contrast, Lobo et al. [25] showed a c-index of only 0.64 for those who received adequate BCG therapy in a series of 529 BCG-treated patients. These results reflect the fact that the exclusion of patients treated with BCG from the EAU 2021 scoring model leads to the same phenomenon described for the EORTC model [5], where only 7% of the patients were treated with BCG. Therefore, the EAU 2021 scoring model overestimates the risk of progression, with consequent impairment of the discrimination capability for progression in those patients treated with BCG [25].
Bias was introduced in various ways in the included articles. Although assessment using the PROBAST tool [10] showed studies to be homogeneous with regard to the domains of participants and predictors, several concerns regarding the risk of bias arise in the outcomes and analysis domains.
In most studies, the recurrence and progression outcomes were not defined, and in some studies, patients with relapse of MIBC were recorded as both recurrence and progression, which could result in an overestimation of recurrences. In this regard, Kamat et al. [37] recently published a consensus document in which these outcomes were specifically defined to standardize the studies involving patients with NMIBC. However, most of the studies included in this systematic review were published before the aforementioned study.
Probably, the major concerns regarding the risk of bias were observed in the analysis domain. Although the current recommendations for external validation studies of predictive models suggest that at least 100 patients with the outcome need to be included in order to draw solid conclusions [10, 11], in most of the included studies there was a low number of patients with the outcomes (recurrence or progression), which could have affected the conclusions.
Other issues derived from this systematic review are:
Only EORTC, CUETO, and EAU 2021 are predictive models constructed from a patient dataset [5, 6, 30]. NCCN, AUA, and EAU until 2020 classifications relied on a consensus of expert opinion [1, 7, 8]. In consequence, there are insufficient data and methodologies to perform calibration and statistical assessment for the discrimination performance of these last ones.
The EAU21 is the only data-driven model that includes the WHO 1973 and WHO 2004/2016 grading classification systems, which could limit the use of the WHO 1973 classification. On the other hand, the EAU21 included only patients with primary tumors not treated with BCG, which could explain the drop of its accuracy in certain NMIBC patient subpopulations.
Patients with CIS of the bladder are underrepresented in all these predictive models [5, 6, 30], in that the proportion is below the described incidence [38, 39]. Furthermore, the described clinicopathological features for patients with CIS of the bladder (such as focality, clinical subtype, and absence of papillary tumor) [40] are not present in these models. Consequently, patients with CIS tend to be misclassified by these models. Despite the limitations in the risk assessment of patients with CIS of the bladder, it is widely known that there is an important tendency toward recurrence and progression in these patients; therefore, they must be considered as high/very high risk until the development of a more adequate risk model.
Some subpopulations of patients with the same stage are classified into different categories by these classifications. In this regard, patients with a T1LG would be intermediate risk according to the AUA guidelines [7] whereas any T1 would be considered high risk according to EAU until 2020 [1], and when stratification is performed using updated EAU 2021 risk groups, the classification of T1 depends on several other factors [30].
Future directions
In the last decade, strategies to advance precision medicine through the development of novel diagnostic and prognostic methods have attracted considerable investment. In this regard, recent data using a recalibration of the CUETO and EORTC models through deep learning as an artificial intelligence (AI) strategy showed, in patients treated with BCG and mitomycin C, a c-index of 0.651 and 0.660, respectively, for recurrence-free survival and a c-index of 0.881 and 0.885, respectively, for progression-free survival [41]. The phenomenon of improvement in discrimination capability for AI models has been observed previously [42]. This is attributable to the classical models being based on linear regression statistics, as a consequence of which non-linear relationships between predictive factors and the outcome may not be fitted. However, using machine learning or deep learning, non-linear interactions between predictors and the outcome may be fitted and be recognized from medical data, minimizing the error.
On the other hand, several researchers have described a molecular signature that allows for prediction of outcomes in patients with NMIBC. In this context, Hedegaard et al. [43] analyzed the transcription profile of 460 NMIBC (UROMOL project), managing to define three molecular groups: class 1, characterized by the expression of early cell cycle activation genes; class 2, characterized by the expression of late cell cycle activation genes; and class 3, which showed expression of CD44, KRT5, and KRT15. Classes 1 and 2 showed features of the luminal subtype (luminal-like) while class 3 showed features of the basal subtype (basal-like) described for MIBC.
More recently, Lindskrog et al. [44], in a multi-omic analysis that included 834 patients from the UROMOL project, validated the three previously described classes, but in addition restratified class 2 into class 2a (characterized by significant chromosomal instability, disruption of the cell signaling pathway involving p53, and APOBEC mutations), this being the class with the worst prognosis, with a recurrence rate of 1.11 recurrence/year, and class 2b (characterized by significant infiltration of immune cells and chromosomal instability). However, despite various efforts, these molecular signatures have not yet been validated in the clinical setting.
Finally, with regard to new therapies, a significant number of clinical trials are using immune checkpoint inhibitors as adjuvant therapy for NMIBC, such as POTOMAC, CREST, ALBAN, and KEYNOTE-676 (NCT03528694, NCT04165317, NCT03799835, and NCT03711032). These trials are focusing on the setting of high-risk BCG-naïve disease, and predicting the risk of these patients will be a challenge in the near future.
CONCLUSIONS
Both existing dataset-based prediction models (EORTC, CUETO, and EAU 2021 scoring system) and expert opinion risk groups (AUA, EAU until 2020, and NCCN) show poor discrimination capability for disease recurrence and possibly helpful discrimination capability for progression in NMIBC patients. The EORTC overestimates the risk of disease recurrence and progression, and EAU 2021 model overestimates the risk of progression in patients treated with BCG.
Our results highlight the unmet need to develop novel accurate risk models for patients with NMIBC. Therefore, in the era of precision medicine, the combination of clinicopathological and molecular information using AI could be the key to better prediction of clinical outcomes that allows accurate clinical decision-making in NMIBC patients.
ACKNOWLEDGMENTS
The authors have no acknowledgments.
FUNDING
The authors report no funding.
AUTHOR CONTRIBUTIONS
Félix Guerrero-Ramos: conception, performance of work, interpretation of data, writing the article.
José Daniel Subiela: conception, performance of work, interpretation of data, writing the article.
Óscar Rodríguez-Faba: conception, performance of work, interpretation of data, writing the article.
Julia Aumatell: performance of work, interpretation of data, writing the article.
Celeste Manfredi: interpretation of data, writing the article.
Giorgio Bozzini: interpretation of data, writing the article.
Javier Romero-Otero: conception, writing the article.
Felipe Couñago-Lorenzo: conception, writing the article.
ETHICAL CONSIDERATIONS
As a systematic review of the literature, and as no animal or human research was involved, our study is exempt from any requirement for Institutional Review Board approval.
CONFLICT OF INTEREST
Félix Guerrero-Ramos declares the following conflicts of interest: Bristol-Myers Squibb, AstraZeneca, Janssen, Pfizer, Combat Medical (advisory/consultancy); Astellas, Janssen, Pfizer, AstraZeneca, Combat Medical, Palex, Rovi (speaker honoraria); Pfizer, Combat Medical, Cepheid, AstraZeneca, Bristol-Myers Squibb, Janssen, IDL Biotech, Astellas (clinical trials); Pfizer, Lacer, Ipsen, Janssen, Combat Medical, Rovi, Recordati (travel expenses).
Felipe Couñago-Lorenzo declares the following conflicts of interest: Janssen (sponsored research); Janssen, AstraZeneca (advisory/consultancy); Janssen, Roche, AstraZeneca, Astellas (speaker honoraria); AstraZeneca, Astellas, Janssen, Roche (travel expenses).
José Daniel Subiela, Óscar Rodríguez-Faba, Julia Aumatell, Celeste Manfredi, Giorgio Bozzini and Javier Romero-Otero declare that they have no conflicts of interest.
SUPPLEMENTARY MATERIAL
[1] The supplementary material is available in the electronic version of this article: https://dx.doi.org/10.3233/BLC-220055.
REFERENCES
[1] | Babjuk M , Burger M , Capoun O , Cohen D , Comperat EM , Dominguez Escrig JL , et al. European Association of Urology Guidelines on Non-muscle-invasive Bladder Cancer (Ta, T1, and Carcinoma in Situ), Eur Urol (2022) ;81: :75–94. |
[2] | Malmstrom PU , Sylvester RJ , Crawford DE , Friedrich M , Krege S , Rintala E , et al. An individual patient data meta-analysis of the long-term outcome of randomised studies comparing intravesical mitomycin C versus bacillus Calmette-Guerin for non-muscle-invasive bladder cancer, Eur Urol (2009) ;56: :247–56. |
[3] | Brausi M , Oddens J , Sylvester R , Bono A , van de Beek C , van Andel G , et al. Side effects of Bacillus Calmette-Guerin (BCG) in the treatment of intermediate- and high-risk Ta, T1 papillary carcinoma of the bladder: results of the EORTC genito-urinary cancers group randomised phase 3 study comparing one-third dose with full dose and 1 year with 3 years of maintenance BCG, Eur Urol (2014) ;65: :69–76. |
[4] | Perera M , Papa N , Christidis D , McGrath S , Manning T , Roberts M , et al. The impact of the global bacille Calmette-Guerin shortage on treatment patterns: population-based data, BJU Int (2018) ;121: :169–72. |
[5] | Sylvester RJ , van der Meijden AP , Oosterlinck W , Witjes JA , Bouffioux C , Denis L , et al. Predicting recurrence and progression in individual patients with stage Ta T1 bladder cancer using EORTC risk tables: a combined analysis of 2596 patients from seven EORTC trials. Eur Urol. (2006) ;49: :466–5.discussion 75-7. |
[6] | Fernandez-Gomez J , Madero R , Solsona E , Unda M , Martinez-Pineiro L , Gonzalez M , et al. Predicting nonmuscle invasive bladder cancer recurrence and progression in patients treated with bacillus Calmette-Guerin: the CUETO scoring model J Urol (2009) ;182: :2195–203 |
[7] | Chang SS , Boorjian SA , Chou R , Clark PE , Daneshmand S , Konety BR , et al. Diagnosis and Treatment of Non-Muscle Invasive Bladder Cancer: AUA/SUO Guideline, J Urol (2016) ;196: :1021–9. |
[8] | Flaig TW , Spiess PE , Agarwal N , Bangs R , Boorjian SA , Buyyounouski MK , et al. Bladder Cancer, Version 3, NCCN Clinical Practice Guidelines in Oncology. J Natl Compr Canc Netw (2020) ;18: :329–54. |
[9] | Moher D , Shamseer L , Clarke M , Ghersi D , Liberati A , Petticrew M , et al. Preferred reporting items for systematic review and meta-analysis protocols (PRISMA-P) statement, Syst Rev (2015) ;4: :1. |
[10] | Moons KGM , Wolff RF , Riley RD , Whiting PF , Westwood M , Collins GS , et al. PROBAST: A Tool to Assess Risk of Bias and Applicability of Prediction Model Studies: Explanation and Elaboration, Ann Intern Med (2019) ;170: :W1–W33. |
[11] | Moons KG , Altman DG , Reitsma JB , Ioannidis JP , Macaskill P , Steyerberg EW , et al. Transparent Reporting of a multivariable prediction model for Individual Prognosis or Diagnosis (TRIPOD): explanation and elaboration, Ann Intern Med (2015) ;162: :W1–73. |
[12] | Almeida GL , Busato WF Jr , Ribas CM, , Ribas JMF , De Cobelli O , External validation of EORTC risk scores to predict recurrence after transurethral resection of brazilian patients with non -muscle invasive bladder cancer stages Ta and T1., Int Braz J Urol (2016) ;42: :932–41. |
[13] | Busato Junior WF , Almeida GL , Ribas CA , Ribas Filho JM , De Cobelli O , EORTC Risk Model to Predict Progression in Patients With Non-Muscle-Invasive Bladder Cancer: Is It Safe to Use in Clinical Practice? Clin Genitourin Cancer (2016) ;14: :176–82. |
[14] | Choi SY , Ryu JH , Chang IH , Kim TH , Myung SC , Moon YT , et al. Predicting recurrence and progression of non-muscle-invasive bladder cancer in Korean patients: a comparison of the EORTC and CUETO models, Korean J Urol (2014) ;55: :643–9. |
[15] | Dalkilic A , Bayar G , Kilinc MF , A Comparison of EORTC And CUETO Risk Tables in Terms of the Prediction of Recurrence and Progression in All Non-Muscle-Invasive Bladder Cancer Patients, Urol J (2019) ;16: :37–43. |
[16] | Dovey Z , Pfail J , Martini A , Steineck G , Dey L , Renstrom L , et al. Bladder Cancer (NMIBC) in a population-based cohort from Stockholm County with long-term follow-up; A comparative analysis of prediction models for recurrence and progression, including external validation of the updated E, A.U. model. Urol Oncol (2022) ;40: :106 e1–e10. |
[17] | Fernandez-Gomez J , Madero R , Solsona E , Unda M , Martinez-Pineiro L , Ojea A , et al. The EORTC tables overestimate the risk of recurrence and progression in patients with non-muscle-invasive bladder cancer treated with bacillus Calmette-Guerin: external validation of the EORTC risk tables, Eur Urol (2011) ;60: :423–30 . |
[18] | Fujita N , Hatakeyama S , Momota M , Tobisawa Y , Yoneyama T , Yamamoto H , et al. Impact of substratification on predicting oncological outcomes in patients with primary high-risk non-muscle-invasive bladder cancer who underwent transurethral resection of bladder tumor, Urol Oncol (2020) ;38: :795 e9–e17. |
[19] | Hernandez V , De La Pena E , Martin MD , Blazquez C , Diaz FJ , Llorente C . External validation and applicability of the EORTC risk tables for non-muscle-invasive bladder cancer, World J Urol (2011) ;29: :409–14. |
[20] | Jobczyk M , Stawiski K , Fendler W , Rozanski W . Validation of EORTC, CUETO, and EAU risk stratification in prediction of recurrence, progression, and death of patients with initially non-muscle-invasive bladder cancer (NMIBC): A cohort analysis, Cancer Med (2020) ;9: :4014–25. |
[21] | Kilinc MF , Bayar G , Dalkilic A , Sonmez NC , Arisan S , Guney S , Applicability of the EORTC risk tables to predict outcomes in non-muscle-invasive bladder cancer in Turkish patients, Turk J Urol (2017) ;43: :48–54. |
[22] | Kim HS , Jeong CW , Kwak C , Kim HH , Ku JH , Novel nomograms to predict recurrence and progression in primary non-muscle-invasive bladder cancer: validation of predictive efficacy in comparison with European Organization of Research and Treatment of Cancer scoring system, World J Urol (2019) ;37: :1867–77. |
[23] | Krajewski W , Rodriguez-Faba O , Breda A , Pisano F , Poletajew S , Tukiendorf A , et al. Validation of the CUETO scoring model for predicting recurrence and progression in T1G3 urothelial carcinoma of the bladder, Actas Urol Esp (Engl Ed) (2019) ;43: :445–51. |
[24] | Leo MC , McMullen CK , O’Keeffe-Rosetti M , Weinmann S , Garg T , Nielsen ME , External validation of the EORTC and NCCN bladder cancer recurrence and progression risk calculators in a U, S. community-based health system. Urol Oncol (2020) ;38: :39 e21–39 e27. |
[25] | Lobo N , Hensley PJ , Bree KK , Nogueras-Gonzalez GM , Navai N , Dinney CP , et al. Updated European Association of Urology (EAU) Prognostic Factor Risk Groups Overestimate the Risk of Progression in Patients with Non-muscle-invasive Bladder Cancer Treated with Bacillus Calmette-Guerin, Eur Urol Oncol (2022) ;5: :84–91. |
[26] | Pillai R , Wang D , Mayer EK , Abel P . Do standardised prognostic algorithms reflect local practice? Application of EORTC risk tables for non-muscle invasive (pTa/pT1) bladder cancer recurrence and progression in a local cohort, ScientificWorldJournal (2011) ;11: :751–9. |
[27] | Ravvaz K , Walz ME , Weissert JA , Downs TM , Predicting Nonmuscle Invasive Bladder Cancer Recurrence and Progression in a United States Population, J Urol (2017) ;198: :824–31. |
[28] | Ravvaz K , Weissert JA , Downs TM , American Urological Association Nonmuscle Invasive Bladder Cancer Risk Model Validation-Should Patient Age be Added to the Risk Model? J Urol (2019) ;202: :682–8. |
[29] | Ritch CR , Velasquez MC , Kwon D , Becerra MF , Soodana-Prakash N , Atluri VS , et al. Use and Validation of the AUA/SUO Risk Grouping for Nonmuscle Invasive Bladder Cancer in a Contemporary Cohort, J Urol. (2020) ;203: :505–11. |
[30] | Sylvester RJ , Rodriguez O , Hernandez V , Turturica D , Bauerova L , Bruins HM , et al. European Association of Urology (EAU) Prognostic Factor Risk Groups for Non-muscle-invasive Bladder Cancer (NMIBC) Incorporating the WHO /and WHO Classification Systems for Grade: An Update from the EAU NMIBC Guidelines Panel, Eur Urol (2021) ;79: :480–8. |
[31] | Vedder MM , Marquez M , de Bekker-Grob EW , Calle ML , Dyrskjot L , Kogevinas M , et al. Risk prediction scores for recurrence and progression of non-muscle invasive bladder cancer: an international validation in primary tumours, PLoS One.e (2014) ;9: :96849. |
[32] | Xu T , Zhu Z , Zhang X , Wang X , Zhong S , Zhang M , et al. Predicting recurrence and progression in Chinese patients with nonmuscle-invasive bladder cancer using EORTC and CUETO scoring models, Urology (2013) ;82: :387–93. |
[33] | Xylinas E , Kent M , Kluth L , Pycha A , Comploj E , Svatek RS , et al. Accuracy of the EORTC risk tables and of the CUETO scoring model to predict outcomes in non-muscle-invasive urothelial carcinoma of the bladder, Br J Cancer (2013) ;109: :1460–6. |
[34] | Zhang G , Steinbach D , Grimm MO , Horstmann M . Utility of the EORTC risk tables and CUETO scoring model for predicting recurrence and progression in non-muscle-invasive bladder cancer patients treated with routine second transurethral resection, World J Urol (2019) ;37: :2699–705. |
[35] | Ngwa JS , Cabral HJ , Cheng DM , Pencina MJ , Gagnon DR , LaValley MP , et al. A comparison of time dependent Cox regression, pooled logistic regression and cross sectional pooling with simulations and an application to the Framingham Heart Study, BMC Med Res Methodol (2016) ;16: :148. |
[36] | Alba AC , Agoritsas T , Walsh M , Hanna S , Iorio A , Devereaux PJ , et al. Discrimination and Calibration of Clinical Prediction Models: Users’ Guides to the Medical Literature, JAMA (2017) ;318: :1377–84. |
[37] | Kamat AM , Sylvester RJ , Bohle A , Palou J , Lamm DL , Brausi M , et al. Definitions, End Points, and Clinical Trial Designs for Non-Muscle-Invasive Bladder Cancer: Recommendations From the International Bladder Cancer GrouJ Clin Oncol (2016) ;34: :1935–44. |
[38] | Subiela JD , Palou J , Esquinas C , Fernandez Gomez JM , Rodriguez Faba O , Clinical usefulness of random biopsies in diagnosis and treatment of non-muscle invasive bladder cancer: Systematic review and meta-analysis, Actas Urol Esp (Engl Ed) (2018) ;42: :285–98. |
[39] | Subiela JD , Rodriguez Faba O , Aumatell J , Calderon J , Mercade A , Balana J , et al. Contemporary outcomes of bladder carcinoma in situ treated with an adequate bacille Calmette-Guerin immunotherapy, BJU Int (2022) ;129: :542–50. |
[40] | Subiela JD , Faba OR , Aumatell J , Krajewski W , Calderon J , Parada R , et al. Impact of clinical and pathological subtypes of carcinoma in situ (CIS) of the bladder: Lessons learned from long-term follow-up of a series of CIS patients treated with BCG, Urol Oncol (2022) ;40: :9 e–e17. |
[41] | Jobczyk M , Stawiski K , Kaszkowiak M , Rajwa P , Rozanski W , Soria F , et al. Deep Learning-based Recalibration of the CUETO and EORTC Prediction Tools for Recurrence and Progression of Non-muscle-invasive Bladder Cancer, Eur Urol Oncol (2022) ;5: :109–12. |
[42] | Cho BJ , Kim KM , Bilegsaikhan SE , Suh YJ ,. Machine learning improves the prediction of febrile neutropenia in Korean inpatients undergoing chemotherapy for breast cancer, Sci Rep (2020) ;10: :14803. |
[43] | Hedegaard J , Lamy P , Nordentoft I , Algaba F , Hoyer S , Ulhoi BP , et al. Comprehensive Transcriptional Analysis of Early-Stage Urothelial Carcinoma, Cancer Cell (2016) ;30: :27–42. |
[44] | Lindskrog SV , Prip F , Lamy P , Taber A , Groeneveld CS , Birkenkamp-Demtroder K , et al. An integrated multi-omics analysis identifies prognostic molecular subtypes of non-muscle-invasive bladder cancer, Nat Commun (2021) ;12: :2301. |


