
Cost of Care in Open Cystectomy Patients Across Time and Space: Does it matter?
Abstract
BACKGROUND:
Many variables may affect the cost of open radical cystectomy (RC) care, including surgical approach, diversion type, patient comorbidities, and postoperative complications.
OBJECTIVE:
To determine factors associated with changes in cost of care following open radical cystectomy (ORC) for bladder cancer using the National Inpatient Sample (NIS).
METHODS:
Patients in the NIS with a diagnosis of bladder cancer who underwent ORC with ileal conduit from 2012–2017 using ICD-9-CM and ICD-10-CM codes were identified. Baseline demographics including age, race, region, postoperative complications, and length of stay were obtained. Univariable and multivariable logistic regression were used to identify factors associated with cost variation including demographics, clinical characteristics, surgical factors, and discharge quarter (Q1-Q4).
RESULTS:
5,189 patients were included in the analysis, with 4,379 at urban teaching hospitals. On multivariable regression analysis, female sex [$1,734 ($1,024–2,444) p < 0.001)], a greater Elixhauser comorbidity score [$93 ($62–124), p < 0.001], presence of any inpatient complication [$1,531 ($894–2,168), p < 0.001], and greater length of stay [$1,665 ($1,536–1,793), p < 0.001] were associated with a greater cost of hospitalization. Discharge in Q3 (July to September) relative to Q2 (April to June) was associated with a higher cost [$1,113 ($292–1,933), p = 0.008. Trends were similar at urban non-teaching and rural hospitals, except discharge quarter was not associated with a significant change in cost.
CONCLUSIONS:
Significant differences in cost of ORC with ileal conduit exist with respect to patient sex, medical comorbidities, and discharge timing. These differences may relate to greater disease burden in female patients, patient complexity, and variation in postoperative care in academic programs.
INTRODUCTION
The direct medical costs of cancer care in the United States (US) alone were estimated at approximately $125 billion in 2010 [1]. Accounting for evolving population demographics and epidemiological trends in cancer, this price tag is expected to rise to over $155 billion within the next few years. Bladder cancer imposes a significant financial burden on the health care system and the individual, as it is one of the costliest cancers to treat on a per patient basis with an estimated cost of care of $6 billion in 2020 and a majority of this cost is attributed to non-muscle invasive cancer [1–3]. For patients with muscle-invasive disease, the most expensive component of this cost often comes from the hospitalization event for radical cystectomy (RC) and urinary diversion [4].
Many variables may affect the cost of RC care, including surgical approach, diversion type, patient comorbidities, and postoperative complications. Regional variations in cost of RC have also been reported, which suggests that cost of living and other geographic differences in healthcare delivery may also impact cost [5]. It is documented that minimally-invasive techniques are costlier than open RC (ORC) by nearly $4,000 [6]. Similarly, the cost of continent urinary diversions increases inpatient charges by over $4,500 [7]. The primary purpose of this study is to identify differences in cost of RC hospitalization attributable to patient, hospital type, and temporal characteristics. Specifically, our study aimed to characterize differences in cost and complications across teaching and non-teaching hospitals.
MATERIALS AND METHODS
Data source
Patients with bladder cancer undergoing ORC were identified in the National Inpatient Sample (NIS) of the Health Care Utilization Project (HCUP) from 2012 to 2017 [8]. This was deemed IRB exempt by our institution. The NIS dataset is the largest national all-payer inpatient database in the US and samples from hospitals comprising 97%of all discharges in the US. NIS data is de-identified and does not contain protected health information or specific hospital identifiers, and qualified for exemption from the institutional review board at our institution.
Patient selection and outcomes
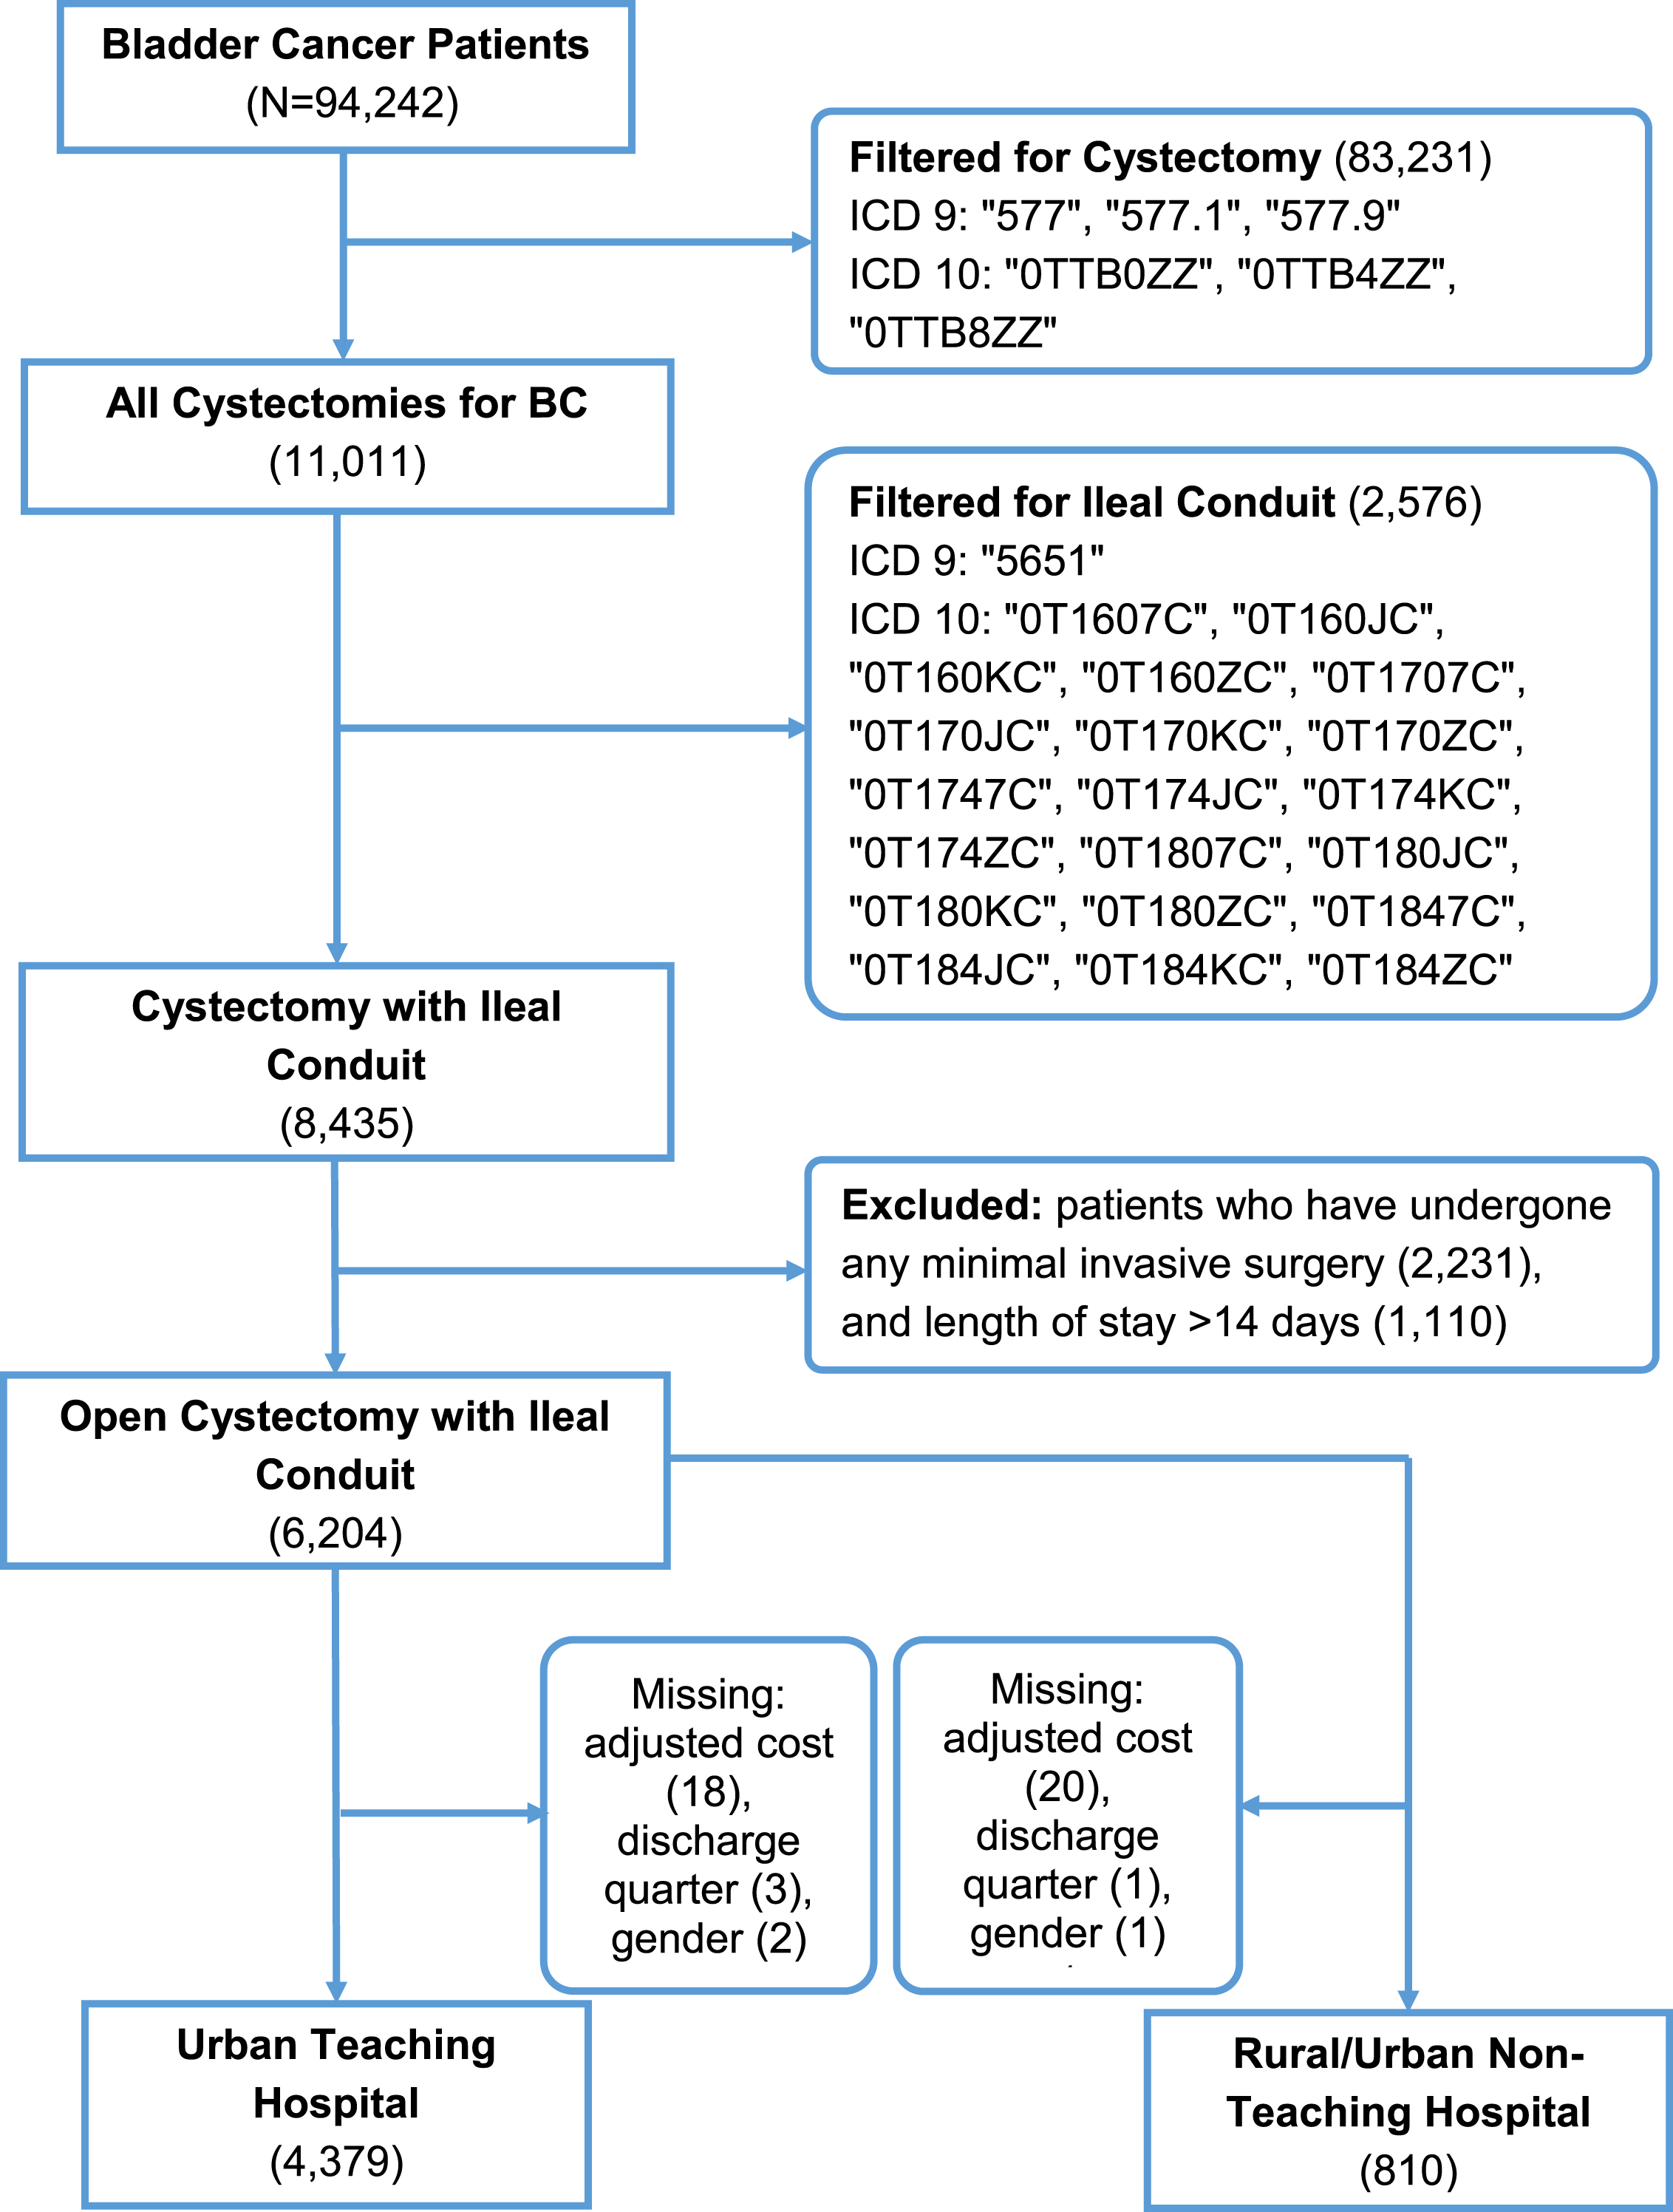
Each NIS dataset from 2012 to 2017 was queried for the International Classification of Disease (ICD)-9 or ICD-10 diagnosis codes for bladder cancer as defined in Supplemental Table 1 (N = 94,242). ICD-9 and ICD-10 procedure codes were used to identify patients over the age of 18 years who had undergone ORC (N = 11,011) with ileal conduit (N = 8,435). Because of the known increases in cost with continent urinary diversion (N = 2,576) and minimally-invasive surgeries (N = 2,231), these groups were excluded to standardize operative costs and focus on identifying clinical factors affecting cost. We excluded patients with a length of stay greater than 14 days or who fell outside the±2.5 the median absolute deviation (MAD) from the median (median = 7, MAD = 2.965; N = 1,110) as recommended by Leys et al. to assess the typical cost of hospitalization following ORC [9]. Patients with missing information were excluded. A total of 4,379 patients were in the primary analysis based on inclusion criteria (Fig. 1). A secondary analysis was performed on an additional group of patients discharged from an urban nonacademic center or rural teaching institution (N = 810) as these centers were less likely to consistently perform more than ten RCs per year [10, 11].
Fig. 1
Patient selection flowchart from the NIS data from 2012–2017.
Our primary outcome was the adjusted total cost per hospitalization, calculated by multiplying the charges that hospitals billed for services in the NIS data by the cost-to-charge ratio (CCR), a validated method by the Agency for Healthcare Research and Quality and used by previous studies to estimate to estimate actual hospitalization cost [6–8]. Adjusted hospital cost and hospital charges were rounded to the nearest dollar.
Covariables
The following clinically relevant variables were identified from the NIS data. Patient demographic information, including age (years; continuous), sex (male, female), race (white, African American, Other/Unknown) and insurance type (Medicaid, Medicare, private, self-pay, unknown) was obtained. Similarly, length of stay (days; continuous) and hospital region in the US (East North Central, East South Central, Mid-Atlantic, Mountain, New England, Pacific, South Atlantic, West North Central, West South Central) were identified. The Elixhauser comorbidity score, a method developed by Elixhauser et al. in 1998 used to estimate the burden of a patient’s comorbidities using ICD-9 and ICD-10 codes, was utilized as a measure of patient medical complexity [8, 12]. Discharge quarter was defined as date of discharge and categorized as: Q1 –January to March, Q2 –April to June, Q3 –July to September, and Q4 –October to December. Finally, ICD-9 and ICD-10 diagnosis and procedure codes were used to identify patients who experienced any inpatient complications (yes/no).
Statistical analysis
Descriptive statistics were reported as medians (interquartile range) for continuous variables and numbers (percentages) for categorical variables. Q2 was used as the reference discharge quarter as it was the closest to the median adjusted total cost. Univariable and multivariable logistic regression of all previously described features were used to identify predictors associated with greater adjusted hospital cost. As an additional sensitivity analysis, we also conducted a linear regression analysis for patients at urban non-teaching or rural hospitals. All statistical analyses were performed using R (version 3.6.3, The R Foundation, Vienna, Austria). P≤0.05 was considered to be statistically significant.
RESULTS
Of the 4,379 patients analyzed in the primary study population, the median age was 70 years with 80.0%White and 78.6%male patients, and there was a relatively equal distribution of patients by teaching vs non-teaching hospitals. ( Table 1, Supplemental Figure 1). The median cost of ORC hospitalization in this population was $25,276. There was a wide range of median ORC cost across different regions of the US, ranging from $19,916 in the East South Central region to $38,519 in the Pacific region. Results of univariable and multivariable linear regression are shown in Figure 2 and Table 2. Using multivariable regression analysis to compare the effect of each variable, female sex was associated with a $1,734 increase in cost for ORC care compared to male sex [($1,024–2,444), p < 0.001], and patients identified as Other race compared with White had a $2,728 increase in cost [($1,870–3,586), p < 0.001] ( Figure 2). Patients with a greater Elixhauser comorbidity score [$93 ($62–124), p < 0.001], any inpatient complication [$1,531 ($894–2,168), p < 0.001], and longer length of stay [$1,665 per day ($1,536–1,793), p < 0.001] were also associated with a higher ORC cost (Fig. 2). Patients discharged in Q3 [$1,113 ($292–1,933), p = 0.026] had a higher ORC cost compared with patients discharged in Q2. There was no association between cost and discharge in Q1 compared with Q2. Increasing age was associated with a small decrease in ORC cost [–$75 per year (–$114 to –36), p < 0.001].
Table 1
Patient demographics at urban teaching hospitals
| N | Median Adjusted Cost, $ (IQR) | |
| Total Population | 4,379 | |
| Age in Years, median (IQR) | 70 (63–76) | 25,276 (13,513) |
| Race, N (%) | ||
| White | 3,502 (80.0) | 24,876 (13,363) |
| African American | 242 (5.5) | 26,537 (15,251) |
| Other/Unknown | 635 (14.5) | 26,296 (14,022) |
| Sex, N (%) | ||
| Male | 3,441 (78.6) | 24,871 (12,976) |
| Female | 938 (21.4) | 26,655 (14,684) |
| Discharge quarter, N (%) | ||
| Q2 (Apr-Jun) | 1,088 (24.8) | 24,919 (12,193) |
| Q3 (Jul-Sep) | 1,083 (24.7) | 25,616 (14,170) |
| Q4 (Oct-Dec) | 1,143 (26.1) | 25,423 (13,242) |
| Q1 (Jan-Mar) | 1,065 (24.3) | 25,134 (14,137) |
| Insurance, N (%) | ||
| Medicaid | 219 (5.0) | 26,614 (14,524) |
| Medicare | 2,877 (65.7) | 25,475 (13,611) |
| Private | 1,104 (25.2) | 24,630 (12,869) |
| Self-Pay | 63 (1.4) | 24,852 (10,535) |
| Unknown | 116 (2.6) | 25,040 (12,188) |
| AHRQ Elixhauser Score, median (IQR) | 6 (0–14) | |
| Length of Stay in Days, median (IQR) | 7 (6–9) | |
| Inpatient Complication, N (%) | ||
| No Inpatient Complication | 2,190 (50.0) | 23,420 (11,230) |
| Any Inpatient Complication | 2,189 (50.0) | 27,407 (15,093) |
| Region, N (%) | ||
| East North Central | 679 (15.5) | 25,788 (11,300) |
| East South Central | 370 (8.4) | 19,916 (9,955) |
| Mid-Atlantic | 680 (15.5) | 25,090 (14,457) |
| Mountain | 215 (4.9) | 24,468 (9,746) |
| New England | 278 (6.3) | 31,944 (15,071) |
| Pacific | 440 (10.0) | 38,519 (20,392) |
| South Atlantic | 831 (19.0) | 23,473 (10,506) |
| West North Central | 407 (9.3) | 22,692 (10,066) |
| West South Central | 479 (10.9) | 23,734 (10,210) |
Fig. 2
Patient Characteristics (A) Teaching (B) Non-Teaching Hospitals
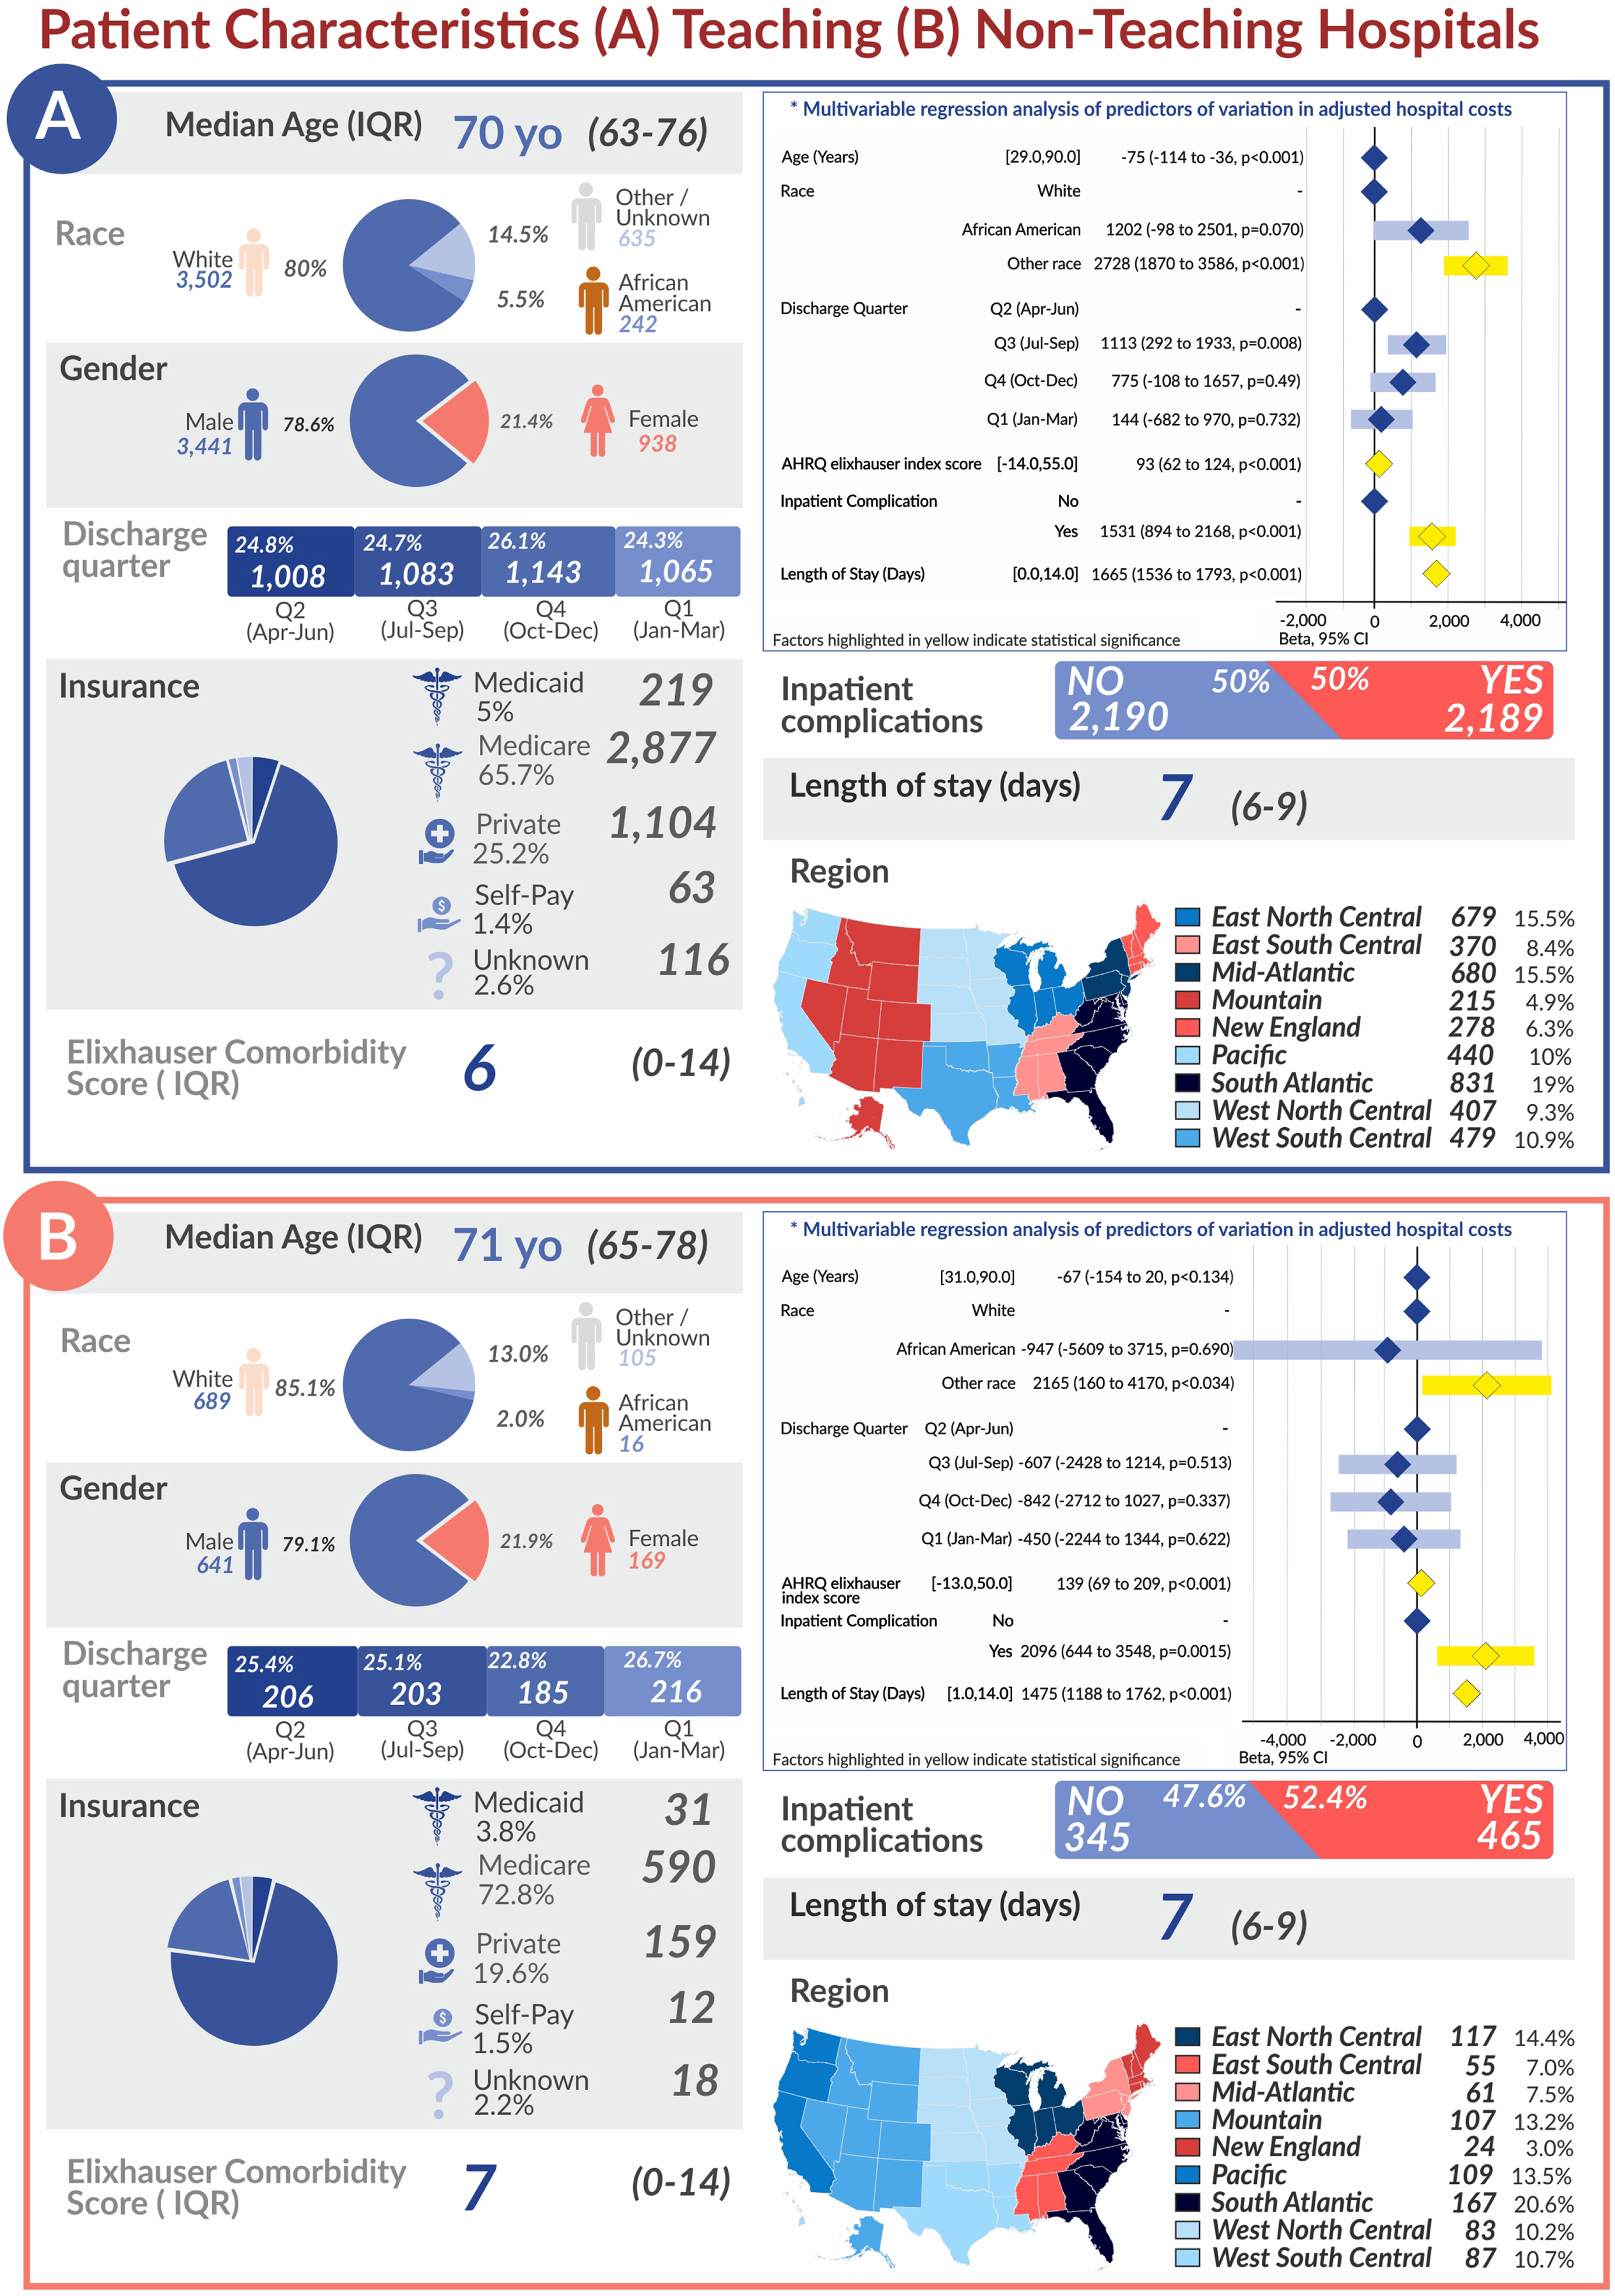
Table 2
Linear regression analysis of patient and hospital factors associated with cost variation at urban teaching hospitals
| Univariable Analysis | Multivariable Analysis | |||||
| Coefficient ($) | 95%CI | p | Coefficient ($) | 95%CI | p | |
| Age (Years) | ||||||
| 14 | –23 to 51 | 0.464 | –75 | –114 to –36 | < 0.001 | |
| Race | ||||||
| White | Reference | Reference | ||||
| African American | 1469 | –98 to 3037 | 0.066 | 1202 | –98 to 2501 | 0.07 |
| Other race | 2719 | 1702 to 3736 | < 0.001 | 2728 | 1870 to 3586 | < 0.001 |
| Gender | ||||||
| Male | Reference | Reference | ||||
| Female | 2224 | 1355 to 3092 | < 0.001 | 1734 | 1024 to 2444 | < 0.001 |
| Discharge Quarter | ||||||
| Q2 (Apr-Jun) | Reference | Reference | ||||
| Q3 (Jul-Sep) | 1252 | 237 to 2267 | 0.016 | 1113 | 292 to 1933 | 0.008 |
| Q4 (Oct-Dec) | 1081 | 79 to 2082 | 0.034 | 775 | –108 to 1657 | 0.49 |
| Q1 (Jan-Mar) | 690 | –330 to 1709 | 0.185 | 144 | –682 to 970 | 0.732 |
| Insurance | ||||||
| Medicaid | Reference | Reference | ||||
| Medicare | –1301 | –2958 to 356 | 0.124 | 1513 | 17 to 3010 | 0.047 |
| Private Insurance | –2149 | –3898 to –400 | 0.016 | 1193 | –244 to 2630 | 0.104 |
| Self-Pay | –2641 | –6021 to 739 | 0.126 | –375 | –3116 to 2366 | 0.789 |
| Unknown | –2475 | –5190 to 240 | 0.074 | 42 | –2182 to 2266 | 0.97 |
| AHRQ Elixhauser Score | ||||||
| 200 | 164 to 236 | < 0.001 | 93 | 62 to 124 | < 0.001 | |
| Inpatient Complications | ||||||
| 4844 | 4144 to 5545 | < 0.001 | 1531 | 894 to 2168 | < 0.001 | |
| Length of Stay (Days) | ||||||
| 1866 | 1732 to 2001 | < 0.001 | 1665 | 1536 to 1793 | < 0.001 | |
| Region | ||||||
| East North Central | Reference | Reference | ||||
| East South Central | –6213 | –7592 to –4833 | < 0.001 | –6064 | –7301 to –4827 | < 0.001 |
| Mid-Atlantic | –656 | –1814 to 502 | 0.266 | –923 | –1963 to 116 | 0.082 |
| Mountain | –1761 | –3431 to –90 | 0.039 | –1130 | –2630 to 369 | 0.139 |
| New England | 6289 | 4769 to 7809 | < 0.001 | 6399 | 5037 to 7760 | < 0.001 |
| Pacific | 13157 | 11850 to 14463 | < 0.001 | 13242 | 12062 to 14422 | < 0.001 |
| South Atlantic | –3115 | –4219 to –2010 | < 0.001 | –2771 | –3761 to –1780 | < 0.001 |
| West North Central | –3603 | –4941 to –2265 | < 0.001 | –3844 | –5072 to –2617 | < 0.001 |
| West South Central | –2799 | –4073 to –1525 | < 0.001 | –2347 | –3495 to –1200 | < 0.001 |
Among the 810 additional patients who underwent ORC at an urban non-teaching or rural hospital, the median age was 71 years with 85.1%White and 79.1%male patients (Supplemental Table 2). Univariable and multivariable regression analyses are shown in Supplemental Table 3. The median cost of ORC hospitalization was $22,808 in this population. Again on multivariable analysis, the East South Central region had the lowest median ORC cost ($17,844) and the Pacific region had the highest median cost ($30,240). Female gender [$2,172 ($551–3,792), p =0.009], Other race [$2,165 ($120–4,170), p = 0.034], greater Elixhauser comorbidity score [$139 ($69–209), p < 0.001], presence of inpatient complication [$2,096 ($644–3,548), p = 0.005], and greater length of stay [$1,475 per day ($1,168–1,762), p < 0.001] were similarly associated with a greater cost of ORC care (Fig. 2). However, no significant difference was found in adjusted cost based on discharge quarter. Of note, there was a higher incidence of inpatient complications in ORC performed at urban non-teaching and rural hospitals (57.4%) compared to urban teaching hospitals (50.0%).
COMMENT
RC is the gold standard for treatment of non-metastatic muscle-invasive bladder cancer and select patients with high risk non-muscle invasive bladder cancer [13]. Proposed factors affecting cost of RC can be attributed to patient, surgeon, and hospital characteristics [10, 14, 15]. Higher volume surgeons and hospitals, generally defined as those with greater than ten RC per year, have better outcomes postoperatively and report lower rates of mortality and complications [11, 14, 15]. Though these outcomes can be attributed to surgical technique and hospital resources, the greatest variability in index hospitalization cost of RC has been ascribed to postoperative complications.
Interestingly, this study found disparities between cost of ORC based on patient sex with a $1,734 increase in cost per hospitalization at urban teaching facilities and $2,172 increase at non-teaching and rural facilities for female compared to male patients. The increased cost may stem from differences in the actual surgery performed, such as need for anterior exenteration. Prior research by C
The current study also showed increased adjusted cost of ORC in patients with greater medical complexity, as measured by the Elixhauser comorbidity score, and patients with any complication during admission for ORC. This is congruent with existing literature that found patients with greater comorbidities tend to have greater morbidity, higher rates of readmission, and higher 90-day costs following RC [21, 22]. Though the difference in cost on multivariable regression was marginal for each single point increase in score ($93 for urban teaching hospitals and $139 for urban non-teaching and rural hospitals), a patient with several comorbidities may easily increase the cost of ORC care by several hundred dollars. Managing complex patients may pose a challenge to trainees and lead to greater use of consulting services and diagnostic tests. Complication rates following cystectomy remain high at around 50%following RC regardless of surgical route [6, 15, 23]. However, enhanced recovery after surgery (ERAS) protocols can limit reactive measures and over-management of patients by reducing variance in the perioperative period and lower complication rates [23–25]. Its effect on overall costs appears mixed however, with an average cost savings of $4,488 per RC hospitalization compared with standard management reported by some groups, and no difference in cost reported at another single specialty cancer center [23, 24, 26].
Our results also showed a borderline statistically significant difference in cost of ORC between Q2 and Q3 at urban academic centers. While it is difficult to pinpoint all factors influencing this result without additional study, one possibility relates to trainee experience as there is frequently a large of trainees at academic hospitals during Q3. Our analysis of non-teaching and rural hospitals, where fewer trainees are present, did not show a significant cost difference between discharges in Q3 compared to Q2. The “July Effect” has been used to describe the transition period at the start of each academic year when the average experience level of a teaching hospital declines suddenly [27]. Little data exists on how trainee involvement affects perioperative management, but overutilization of laboratory and imaging tests by trainees can increase cost of care [28, 29]. Interventions such as cost reminders within the electronic health system, teaching, and audit/feedback can reduce avoidable testing. ERAS protocols may be another method of reducing variability in diagnostic testing.
Our data showed a statistically significant decrease in cost by $75 with each single year increase in age in the primary analysis population. This change appears counterintuitive when taken in isolation, but may not capture the variability in patient health status at different ages and seems less clinically significant compared to other factors previously mentioned. Finally, there was a wide range of ORC care costs across different regions of the US. It is beyond the scope of this study to identify regional practice patterns and patient populations that may account for these differences and NIS data does not link patients to specific hospitals, but this may be an interesting basis for future study.
This study has several limitations, including retrospective design and the use of NIS data. The NIS is a cross-sectional dataset and does not divulge differences in operative technique (such as organ-sparing, lymph node dissection, or trainee involvement), whether ERAS protocols were utilized, or severity of disease. This data does not include long-term complications following the index hospitalization. Though we limited the primary analysis to urban teaching hospitals, the NIS does not link patient data to specific surgeons or hospitals which may affect cost depending on surgical volume. Other factors may account for temporal differences in adjusted cost such as timing of initial presentation and seasonal referral patterns by primary care providers. Different hospitals may also have different coding practices that do not allow direct comparison of costs involved, and coding errors may cause discrepancies in data. However, we also consider NIS data to be a strength of this study as it is the largest all-payer inpatient observational database, which provides reliable cost information and is used to guide healthcare policy.
CONCLUSIONS
We conducted an analysis of over 5,000 representative patients in the US to identify clinical predictors of cost variation during hospitalization for ORC and ileal conduit. This study demonstrates that mean adjusted total cost following ORC at urban academic institutions is significantly higher in patients who are female, have greater comorbid conditions, have any inpatient complication following ORC, and those discharged in July to December. Female patients appear to be disproportionately affected by medical complications following ORC which may increase cost of care by nearly $2,000. Implementation of and training on ERAS protocols may help reduce variability in costs while preserving high quality care.
ACKNOWLEDGMENTS
The authors have no acknowledgments.
FUNDING
The authors report no funding
AUTHOR CONTRIBUTIONS
Conceptualization -Helen H Sun MD, Adam Calaway MD MPH; Data Analysis -Amr Mahran MD MS; Investigation -Amr Mahran MD MS, Megan Prunty MD; Methodology -Laura Bukavina MD MPH, Amr Mahran MD MS; Project Administration -Adam Calaway MD MPH,Supervision-Lee Ponsky MD, Laura Bukavina MD MPH; Visualization -Ilaha Isali MD, Laura Bukavina MD MPH; Writing-Original Draft-Helen H Sun MD, Laura Bukavina MD MPH, Ilaha Isali MD; Writing-Review & Editing-Kevin Ginsburg MD, MS; Sarah Markt ScD MPH; Adam Calaway MD MPH, Laura Bukavina MD MPH
CONFLICT OF INTEREST
Helen H. Sun, Megan Prunty, Ilaha Isali, Amr Mahran, Kevin Ginsburg, Sarah Markt, Lee Ponsky, Adam Calaway and Laura Bukavina have no conflicts of interest to report.
SUPPLEMENTARY MATERIAL
[1] The supplementary material is available in the electronic version of this article: https://dx.doi.org/10.3233/BLC-211580.
REFERENCES
[1] | Mariotto A , Robin Yabroff K , Shao , et al. Projections of the cost ofcancer care in the United States: 2010–2020. Journal of theNational Cancer Institute. (2011) ;103: (2):117–128. https://doi.org/10.1093/jnci/djq495. 21 Jul 2020. |
[2] | Botteman M , Pashos C , Redaelli A , et al. The health economics of bladder cancer. PharmacoEconomics. (2003) ;21: (18):1315–1330. https://doi.org/10.1007/BF03262330. 14 Jun 2020. |
[3] | Mossanen M , Gore J . The burden of bladder cancer care: direct and indirect costs. Current Opinion in Urology. (2014) ;24: (5):487–491. https://doi.org/10.1097/MOU.0000000000000078. 14 Jun 2020. |
[4] | Williams S , Shan Y , Ray-Zack M , et al. Comparison of costs of radical cystectomy vs trimodal therapy for patients with localized muscle-invasive bladder cancer. JAMA Surgery. (2019) ; 154: (8):1–9. https://doi.org/10.1001/jamasurg.2019.1629. 18 Nov 2020. |
[5] | Khanna A , Saarela O , Lawson K , et al. Hospital quality metrics for radical cystectomy: disease specific and correlated to mortality outcomes. The Journal of Urology. (2019) ; 202: (3):490–497. . https://doi.org/10.1097/JU.0000000000000282. 21 Jul 2020. |
[6] | Yu H , Hevelone N , Lipsitz S , et al. Comparative analysis of outcomes and costs following open radical cystectomy versus robot-assisted laparoscopic radical cystectomy: Results from the US Nationwide Inpatient Sample. European Urology. (2012) ; 61: (6):1239–1244. https://doi.org/10.1016/j.eururo.2012.03.032. 20 Dec 2020. |
[7] | Joice G , Chappidi M , Patel H , et al. Hospitalisation and readmission costs after radical cystectomy in a nationally representative sample: does urinary reconstruction matter? BJU International (2018) ; 122: (6):1016–1024. https://doi.org/10.1111/bju.14448. 20 Dec 2020. |
[8] | Agency for Healthcare Research andQuality, Rockville MD , (2020). Cost-to-Charge Ratio Files. Retrieved June 2020, from Healthcare Cost and Utilization Project (HCUP). http://www.hcup-us.ahrq.gov/db/state/costtocharge.jsp. 14 Jun 2020. |
[9] | Leys C , Ley C , Klein O , et al. Detecting outliers: Do not use standard deviation around the mean, use absolute deviation around the median. Journal of Experimental Social Psychology. (2013) ;49: (4):764–766. https://doi.org/10.1016/J.JESP.2013.03.013. 14 Jun 2020. |
[10] | Leow J , Reese S , Trinh Q-D , et al. Impact of surgeon volume on the morbidity and costs of radical cystectomy in the USA: a contemporary population-based analysis. BJU International. (2015) ; 115: :713–721. https://doi.org/10.1111/bju.12749. 14 Jun 2020. |
[11] | Herr H , Lee C , Chang S , Lerner S , Standardization of radical cystectomy and pelvic lymph nodedissection for bladder cancer: A collaborative group report. Journalof Urology (2004) ;171: (5):1823–1828. https://doi.org/10.1097/01.ju.0000120289.78049.0e. 20 Dec 2020. |
[12] | Elixhauser A , Steiner C , Harris D , Coffey R , Comorbidity Measures for Use with Administrative Data. Medical Care. (1998) ;36: (1):8–27. https://doi.org/10.1097/00005650-199801000-00004. 14 Jun 2020. |
[13] | Spiess P , Agarwal N , Bangs R , et al. Bladder Cancer,Version 5.2017, NCCN Clinical Practice Guidelines in Oncology. J Natl Compr Canc Netw (2017) ; 15: (10):1240–1267. https://doi.org/10.6004/jnccn.2017.0156. 14 Jun 2020. |
[14] | Leow J , Cole A , Seisen T , et al. Variations in the Costs of Radical Cystectomy for Bladder Cancer in the USA. European Urology. 2017;1-9. https://doi.org/10.1016/j.eururo.2017.07.016. 14 Jun 2020. |
[15] | Liaw C , Winoker J , Wiklund P , et al. The clinical and economic burden of perioperative complications of radical cystectomy. Translational Andrology and Urology. (2019) ; 8: (Suppl 3):S277–S279. . https://doi.org/10.21037/tau.2019.03.04. 14 Jun 2020. |
[16] | Cárdenas-Turanzas M , Cooksley C , Kamat A , et al. Gender and age differences in blood utilization and length of stayin radical cystectomy: A population-based study. InternationalUrology and Nephrology (2008) ;40: (4):893–899. https://doi.org/10.1007/s11255-008-9351-x. 23 Jul 2020. |
[17] | Scosyrev E , Golijanin D , Wu G , Messing E , The burden of bladder cancer in men and women: Analysis of the years of life lost. BJU International (2012) ;109: (1):57–62. https://doi.org/10.1111/j.1464-410X.2011.10318.x. 29 Jul 2020. |
[18] | Kluth L , Rieken M , Xylinas E , et al. Gender-specific differences in clinicopathologic outcomes following radical cystectomy: An international multi-institutional study of more than patients. European Urology (2014) ;66: (5):913–919. https://doi.org/10.1016/j.eururo.2013.11.040. 29 Jul 2020. |
[19] | Santos F , Dragomir A , Kassouf W , et al. Urologist referral delay and its impact on survival after radical cystectomy for bladder cancer. Current Oncology (2015) ;22: (1):e20–e26. https://doi.org/10.3747/co.22.2052. 14 Jun 2020. |
[20] | Bukavina L , Mishra K , Mahran A , et al. Gender Disparity in Cystectomy Postoperative Outcomes: Propensity Score Analysis of the National Surgical Quality Improvement Program Database. European Urology Oncology. 2019; https://doi.org/10.1016/j.euo.2019.04.004. 29 Jul 2020. |
[21] | Osawa T , Lee C , Abe T , et al. A multi-center international study assessing the impact of differences in baseline characteristics and perioperative care following radical cystectomy. Bladder Cancer (2016) ;2: (2):251–261. https://doi.org/10.3233/BLC-150043. 14 Jun 2020. |
[22] | Mossanen M , Krasnow R , Lipsitz S , et al. Associations of specific postoperative complications with costs after radical cystectomy. BJU International. (2018) ;121: :428–436. https://doi.org/10.1111/bju.14064. 14 Jun 2020. |
[23] | Tyson M , Chang S , Enhanced Recovery Pathways Versus Standard Care After Cystectomy: A Meta-analysis of the Effect on Perioperative Outcomes. European Urology. (2016) ;70: (6):995–1003. https://doi.org/10.1016/j.eururo.2016.05.031. 14 Jun 2020. |
[24] | Nabhani J , Ahmadi H , Schuckman A , et al. Cost Analysis of the Enhanced Recovery After Surgery Protocol in Patients Undergoing Radical Cystectomy for Bladder Cancer. European Urology Focus. (2016) ;2: (1):92–96. https://doi.org/10.1016/j.euf.2015.06.009. 14 Jun 2020. |
[25] | Williams S , Cumberbatch A , Kamat A , et al. Reporting radical cystectomy outcomes following implementation of enhanced recovery after surgery protocols: A systematic review and individual patient data meta-analysis. European Urology. (2020) ;78: (5):719–730. https://10.1016/j.eururo.2020.06.039. 22 Jul 2020. |
[26] | Chipollini J , Tang D , Hussein K , et al. Does Implementing an Enhanced Recovery After Surgery Protocol Increase Hospital Charges? Comparisons From a Radical Cystectomy Program at a Specialty Cancer Center. Urology. (2017) ;105: :108–112. https://doi.org/10.1016/j.urology.2017.03.023. 20 Dec 2020. |
[27] | Young J , Ranji S , Wachter R , et al. “July Effect”: Impact of the Academic Year-End Changeover on Patient Outcomes. Annals of Internal Medicine. (2011) ;155: (5):309–315.. https://doi.org/10.7326/0003-4819-155-5-201109060-00354. 14 Jun 2020. |
[28] | Melendez-Rosado J , Thompson KM , Cowdell JC , et al. Reducing unnecessary testing: an intervention to improve resident ordering practices. Postgraduate Medical Journal (2017) ;93: (1102):476–479. |
[29] | Vidyarthi AR , Hamill T , Green AL , Rosenbluth G , Baron RB . Changing resident test ordering behavior: a multilevel intervention to decrease laboratory utilization at an academic medical center. American Journal of Medical Quality. (2015) ;30: (1):81–87. |

