
Identification of a Novel Ferroptosis-Related Gene Signature for Prediction of Prognosis in Bladder Urothelial Carcinoma
Abstract
BACKGROUND:
sBladder urothelial carcinoma is the most prevalent type of bladder cancer, characterized by drug resistance, high recurrence rate, and unfavorable prognosis. Ferroptosis is a newly discovered type of non-apoptotic cell death, which has been reported to be strongly correlated with tumor occurrence and development.
OBJECTIVE:
In this study, we characterized ferroptosis-specific biomarkers to elucidate the association between ferroptosis-related genes (FRGs) and bladder urothelial carcinoma.
METHODS:
The TCGA and GEO database were adopted to obtain data and corresponding clinicopathological information. Univariate and multivariate cox regression were performed to establish a ferroptosis-related model. Besides, the KM plot visualized prognosis between high risk and low risk groups. Moreover, cBioportal platform was used to gather information on genetic alteration and DNA methylation of hub FRGs in BLCA patients. Additionally, the GSEA software was used to detect the difference in gene expression between high-risk and low-risk subgroups.
RESULTS:
Six ferroptosis-related genes were identified to be highly correlated with overall survival. Besides, we explored the genetic variations of these FRGs, as well as the correlation between FRG expression and copy number values. Additionally, the DNA methylation status of these FRGs was determined. Moreover, we constructed a ferroptosis risk model with the six FRGs to predict the prognosis of BLCA. The results demonstrated that a higher risk score indicated an unfavorable prognosis. The ferroptosis signature was associated with clinical and molecular characteristics and could be regarded as an independent prognostic factor for BLCA patients.
CONCLUSIONS:
In summary, we established and verified a ferroptosis risk model which had the potential to independently predict the prognosis of bladder urothelial carcinoma.
INTRODUCTION
Bladder cancer is one of the most common malignant tumors of the genitourinary system, and ranks sixth among cancers in the United States. It is estimated that there will be 80,470 new cases of bladder cancer in the United States in 2019. Additionally, the projected number of deaths is expected to be approximately 17,670 during the same period. As reported in the existing literature, the morbidity of bladder cancer in men is four times higher than that in women [1]. Chinese individuals are commonly exposed to occupational carcinogens, which are independent risk factors for bladder cancer. According to the latest report in China, age-standardized incidence rates have significantly increased in men over the past two decades [2]. The main pathological classification of bladder cancer can be divided into the following three categories: bladder squamous cell carcinoma, bladder urothelial carcinoma (BLCA), and bladder adenocarcinoma [3, 4]. The main pathological type of bladder cancer is BLCA, which is characterized by drug resistance, high recurrence rate, and poor prognosis [5, 6]. However, traditional clinicopathological risk assessments can no longer meet the pressing need for effective identification of high-risk patients with BLCA and prediction of prognosis. Therefore, it is crucial to identify favorable biomarkers and to investigate their prognostic value in relation to BLCA.
With exhibition of no hallmarks of apoptosis or necroptosis, ferroptosis is recognized as a newly non-apoptotic form of cell death, with unique characteristics in multiple diseases [7, 8]. Differing from the traditional modes of regulated cell death (RCD), ferroptosis is characterized by excessive accumulation of reactive oxygen species (ROS) and excessive production of lipid peroxidation [9]. Recently, several studies have revealed the significance of tumorigenesis in various cancers, such as hepatocellular carcinoma, pancreatic carcinoma, prostate cancer, and breast cancer [10–13]. There is growing evidence which highlights the association between ferroptosis and multiple oncogenic pathways. For instance, P53 enhances tumor cell ferroptosis but also alleviates tumor metastases to the lungs and liver [14, 15]. There is a lack of research on the relationship between ferroptosis and BLCA, with only a few cases reported in the literature. Here, we performed a bioinformatics analysis to determine whether ferroptosis-related genes had the potential to predict the prognosis of BLCA.
MATERIALS AND METHODS
Data acquisition
RNA sequencing data from 411 BLCA tissues were extracted from the Cancer Genome Atlas (TCGA) and corresponding clinicopathological data were obtained as a training set. The RNA sequencing transcriptome data were estimated as log2(X + 1) transformed FPKM normalized counts. Similarly, the microarray data from 165 primary urothelial tissue samples were extracted from the GSE13507 dataset published in the Gene Expressed Omnibus (GEO) and used as a validation set. Data on 60 ferroptosis-related genes were retained mainly from the findings of previous literature [7, 16–19]. The clinical information of both TCGA and GEO cohort was presented in Table 1.
Table 1
The clinical characteristics of bladder patients in training and test cohort
| Variables | Train (n = 411) | Test (n = 165) |
| Age | ||
| Mean | 68.10 | 65.18 |
| Median [min, max] | 69 [34, 90] | 66 [24, 88] |
| Gender | ||
| Male | 304 (73.97%) | 135 (81.82%) |
| Female | 107 (26.03%) | 30 (18.18%) |
| Overall survival time (days) | ||
| Mean | 831.43 | 1451.44 |
| Median [min, max] | 534 [13, 5050] | 1097 [30, 4109] |
| Survival state | ||
| Alive | 231 (56.20%) | 96 (58.18%) |
| Dead | 180 (43.80%) | 69 (41.82%) |
| Histological grade | ||
| High grade | 387 (94.16%) | 60 (36.36%) |
| Low grade | 21 (5.11%) | 105 (63.64%) |
| Unknown | 3 (0.73%) | 0 (0) |
| T-stage | ||
| T1 | 3 (0.73%) | 80 (48.48%) |
| T2 | 120 (29.20%) | 31 (18.79%) |
| T3 | 196 (47.69%) | 19 (11.52%) |
| T4 | 59 (14.36%) | 11 (6.67%) |
| Unknown | 33 (8.03%) | 24 (14.55%) |
| N-stage | ||
| N0 | 239 (58.15%) | 149 (90.30%) |
| N1 | 47 (11.44%) | 8 (4.85%) |
| N2 | 76 (18.49%) | 6 (3.64%) |
| N3 | 8 (1.95%) | 1 (0.61%) |
| Unknown | 41 (9.98%) | 1 (0.61%) |
| M-stage | ||
| M1 | 11 (2.68%) | 7 (4.24%) |
| M0 | 196 (47.69%) | 158 (95.76%) |
| Unknown | 204 (49.64%) | 0 (0) |
| Pathological stage | ||
| Stage I | 2 (0.49%) | NA |
| Stage II | 131 (31.87%) | NA |
| Stage III | 141 (34.31%) | NA |
| Stage IV | 136 (33.09%) | NA |
| Unknown | 1 (0.24%) | NA |
| Histological type | ||
| NMIBC | 0 (0) | 103 (62.42%) |
| MBIC | 409 (99.51%) | 62 (37.58%) |
| Unknown | 2 (0.49%) | 0 (0) |
| Angiolymphatic Invasion | ||
| Yes | 154 (37.47%) | NA |
| No | 131 (31.87%) | NA |
| Unknown | 126 (30.66%) | NA |
| Tumor Other Histologic Subtype | ||
| Non-Papillary | 274 (66.67%) | NA |
| Papillary | 133 (32.36%) | NA |
| Unknown | 4 (0.97%) | NA |
| Adjuvantpostoperative radiotherapy | ||
| Yes | 10 (2.43%) | NA |
| No | 268 (65.21%) | NA |
| Unknown | 133 (32.36%) | NA |
| Therapy | ||
| TURBT | 309 (75.18%) | NA |
| Radical resection | 36 (8.76%) | NA |
| Partial resection | 1 (0.24%) | NA |
| Unknown | 65 (15.82%) | NA |
Visualization of interaction among FRGs
The protein-protein interaction network (PPI) was constructed using the STRING database (https://string-db.org) and the functional network was determined with a medium confidence score greater than 0.4, along with other default parameters.
Establishment of a ferroptosis related-gene risk model
Samples without complete clinical data were removed, and Univariate Cox analysis was performed on the remaining samples to identify potential prognostic factors for patients with BLCA. We screened for ferroptosis-related genes associated with prognosis based on P < 0.05. LASSO regression was then performed to eliminate FRGs that might overfit our ferroptosis risk model. The LASSO algorithm was used for variable selection and shrinkage with the ‘glmnet’ R package. Additionally, we adopted a multivariate Cox analysis to determine favorable prognostic FRGs according to the linear combination of the Cox coefficient and gene expression. The following calculation formula was used for the analysis: Risk score =
Characterization of genetic alteration and DNA methylation among key FRGs
The cBioPortal platform (http://www.cbioportal.org/) was adopted to gather information on genetic alteration and DNA methylation of hub FRGs in BLCA patients. Based on the cBioPortal platform, the OncoPrinter module was used to analyze the frequency of gene alteration. Thereafter, the Plot module was used to calculate and visualize the correlation between relative linear copy number values (CNV), DNA methylation, and mRNA expression.
Gene set enrichment analysis (GSEA) for high ferroptosis risk subgroup
GSEA was performed to detect whether there was a significant difference in gene expression between high-risk and low-risk subgroups in the enrichment of ‘MSigDB’ collection [h.all.v7.2.symbols.gmt (hallmarks)]. Gene set permutations were performed 1,000 times for this analysis. The phenotype label was represented by a high-risk or low-risk score.
Prediction of chemotherapy response between high and low risk groups
The chemotherapy response for cisplatin, Gemcitabine, docetaxel and sunitinib of each bladder cancer patient in the TCGA cohort was calculated based on the Genomics of Drug sensitivity in Cancer (GDSC, https://www.cancerrxgene.org) by using “pRRophetic” Rpackage.
Statistics
The R language platform was used to analysis these data (v.4.0.3, https://cran.r-project.org/). The wilcoxon rank-sum test was performed to distinguish the difference of mRNA levels of FRGs between different risk groups. The univariate cox and lasso regression were used to screen hub FRGs and the multivariate cox regression was used to establish our model. The KM curve was generated using R package ‘survival’ and assessed by the log-rank test. The corresponding coefficients of hub FRGs weighted and obtained from multivariate cox regression were used to calculate the risk score of each BLCA patient.
RESULTS
Identification of ferroptosis signature for prediction of BLCA prognosis
In this study, 60 ferroptosis-related hub genes were adopted based mainly on the previous study of Liang JY, et al. [19]. We performed a protein–protein interaction network analysis using the STRING database to better understand the interaction between the 60 ferroptosis-related genes (Fig. 1A). Generally, proteins that are more instrumental exhibit a considerable number of adjacent nodes. Thus, we used a ‘barplot’ R package to identify the number of adjacent nodes in each protein, and TP53 presented the maximum (Fig. 1B).
Fig. 1
The relationship between 60 ferroptosis-related genes and Establishment of a ferroptosis-related gene risk model. (A) The protein-protein interaction network of 60 ferroptosis-related genes. (B) The number of adjacent nodes that each ferroptosis-related gene possessed. (C) Relationship between the expression of FRGs and overall survival of bladder urothelial carcinoma patients by univariate Cox analysis. (D) The Lasso coefficient profiles of FRGs in BLCA. (E) Partial likelihood deviance was plotted against log (lambda). The vertical dotted lines represent the lambda value with minimum error. The largest lambda value is where the deviation is within one standard error (SE) of the minimum. (F) Establishment of a ferroptosis risk signature to predict BLCA prognosis by multivariate Cox regression. (G) Spearman correlation analysis of six ferroptosis-related genes in the TCGA cohort. The red circles represent positive correlation,the green circles represent negative correlation. The area of the circles represent the value of correlation. (H) Spearman correlation analysis of six ferroptosis-related genes in the GEO cohort.
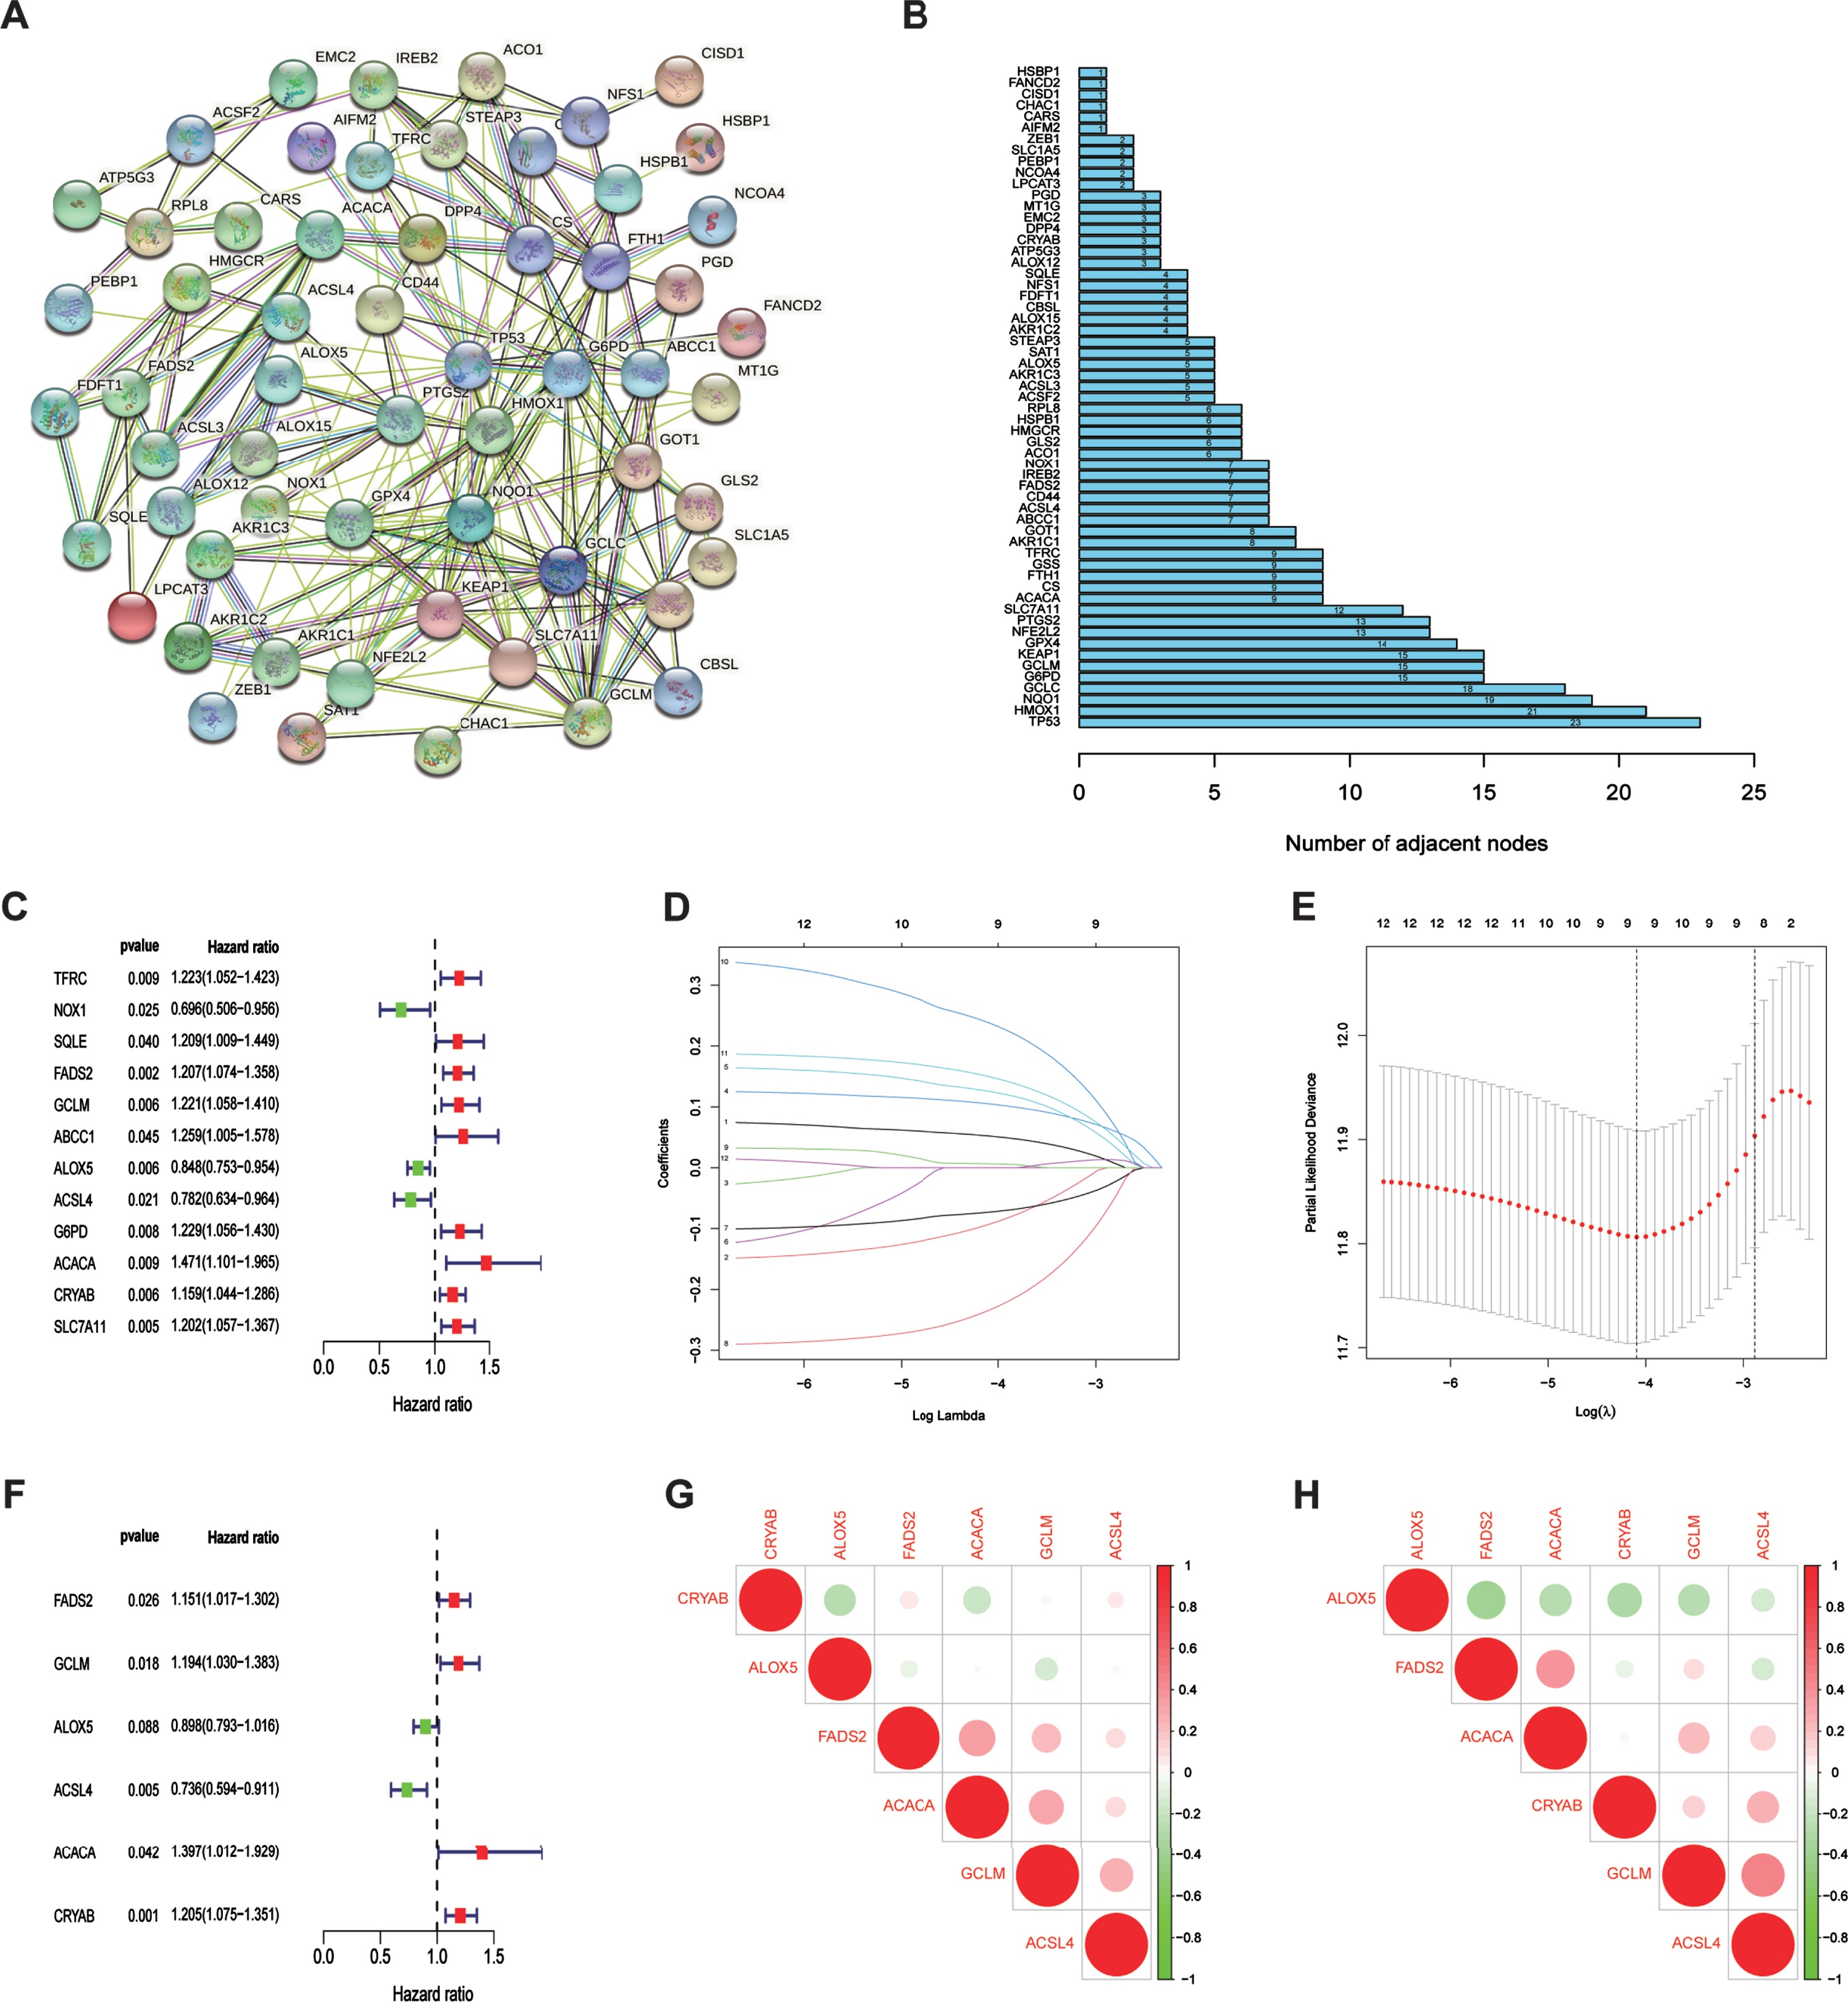
To establish a ferroptosis risk signature for prediction of prognoses in patients with BLCA, univariate and multivariate regression analyses were performed using the 60 FRGs in TCGA training cohort. Accord-ing to univariate COX analysis (Fig. 1C), 12 ferro-ptosis-related genes were significantly correlated with overall survival (OS). We performed LASSO regression to eliminate FRGs that might overfit our model (Fig. 1D, E). Finally, nine genes were left to be subordinated into the multivariate Cox model. As visualized by multivariate COX analysis, six ferroptosis-related genes were selected to construct the predictive model (Fig. 1F). The risk-score formula was generated as follows:
Risk score =
(0.14×FADS2) + (0.18×GCLM) +
(-0.11×ALOX5) + (-0.31×ACSL4) +
(0.33×ACACA) + (0.19×CRYAB)
All six FRGs were found to be not significantly correlated with each other in both TCGA and GEO cohorts (Fig. 1G, H), indicting our risk model based on these six FRGs avoided the overfitting caused by collinearity.
Identification of genetic alteration status and methylation among six FRGs
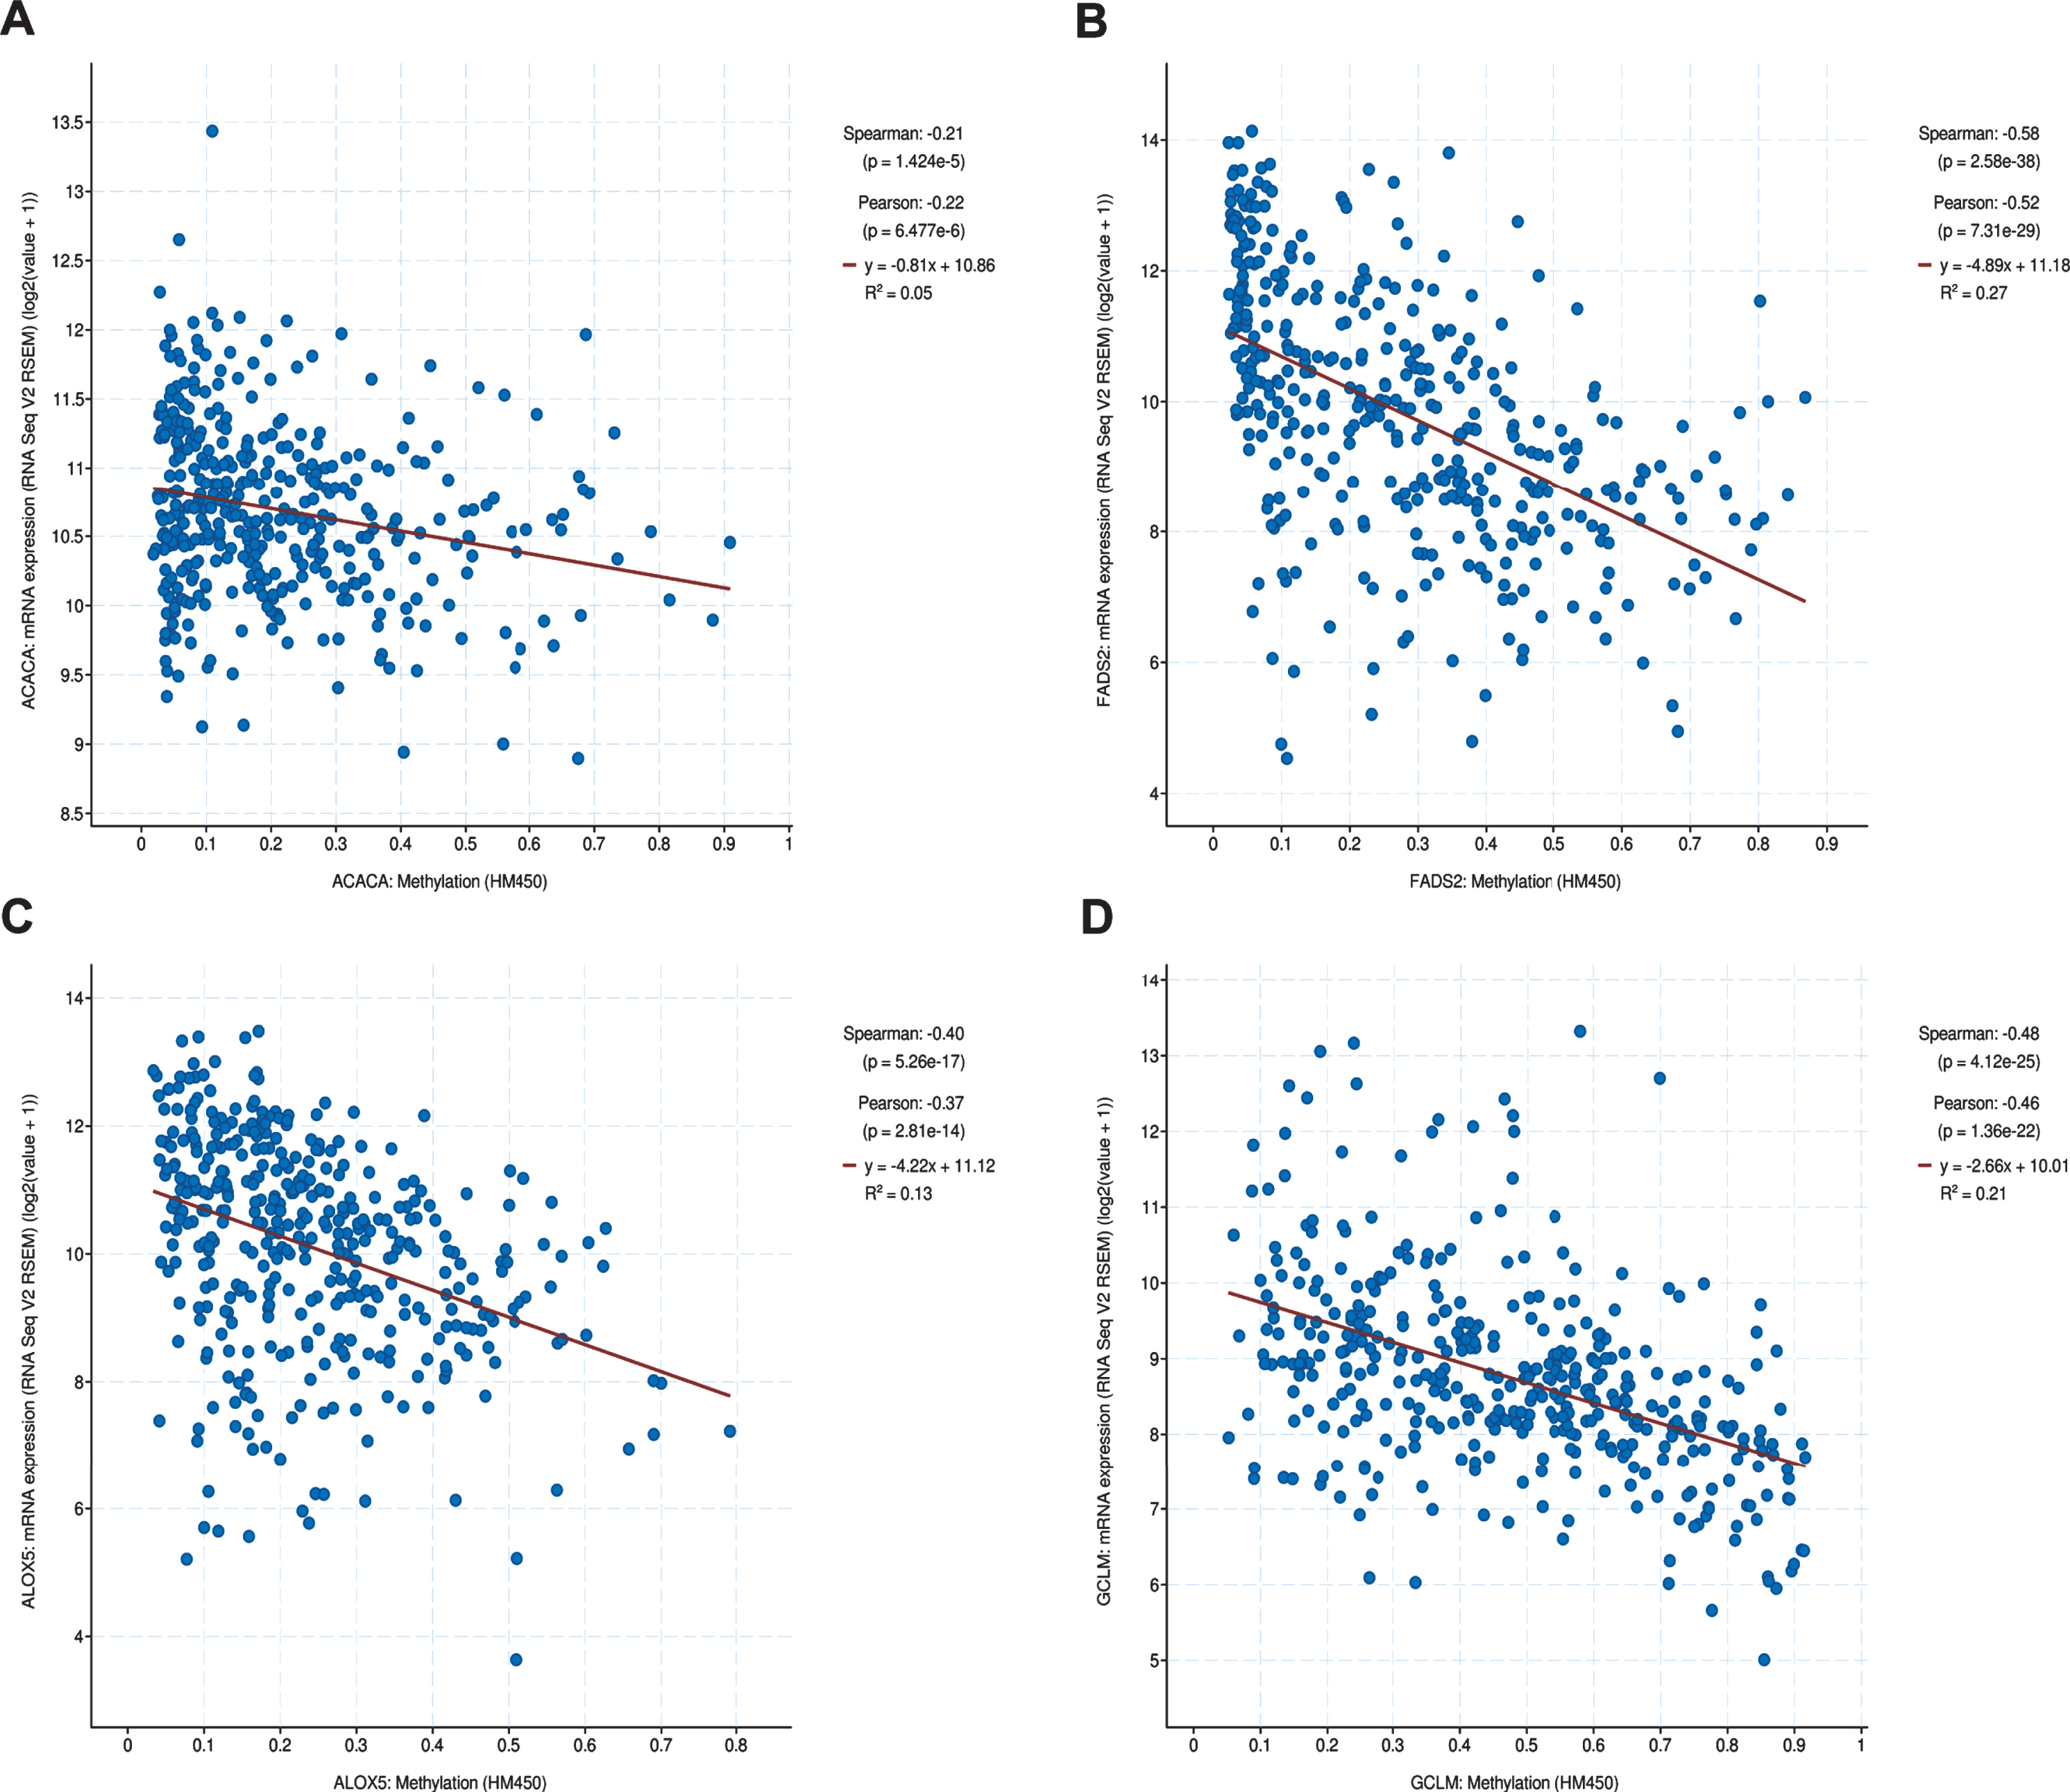
Genetic alteration status was explored using the cBioportal platform. The results demonstrated that CRYAB, ACLS4, GCLM, FADS2, ALOX5, and ACACA exhibited 1.0%, 1.5%, 1.5%, 1.5%, 3.0%, and 9.0%genetic alteration, respectively (Fig. 2A), and most of the alterations pertained to variations in the copy number. The correlation between relative copy number values and mRNA expression levels of ACACA reached a value of 0.42 (Fig. 2G), as determined by Pearson’s correlation analysis, while that of other genes was less than 0.30 (Fig. 2B-F). We further investigated the association between mRNA expression and methylation status of six FRGs, although methylation data for only four of the six FRGs was available to perform the comparison. The results showed that three FRGs, namely GCLM, FADS2, and ALOX5, had robust negative correlations be-tween gene expression level and DNA methylation (Fig. 3A-D).
Fig. 2
The genetic changes of six hub FRGs. (A) The genetic alterations of six hub genes. (B-G) The correlation between mRNA expression and relative linear copy number values.
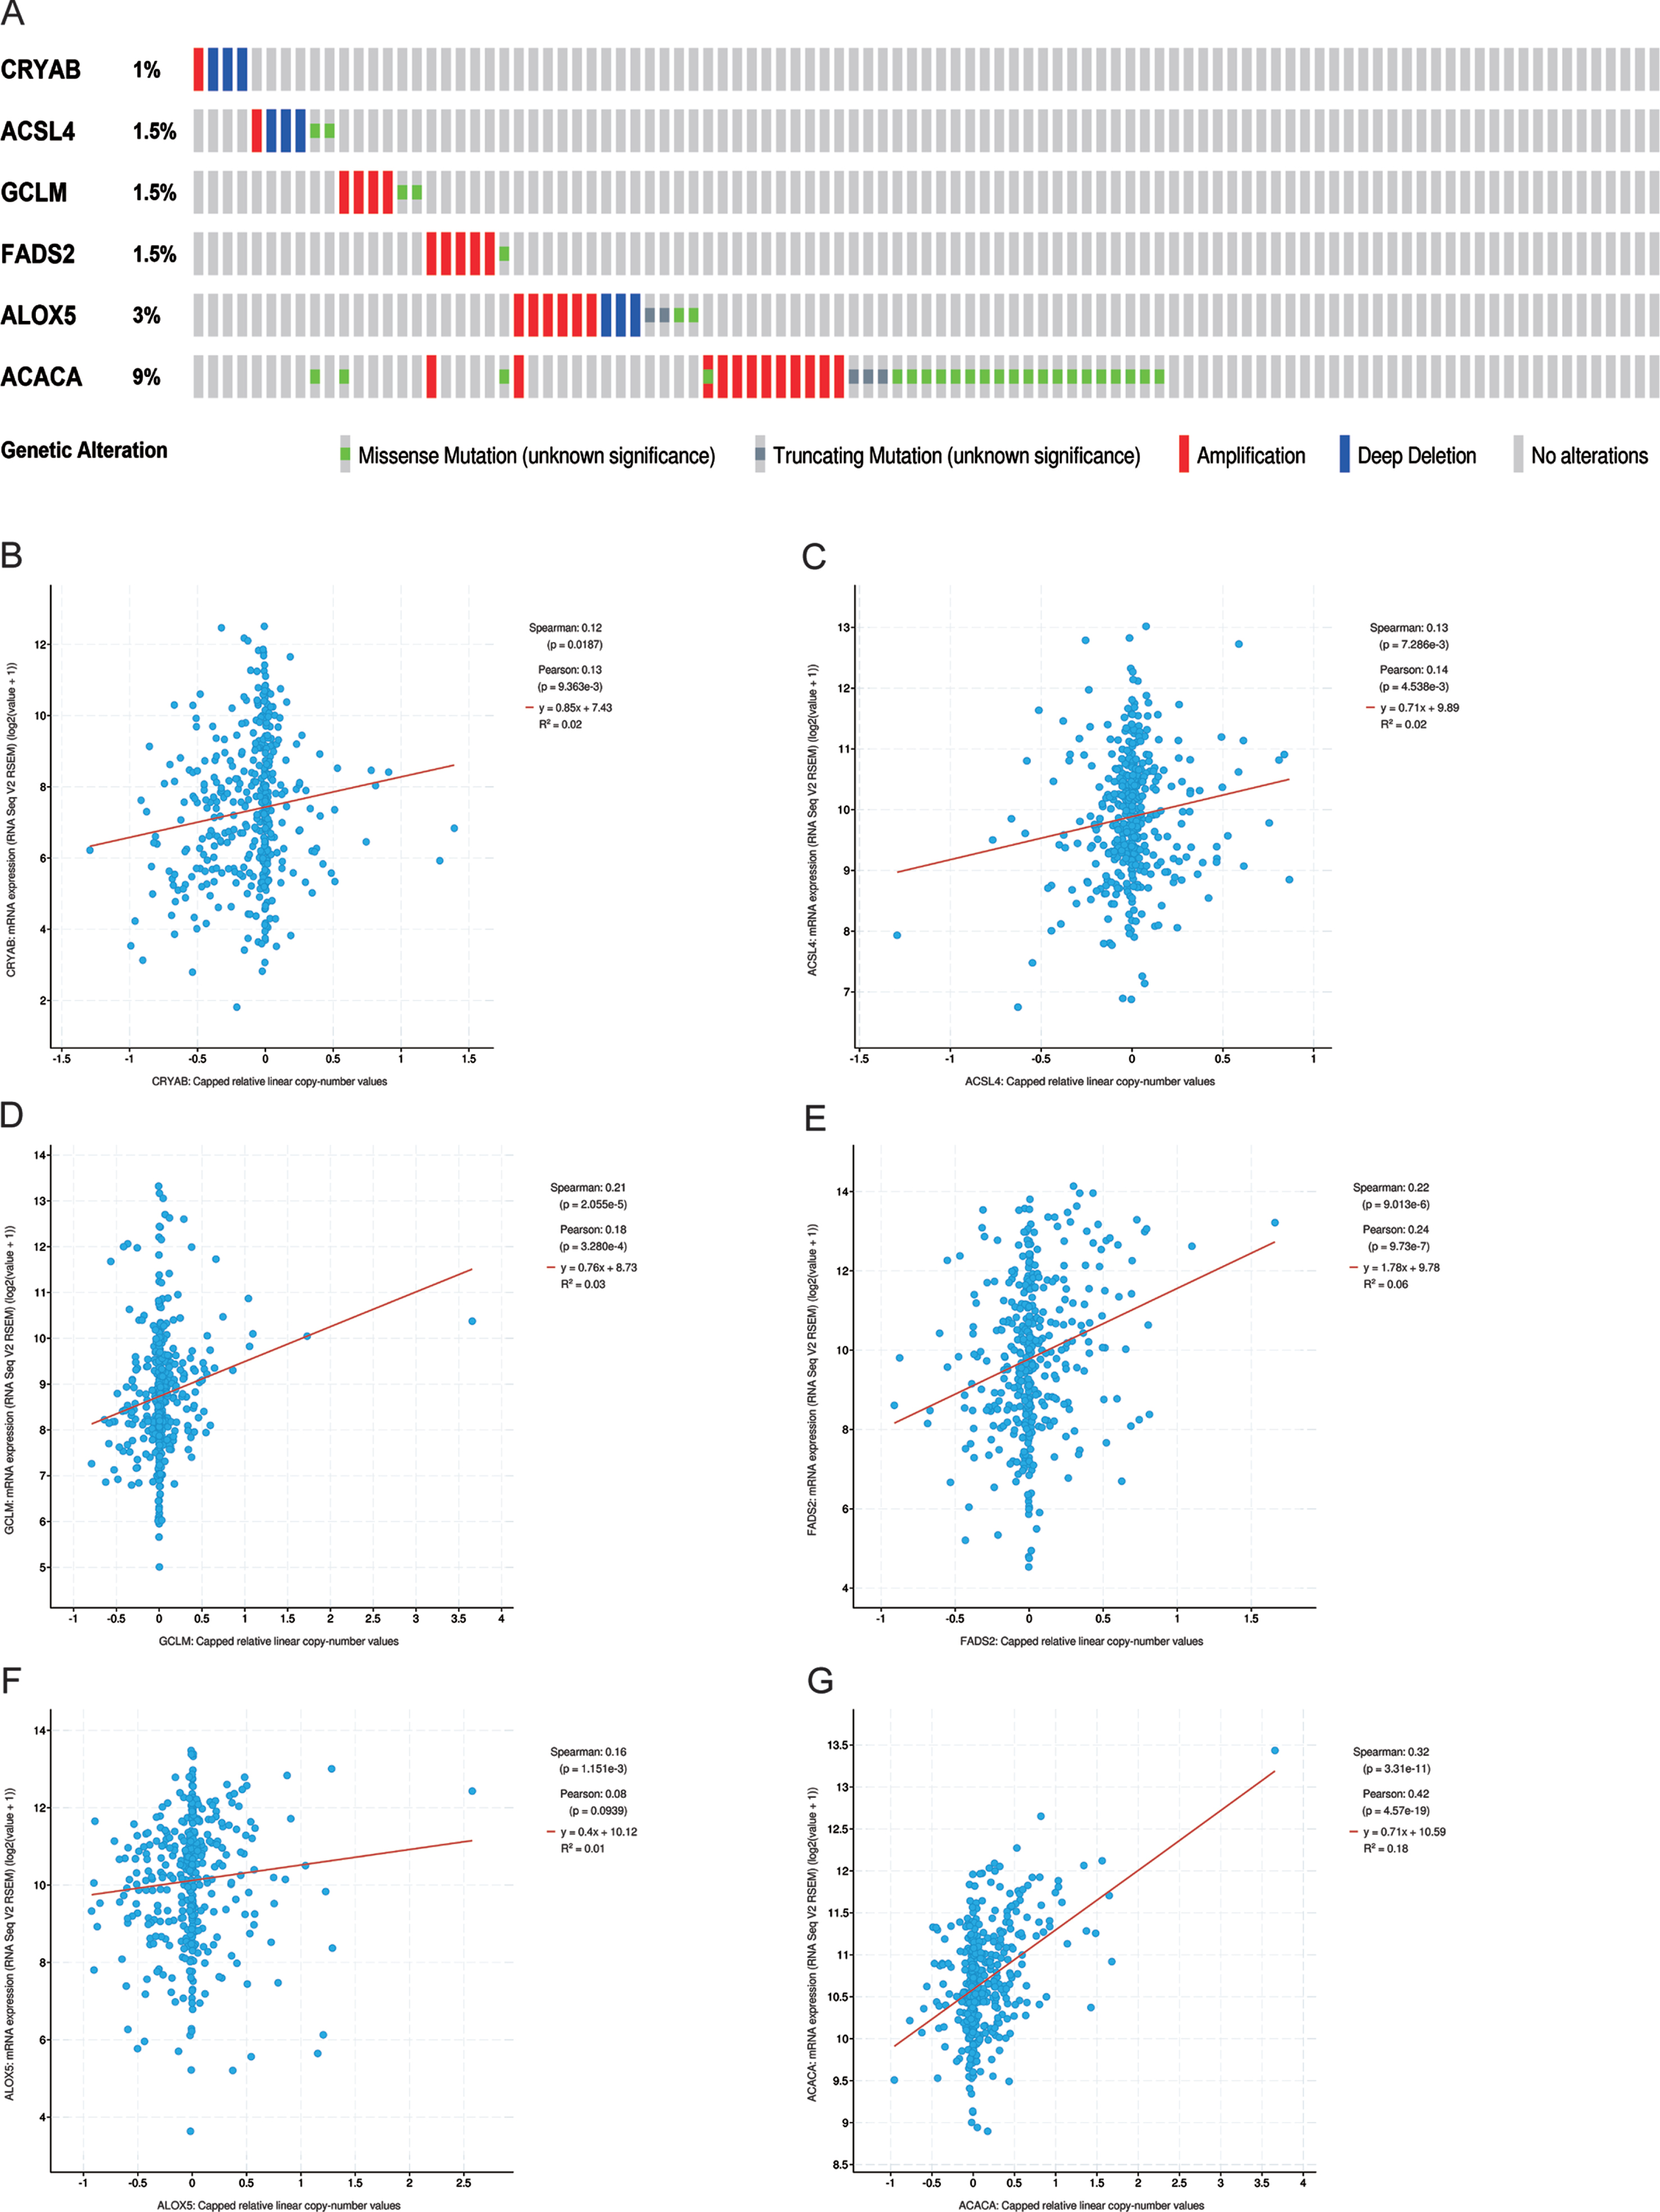
Fig. 3
The methylation of hub FRGs.(A-D) The correlation between mRNA expression and DNA methylation of hub FRGs.
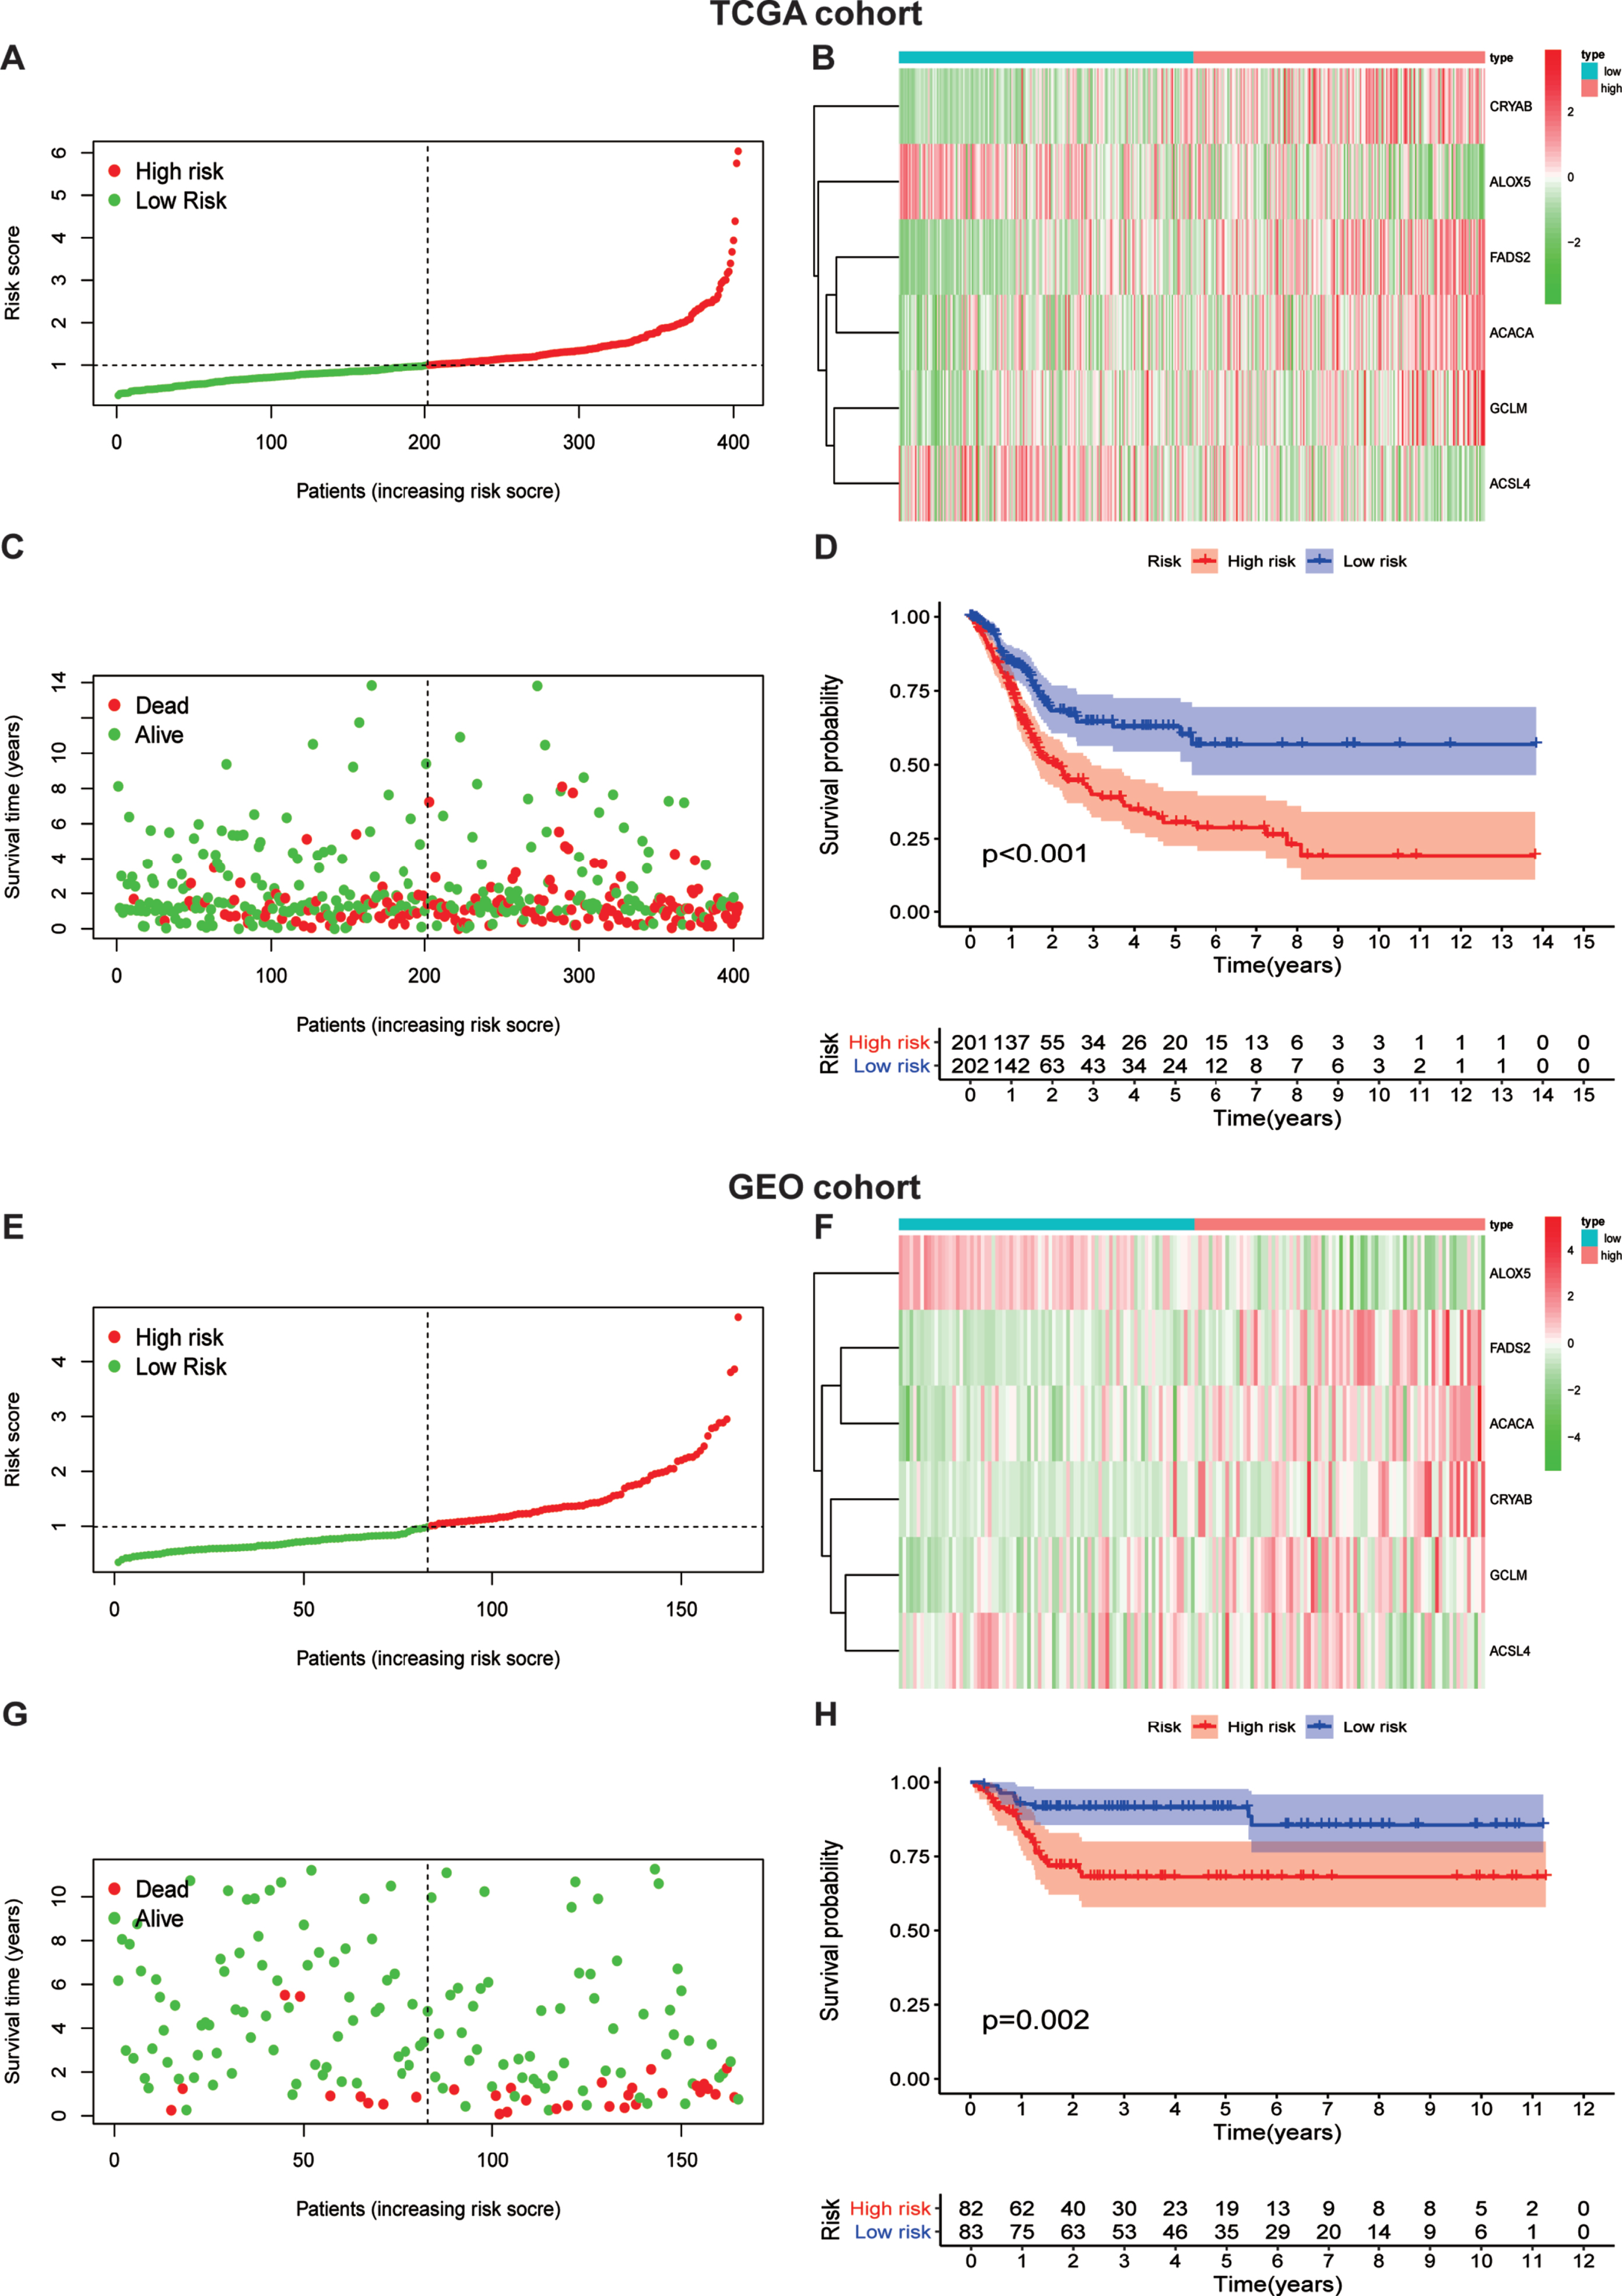
Identification of prognostic value of ferroptosis-risk model in BLCA
In consideration of the significant biological functions of ferroptosis to facilitate tumor growth and progression, we conducted a systematic investigation of the prognostic value of the ferroptosis model. The patients were divided into a high ferroptosis-risk subgroup and a low ferroptosis-risk subgroup according to the median value in both TCGA (Fig. 4A) and GEO (Fig. 4E) databases. As the expression levels of CRYAB, FADS2, ACACA, and GCLM were enhanced with higher ferroptosis risk scores, while the expression level of the two remaining FRGs decreased with higher risk scores in both TCGA (Fig. 4B) and GEO (Fig. 4F) databases, it was proposed that ALOX5 and ACSL4 served as protective factors. Our data also indicated that patients with higher risk scores had a higher mortality risk than those with lower scores in TCGA database (Fig. 4C). The results were validated in the GEO database (Fig. 4G). Additionally, we performed KM analysis to assess the prognostic potential of the ferroptosis risk model in patients with BLCA. As shown in Fig. 4D, a high ferroptosis risk score was associated with poor overall survival in TCGA -BLCA training set, which was authenticated by the GEO testing set (Fig. 4H).
Fig. 4
Risk score analysis of ferroptosis-gene risk model in TCGA and GEO cohort.(A) separation of patients into high and low risk group by the median risk score.(B)Heatmap plot of six genes between high and low risk group.(C)Survival status of patients.(D)Survival analysis according to risk score. (E) separation of patients into high and low risk group by the median risk score.(F)Heatmap plot of six genes between high and low risk group.(G)Survival status of patients.(H)Survival analysis according to risk score.
FRG risk model shows the capability to predict prognosis
To estimate the predictive accuracy of the ferroptosis risk model in the one-to-five year survival rate group, a receiver operating (ROC) curve was performed using the information from TCGA and GEO cohorts. It is shown in Fig. 5A that the proportions under the ROC curve (AUC) were 0.630, 0.671, and 0.703, at one year, three years, and five years, respectively. This figure demonstrates the predictive value of our model. In parallel, we performed another ROC curve to assess the prognostic prediction manifestations of our ferroptosis risk signature in GEO datasets (Fig. 5B). Fortunately, we obtained a much larger AUC score, indicating the accuracy of our model to predict the overall survival rate of BLCA patients.
Fig. 5
Prognostic value of the ferroptosis risk signature in BLCA.(A,B)ROC curves indicating the predictive efficiency of the ferroptosis risk signature on the 1-, 3-, and 5-years survival rate;(C-F)Univariate and multivariate Cox analyses evaluating the independent prognostic value of the ferroptosis signature in terms of OS in BLCA patients.
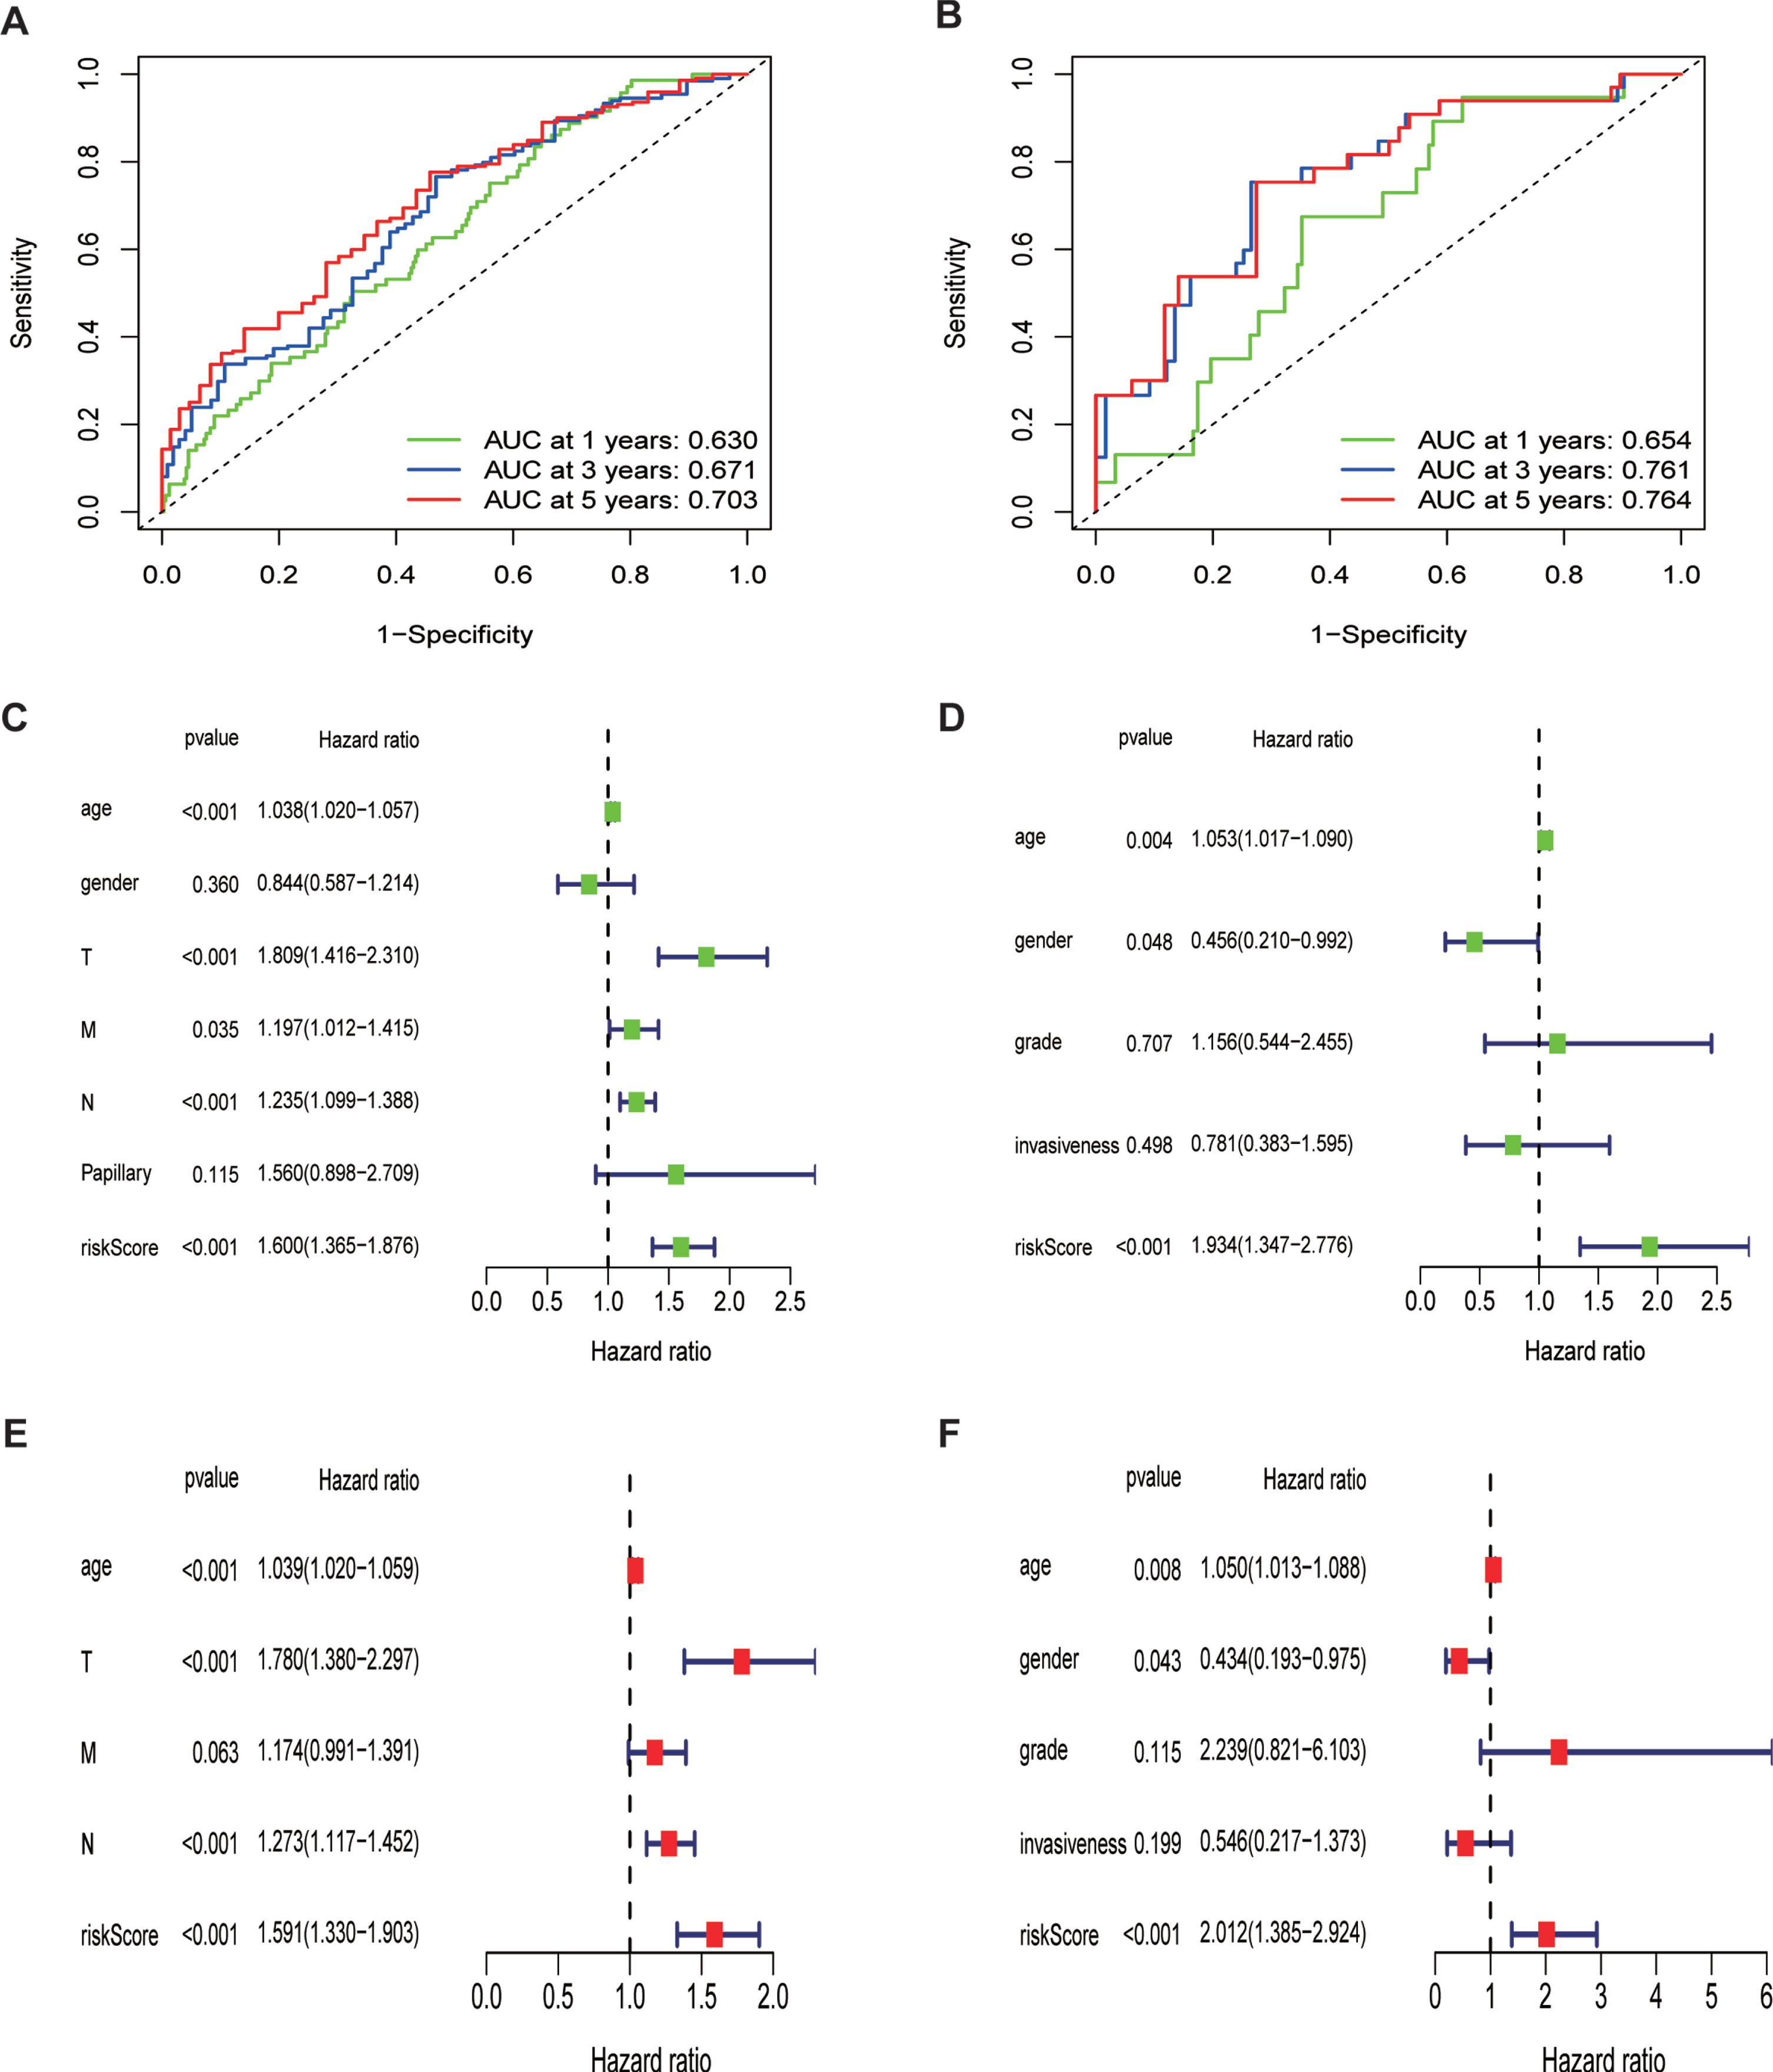
Additionally, we performed univariate and multivariate Cox regression analyses to assess the independent prognostic value of the ferroptosis risk model in terms of overall survival. The univariate analysis indicated that higher ferroptosis risk scores significantly contributed to an unfavorable OS (Fig. 5C) and was further validated in GEO cohort (Fig. 5D). Other parameters were also embedded into this analysis, including age, sex, TNM stage, and papillary levels. Multivariate analysis demonstrated that high ferroptosis risk scores were independently correlated with unfavorable OS in these patients (Fig. 5E), indicating that ferroptosis risk score is a potential independent prognostic factor for patients with BLCA. This was further validated by the GEO datasets with the variables of grade and invasiveness (Fig. 5F).
Ferroptosis-related gene is correlated with clinicopathological characteristics and molecular subclassifications
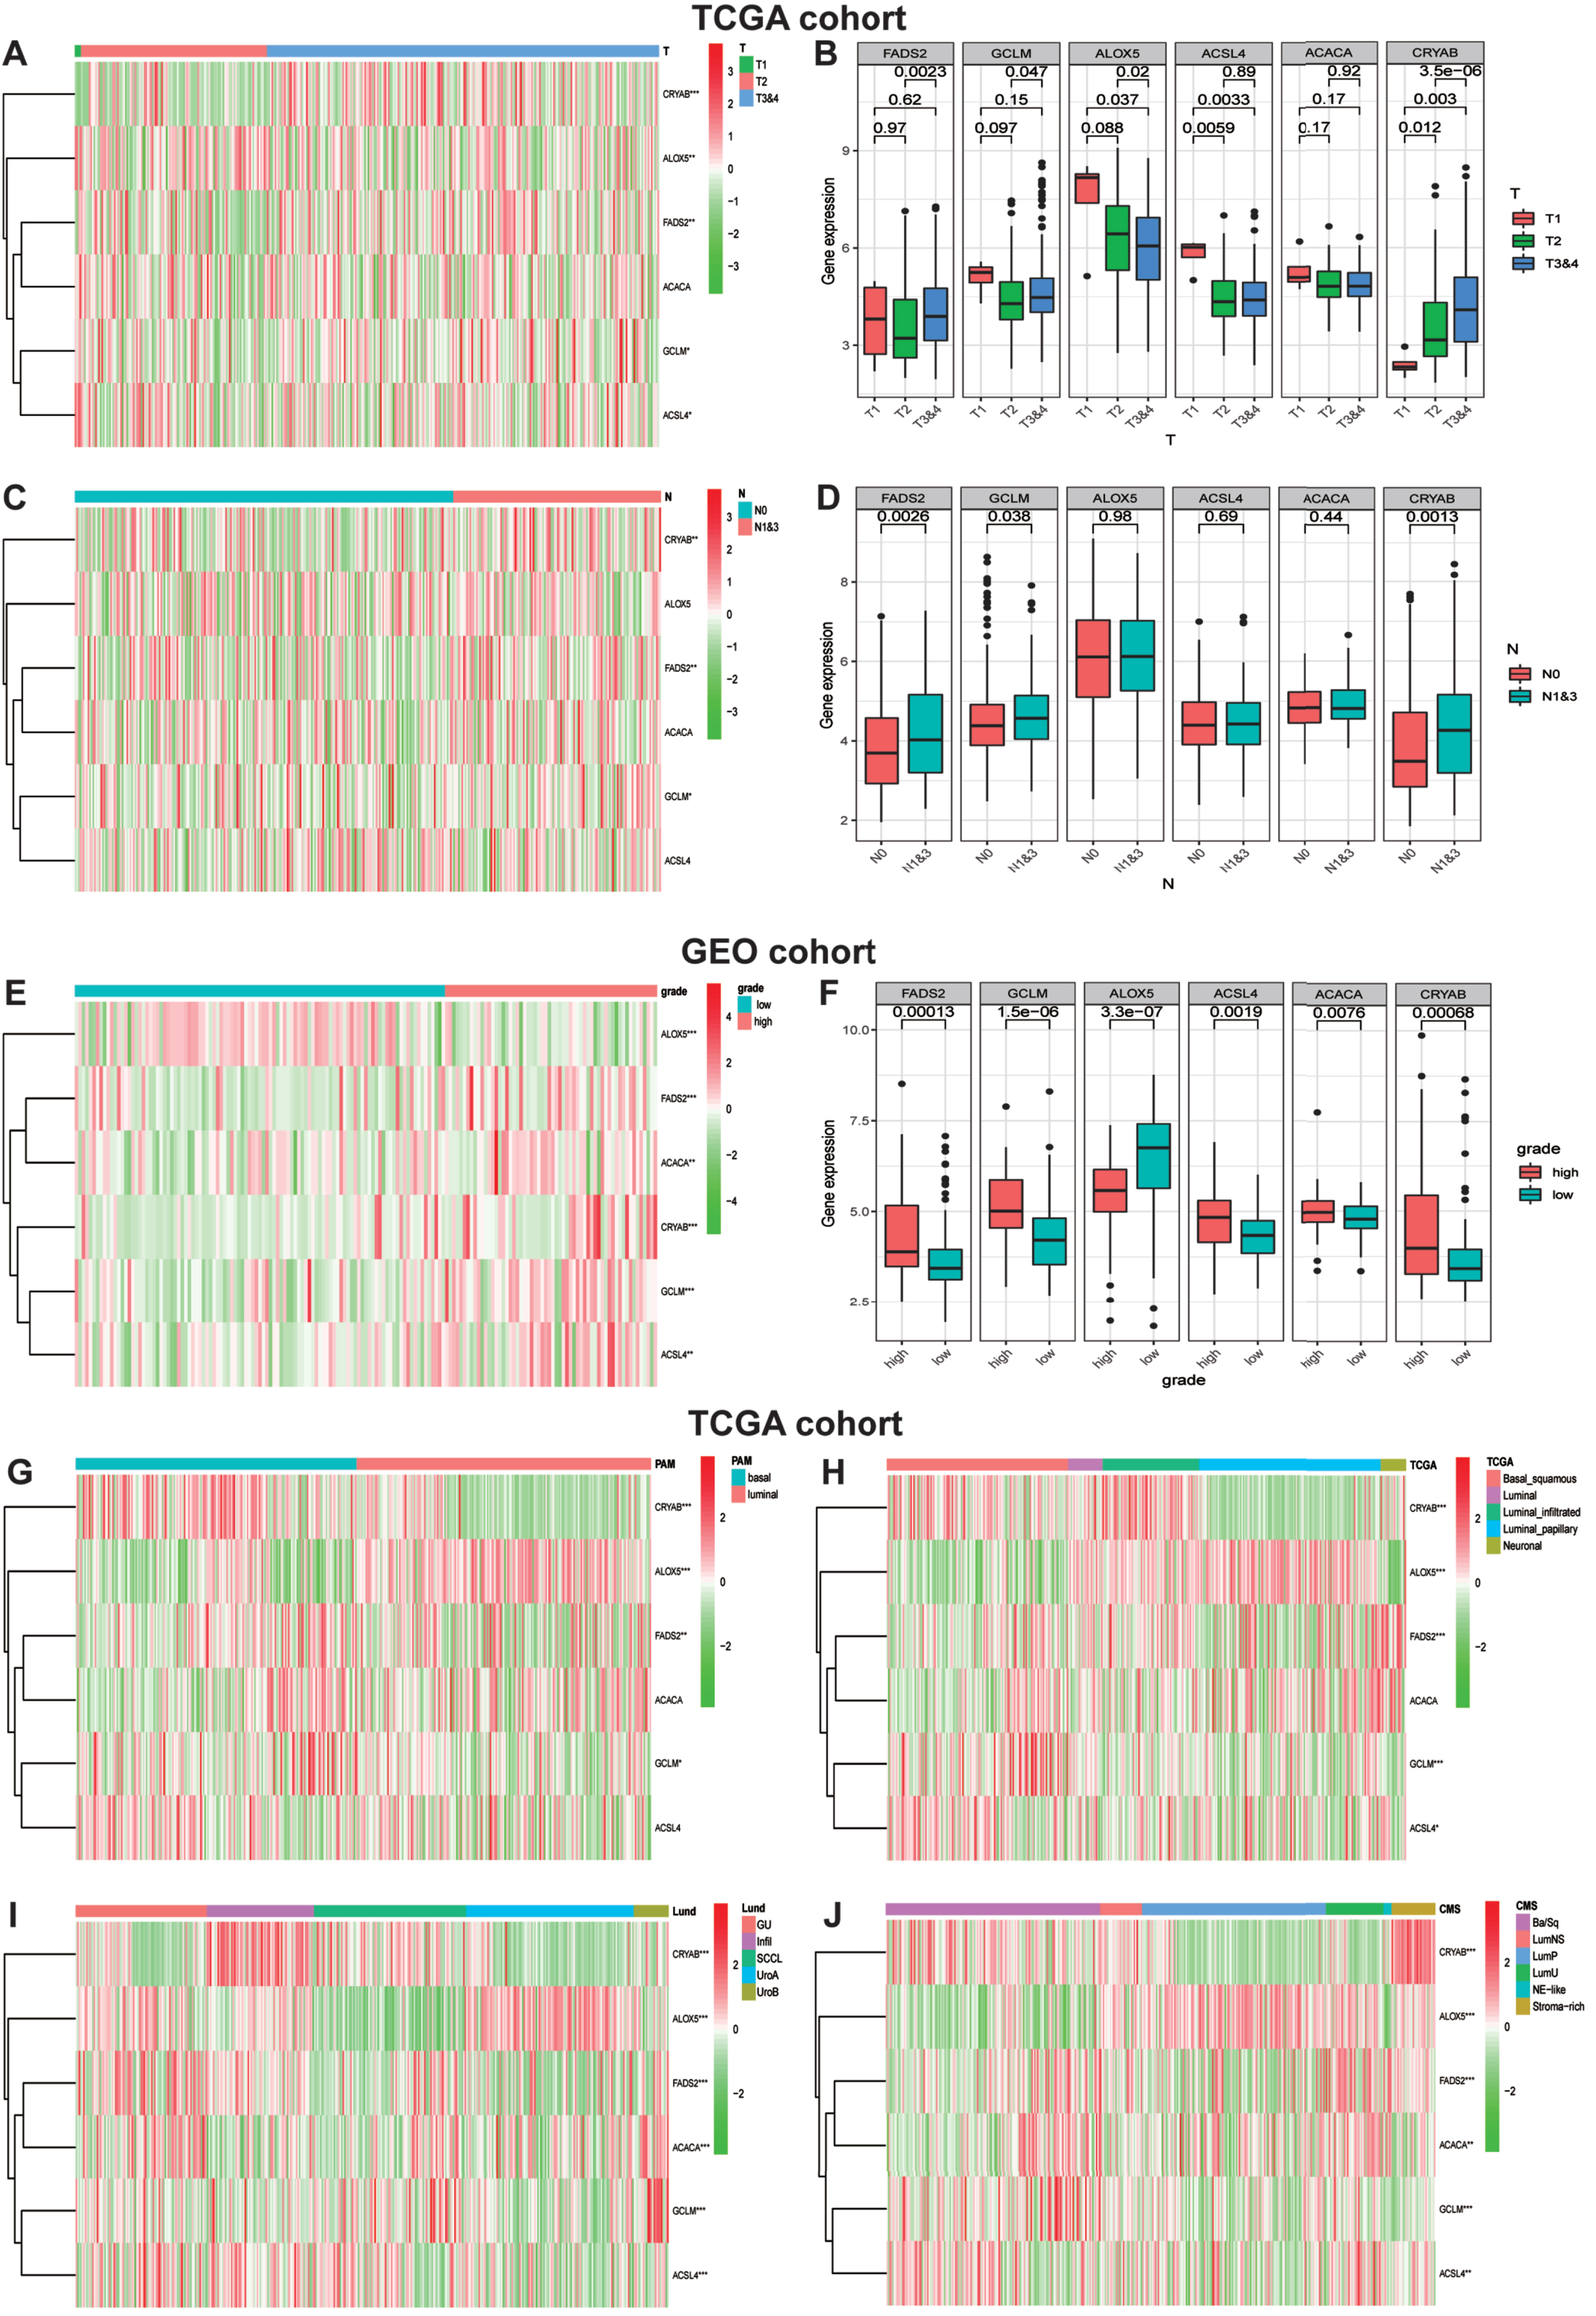
In consideration of the robust biological functions of ferroptosis in tumor growth and development, we conducted a comprehensive investigation to evaluate the correction among six identified ferroptosis-rela-ted genes and the clinicopathological characteristics as well as the molecular subclassifications of bladder carcinomas, including the T-stage, N-stage, WHO grade along with PAM, TCGA, Lund and CMS molecular subclassifications. We classified the T-stages into T1, T2 and T3&4, and then generated a heatmap of gene expression levels and T-stages in TCGA datasets (Fig. 6A). The map showed that the expression level of ALOX5 was significantly decreased in the T3&4 stage tumor groups compared to the other three genes with statistical significance, implying that ALOX5 might be a protective factor in the low ferroptosis risk group. Similarly, Fig. 6C visualized the heatmap of gene expression levels and N-stages in TCGA cohort. Furthermore, we studied the relationship between gene expression and the WHO grade. The heatmap demonstrated that ALOX5 expression level was significantly decreased in high-grade BLCA (Fig. 6E). The correlations between T-stages, N-stages, WHO grade and gene expression levels were authenticated by quantitative analyses (Fig. 6B, D, F). With the development of second-generation sequencing, molecular subclassification of bladder cancer were established which contributed greatly to the individual treatment [20–22]. Hence, we explored the relationships between Six FRGs and molecular subclassifications. Various molecular subclassifications data for each bladder cancer patient were obtained from the previous research [23]. Figure 6G-J showed the heatmap of the expression of six FRGs in different molecular subclassifications. Results demonstrated that the expression levels CRYAB, FADS2 and GCLM were overexpressed in basal group. In contrast, patients with high expression of ALOX5 seems to generate a luminal subclassification.
Fig. 6
Ferroptosis-realted gene expression is correlated with clinicopathological features and molecular subclassifications of BLCA. (A)Heatmap showing six ferroptosis gene expression profiles in different T-stage from TCGA cohort. (B) The expression level of six FRGs in BLCA with different T-stage. (C) Heatmap showing six ferroptosis gene expression profiles in different N-stage from TCGA cohort. (D)The expression level of six FRGs in BLCA with different N-stage. (E) Heatmap showing six ferroptosis gene expression profiles in different WHO grade from GEO cohort. (F) The expression level of six FRGs in BLCA with different WHO grade. (G-J) Heatmap showing six ferroptosis gene expression profiles in different molecular subclassifications in TCGA cohort. *P < 0.05,**P < 0.01,and ***P < 0.001
GSEA demonstrates ferroptosis-related signaling pathways
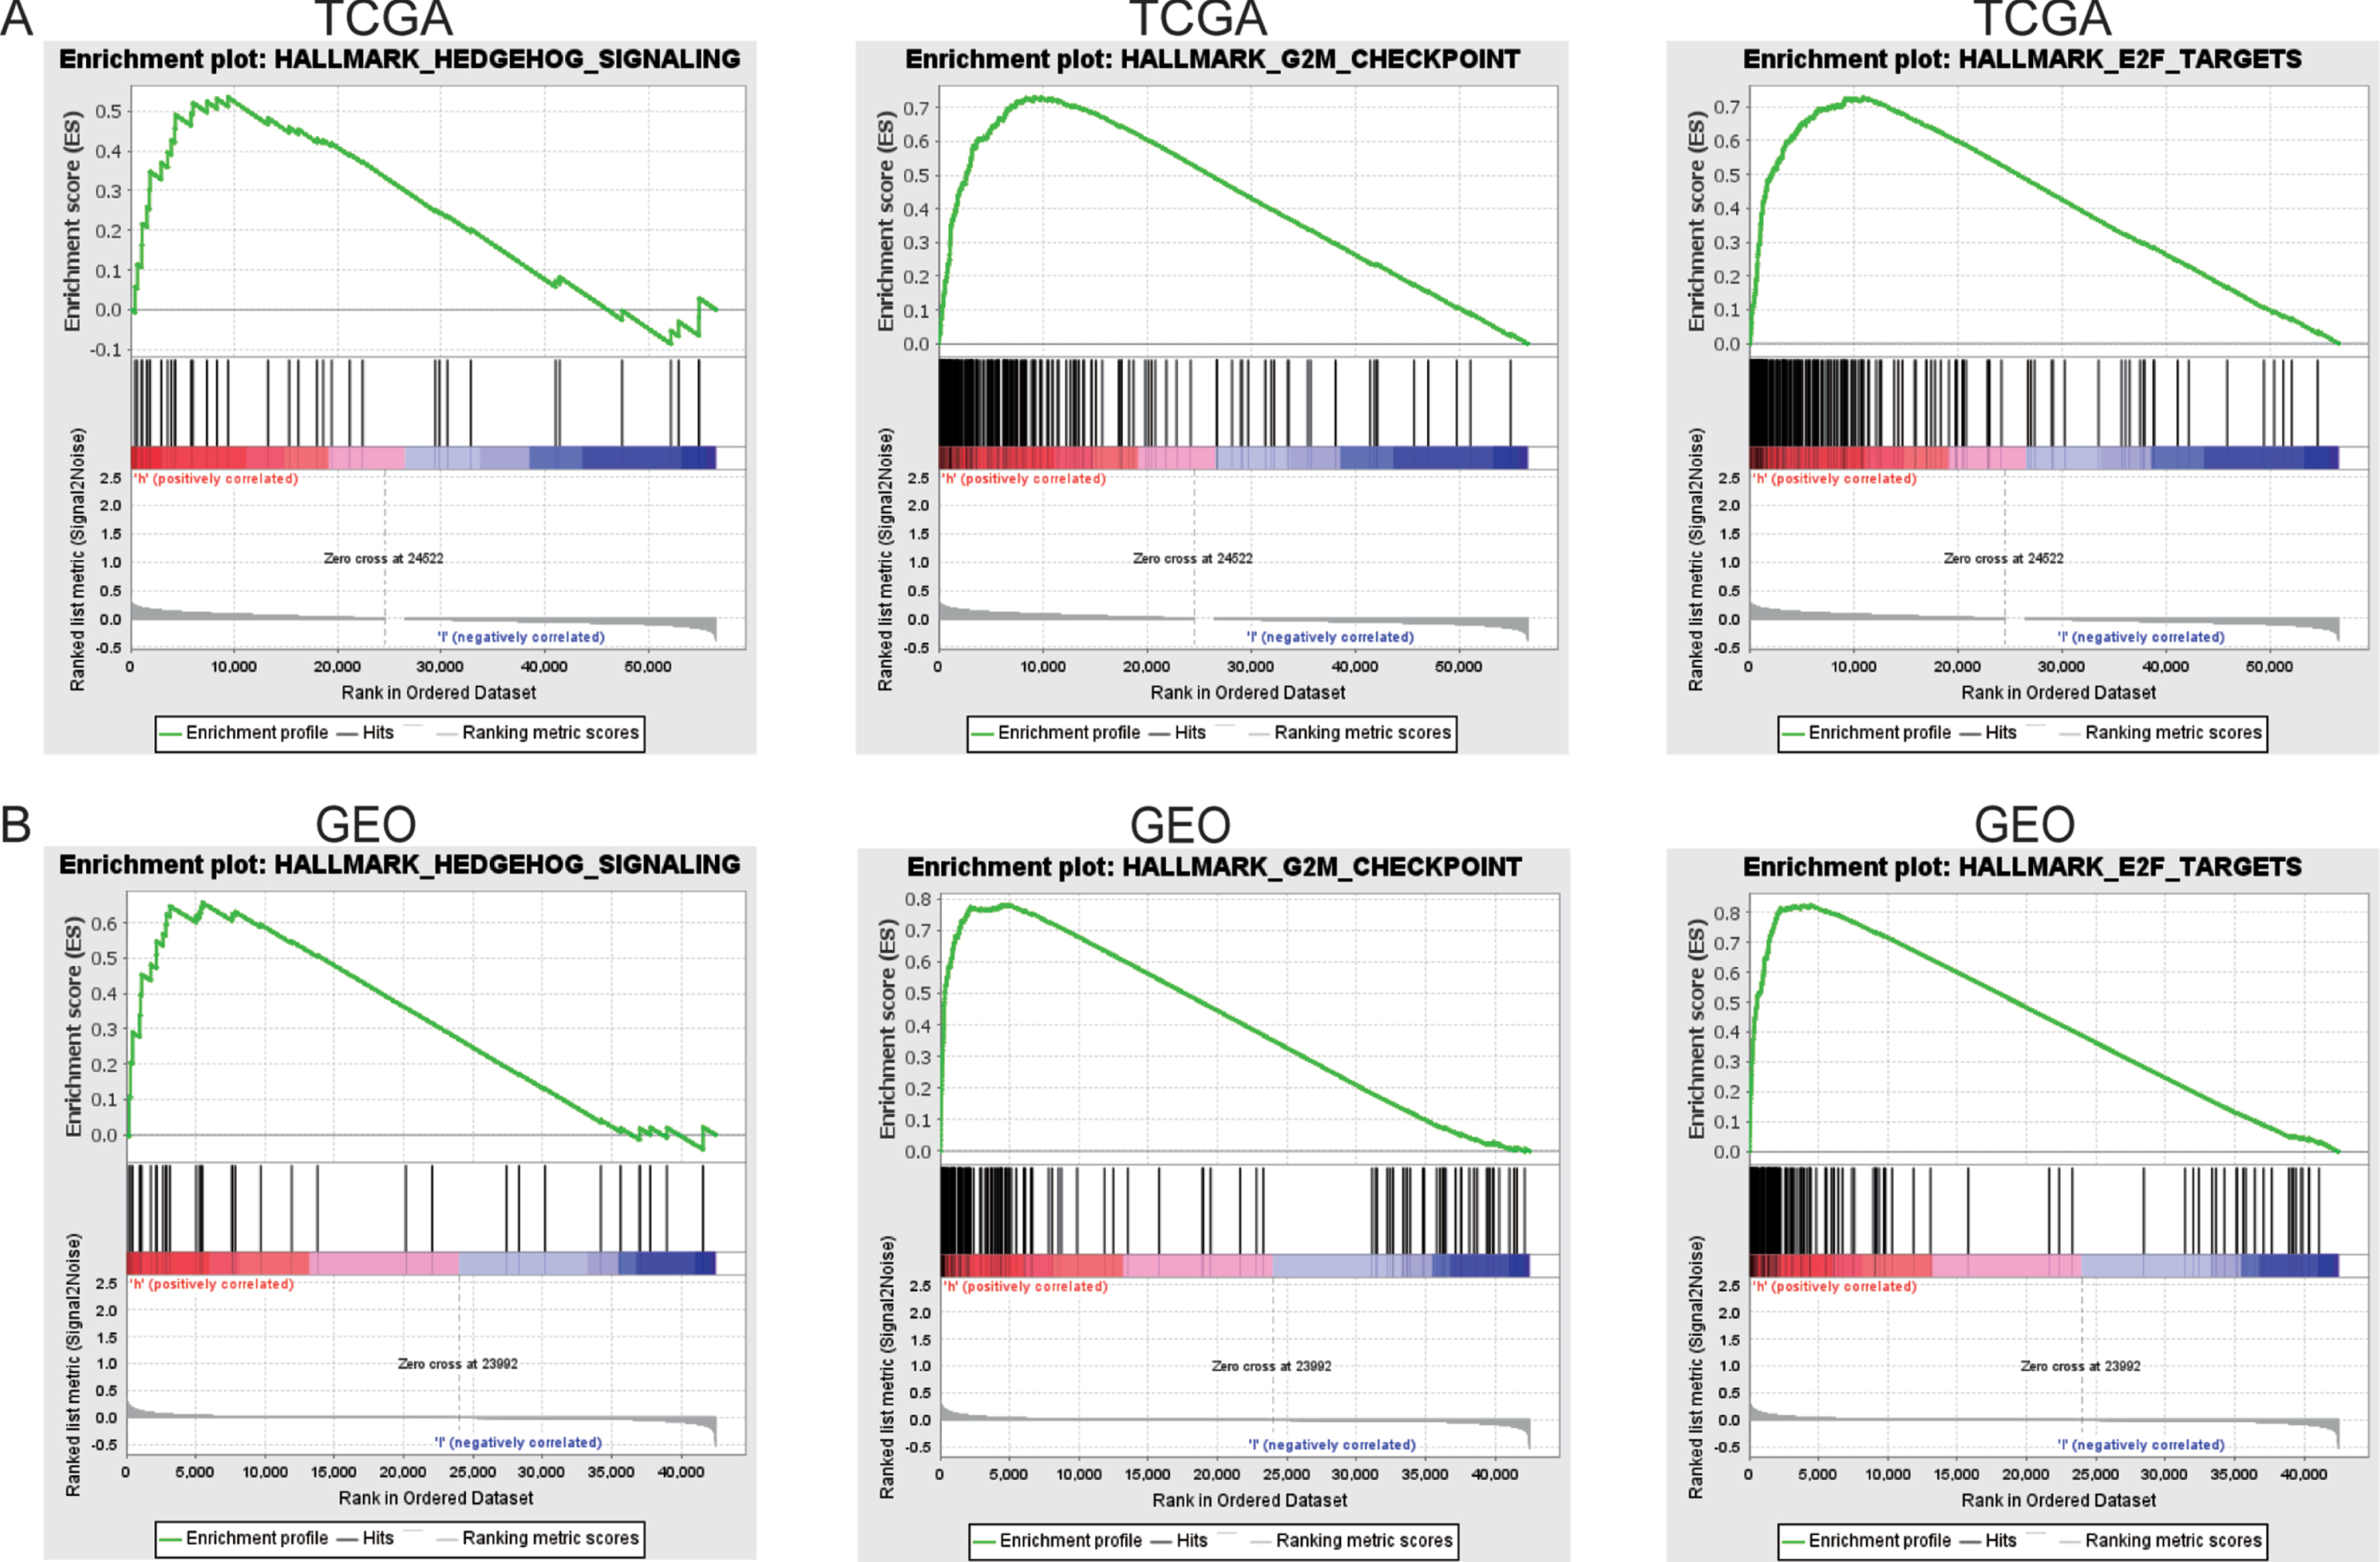
GSEA was performed to compare the high-risk ferroptosis and low-risk ferroptosis groups, to verify related signaling pathways activated in the high-risk subgroup. Gene sets were differentially enriched in the high ferroptosis groups of TCGA database, as they were related to tumor proliferation such as G2M checkpoint, E2F targets, and hedgehog signaling (Fig. 7A). These were further validated in the GEO database (Fig. 7B).
Fig. 7
GSEA enrichment between high and low ferroptosis risk groups. (A)GSEA revealing that genes in the high ferroptosis risk group were enriched for hallmarks of malignant tumors in TCGA-BLCA cohort. (B)The results were further validated by GEO data.
The relationship between ferroptosis-related signature and molecular subclassification, histological type and chemotherapy response
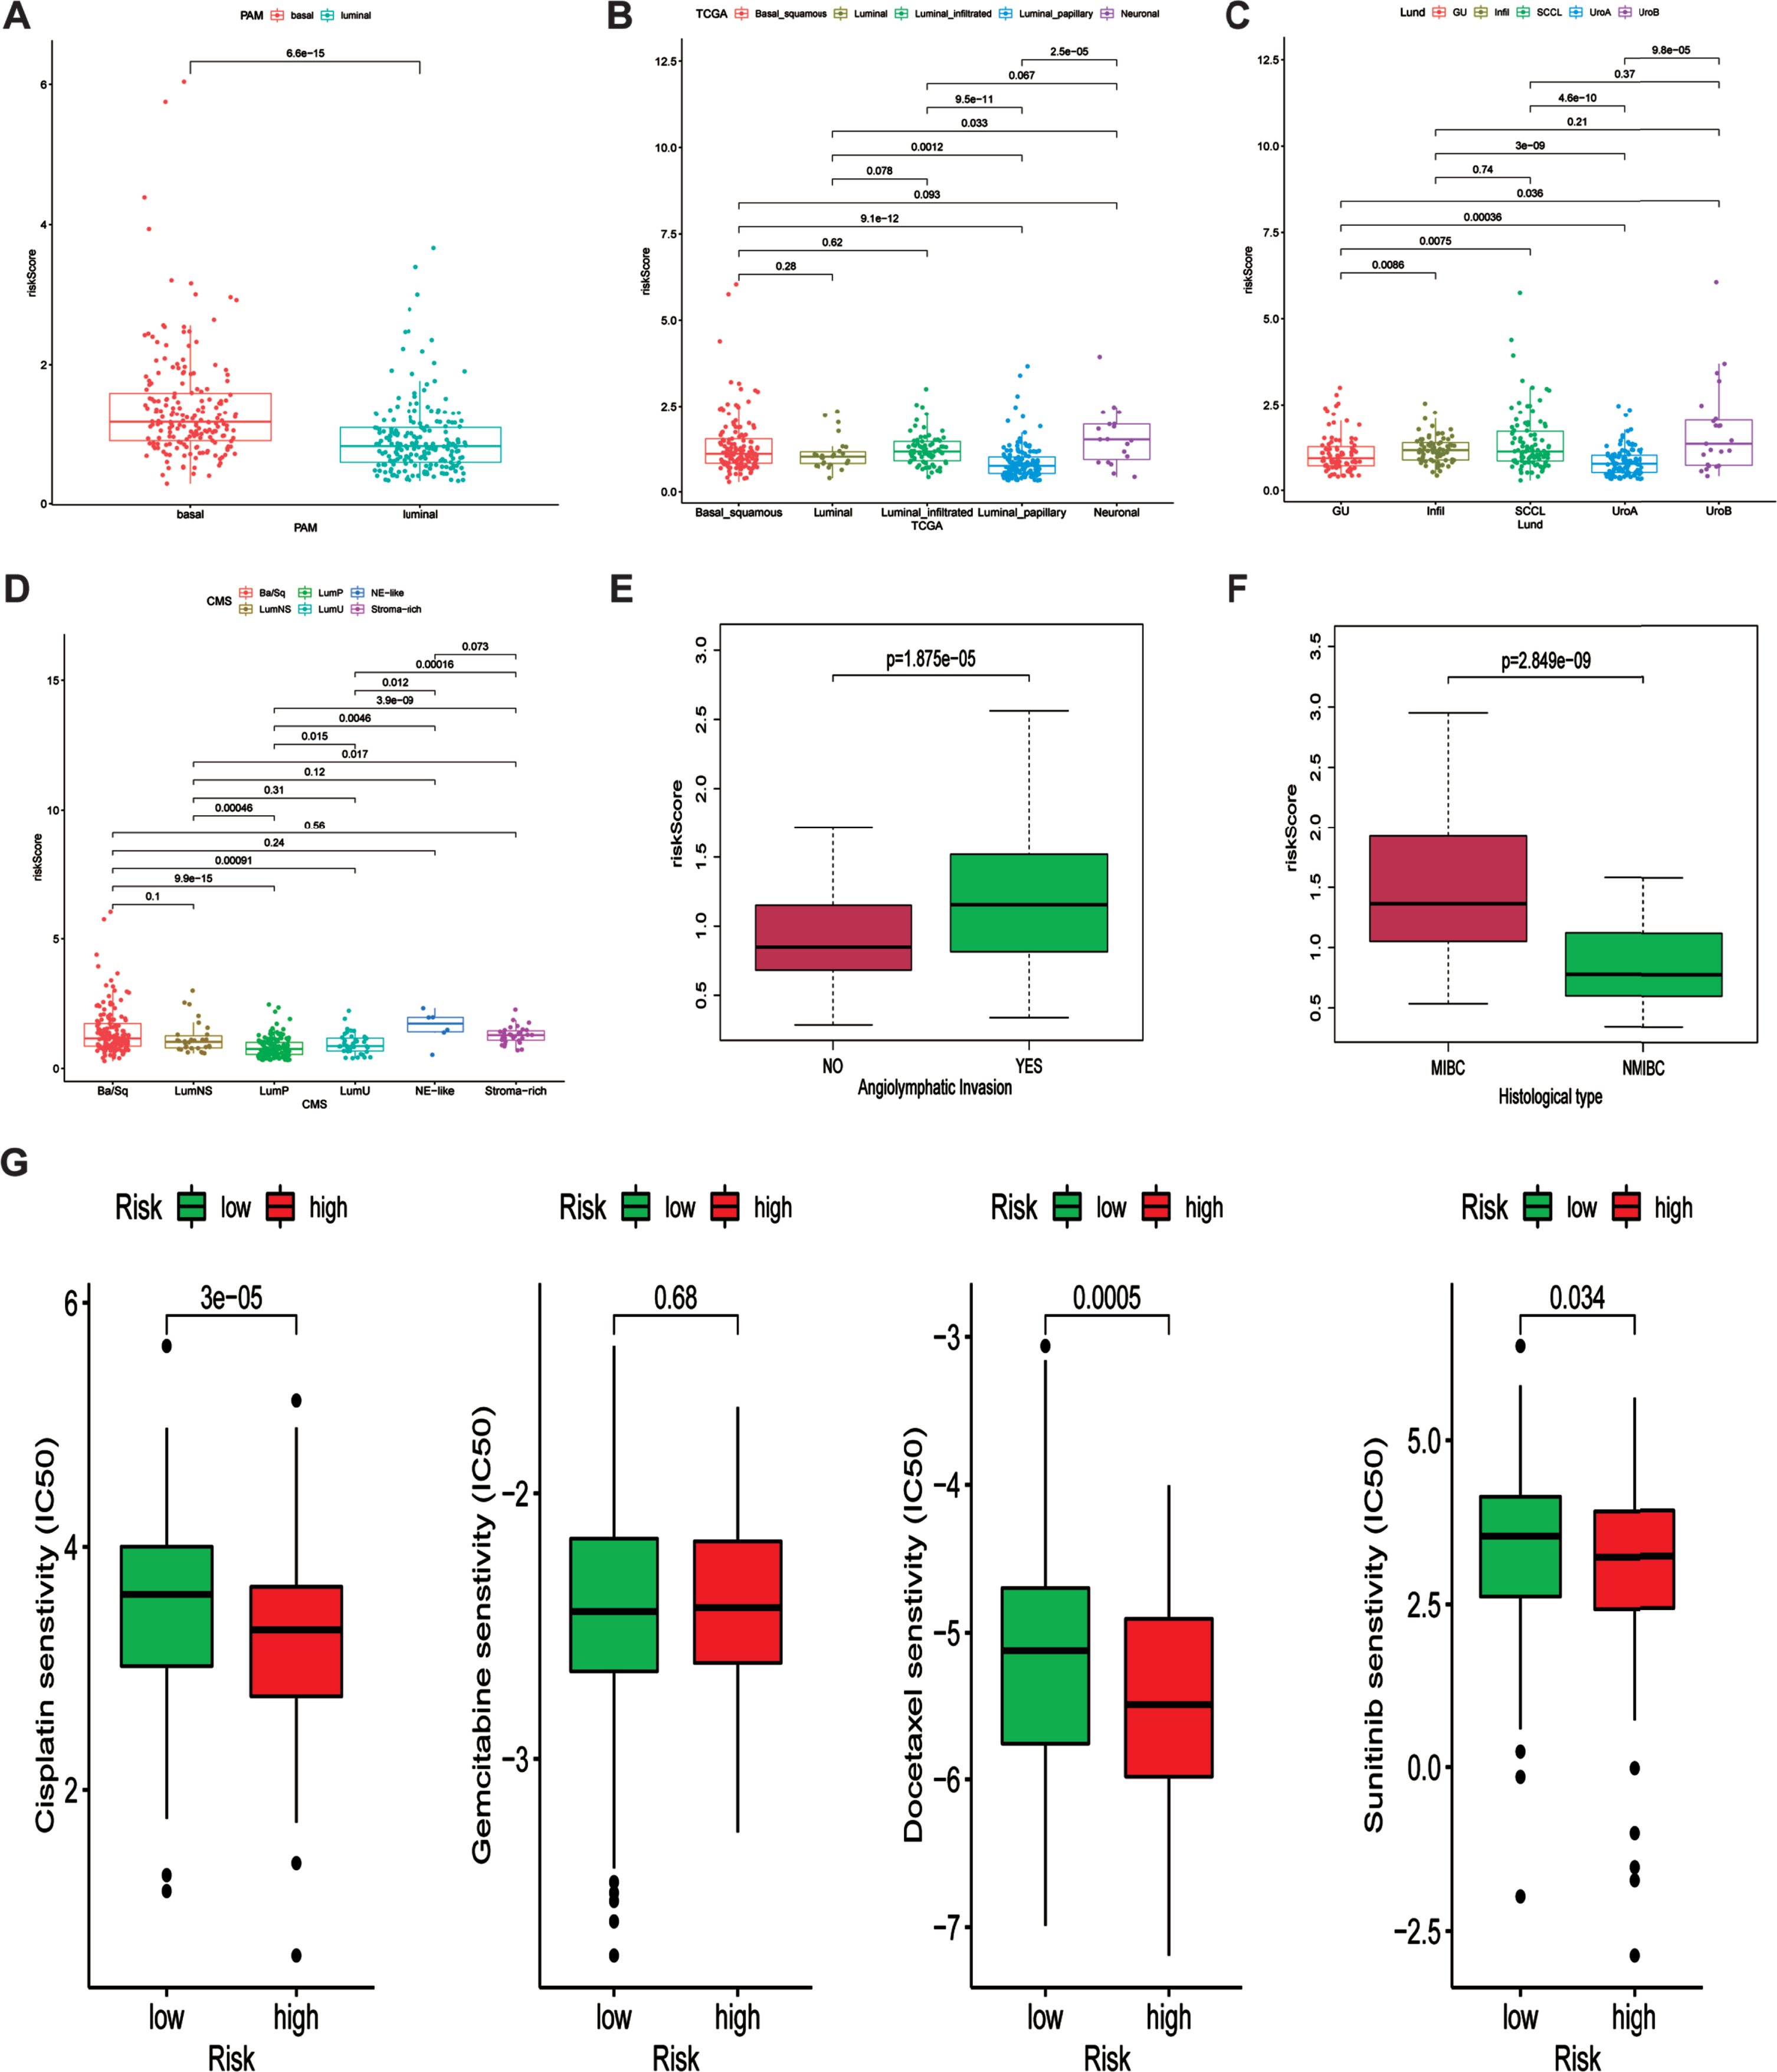
Previous work demonstrated that the expression of six FRGs were strongly correlated with various molecular subclassification. Hence, we investigated the relationship between our risk signature and various molecular subclassifications. Results demonstrated that patients in basal group tend to possess higher risk score indicating unfavorable prognosis (Fig. 8A). The relationship between our risk signature and TCGA, Lund and CMS molecular subclassifications were showed in Fig. 8B-D. Additionally, we also investigated the association between angiolymphatic invasion and ferroptosis-related gene signature. Results showed that patients with angiolymphatic invasion tend to own higher risk scores (Fig. 8E). Moreover, we subsequently detected the correlation between our risk signature and different histological types. Figure 8F revealed that patients with MIBC were correlated with higher risk scores, indicating that our risk signature had the ability to distinguish MIBC patients. Chemotherapy is the common method for treating patients diagnosed with bladder cancer. Therefore, the difference responses for cisplatin, gemcitabine, docetaxel and sunitinib between high and low risk groups were calculated based on the GDSC database. The estimated IC50 values demonstrated that patients in high-risk group had a better response for cisplatin, docetaxel and sunitinib (Fig. 8G).
Fig. 8
Association between ferroptosis-related signature and molecular subclassifications and chemotherapy response. (A-D) the association between ferroptosis-related signature and PAM, TCGA, Lund and CMS subclassification. (E) the association between angiolymphatic invasion and ferroptosis-related signature. (F) the relationship between ferroptosis-related signature and histological type (NMIBC and MIBC). (G) Various drug response between high and low risk groups.
DISCUSSION
There is growing evidence that abnormally ex-pressed FRGs are robustly associated with malignant tumors. However, there is a lack of research on the expression and potential roles of FRGs in BLCA. In this study, a total of 60 FRGs were adopted based on previous studies. We performed a PPI network using STRING to determine the association between these FRGs. Thereafter, we plotted a bar chart to demonstrate the number of adjacent nodes for each FRG. Subsequently, we combined the data from TCGA-BLCA and GSE13507 sets to perform a standardized correction for the batch effect. Univariate Cox regression, LASSO algorithm, multivariate Cox regression, and ROC curve analyses of FRGs were performed to elucidate a potential prognostic role. Ultimately, a ferroptosis risk model that might predict BLCA prognosis using six FRGs was generated. These findings will facilitate the development of novel biomarkers predicting the diagnosis and prognosis of BLCA.
It has been reported that six key FRGs, namely FADS2, GCLM, ACACA, CRYAB, ALOX5, and ACSL4, have been implicated in the progression and prognosis of various cancers. Fatty acid desaturase 2 (FADS2), an important head-to-head oriented gene that is localized in a cluster on chromosome 11 [24], was overexpressed in colorectal tumor tissues and functioned as a potential oncogene that promoted cell proliferation and growth by enhancing the metabolism of PGE2 (an oncogenic molecule involved in colorectal cancer tumorigenesis) [25]. Additionally, FADS2 was reported to be activated through the inhibition of ferroptosis by lymphoid-specific helicase (LSH, a DNA methylation modifier) [26]. This also validated our results that overexpression of FADS2 contributed to the risk level. Glutamate-cysteine ligase modifier (GCLM) is a significant subunit of glutamate-cysteine ligase (GCL), which is the rate-limiting enzyme in glutathione (GSH) synthesis [27]. Increasing the expression of GCLM can enhance GCL activity, and overexpression of both GCL subunits GCLM and GCLC leads to increased resistance to TNF-induced apoptosis [28]. GCLM also has the potential to be an effective pharmacologic target for amelioration of CDDP-resistance in non-small cell lung cancer [29]. However, the relationship between GCLM and BLCA remains unknown. Acetyl-CoA carboxylase alpha (ACACA) is a hub rate-limiting enzyme in long-chain fatty acid synthesis and has been found to be upregulated in multiple types of human cancers [30]. Silencing of ACACA in human breast and prostate cancer cells results in oxidative stress and apoptosis [31]. Alpha-B crystallin (CRYAB), which is a critical member of the small molecule heat shock protein family [32], has been shown to be overexpressed in various human tumors, particularly gastric cancer, and significantly correlated with unfavorable OS [33]. 5-lipoxygenases (ALOX5), which are frequently expressed in bladder cancer cells, may play a regulatory role in the proliferation and survival of cancer cells, and demonstrate the potential to be therapeutic targets for the disease [34, 35]. ACSL4, a key member of the acyl-CoA synthetase long-chain family, is required for ferroptotic cell death in cancer. The expression of ACSL4 was significantly downregulated in ferroptosis-resistant cells. Additionally, ACSL4 also promotes prostate cancer growth, invasion, and hormonal resistance. Few studies have reported association between these six FRGs and BLCA. In our study, the copy number variation status of ACACA was detected significant correlated with mRNA expression level(R = 0.42). Intriguingly, the mRNA levels of GCLM, FADS2, and ALOX5 were negatively correlated with DNA methylation (R = –0.48, R = –0.58, R = –0.40, respectively), which indicated that ACACA could function as a gene that might drive alterations in copy number and the other three genes could function as genes that could drive methylation.
Based on the mRNA expression level of these six FEGs, a ferroptosis risk model was established to predict the prognosis of BLCA in TCGA training-cohort. The KM plot demonstrated that the high-risk subgroup was significantly associated with unfavorable OS. Additionally, the ROC curve analysis indicated that these six FRGs exhibited an impactful prognostic value to distinguish BLCA patients with unfavorable OS. Subsequently, the GSE13507 dataset was adopted to estimate the prognostic value of the signature of these six FRGs. Remarkably, the GSE13507 dataset outcomes surpassed the outcomes of TCGA training-cohort. Furthermore, the relationship between clinicopathological features, molecular subclassification and the expression of FRGs was also analyzed. Results showed that T-stage and N-stage was significantly related to the expression of FADS2, CRYAB and GCLM, and that the WHO grade was significantly associated with all six FRGs. Besides, the expression of all six FRGs were significantly correlated with Lund and CMS molecular subclassification.
BLCA patients were categorized into two subgroups based on the risk score of our model, to investigate the molecular mechanism of the six FRGs that might facilitate bladder carcinogenesis. We performed GSEA analysis based on the hallmarks gene set database. Ultimately, the results showed that the high ferroptosis risk subgroup was strongly related to the hedgehog signaling pathway. Clinical and fundamental researches have shown that hedgehog signaling pathways regulate the growth and tumorigenicity of BLCA [36–38].
Moreover, the patients in basal group were also correlated with higher risk score, indicating that the ferroptosis-related signature combine with molecular subclassification could predict the prognosis of patients and guide the individualized treatment. Besides, the response for cisplatin, gemcitabine, docetaxel and sunitinib were analyzed based on the GDSC database. And the results demonstrated that high risk group showed low estimated IC50, suggesting that FRGs might regulated drug response.
There are several limitations in our study which worth mentioning. Firstly, our ferroptosis-related risk model was constructed only based on the data from TCGA and GEO database, which need to be further validated in the clinical patient cohort and prospective study. Besides, in vivo and in vitro experiments should be carried out to further verify our analyses and figure out the molecular mechanisms.
Collectively, in this study, we demonstrated the correlation between hub FRGs expression and clinicopathological characteristics. Besides, we generated and verified a ferroptosis risk model using six FRGs. The risk score in our model has the potential to be an independent prognostic factor for BLCA.
ACKNOWLEDGMENTS
The authors have no acknowledgments
FUNDING
This study was supported by National Natural Science Foundation (No. 81902565), funding from Young Talent Development Plan of Changzhou Health Commission (No. CZQM2020065), Young Scientists Foundation of Changzhou No.2 People’s Hospital (2019K008), Changzhou Sci & Tech program (CJ20190100).
AUTHOR CONTRIBUTIONS
Li Zuo, Lifeng Zhang: Project development
Xiaokai Shi: Data collection; Writing- Original draft
Lei Zhang: software visualization;
Chuang Yue, Xiao Zhou: Investigation; Validation
Jiasheng Cheng, Shenglin Gao: Supervision; Writing- review & editing
All authors have access to the data.
ETHICAL CONSIDERATIONS
This study, as a bioinformatics analysis, is exempt from any requirement for Institutional Review Board approval.
CONFLICT OF INTEREST
Xiaokai Shi, Xiao Zhou, Lei Zhang, Chuang Yue, Shenglin Gao, Jiasheng Cheng, Li Zuo and Lifeng Zhang have no conflict of interest to report.
REFERENCES
[1] | Siegel RL , Miller KD , Jemal A . Cancer statistics, 2019. CA Cancer J Clin. (2019) ;69: (1):7–34 [https://doi.org/10.3322/caac.21551][PMID: 30620402]. |
[2] | Liu X , Jiang J , Yu C , et al. Secular trends in incidence and mortality of bladder cancer in China, 1990-2017: A joinpoint and age-period-cohort analysis. Cancer Epidemiology. (2019) ;61: :95–103 [https://doi.org/10.1016/j.canep.2019.05.011][PMID: 31176961] |
[3] | Kaufman DS , Shipley WU , Feldman AS . Bladder cancer. The Lancet. (2009) ;374: (9685):239–49 [https://doi.org/10.1016/S0140-6736(09)60491-8][PMID: 19520422] |
[4] | Park S , Reuter VE , Hansel DE . Non-urothelial carcinomas of the bladder. Histopathology. (2019) ;74: (1):97–111 [https://doi.org/10.1111/his.13719][PMID: 30565306] |
[5] | Nadal R , Bellmunt J . Management of metastatic bladder cancer. Cancer Treat Rev. (2019) ;76: :10–21 [https://doi.org/10.1016/j.ctrv.2019.04.002][PMID: 31030123] |
[6] | Massari F , Santoni M , Ciccarese C , et al. Emerging concepts on drug resistance in bladder cancer: Implications for future strategies. Critical Reviews in Oncology/Hematology. (2015) ;96: (1):81–90 [https://doi.org/10.1016/j.critrevonc.2015.05.005][PMID: 26022449] |
[7] | Dixon SJ , Lemberg KM , Lamprecht MR , et al. Ferroptosis: an iron-dependent form of nonapoptotic cell death. Cell. (2012) ;149: (5):1060–72 [https://doi.org/10.1016/j.cell.2012.03.042][PMID: 22632970] |
[8] | Friedmann Angeli JP , Schneider M , Proneth B , et al. Inactivation of the ferroptosis regulator Gpx4 triggers acute renal failure in mice. Nat Cell Biol. (2014) ;16: (12):1180–91 [https://doi.org/10.1038/ncb3064][PMID: 25402683] |
[9] | Feng H , Stockwell BR . Unsolved mysteries: How does lipid peroxidation cause ferroptosis? PLoS Biol. (2018) ;16: (5):e2006203 [https://doi.org/10.1371/journal.pbio.2006203][PMID: 29795546] |
[10] | Tang M , Chen Z , Di Wu , Chen L . Ferritinophagy/ferroptosis: Iron-related newcomers in human diseases. J Cell Physiol. (2018) ;233: (12):9179–90 [https://doi.org/10.1002/jc26954][PMID: 30076709] |
[11] | Nassar ZD , Mah CY , Dehairs J , et al. Human DECR1 is an androgen-repressed survival factor that regulates PUFA oxidation to protect prostate tumor cells from ferroptosis. eLife. (2020) ;9: [https://doi.org/10.7554/eLife.54166][PMID: 32686647] |
[12] | Badgley MA , Kremer DM , Maurer HC , et al. Cysteine depletion induces pancreatic tumor ferroptosis in mice. Science. (2020) ;368: (6486):85–9 [https://doi.org/10.1126/science.aaw9872][PMID: 32241947] |
[13] | Bai T , Lei P , Zhou H , et al. Sigma-1 receptor protects against ferroptosis in hepatocellular carcinoma cells. Journal of Cellular and Molecular Medicine. (2019) ;23: (11):7349–59 [https://doi.org/10.1111/jcmm.14594][PMID: 31507082] |
[14] | Le Jiang , Kon N , Li T , et al. Ferroptosis as a p53-med-iated activity during tumour suppression. Nature. (2015) ;520: (7545):57–62 [https://doi.org/10.1038/nature14344] [PMID: 25799988] |
[15] | Gnanapradeepan K , Basu S , Barnoud T , Budina-Kolomets A , Kung C-P , Murphy ME . The p53 Tumor Suppressor in the Control of Metabolism and Ferroptosis. Front Endocrinol (Lausanne). (2018) ;9: :124 [https://doi.org/10.3389/fendo.2018.00124][PMID: 29695998] |
[16] | Wu G , Wang Q , Xu Y , Li Q , Cheng L . A new survival model based on ferroptosis-related genes for prognostic prediction in clear cell renal cell carcinoma. Aging (Albany NY). (2020) ;12: (14):14933–48 [https://doi.org/10.18632/aging.103553][PMID: 32688345] |
[17] | Dixon SJ , Winter GE , Musavi LS , et al. Human Haploid Cell Genetics Reveals Roles for Lipid Metabolism Genes in Nonapoptotic Cell Death. ACS Chem Biol. (2015) ;10: (7):1604–9 [https://doi.org/10.1021/acschembio.5b00245][PMID: 25965523] |
[18] | Stockwell BR , Friedmann Angeli JP , Bayir H , et al. Ferroptosis: A Regulated Cell Death Nexus Linking Metabolism, Redox Biology, and Disease. Cell. (2017) ;171: (2):273–85 [https://doi.org/10.1016/j.cell.2017.09.021][PMID: 28985560] |
[19] | Liang J , Wang D , Lin H , et al. A Novel Ferroptosis-related Gene Signature for Overall Survival Prediction in Patients with Hepatocellular Carcinoma. Int J Biol Sci. (2020) ;16: (13):2430–41 [https://doi.org/10.7150/ijbs.45050][PMID: 32760210] |
[20] | Kamoun A , Reyniès A de , Allory Y , et al. A Consensus Molecular Classification of Muscle-invasive Bladder Cancer. Eur Urol. (2020) ;77: (4):420–33 [https://doi.org/10.1016/j.eururo.2019.09.006][PMID: 31563503] |
[21] | Robertson AG , Kim J , Al-Ahmadie H , et al. Comprehensive Molecular Characterization of Muscle-Invasive Bladder Cancer. Cell. (2017) ;171: (3):540–556.e25 [https://doi.org/10.1016/j.cell.2017.09.007][PMID: 28988769] |
[22] | Damrauer JS , Hoadley KA , Chism DD , et al. Intrinsic subtypes of high-grade bladder cancer reflect the hallmarks of breast cancer biology. Proceedings of the National Academy of Sciences of the United States of America. (2014) ;111: (8):3110–5 [https://doi.org/10.1073/pnas.1318376111][PMID: 24520177] |
[23] | Lu X , Meng J , Zhu J , et al. Prognosis stratification and personalized treatment in bladder cancer through a robust immune gene pair-based signature. Clin Transl Med. (2021) ;11: (6):e453 [https://doi.org/10.1002/ctm2.453][PMID: 34185409] |
[24] | Marquardt A , Stöhr H , White K , s Weber BH . cDNA cloning, genomic structure, and chromosomal localization of three members of the human fatty acid desaturase family. Genomics. (2000) ;66: (2):175–83 [https://doi.org/10.1006/geno.2000.6196][PMID: 10860662] |
[25] | Tian J , Lou J , Cai Y , et al. Risk SNP-Mediated Enhancer-Promoter Interaction Drives Colorectal Cancer through Both FADS2 and AP002754.2. Cancer Research. (2020) ;80: (9):1804–18 [https://doi.org/10.1158/0008-5472.CAN-19-2389][PMID: 32127356] |
[26] | Jiang Y , Mao C , Yang R , et al. EGLN1/c-Myc Induced Lymphoid-Specific Helicase Inhibits Ferroptosis through Lipid Metabolic Gene Expression Changes. Theranostics. (2017) ;7: (13):3293–305 [https://doi.org/10.7150/thno.19988][PMID: 28900510] |
[27] | Föller M , Harris IS , Elia A , et al. Functional significance of glutamate-cysteine ligase modifier for erythrocyte survival in vitro and in vivo. Cell Death Differ. (2013) ;20: (10):1350–8 https://doi.org/10.1038/cdd.2013.70][PMID: 23787995] |
[28] | Botta D , Franklin CC , White CC , et al. Glutamate-cysteine ligase attenuates TNF-induced mitochondrial injury and apoptosis. Free Radical Biology & Medicine. (2004) ;37: (5):632–42 [https://doi.org/10.1016/j.freeradbiomed.2004.05.027][PMID: 15288121] |
[29] | Inoue Y , Tomisawa M , Yamazaki H , et al. The modifier subunit of glutamate cysteine ligase (GCLM) is a molecular target for amelioration of cisplatin resistance in lung cancer. Int J Oncol. (2003) ;23: (5):1333–9 [PMID: 14532974]. |
[30] | Chajès V , Cambot M , Moreau K , Lenoir GM , Joulin V . Acetyl-CoA carboxylase alpha is essential to breast cancer cell survival. Cancer Research. (2006) ;66: (10):5287–94 [https://doi.org/10.1158/0008-5472.CAN-05-1489][PMID: 16707454] |
[31] | Wang C , Xu C , Sun M , Luo D , Liao D-F , Cao D . Acetyl-CoA carboxylase-alpha inhibitor TOFA induces human cancer cell apoptosis. Biochem Biophys Res Commun. (2009) ;385: (3):302–6 [https://doi.org/10.1016/j.bbrc.2009.05.045][PMID: 19450551] |
[32] | Annertz K , Enoksson J , Williams R , Jacobsson H , Coman WB , Wennerberg J . Alpha B-crystallin - a validated prognostic factor for poor prognosis in squamous cell carcinoma of the oral cavity. Acta Otolaryngol. (2014) ;134: (5):543–50 [https://doi.org/10.3109/00016489.2013.872293][PMID: 24702231] |
[33] | Tao X , Cheng L , Li Y , et al. Expression of CRYAB with the angiogenesis and poor prognosis for human gastric cancer. Medicine (Baltimore). (2019) ;98: (45):e17799 [https://doi.org/10.1097/MD.0000000000017799][PMID: 31702632] |
[34] | Yoshimura R , Matsuyama M , Tsuchida K , Kawahito Y , Sano H , Nakatani T . Expression of lipoxygenase in human bladder carcinoma and growth inhibition by its inhibitors. J Urol. (2003) ;170: (5):1994–9 [https://doi.org/10.1097/01.ju.0000080296.54262.c8][PMID: 14532840] |
[35] | Hayashi T , Nishiyama K , Shirahama T . Inhibition of 5-lipoxygenase pathway suppresses the growth of bladder cancer cells. Int J Urol. (2006) ;13: (8):1086–91 [https://doi.org/10.1111/j.1442-2042.2006.01485.x][PMID: 16903934] |
[36] | Fei DL , Sanchez-Mejias A , Wang Z , et al. Hedgehog signaling regulates bladder cancer growth and tumorigenicity. Cancer Research. (2012) ;72: (17):4449–58 [https://doi.org/10.1158/0008-5472.CAN-11-4123][PMID: 22815529] |
[37] | Chen Z , Zhou L , Chen L , et al. RSPO3 promotes the aggressiveness of bladder cancer via Wnt/β-catenin and Hedgehog signaling pathways. Carcinogenesis. (2019) ;40: (2):360–9 [https://doi.org/10.1093/carcin/bgy140][PMID: 30329043] |
[38] | Shin K , Lim A , Zhao C , et al. Hedgehog signaling restrains bladder cancer progression by eliciting stromal production of urothelial differentiation factors. Cancer Cell. (2014) ;26: (4):521–33 [https://doi.org/10.1016/j.ccell.2014.09.001][PMID: 25314078] |


