
Efficacy of EGFR Inhibitors and NSAIDs Against Basal Bladder Cancers in a Rat Model: Daily vs. Weekly Dosing, Combining EGFR Inhibitors with Naproxen, and Effects on RNA Expression
Abstract
BACKGROUND:
There are few effective treatments specifically aimed at basal bladder cancer.
OBJECTIVE:
Female F344 rats administered N-butyl-N-(4-hydroxybutyl)-nitrosamine (OH-BBN) develop large invasive bladder cancers. We determined the efficacy of daily vs weekly dosing of EGFR inhibitors, determined the efficacy of naproxen combined with an EGFR inhibitor, and performed RNA analysis of bladder tumors treated for 5 days with EGFR inhibitors or NO-naproxen to identify pharmacodynamic biomarkers.
METHODS:
Erlotinib (6 mg/Kg BW daily or 21 or 42 mg/Kg BW weekly), lapatinib (25 or 75 mg/Kg BW daily or 263 or 525 mg/Kg BW weekly) and/or naproxen (30 mg/Kg BW daily) were administered to OH-BBN-treated rats beginning 2–12 weeks post OH-BBN. Rats were sacrificed 28 weeks after the final OH-BBN treatment to determine the effects of the EGFR inhibitors + naproxen on bladder weights and tumor development. In a separate study, rats were treated with OH-BBN. When palpable tumors developed, rats were treated with erlotinib, lapatinib, gefitinib, or the NSAID NO-naproxen for 5 days. RNA analysis was performed on the tumors.
RESULTS:
Daily or weekly dosing of erlotinib or lapatinib and daily dosing of naproxen reduced large tumor formation up to 70%, while combining daily lapatinib and naproxen reduced tumors 100%. RNA Analysis: All EGFR inhibitors strongly reduced cell proliferation and chromosome replication pathways, while NO-naproxen altered the G protein receptor, oxygen homeostasis and immune function pathways.
CONCLUSIONS:
While daily and weekly dosing with EGFR inhibitors and naproxen were effective, combining lapatinib and naproxen yielded no tumors. This might encourage its clinical use in an adjuvant setting with superficial basal tumors, and perhaps even in a more advanced setting. Furthermore, RNA analysis identified specific pathways that might be potential pharmacodynamic biomarkers in clinical trials.
INTRODUCTION
Like breast cancer, human bladder cancer can be subdivided into basal or luminal types [1, 2] based the expression of keratins 5,6, and 14 (basal) or keratins 8 and 15 (luminal) [3]. Basal bladder tumors also overexpress epidermal growth factor receptor (EGFR) and thus could be targeted by small molecule inhibitors of the EGFR pathway, including the EGFR1 inhibitors gefitinib and erlotinib [4], and the combined EGFR2/1 inhibitor lapatinib. The N-butyl-N-(4-hydroxybutyl)-nitrosamine (OH-BBN)-induced rat model of bladder cancer shows an increased expression of all three basal keratins and a decrease in luminal keratin 18 [5], suggesting that tumors arising in this model are of the basal subtype. In the OH-BBN-induced bladder cancer model, daily dosing with gefitinib [6] was effective not only when administered immediately after the last dose of OH-BBN, but also 10 weeks after the last dose of OH-BBN (when bladder microcarcinomas are observed in approximately 50%of the rats) [7].
Human clinical trials conducted in a therapeutic setting have shown that weekly dosing with EGFR inhibitors reduces the severity of toxicities (acneiform skin rashes and diarrhea) associated with daily dosing [8, 9], while preclinical studies in the rat N-Nitroso-N-methylurea (MNU) model of estrogen receptor (ER)-positive breast cancer and the A/J induced lung tumor model have shown that EGFR inhibitors can be effective when administered weekly at 7x the daily dose [10–12]. Similarly, combining slightly lower doses of two effective agents with non-overlapping toxicities can also reduce toxicity and potentially improve efficacy [13]. Thus, given the efficacy of daily gefitinib in the OH-BBN rat bladder cancer model and the finding that the OH-BBN model is highly sensitive to the preventive activity of a variety of nonsteroidal anti-inflammatory drugs (NSAIDs) [6, 7, 14], we herein tested the efficacy of erlotinib and lapatinib administered daily or weekly or in combination with the NSAID naproxen.
To gain mechanistic insight into specific agents and determine their likely efficacy following long-term exposure, investigators have often looked at the levels of non-specific biomarkers of proliferation and apoptosis following short-term drug exposure in a neoadjuvant setting [15]. In addition to measurements of proliferation and apoptosis, we have shown that the measurement of RNA expression following the short-term treatment of lesions in several animal models of cancer allows one to determine both modulated pathways and genes that might be potential pharmacodynamic biomarkers in clinical trials [16–18]. With this goal in mind, in the present study, we also examined the effects of short-term treatment of bladder cancers with gefitinib, erlotinib, lapatinib, or NO-naproxen on RNA expression.
MATERIALS AND METHODS
Reagents
Gefitinib, erlotinib, lapatinib, naproxen, NO-naproxen, and zileuton were all obtained from the NCI’s Division of Cancer Prevention Repository. The carcinogen OH-BBN was purchased from TCI America (Portland, OR). Female Fischer-344 (F344) rats were obtained from Harlan Sprague-Dawley, Inc (Indianapolis, IN) at 4 weeks of age. Diets were purchased from Teklad (Harlan Teklad, Madison, WI) and were provided ad libitum.
Efficacy studies in the urinary bladder cancer model
All animal experiments were conducted in AAALAC-approved facilities at the University of Alabama at Birmingham (IACUC-20269). Studies using the OH-BBN-induced urinary bladder cancer model to investigate chemopreventive efficacy were performed as previously described [7, 14]. Beginning at 56 days of age, female F344 rats were treated twice a week with 150 mg OH-BBN by gavage for 8 weeks. There were 27–34 rats per group. The rats were weighed 1x/week and palpated for urinary bladder tumors 2x/week. Intragastric administration of naproxen or the indicated EGFR inhibitor was initiated either 2 weeks (early intervention) or 10 or 12 weeks (late intervention) after the final OH-BBN treatment. For the early intervention, lapatinib was administered at a dose of 25 or 75 mg/Kg BW/day beginning 2 weeks post-OH-BBN administration. To determine the effect of daily vs. weekly administration in a late intervention setting, lapatinib was administered at doses of 75 mg/Kg BW/day, 525 mg/Kg BW/week, or 263 mg/Kg BW/week beginning 10 weeks post-OH-BBN treatment; and erlotinib was administered at doses of 6 mg/Kg BW/day, 42 mg/Kg BW/week, or 21 mg/Kg BW/week beginning 12 weeks post-OH-BBN-treatment. For the combination treatment, lapatinib was administered at a dose of 75 mg/Kg BW/day and naproxen was administered at a dose of 30 mg/Kg BW/day, both beginning 10 weeks post-OH-BBN treatment. The vehicle for naproxen was saline, and the vehicle for the various EGFR inhibitors was polyethylene glycol 400: ethanol (90:10, v/v). The gavage volume was 0.5 ml/rat. Beginning 2 months post-OH-BBN, twice weekly palpation was initiated. The study was terminated seven months (28 weeks) after the last OH-BBN treatment. At necropsy, urinary bladders with associated lesions were excised and weighed. Tumor incidence and the percentage of rats with large tumors (> 200 mg bladder weight) were recorded as endpoints for cancer prevention. Statistical analysis of the latency of large tumors and final incidence was performed employing a log-rank test. Statistical analysis of bladder weights was performed by the Mann Whitney Wilcoxon Rank Sum Test because the tumor weights did not follow a normal distribution [7, 14]. None of the individual agents (lapatinib, erlotinib, naproxen or the combination of lapatinib and naproxen) significantly altered body weights relative to controls over the course of the study (data not shown).
RNA analysis in rat bladder cancers
These studies were performed exactly as previously described [18]. Female F344 rats were treated with OH-BBN as described above. Starting four months after the final dose of OH-BBN, the animals were palpated twice per week to detect lesions. When an animal developed a small palpable tumor (150–300 mg), rats were either not treated (control groups) or treated daily with the indicated agents (treatment groups) for 5 days. The relative efficacies of the various agents following long-term exposure are presented in Supplementary Table 1. The vehicle for the EGFR inhibitors was polyethylene glycol 400: ethanol (90:10, v/v), while NO-naproxen and zileuton were administered in the diet as previously described [14]. The doses were as follows: gefitinib,10 mg/Kg BW/day; lapatinib, 75 mg/Kg BW/day; erlotinib, 6 mg/Kg BW/day; NO-naproxen, 560 mg/Kg diet; and zileuton, 1200 mg/Kg of diet.
After the 5-day treatment period, the rats were euthanized and the bladder tumors excised. Total RNA was isolated with Trizol (Invitrogen, Carlsbad, CA) and purified using the RNeasy Mini Kit (QIAGEN, Valencia, CA). Residual DNA was removed with the RNase-free DNase Set (QIAGEN, Valencia, CA). cDNA for each sample was synthesized using a Superscript cDNA Synthesis Kit (Invitrogen) and a T7-(dT)24 primer: 5′-GGCCAGTGAATTGTAATACGACT-CACTATAGGGAGGCGG-(dT)24-3’. The cDNA was purified by phenol:chloroform extraction, and then the biotin-labeled cRNA was transcribed in vitro from cDNA using the ENZO Biochem high-yield RNA transcript labelling kit. The labeled cRNA was hybridized to the Affymetrix Rat Exon 1.0 ST Array (Affymetrix, Santa Clara, CA) according to the manufacturer’s recommendations. Five arrays each were used for the control and treated samples group.
Identifying differentially expressed genes and enriched signalling pathways
A two-sample Student’s t test was used to identify differentially expressed genes (DEGs) between two groups. The DEGs were defined as genes with a local false discovery rate (LFDR) < 0.05 and a fold-change > 1.5 between two groups. Gene set enrichment analysis (GSEA) was performed to analyze the pattern of differential gene expression. GSEA is a computational method that determines whether a set of genes shows statistically significant differences in expression between two biological states (http://www.broad.mit.edu/gsea). Using the Kolmogorov-Smirnov statistics, GSEA assesses the degree of “enrichment” of a set of genes (e.g. a pathway) in the entire range of the strength of associations with the phenotype of interest. We used curated gene sets (c2) which contain genes in certain molecular pathways, and gene ontology (GO) gene sets (c5) which consist of genes annotated by the same GO terms in the Molecular Signature Database (MSigDB, http://www.broad.mit.edu/gsea/msigdb/msigdb_index.html). Due to a small sample size, the GSEA with the gene set permutation option was performed. Selected gene sets identified from GSEA were then visualized with MetaCore™ software (http://www.genego.com/).
Expression of the basal keratin 5 in rat bladder tumors
Tumor samples were obtained in the same manner as the control tumors used for RNA analysis (see above) and fixed in formalin. Normal bladder tissue was obtained from rats at 12 weeks of age. After embedding in paraffin blocks, bladder tumor/tissue sections (4 microns thick) were placed on positive microscope slides. The sections were de-paraffinized with xylene and placed in ethanol. Antigen retrieval employed boiling in sodium citrate (pH, 6.0) for 20 minutes. Slides were then covered with peroxidase block for 3 hours and washed with tris buffer. The sections were incubated with primary antibody cytokeratin 5 (Abcam, Cambridge, MA) for one hour at room temperature. Processing and staining were performed according to the manufacturer’s procedures (DAKA Envision + Kits, Carpin Teria, CA). The sections were then washed and dehydrated in ethanol and xylene. The images were captured and using the Aperio Scan Scope imaging system (Aperio Imaging, Visa, CA).
RESULTS
Expression of basal keratin 5 in OH-BBN-induced rat bladder tumors
Our prior studies of OH-BBN-induced rat tumors [5] showed that the basal keratins 5, 6, and 14 were expressed in these tumors at higher levels than in control rat bladders (see Supplemental Table 2). To confirm these results, we examined the expression of keratin 5 in these tumors by immunohistochemistry (IHC). Keratin 5 was expressed in only a subset of cells of the basement membrane of normal rat bladder epithelia (Fig. 1A).
Fig. 1
Representative images of keratin 5 expression in (A) normal bladder tissue obtained from 12-week old, untreated rats and (B) transitional cell cancers from a female F344 rat that had been treated with OH-BBN. The OH-BBN-treated rat in (B) was palpated twice per week starting 4 months after the final dose of OH-BBN and the animal was euthanized 5 days after the detection of a palpable tumor. The images were taken at 20X and 40X magnification.
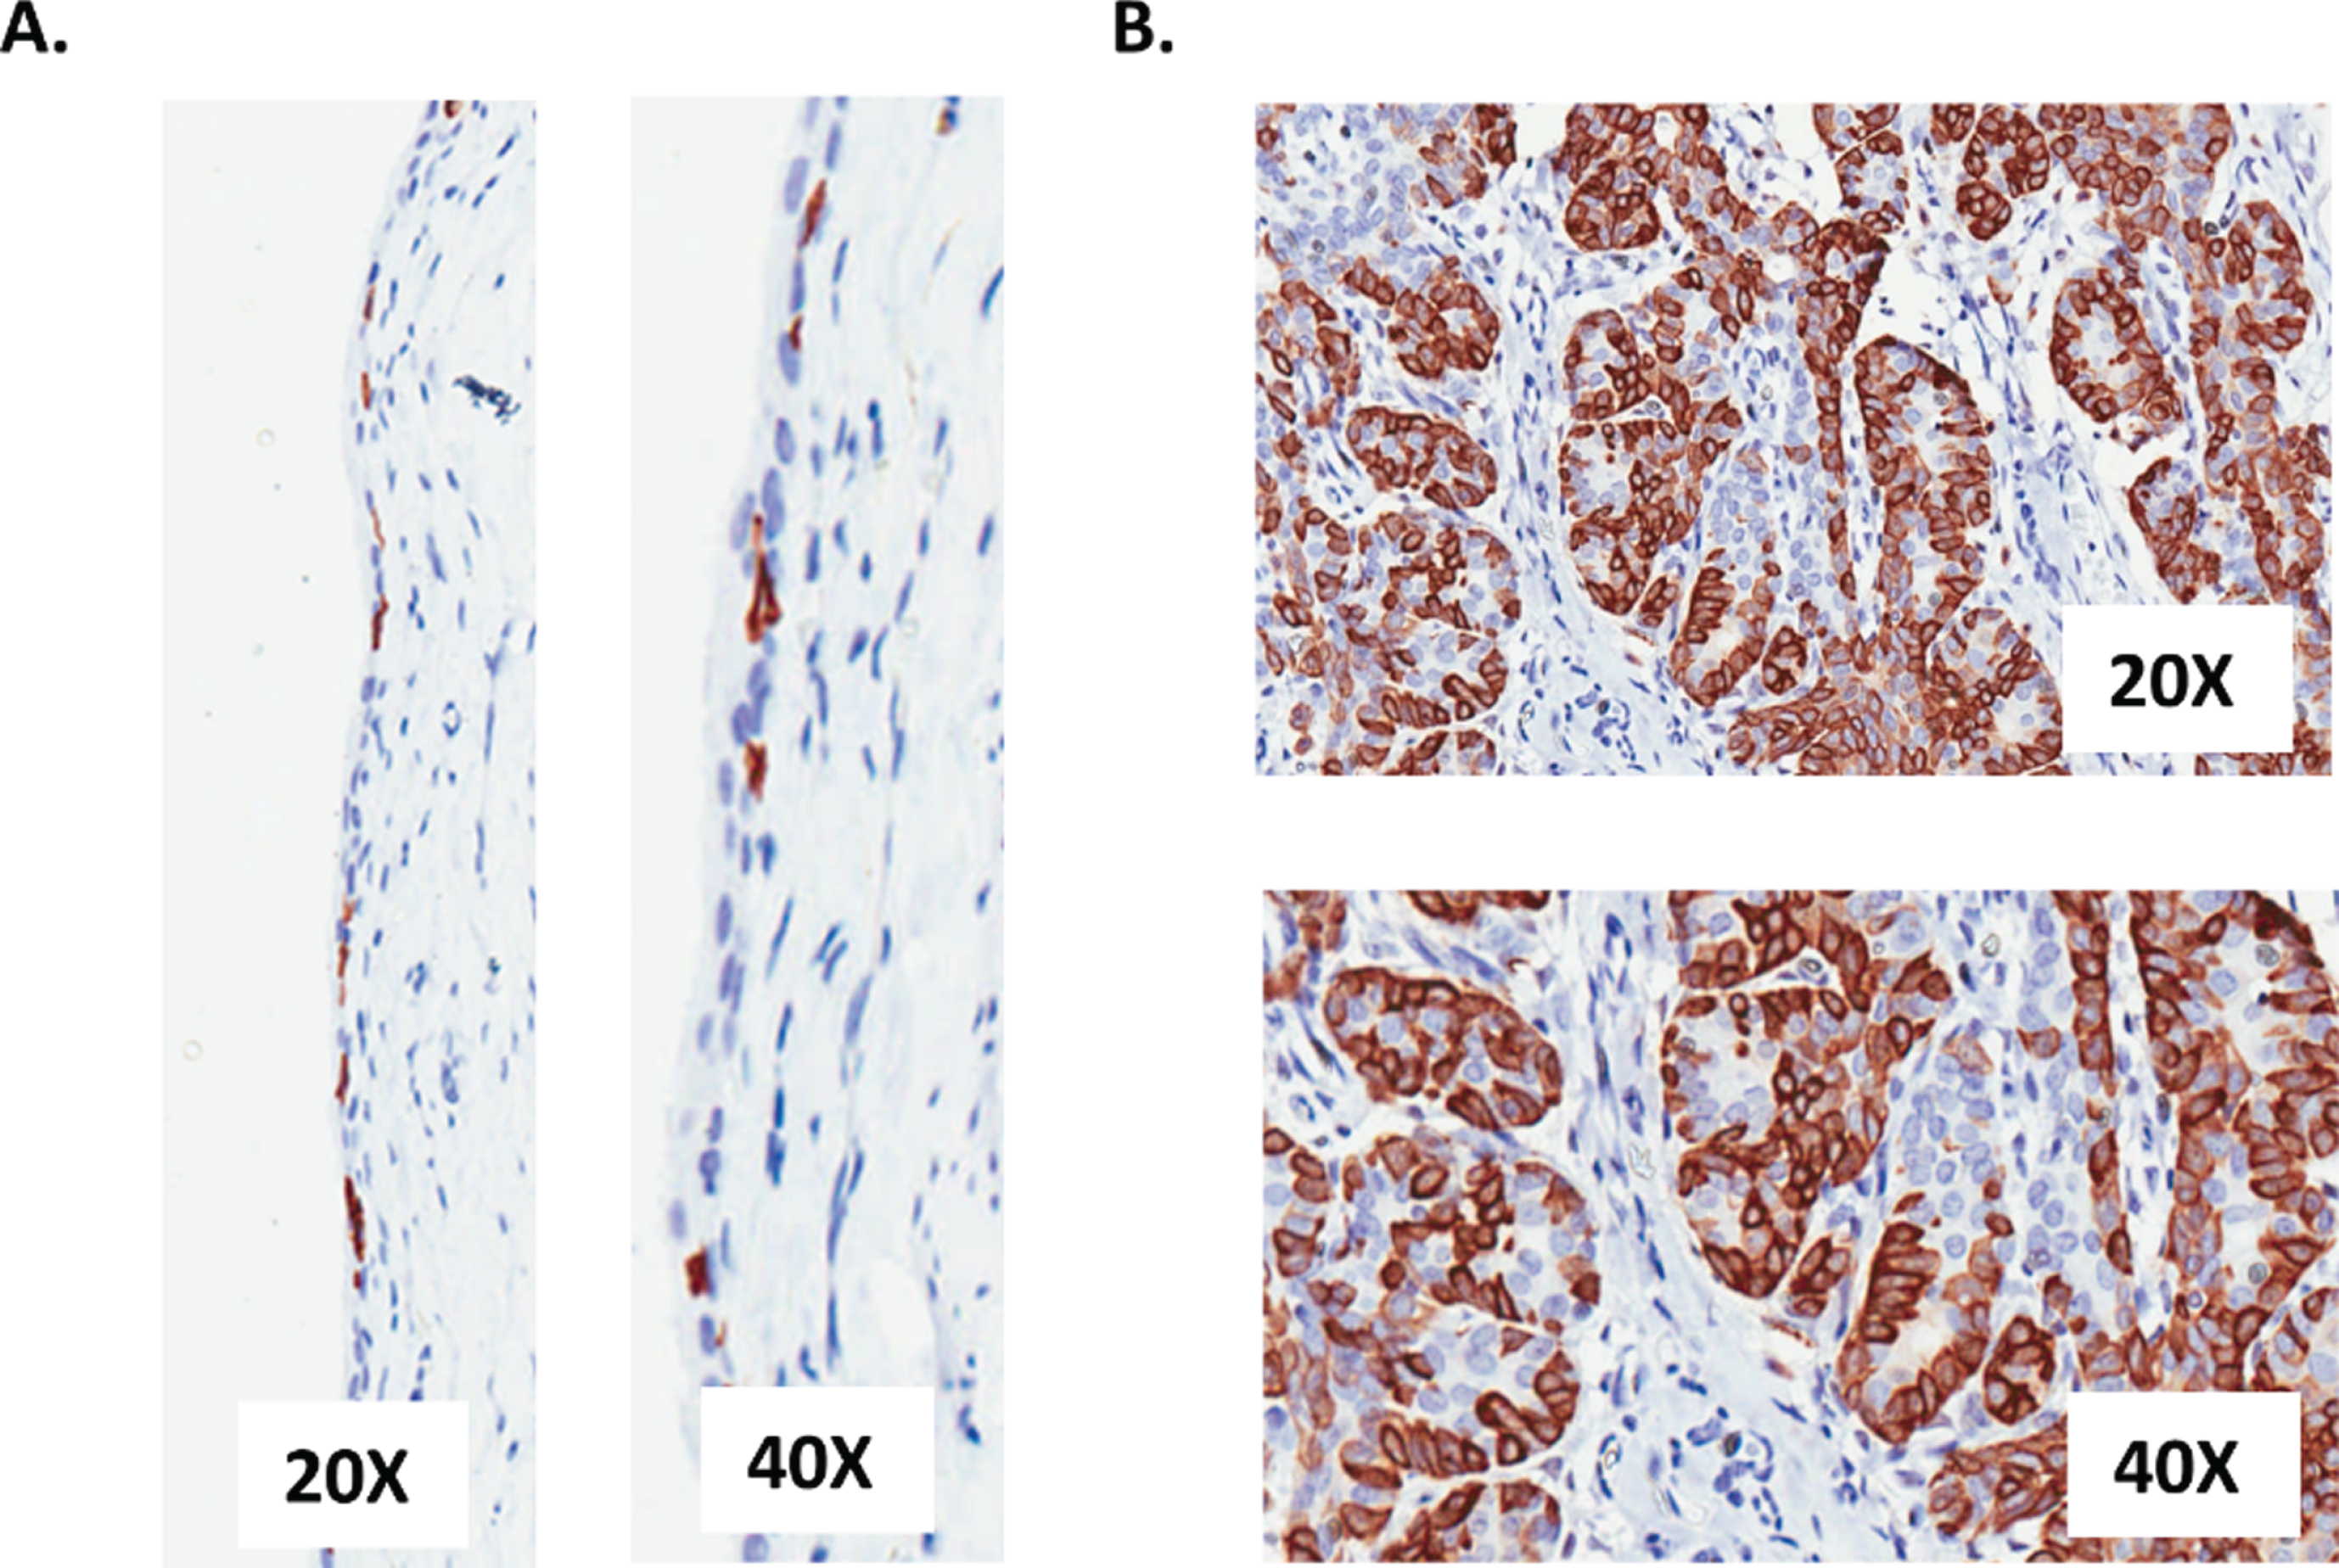
In contrast, we obtained a strong and consistent expression of keratin 5 in the epithelial cells of the tumor (Fig. 1B), thus supporting a basal phenotype.
Efficacy of daily vs. weekly administration of lapatinib and erlotinib
Due to their overexpression of EGFR, basal bladder cancers are thought to be susceptible to treatment with EGFR inhibitors. Thus, we tested the daily administration of both lapatinib (25 or 75 mg/Kg BW/day) and erlotinib (6 mg/Kg BW/day) beginning 2 weeks (early intervention) and/or 10 or 12 weeks (late intervention) after the last dose of OH-BBN (Fig. 2A). Daily administration of lapatinib caused a dose-dependent reduction in the development of large bladder cancers when initiated 2 weeks post-OH-BBN (Table 1, Fig. 2B). When administered 10 or 12 weeks post-OH-BBN, daily dosing with 75 mg/Kg BW lapatinib or 6 mg/Kg BW erlotinib yielded similar efficacy (62–64%reductions in the percentage of rats with large tumors, P < 0.05) compared to daily dosing with 75 mg/Kg BW lapatinib administered 2 weeks post-OH-BBN (73%reduction in the percentage of rats with large tumors, P < 0.05) (Table 1).
Fig. 2
The effects of lapatinib±naproxen on urinary bladder weights in OH-BBN–treated rats. (A) Experimental setup, showing the timing of drug treatment. (B) Final urinary bladder weights of rats administered 25 or 75 mg/kg BW/day lapatinib 2 weeks after the final OH-BBN administration. (C) Final urinary bladder weights of rats administered 75 mg/kg BW lapatinib daily, 525 mg/kg BW lapatinib weekly, or 263 mg/kg BW lapatinib weekly. Lapatinib was administered 10 weeks after the final OH-BBN administration. (D) Final urinary bladder weights of rats administered 6 mg/kg BW erlotinib daily, 42 mg/kg BW erlotinib weekly, or 21 mg/kg BW erlotinib weekly. Erlotinib was administered 12 weeks after the final OH-BBN administration. (E)Final urinary bladder weights of rats administered 75 mg/kg BW lapatinib daily, 30 mg/kg BW naproxen daily, or a combination of the two. The agents were administered 10 weeks after the final OH-BBN administration. The numbers of rats used in each experiment are listed in Tables 1 and 2. *P < 0.05, **P < 0.01, ***P < 0.001 relative to the control as determined by the Mann Whitney Wilcoxon rank test
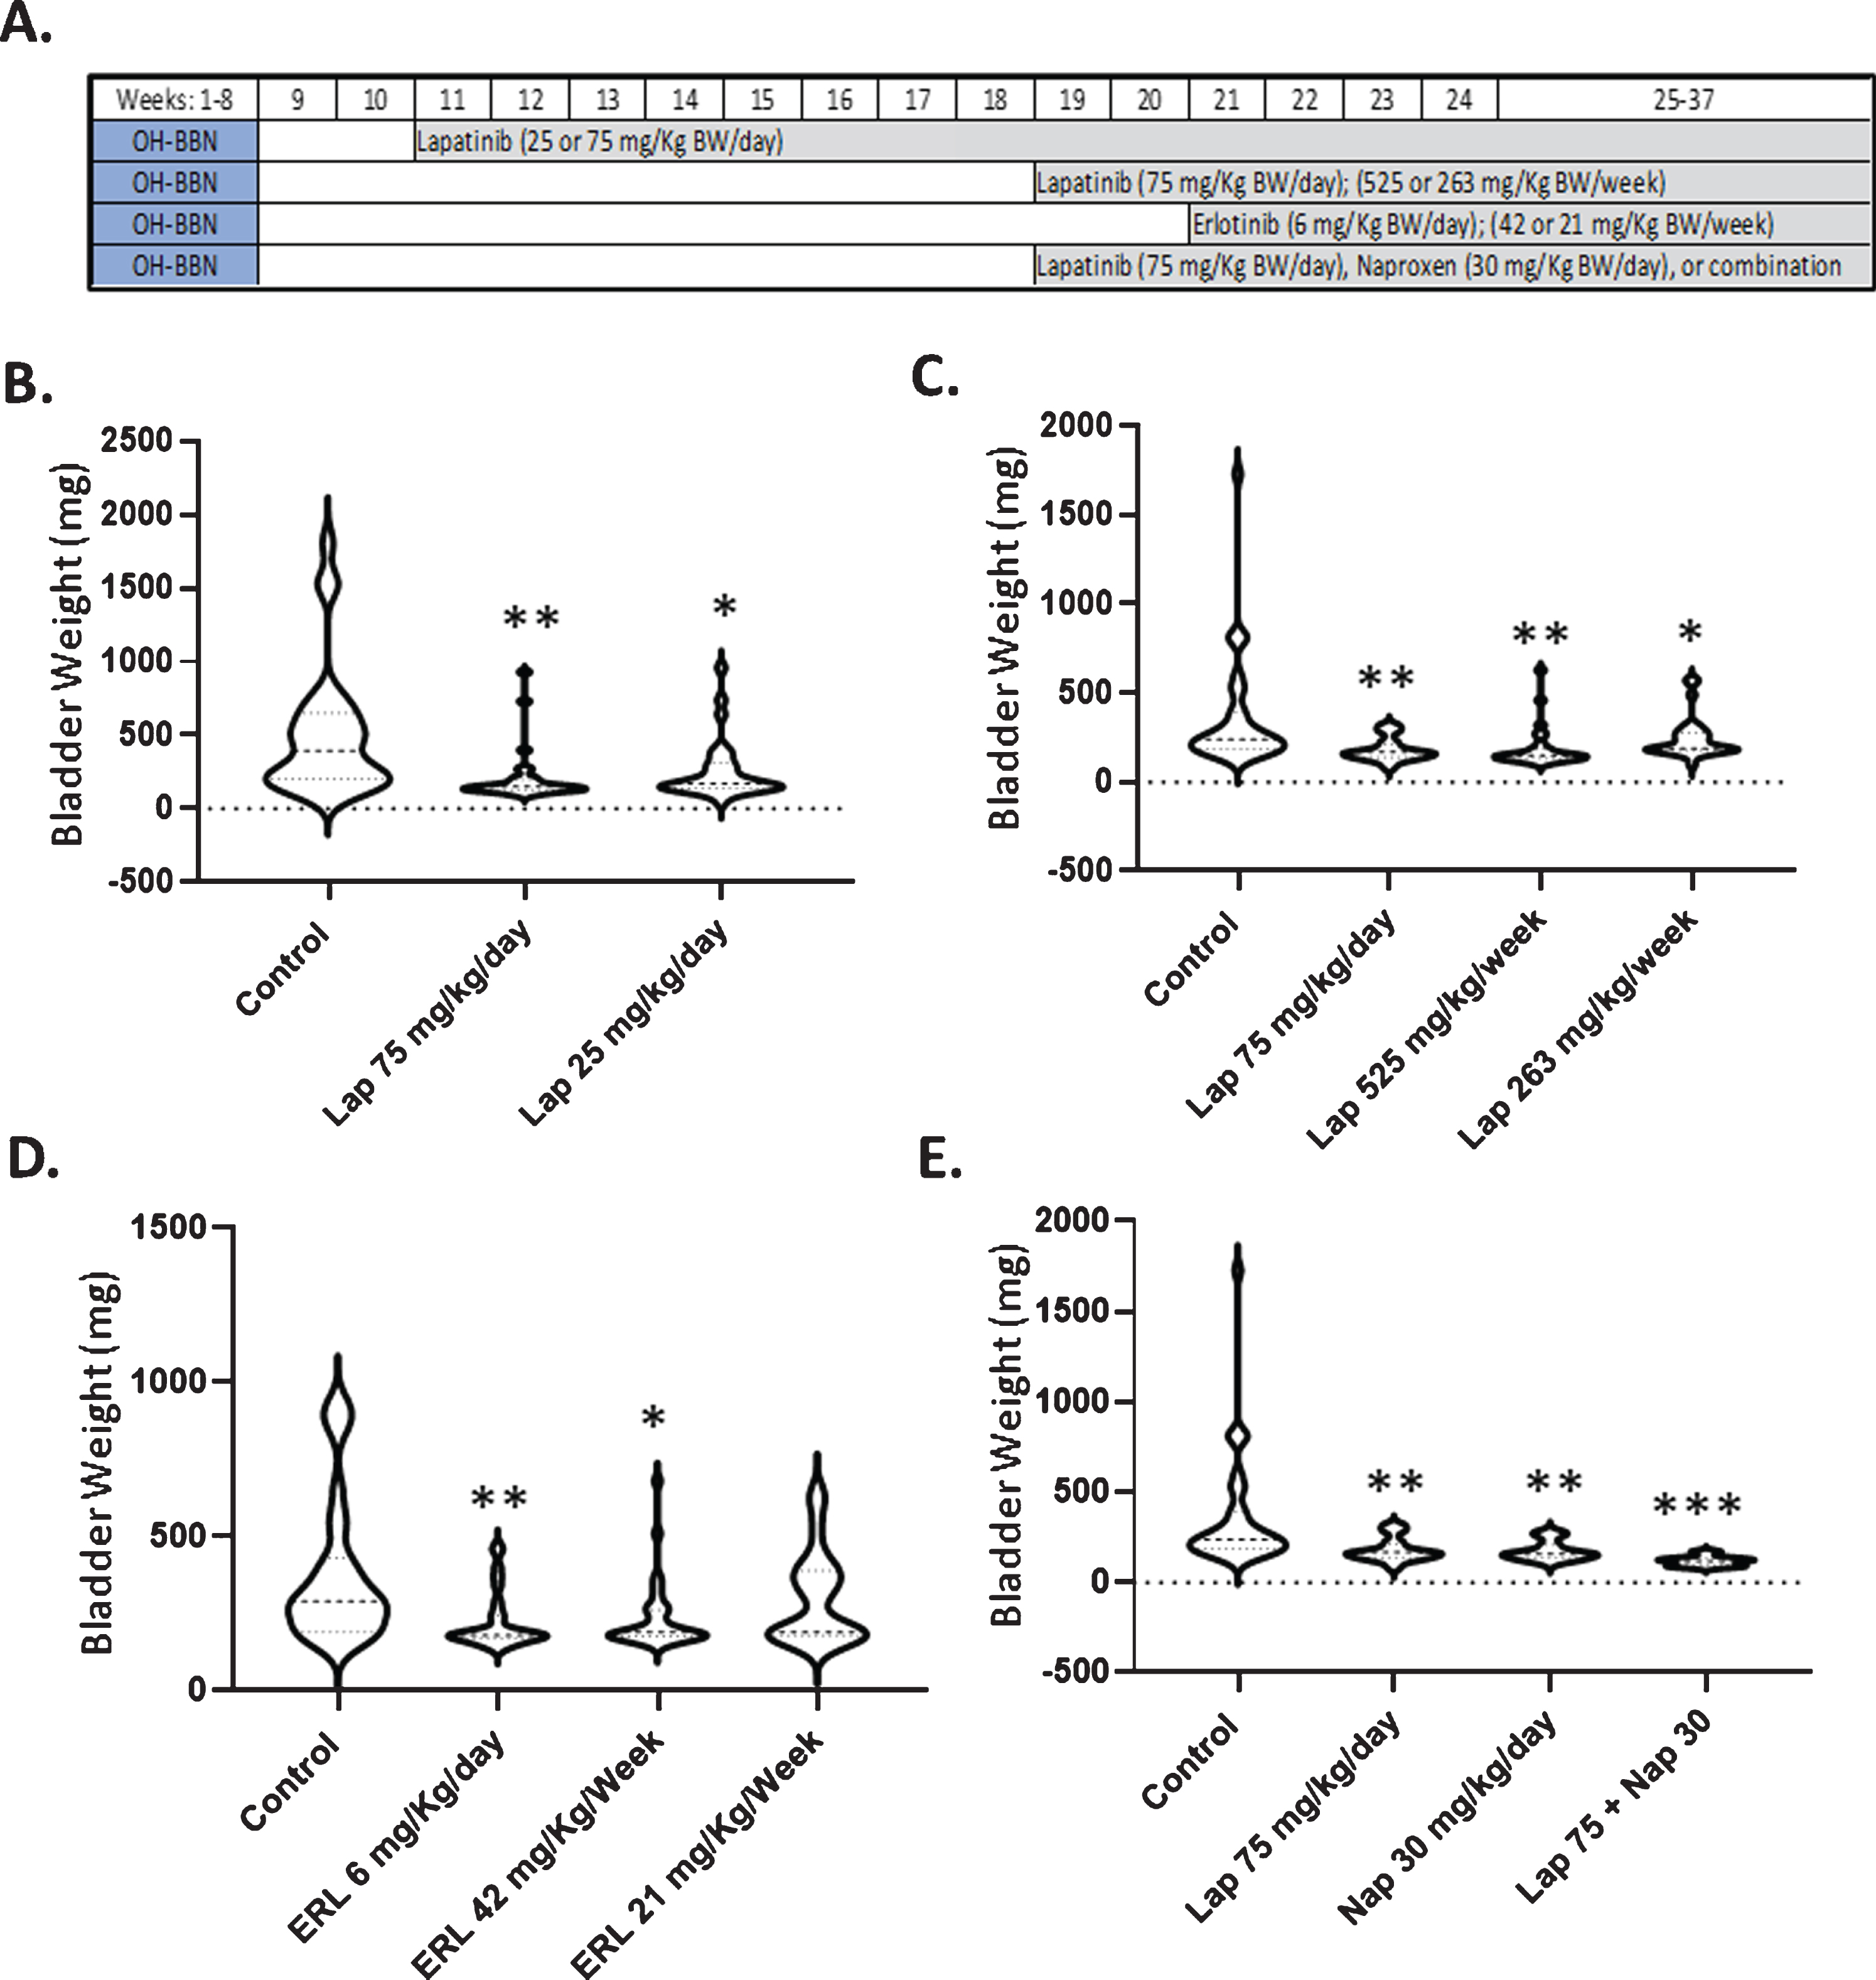
Table 1
Effect of lapatinib and erlotinib on bladder tumors when administered daily or weekly 2–12 weeks post-OH-BBN
| Drug | Dose | # of Weeks Post-OH-BBN | # of Rats | Average Weight of Tumors (mg) | %Rats with Tumors > 200 mg |
| Control | – | 2 | 30 | 441 | 73% |
| Lapatinib | 75 mg/Kg BW/day | 2 | 30 | 210 (53%↓)** | 20%(73%↓)* |
| Lapatinib | 25 mg/Kg BW/day | 2 | 29 | 275 (38%↓)* | 45%(39%↓) |
| Control | – | 10 | 34 | 356 | 69% |
| Lapatinib | 75 mg/Kg BW/day | 10 | 29 | 197 (45%↓)** | 26%(62%↓)* |
| Lapatinib | 525 mg/Kg BW/week | 10 | 28 | 209 (42%↓)** | 38%(45%↓) |
| Lapatinib | 263 mg/Kg BW/week | 10 | 29 | 251 (29%↓)* | 42%(39%↓) |
| Control | – | 12 | 31 | 394 | 74% |
| Erlotinib | 6 mg/Kg BW/day | 12 | 30 | 243 (38%↓)** | 27%(64%↓)* |
| Erlotinib | 42 mg/Kg BW/week | 12 | 30 | 261 (34%↓)* | 36%(51%↓)* |
| Erlotinib | 21 mg/Kg BW/week | 12 | 27 | 314 (20%↓) | 47%(36%↓) |
Average tumor weights for rats are the mean weights without standard deviations. We present them without standard deviations since they are not normal and we therefore analyzed them using a non-parametric statistical method. The number in parenthesis represents the %decrease relative to the control. *P < 0.05, **P < 0.01, ***P < 0.001 relative to the control as determined by the Mann Whitney Wilcoxon rank test (weight of tumors) or Log Rank test (large tumor incidence).
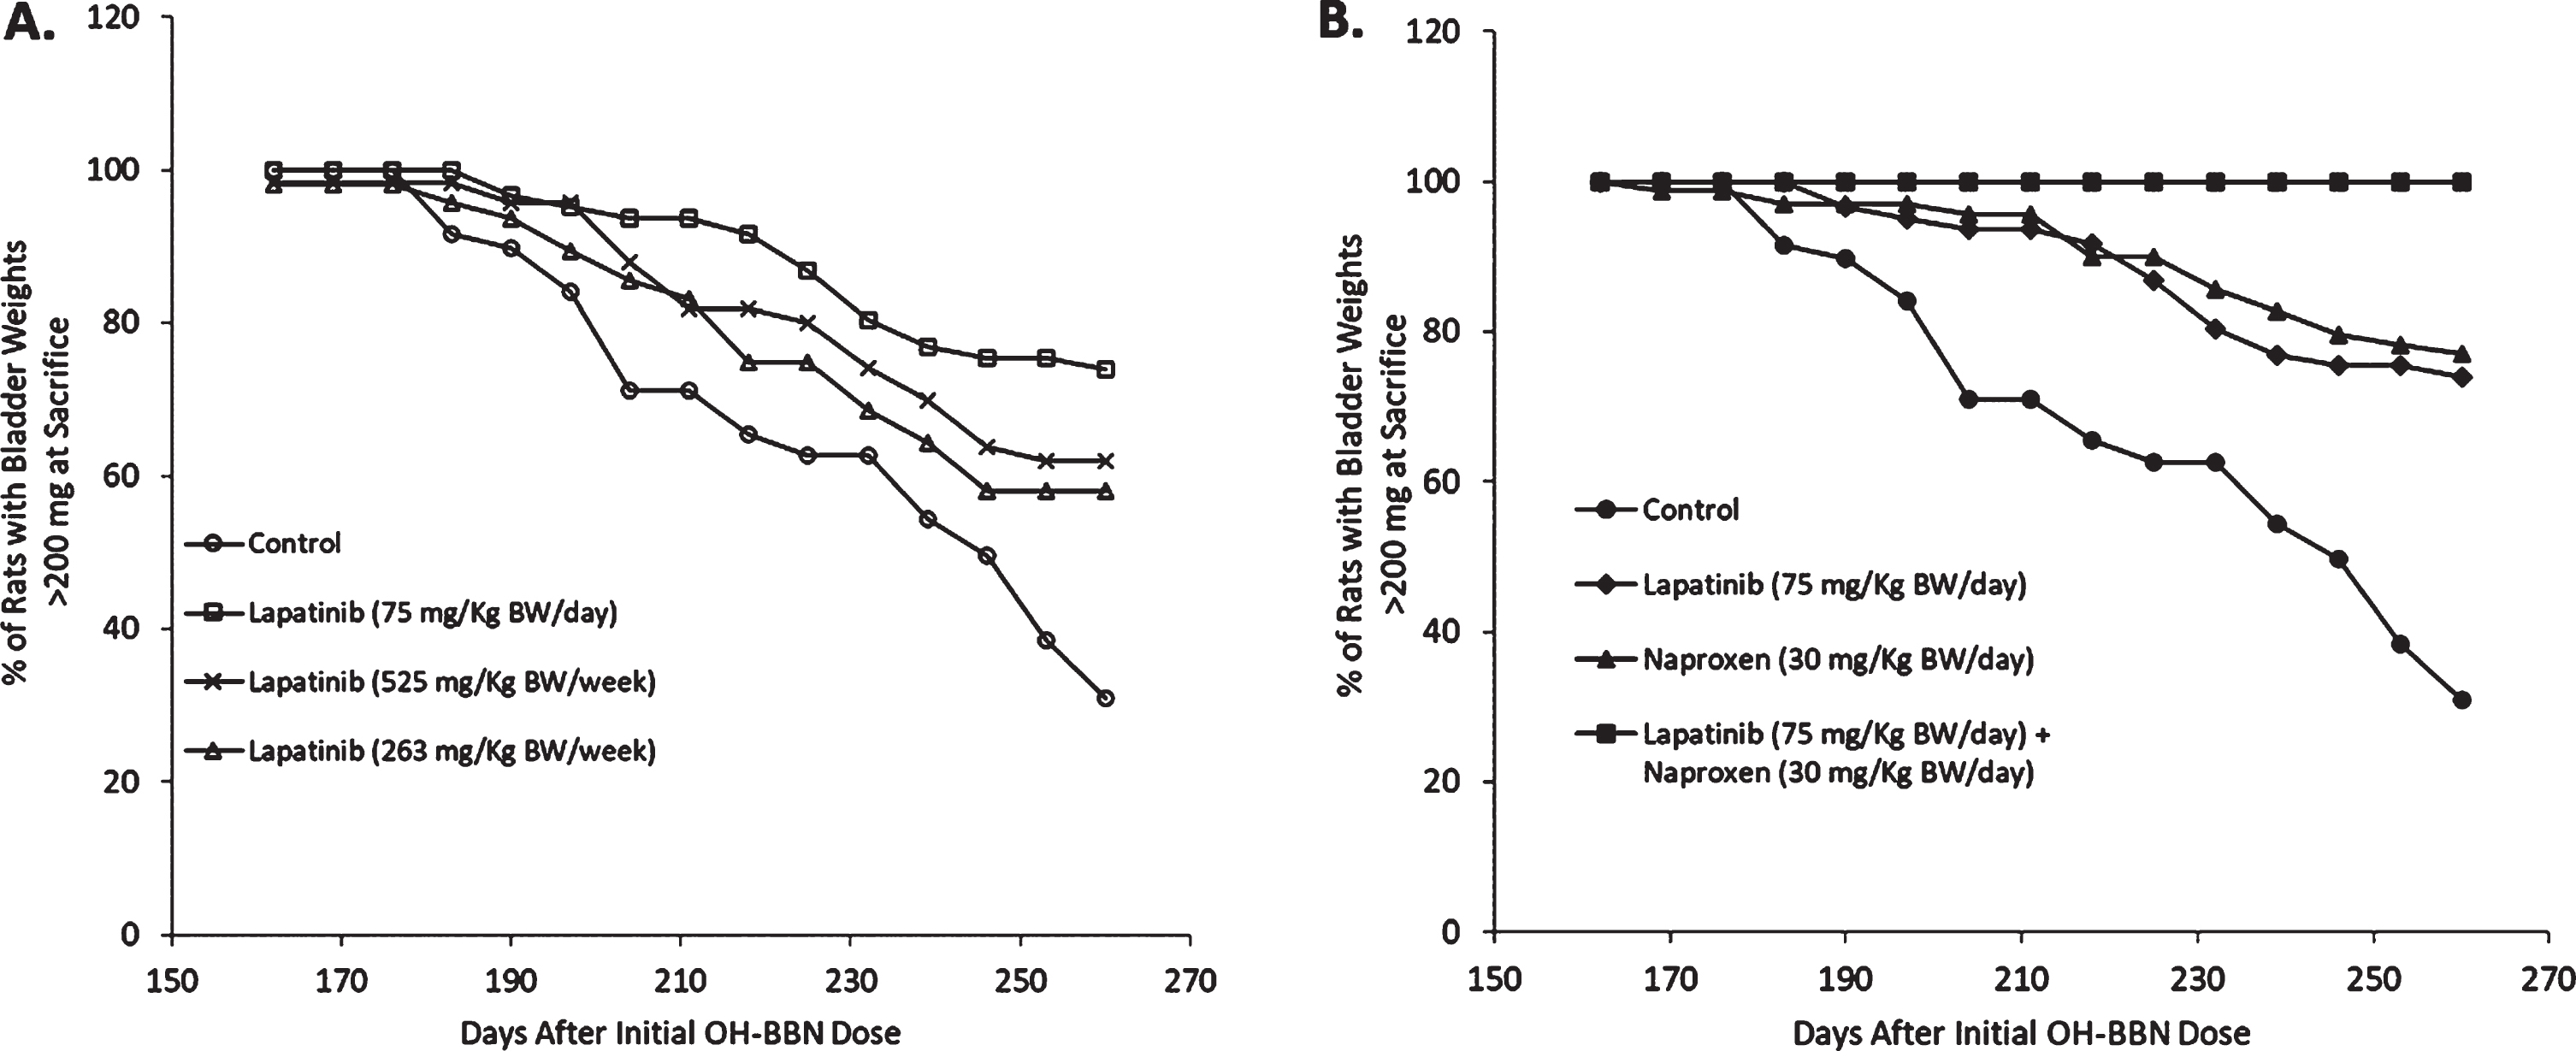
The daily administration of EGFR inhibitors is associated with several side effects (e.g. acneiform skin rash and diarrhea). Because clinical and preclinical studies have suggested that the weekly administration of EGFR inhibitors can reduce side effects while maintaining efficacy, we next investigated the effects of daily versus weekly dosing of erlotinib and lapatinib in the OH-BBN model. Similar to the late administration of 75 mg/Kg BW/day lapatinib, which yielded a 62%reduction in the percentage of rats with large cancers and a 45%reduction in average tumor weight, the late administration of weekly lapatinib (525 mg/Kg BW/week) reduced the percentage of rats with large tumors by 45%and the average tumor weight by 42%. In contrast, the low weekly dose of lapatinib (263 mg/Kg BW/week) caused more limited reductions (a 39%decrease in the incidence of large tumors and a 29%decrease in tumor weight (Table 1, Figs. 2C and 3A). Likewise, the weekly administration of 42 mg/Kg BW erlotinib resulted in similar reductions in the percentage of rats with large tumors and average tumor weight (51%and 34%reductions, respectively) compared to the daily administration of 6 mg/Kg BW erlotinib (64%and 38%reductions, respectively). Finally, the low weekly dose of erlotinib (21 mg/Kg BW) minimally reduced these endpoints (36%and 20%reductions, respectively) (Table 1, Fig. 2D).
Fig. 3
Efficacy of lapatinib±naproxen in inhibiting the development of large bladder tumors when administered 10 weeks post-OH-BBN. Animals received OH-BBN (150 mg/KgBW weekly for 8 weeks beginning at 56 DOA). Treatment with agents was initiated 10 weeks later at 126 DOA. (A) The percentage of OH-BBN-treated rats that remained free of large tumors following daily treatment with 75 mg/kg BW lapatinib, or weekly treatment with 525 mg/kg BW (7x daily dose) or 263 mg/kg BW (3.5x daily dose) lapatinib. N = 28–34 rats/group. Bladder cancer latency was analyzed with a Kaplan-Meier estimate and compared with a log-rank test. P = 0.002 (75 mg/kg BW), 0.01 (525 mg/kg BW), and 0.02 (263 mg/kg BW) compared to the control. (B) The percentage of OH-BBN-treated rats that remained free of large tumors following daily treatment with 75 mg/kg BW lapatinib, 30 mg/kg BW naproxen, or a combination of the two drugs. N = 29–34 rats/group. Bladder cancer latency was analyzed with a Kaplan-Meier estimate and compared with a log-rank test. P = 0.002 (lapatinib), 0.001 (naproxen), and < 0.0001 (lapatinib + naproxen).
Combination of lapatinib with a suboptimal dose of naproxen
NSAIDs are highly effective agents in the OH-BBN bladder cancer model [7, 14], and the combination of agents is another common method to reduce toxicity. We therefore treated OH-BBN rats with either a suboptimal dose of the NSAID naproxen (30 mg/Kg BW/day), the effective daily dose of lapatinib (75 mg/Kg BW/day), or both agents in combination in a late intervention setting (Fig. 2A). As single agents, both lapatinib and naproxen reduced the incidence (lapatinib, 62%reduction; naproxen, 67%reduction) and weight (lapatinib, 45%reduction; naproxen, 48%reduction) of large cancers. However, the combination was strikingly effective. Not a single large palpable cancer was observed in any of the treated rats and a profound 62%decrease in bladder/tumor weight was observed (Table 2, Figs. 2E and 3B).
Table 2
Effect of the combination of lapatinib and naproxen on bladder tumors when administered daily 10 weeks post-OH-BBN
| Treatment | # of Rats | Avg Weight of Tumors (mg) | %Rats with Tumors > 200 mg |
| Control | 34 | 356 | 69% |
| Lapatinib (75 mg/Kg BW/day) | 29 | 197 (45%↓)** | 26%(62%↓)* |
| Naproxen (30 mg/Kg BW/day) | 29 | 185 (48%↓)** | 23%(67%↓)* |
| Lapatinib (75 mg/Kg BW/day) + Naproxen (30 mg/Kg BW/day) | 29 | 137 (62%↓)*** | 0%(100%↓)** |
Average tumor weights for rats are the mean weights without standard deviations. We present them without standard deviations since they are not normal and we therefore analyzed them using a non-parametric statistical method. The number in parenthesis represents the %decrease relative to the control. *P < 0.05, **P < 0.01, ***P < 0.001 relative to the control as determined by the Mann Whitney Wilcoxon rank test (weight of tumors) or Log Rank test (large tumor incidence).
Effects on bladder tumor gene expression following short-term treatment
To determine the mechanisms by which effective agents in the OH-BBN bladder cancer model (i.e. gefitinib, lapatinib, erlotinib, and NO-naproxen; see Supplementary Table 1) mediate their efficacy, we performed RNA analysis on OH-BBN-induced bladder tumors that were untreated (control) or treated with the various agents (10 mg/Kg BW/day gefitinib, 75 mg/Kg BW/day lapatinib, 6 mg/Kg BW/day erlotnib, or 560 mg/Kg diet NO-naproxen) for 5 days to parallel a clinical neoadjuvant setting. OH-BBN-induced bladder tumors treated with zileuton (1200 mg/Kg of diet for 5 days), a LOX inhibitor that failed to prevent bladder tumor formation in this model (unpublished data), were also analyzed for comparison. The individual genes that achieved a fold-change > 1.5 and a P < 0.01 following a Bonferroni correction (Supplementary Tables 3–8) were then used to find significantly enriched molecular pathways for different cell processes.
The individual gene analyses revealed that erlotinib altered 46 known genes (Supplementary Table 3), gefitinib altered 218 known genes (Supplementary Table 4), and lapatinib altered 28 known genes (Supplementary Table 5). Interestingly, only 2 genes (Top2A and Fga) were highly significantly altered in expression by all three EGFR inhibitors (Fig. 4A). Despite the limited overlap at the individual gene level, at the pathway level, all three EGFR inhibitors strikingly altered pathways associated with the cell cycle and mitosis (Table 3). The striking pathway results would help explain their efficacy and let them serve as potential biomarkers. All three EGFR inhibitors also altered pathways that involved “extracellular space” (data not shown), although the potential role of these pathways, if any, in the efficacy of these agents is less obvious. In addition, there were certain other pathways that were found to be altered by only one agent when using less stringent conditions (not corrected for multiple testing) and were found to have lower p-values when employing a Benjamini-Hochberg correction (Table 4).
Fig. 4
Overlap of enriched genes among treatment groups. (A) Overlap among the genes enriched by treatment with the three EGFR inhibitors gefitinib, erlotinib, and lapatinib. (B) Overlap between the genes enriched by EGFR inhibitor treatment and those enriched by treatment with the NSAID NO-naproxen. (C) Overlap between the genes enriched by EGFR inhibitor treatment and those enriched by treatment with the LOX inhibitor zileuton. Criteria for the specific genes included are presented in Materials and Methods.
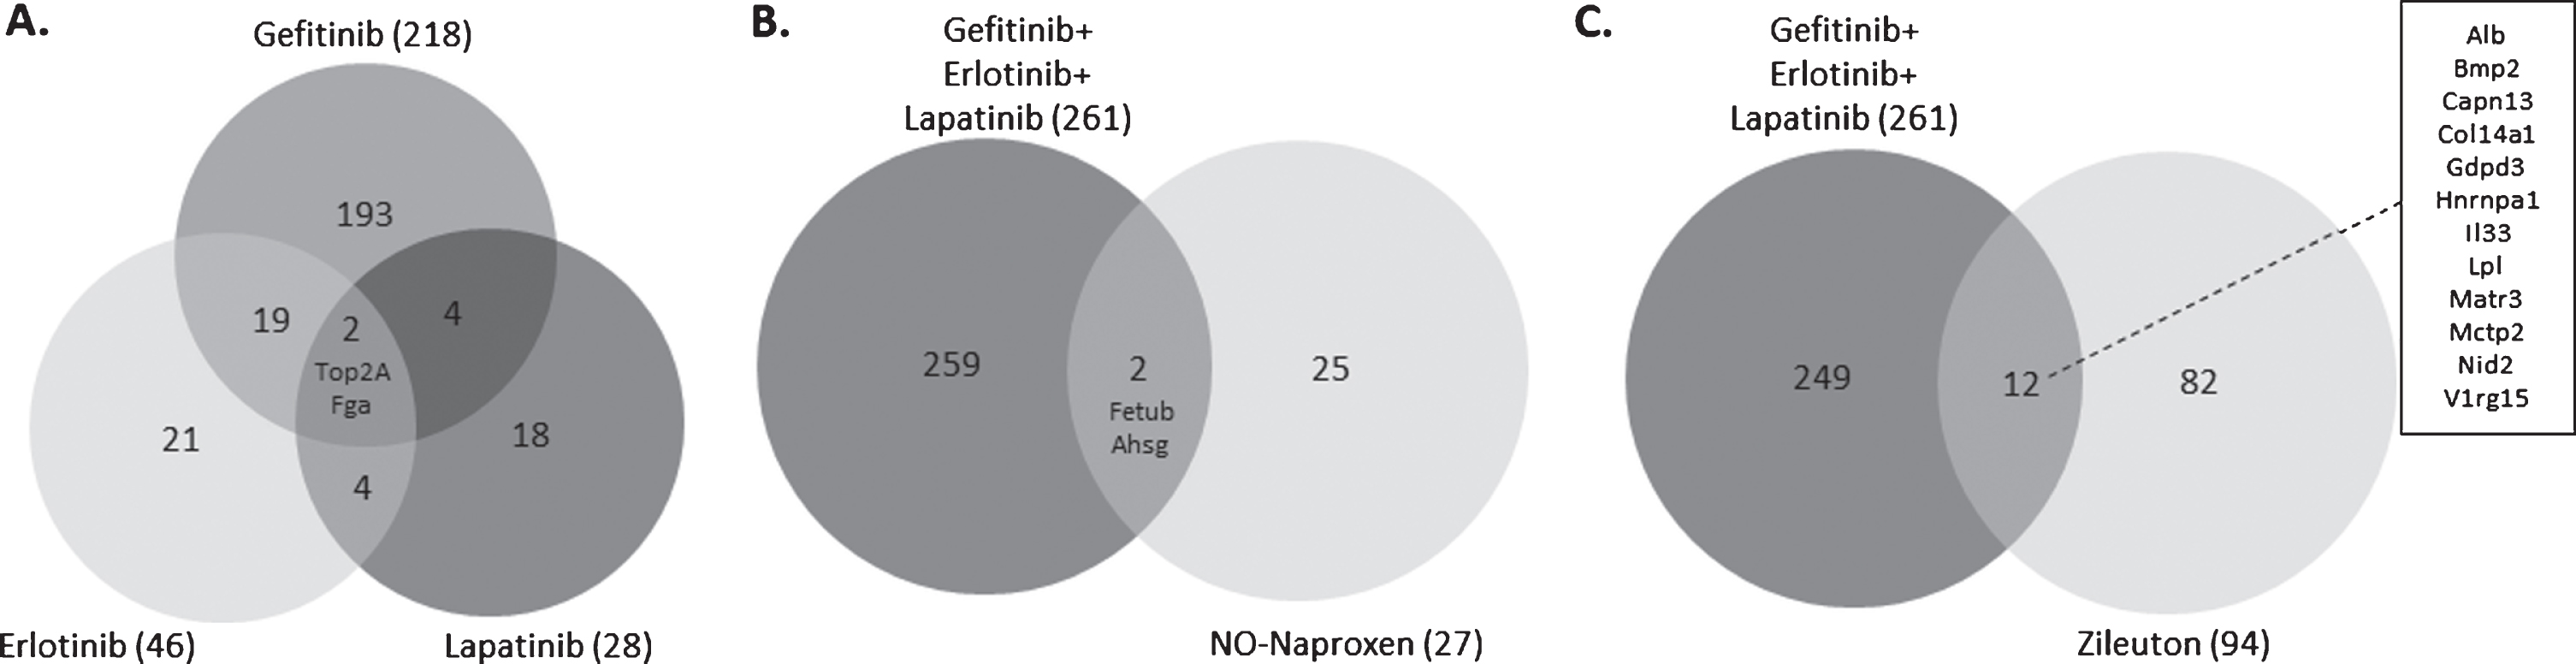
Table 3
Pathways enriched by all three EGFR inhibitors related to their mechanism of action
| Term ID | Term Name | Erlotinib1 | Gefitinib2 | Lapatinib3 | |||
| P Value | P Value (corrected) | P Value | P Value (corrected) | P Value | P Value (corrected) | ||
| GO:0051301 | Cell Division | 1.26e-15 | 1.12e-11 | 2.27e-11 | 2.01e-7 | 1.99e-12 | 1.77e-8 |
| GO:0000775 | Chromosome, Centromeric Region | 6.88e-10 | 6.11e-6 | 2.03e-9 | 1.81e-5 | 1.42e-8 | 1.26e-4 |
The GO Terms analysis was performed using genes which achieved a limited statistical significance (LFDR < 0.05) with an absolute fold-change of 1.5 and higher. The Benjamini-Hochberg procedure was used to obtain the corrected p values for the individual GO Terms. The uncorrected P values for the individual genes are P < 0.01 and absolute fold change > 1.5. 1Of the individual genes enriched by erlotinib, Bub1b, Ect2, and Top2 were associated with GO:0051301; Bub1b, Cenpf, and Mki67 were associated with GO:0000775. 2Of the individual genes enriched by gefitinib, Aspm, Aurkb, Bub1, Bub1b, Cat, Ccna2, Ccnb1, Cdc20, Cdca2, Cdca3, Chek2, Cit, Ect2, Fam83d, Igf2, Itgb3bp, Kif20a, Kif2c, Mastl, Nuf2, Plk1, Prc1, Prok1, Pttg1, Racgap1, Spc25, Tacc3, Top2a, and Tpx2 were associated with GO:0051301; Aurkb, Bub2, Bub1b, Cbx3, Ccnb1, Cenpf, Itgb3bp, Kif2c, Mki67, Nuf2, Plk1, and Spc25 were associated with GO:0000775. 3Of the individual genes enriched by lapatinib, Ccnb1 and Top2a were associated with GO:0051301; Ccnb1 was associated with GO:0000775.
Table 4
Pathways unique to each agent
| Agent | Term ID | Term Name | P Value | P Value (corrected) |
| Erlotinib1 | GO:0003676 | Nucleic Acid Binding | 4.77e-8 | 4.24e-4 |
| GO:0006139 | Nucleic Acid Metabolic Process | 4.55e-5 | 4.04e-1 | |
| GO:0031224 | Intrinsic to Membrane | 4.27e-6 | 3.79e-2 | |
| Gefitinib2 | GO:0046907 | Intracellular Transport | 7.08e-6 | 6.29e-2 |
| GO:0003824 | Catalytic Activity | 1.06e-4 | 9.39e-1 | |
| Lapatinib3 | GO:0007010 | Cytoskeleton Organization | 2.73e-6 | 2.43e-2 |
| GO:0030017 | Sarcomere | 1.06e-10 | 9.44e-7 | |
| NO-Naproxen4 | GO:0006979 | Response to Oxidative Stress | 3.02e-8 | 2.68e-4 |
| GO:0004930 | G-Protein Coupled Receptor Activity | 4.95e-6 | 4.40e-2 | |
| GO:0042110 | T Cell Activation | 2.51e-5 | 2.23e-1 | |
| GO:0004872 | Receptor Activity | 2.85e-5 | 2.53e-1 | |
| Zileuton5 | GO:0043292 | Contractile Fiber | 1.13e-7 | 1.01e-3 |
| GO:0030016 | Myofibril | 6.35e-7 | 5.64e-3 |
The Benjamini-Hochberg procedure was used to obtain the corrected p values. 1Of the individual genes enriched by erlotinib, Alb, Bhlhe41, Mki67, and Top2A were associated with GO:0003676; Bhlhe41, Cd200, Cenpf, Top2a, and Ttr were associated with GO:0006139; and Cd200, Ch25h, Cyp2e1, Cryyr1, Emb, Emcn, and Tmem126a were associated with GO:0031224. 2Of the individual genes enriched by gefitinib, Adipoq, Arl4a, Derl1, Dst, Ect2, Gprasp1, Hap1, Hnrnpa2b1, Lyst, Mreg, Pex3, Sec16b, and Tacc3 were associated with GO:0046907; Ptpre, Rad50, Retsat, Scd1, Slc3a2, Spag1, Taldo1, Tgm1, Thnsl2, and Top2a were associated with GO:0003824. 3Of the individual genes enriched by lapatinib, Ccnb1 and Prkcq were associated with GO:0007010; and Hspb1 was associated with GO:0030017. 4Of the individual genes enriched by NO-naproxen, Adipoq was associated with GO:0006979; Cd48 was associated with GO:0042110; and Cd48 and Unc13b were associated with GO:0004872. 5Of the individual genes enriched by zileuton, Csrp1, Des, Lmod1, Myh11, Myl9, Pdlim3, Pgm5, Synm, and Tnnt2 were associated with GO:0043292; and Csrp1, Des, Lmod1, Myl9, Pdlim3, Pgm5, Synm, and Tnnt2 were associated with GO:0030016.
For NO-naproxen, there were 27 known genes identified, none of which were related to cell proliferation, but 2 of which (Fetub and Ahsg) overlapped with the EGFR inhibitor-altered genes (Supplementary Tables 6 and 7, Fig. 4B). NO-naproxen strikingly altered pathways associated with G protein receptor signalling (G protein-coupled receptor protein sensing and signal transduction) and oxidative homeostasis (response to oxidative stress and glutathione metabolic processes). When not applying multiple testing correction, changes in pathways related to immune regulation (immune response and T-cell activation) were also detected in the NO-naproxen-treated group (Table 4). These weaker associations with the immune response may nevertheless be highly relevant for the mechanism through which NSAIDs, including NO-naproxen, function in this model.
Finally, zileuton treatment altered 94 known genes, only 12 of which (Alb, Bmp2, Capn13, Col14a1, Gdpd3, Hnrnpa1, Il33, Lpl, Matr3, Mctp2, Nid2, and V1rg15) overlapped with the EGFR-inhibitor-altered genes (Supplementary Tables 6 and 8, Fig. 4C). None of these genes were related to cell proliferation. Rather, zileuton altered GO terms associated with the cellular skeleton (Table 4).
DISCUSSION
We had previously performed both gene and proteomic analysis on OH-BBN-induced rat urinary bladder cancers and found that the tumors are most similar to the basal subtype of human bladder cancer [1, 19] since they express high levels of keratins 5, 6, and 14 and low levels of the luminal keratins 18 and 19 [5]. They also show increased expression of certain S100 proteins (S100A4, S100A8, and S100A9) that are overexpressed in advanced human bladder cancers, including those with a basal subtype, and had striking overlap with ER- breast cancers (basal type) at the pathway level [7] (Supplementary Table 2). In this manuscript, we confirmed this basal phenotype by showing that there is strong and homogeneous staining of keratin 5 in the tumors of OH-BBN-treated rats. This is contrasted with the staining of keratin 5 in a limited number of cells in the basal layer of normal rat epithelia.
Another overexpressed protein and potential therapeutic target in basal bladder tumors is EGFR1 [20]. This manuscript expands upon our previous studies showing the efficacy of the EGFR inhibitor gefitinib in the OH-BBN-induced rat urinary bladder cancer model [7]. We showed that like gefitinib, lapatinib and erlotinib were effective in preventing the development of bladder cancers when treatment was initiated as late as 10 weeks (lapatinib) or 12 weeks (erlotinib) post-OH-BBN. The strong efficacy of the late intervention is consistent with an effect of these agents on pre-existing lesions.
We also examined two protocols intended to reduce the potential toxicity while maintaining or improving the efficacy of the EGFR inhibitors. The first involved reducing the dosing frequency of the inhibitors from daily (7x/week) to weekly (1x/week) at a higher dose (7x or 3.5x the daily dose). The second involved combining an EGFR inhibitor with a suboptimal dose of naproxen. We found that the weekly administration of lapatinib and erlotinib at 7x the daily dose was similarly effective as daily administration, and that the combination of lapatinib and naproxen was profoundly effective, yielding no large tumors despite the fact that many rats already presented with microcarcinoma at the time of treatment initiation. This is consistent with our previous results obtained with a combination of erlotinib and naproxen [21] and the data from others showing that COX inhibitors plus EGFR inhibitors are effective in the mouse model of basal bladder cancer [23, 31, 32]. Given that weekly dosing is likely to reduce toxicity based on clinical studies, our results suggest that these inhibitors could be used particularly in conjunction with an NSAID in the therapy/prevention of basal bladder cancer [20].
The last series of studies are the short-term (5 days) effects of gefitinib (previously reported), erlotinib, lapatinib, the NSAID NO-naproxen (an agent that is also highly effective in the OH-BBN model [14] but that has a distinct mechanism of action from the EGFR inhibitors), and zileuton (a lipoxygenase (LOX) inhibitor that has minimal chemopreventive efficacy) on RNA expression and associated cellular processes. These studies were intended to parallel those performed in breast cancer, where early cancer samples were obtained following limited treatment in a neoadjuvant setting [15]. The rationale for the short treatment period is that distinct lesions are present at the time of sample collection, allowing one to determine whether cancers with specific mutations or expression signatures are differentially sensitive to the treatment. In agreement with our previous studies with gefitinib [18], we found that all three EGFR inhibitors alter pathways involved in cell division and chromosome condensation. The profound alterations in these various genomic pathways agree with the highly significant antiproliferative effects (decreased Ki67 and decreased expression of cyclin D1) produced by this class of agents following limited exposure in palpable bladder lesions in this model [6]. Thus, these pathways could serve as biomarker endpoints in human phase II bladder cancer studies specifically directed against bladder cancers likely to be sensitive to EGFR inhibitors based on gene expression [22].
In contrast to the EGFR inhibitors, NO-naproxen which is also strikingly effective in this model [14], did not affect cell proliferation pathways when corrected for multiple comparisons. Rather, it strongly altered pathways associated with G protein receptor signalling (G protein coupled receptor protein sensing and signal transduction) and oxidative homeostasis (response to oxidative stress and glutathione metabolic processes) after Benjamini-Hochberg correction. These gene pathways become a potential biomarker of pharmacologic effects, although not necessarily related to the primary efficacy of NSAIDs in this model. Interestingly, we have also observed alterations in RNA expression of GTPases and G proteins and proteins involved in oxidative stress in livers of rats treated short-term with naproxen and NO-naproxen [17], showing that certain of these pharmacologic alterations and potential pharmacodyamic biomarkers may be similar in a wide variety of tissues. Furthermore, NO-naproxen induced changes in pathways related to immune regulation (immune response and T-cell activation), and this is likely to contribute to its efficacy in the model since basal bladder tumors have the highest levels of infiltrating lymphocytes among the subtypes of bladder cancer. Zileuton did not alter either proliferation or immune-related pathways. It did, however, significantly alter pathways associated with the cellular skeleton.
At the gene level, only a limited number of individual genes were found to be significantly altered by the various treatments when employing a Benjamini-Hochberg correction for multiple comparisons, presumably due to the heterogeneity of the tumors and the fact that we only had 5-6 treated samples per group. This clearly illustrates the fact that high levels of statistical significance can be achieved when examining gene pathways by GO Terms even when there are limited numbers of individual genes that achieve statistical significance when employing standard P values for individual genes.
In summary, the combination of an EGFR inhibitor and an NSAID is an excellent candidate for treatment of basal bladder cancer. We have confirmed these results in the OHBBN-induced bladder cancer model employing the combination of erlotinib and naproxen [21]. Furthermore, the combination erlotinib plus sulindac has proven highly effective clinically in an FAP trial [23] which should offer clear ideas regarding likely toxicities of such a combination. Finally, the RNA data generated in this study is likely to offer potential biomarkers for small scale clinical trials in a neoadjuvant setting.
ACKNOWLEDGMENTS
The authors have no acknowledgements
FUNDING
This work was supported by NCI Contract #HHSN261201500036I, Task Order #HHSN26100002 and NCI Contract #HHSN261200433001C, Task Order #NO1-CN-43301 to Clinton J. Grubbs.
AUTHOR CONTRIBUTIONS
RAL and CJG conceived the work; AK and CJG performed the work; RAL, AK, JTF, MY, MMJ, and CJG analysed the data; RAL, AK, JTF, and AM wrote the article.
CONFLICT OF INTEREST STATEMENT
Ronald A. Lubet has no conflict of interest to report. Amit Kumar has no conflict of interest to report. Jennifer T. Fox has no conflict of interest to report. Ming You has no conflict of interest to report. Altaf Mohammed has no conflict of interest to report. M. Margaret Juliana has no conflict of interest to report. Clinton J. Grubbs has no conflict of interest to report.
SUPPLEMENTARY MATERIAL
[1] The supplementary material is available in the electronic version of this article: http://dx.doi.org/10.3233/BLC-200423.
REFERENCES
[1] | Choi W , Czerniak B , Ochoa A , Su X , Siefker-Radtke A , Dinney C , et al. Intrinsic basal and luminal subtypes of muscle-invasive bladder cancer. Nat Rev Urol (2014) ;11: (7):400–10. |
[2] | Kamoun A , de Reynies A , Allory Y , Sjodahl G , Robertson AG , Seiler R , et al. A Consensus Molecular Classification of Muscle-invasive Bladder Cancer. Eur Urol (2020) ;77: (4):420–33. |
[3] | Perou CM , Sorlie T , Eisen MB , van de Rijn M , Jeffrey SS , Rees CA , et al. Molecular portraits of human breast tumours. Nature (2000) ;406: (6797):747–52. |
[4] | Hida T , Ogawa S , Park JC , Park JY , Shimizu J , Horio Y , et al. Gefitinib for the treatment of non-small-cell lung cancer. Expert Rev Anticancer Ther (2009) ;9: (1):17–35. |
[5] | Lu Y , Liu P , Wen W , Grubbs CJ , Townsend RR , Malone JP , et al. Cross-species comparison of orthologous gene expression in human bladder cancer and carcinogen-induced rodent models. Am J Transl Res (2010) ;3: (1):8–27. |
[6] | Lubet RA , Lu Y , Bode AM , You M , Verney ZM , Steele VE , et al. Efficacy of the EGFr inhibitor Iressa on development of chemically-induced urinary bladder cancers: dose dependency and modulation of biomarkers. Oncol Rep (2011) ;25: (5):1389–97. |
[7] | Lubet RA , Steele VE , Juliana MM , Grubbs CJ Screening agents for preventive efficacy in a bladder cancer model: study design, end points, and gefitinib and naproxen efficacy. J Urol (2010) ;183: (4):1598–603. |
[8] | Grommes C , Oxnard GR , Kris MG , Miller VA , Pao W , Holodny AI , et al. “Pulsatile” high-dose weekly erlotinib for CNS metastases from EGFR mutant non-small cell lung cancer. Neuro Oncol (2011) ;13: (12):1364–9. |
[9] | Milton DT , Azzoli CG , Heelan RT , Venkatraman E , Gomez JE , Kris MG , et al. A phase I/II study of weekly high-dose erlotinib in previously treated patients with nonsmall cell lung cancer. Cancer (2006) ;107: (5):1034–41. |
[10] | Lubet RA , Steele VE , Juliana MM , Bode A , Moeinpour F , Grubbs CJ Daily or weekly dosing with EGFR inhibitors, gefitinib and lapatinib, and AKt inhibitor MK2206 in mammary cancer models. Oncol Rep (2018) ;40: (3):1545–53. |
[11] | Lubet RA , Szabo E , Iwata KK , Gill SC , Tucker C , Bode A , et al. Effect of intermittent dosing regimens of erlotinib on methylnitrosourea-induced mammary carcinogenesis. Cancer Prev Res (Phila) (2013) ;6: (5):448–54. |
[12] | Zhang Q , Li R , Chen X , Lee SB , Pan J , Xiong D , et al. Effect of weekly or daily dosing regimen of Gefitinib in mouse models of lung cancer. Oncotarget (2017) ;8: (42):72447–56. |
[13] | Reddy BS , Nayini J , Tokumo K , Rigotty J , Zang E , Kelloff G Chemoprevention of colon carcinogenesis by concurrent administration of piroxicam, a nonsteroidal antiinflammatory drug with D,L-alpha-difluoromethylornithine, an ornithine decarboxylase inhibitor, in diet. Cancer Res (1990) ;50: (9):2562–8. |
[14] | Nicastro HL , Grubbs CJ , Margaret Juliana M , Bode AM , Kim MS , Lu Y , et al. Preventive effects of NSAIDs, NO-NSAIDs, and NSAIDs plus difluoromethylornithine in a chemically induced urinary bladder cancer model. Cancer Prev Res (Phila) (2014) ;7: (2):246–54. |
[15] | Dowsett M , Smith IE , Ebbs SR , Dixon JM , Skene A , Griffith C , et al. Short-term changes in Ki-67 during neoadjuvant treatment of primary breast cancer with anastrozole or tamoxifen alone or combined correlate with recurrence-free survival. Clin Cancer Res (2005) ;11: (2 Pt 2):951s–8s. |
[16] | Yao R , Wang Y , Lu Y , Lemon WJ , End DW , Grubbs CJ , et al. Efficacy of the farnesyltransferase inhibitor R115777 in a rat mammary tumor model: role of Ha-ras mutations and use of microarray analysis in identifying potential targets. Carcinogenesis (2006) ;27: (7):1420–31. |
[17] | Lu Y , You M , Ghazoui Z , Liu P , Vedell PT , Wen W , et al. Concordant effects of aromatase inhibitors on gene expression in ER + Rat and human mammary cancers and modulation of the proteins coded by these genes. Cancer Prev Res (Phila) (2013) ;6: (11):1151–61. |
[18] | Lu Y , Liu P , Van den Bergh F , Zellmer V , James M , Wen W , et al. Modulation of gene expression and cell-cycle signaling pathways by the EGFR inhibitor gefitinib (Iressa) in rat urinary bladder cancer. Cancer Prev Res (Phila) (2012) ;5: (2):248–59. |
[19] | Hedegaard J , Lamy P , Nordentoft I , Algaba F , Hoyer S , Ulhoi BP , et al. Comprehensive Transcriptional Analysis of Early-Stage Urothelial Carcinoma. Cancer Cell (2016) ;30: (1):27–42. |
[20] | Rebouissou S , Bernard-Pierrot I , de Reynies A , Lepage ML , Krucker C , Chapeaublanc E , et al. EGFR as a potential therapeutic target for a subset of muscle-invasive bladder cancers presenting a basal-like phenotype. Sci Transl Med (2014) ;6: (244):244ra91. |
[21] | Mohammed A , Miller MS , Lubet RA , Suen CS , Sei S , Shoemaker RH , et al. Combination of Erlotinib and Naproxen Employing Pulsatile or Intermittent Dosing Profoundly Inhibits Urinary Bladder Cancers. Cancer Prev Res (Phila) (2020) ;13: (3):273–82. |
[22] | Goodspeed A , Jean A , Theodorescu D , Costello JC A Gene Expression Signature Predicts Bladder Cancer Cell Line Sensitivity to EGFR Inhibition. Bladder Cancer (2018) ;4: (3):269–82. |
[23] | Samadder NJ , Neklason DW , Boucher KM , Byrne KR , Kanth P , Samowitz W , et al. Effect of Sulindac and Erlotinib vs Placebo on Duodenal Neoplasia in Familial Adenomatous Polyposis: A Randomized Clinical Trial. JAMA (2016) ;315: (12):1266–75. |


