
Survival by T Stage for Patients with Localized Bladder Cancer: Implications for Future Screening Trials
Abstract
BACKGROUND:
There is insufficient data to recommend screening for bladder cancer (BC). For future BC screening trials, it is important to understand how and if tumor (T) stage can act as a surrogate outcome marker for overall (OS) and cancer-specific (CSS) survival.
OBJECTIVE:
To characterize OS and CSS between primary tumor (T) stages in non-metastatic bladder cancer (BC) patients.
METHODS:
Non-metastatic BC patients were identified in the National Cancer Database (NCDB; 2004-2015) (n = 343,163) and National Cancer Institute Surveillance, Epidemiology, and End Results database (SEER) (n = 130,751). Cox multivariable regression compared relationships between T stage (LGTa, HGTa, Tis, LGT1, HGT1, T2-T4) and OS or CSS for all patients and sub-cohorts.
RESULTS:
Compared to stage LGTa as a reference, overall (SEER; NCDB) and cancer-specific (SEER) survival significantly declined with increasing T stage. Using SEER, OS ranged from HGTa (HR 1.16, CI 1.13–1.21, p < 0.001) to T4 (HR 5.70, CI 5.41–6.00, p < 0.001) with a steep inflection between HGT1 (HR 1.68, CI 1.63–1.73, p < 0.001) and T2 (HR 3.39, CI 3.30–3.49, p < 0.001), which was verified with NCDB. The association of stage and CSS was even more pronounced: HGTa (84% 10 year-CSS, HR 1.94, CI 1.81–2.08, p < 0.001), Tis (82% 10 year-CSS, HR 2.28, CI 2.09–2.47, p < 0.001), LGT1 (84% 10 year-CSS, HR 2.30, CI 2.11–2.51, p < 0.001), HGT1 (72% 10 year-CSS, HR 4.24, CI 4.01–4.47, p < 0.001), T2 (48% 10 year-CSS, HR 12.18, CI 11.57–12.82, p < 0.001), T3 (45% 10 year-CSS, HR 14.60, CI 13.63–15.64, p < 0.001), and T4 (29% 10 year-CSS, HR 22.76, CI 21.19–24.44, p < 0.001).
CONCLUSIONS:
Earlier T stage at diagnosis was associated with better OS largely due to differences in CSS. A clinically significant difference between Stage I and Stage II was verified herein in multiple cohorts. Therefore, earlier stage at diagnosis, specifically preventing muscle invasive BC, could potentially improve survival.
INTRODUCTION
Bladder cancer (BC) is the sixth most common cancer in the United States (US) and ninth most common cancer worldwide. In 2020, it is estimated that 81,400 new cases and 17,980 deaths will occur from BC in the US alone [1]. While the vast majority of patients will present with non-muscle invasive disease, 25% will have locally advanced (muscle invasive) and 10–15% will have metastatic disease at the time of diagnosis [2, 3]. Depending on stage at diagnosis, prognosis, management, morbidity and mortality for BC vary greatly even among patients with locali-zed disease based on data from large randomized controlled trials [4–10]. Earlier stage diagnosis (e.g. non-muscle invasive) is associated with more treatment options, which are less morbid and usually allow bladder preservation. Patients who present with muscle invasive or metastatic disease have few options and a much shorter cancer-specific survival (CSS) [10–12].
The goal of cancer screening is to identify a cancer at an earlier stage. Screening for BC is not currently recommended even in the presence of risk factors (e.g. long-term smoking history or family history) although there is literature to suggest screening may improve survival [13]. To date, survival differences based on T stage in a contemporary cohort of patients with non-metastatic BC is unknown and could have implications in determining the potential benefit of BC screening. Our aim was to characterize overall (OS) and cancer-specific (CSS) survival differences between T stages in non-metastatic BC patients using two large cancer registries in the US.
METHODS
Datasets and patient selection
Data for patients with localized urothelial carcinoma of the bladder only (International Classification of Diseases for Oncology codes 8120–8139; M0/x and N0/x) and follow-up data were queried from the National Cancer Institute (NCI) Surveillance, Epi-demiology, and End Results database (SEER; 2004–2015, n = 131,614) and the National Cancer Database (NCDB; 2004-2015, n = 379,175). SEER is a popul-ation-based, cancer registry which collects cancer incidence and epidemiologic data annually as a collaboration between the NCI, the US Center for Dis-ease Control and Prevention, and regional and state cancer registries [14]. Data are collected from 18 US states that are deemed to represent all regions of the country [14]. We excluded patients in SEER with missing data on age, sex, race, and T-stage (n = 863, 0.7%).
The NCDB is a hospital-based cancer registry including over 1,500 US healthcare centers accredited by the American College of Surgeons’ Commi-ssion on Cancer (CoC) and the American Cancer Society [15]. In the NCDB, we excluded 36,012 patients (9%) with missing data on T-stage. While both SEER and NCDB provide data on cystectomy, only NCDB provides data on treatment including systemic chemotherapy and radiation. For chemo-therapy, specifically, there was no data on type, method, or mode of administration. Our study was considered Institutional Review Board exempt as we utilized only publicly available, deidentified data.
Covariates
Covariates included sex, race/ethnicity, Charlson/Deyo comorbidity index (CCI) (NCDB only), region of the US, and T-stage at the time of diagnostic transurethral resection of bladder tumor (TURBT). Sex was dichotomized as male or female. Race/eth-nicity was patient-defined and coded as white, black/African American, Hispanic, or unknown/other. The CCI was defined by NCDB as 0, 1, 2,≥3 with 0 being no associated comorbidities [16]. NCBD and SEER regions included Northeast, Midwest, South/Southeast, and West. T stage was our main exposure of interest and was defined by the American Joint Committee on Cancer (AJCC) at the time diagnosis (Ta, Tis, T1-T4) [17]. We further separated Ta and T1 stages into low and high grade (LGTa, HGTa, LGT1, HGT1).
Outcomes measured and statistics
Our primary outcome was OS (SEER and NCDB) and secondary outcomes were CSS (SEER only) and non-CSS (SEER only). Kaplan-Meier, log-rank, and multivariable Cox regression analyses were used to compare OS, CSS, and non-CSS by T-stage. Stata 13.0 (College Station, TX) was used for all analyses. p < 0.05 was considered significant in two-tailed tests.
RESULTS
Cohort characteristics SEER
SEER data for patients with non-metastatic bladder cancer were queried from 2004–2015 (n = 130,751). Patients were predominantly male (76.5%) and white (83.5%) with a median age of 72 years at diagnostic TURBT (Table 1). The majority of patients (82.0%) presented with non-muscle invasive BC (NMIBC) (LGTa, 37.8%; HGTa, 12.8%; Tis, 5.3%; LGT1, 5.83%, HGT1, 19.43%), compared to muscle invasive BC (MIBC, 17.9%) (T2, 13.2%; T3, 2.8%; T4, 2.0%). For patients with MIBC, 35.9% underwent upfront cystectomy within one year of diagnosis compared to 1.4% with NMIBC (Table 1). Data for chemotherapy and radiation were not available in SEER.
Table 1
Cohort characteristics. SEER and NCDB cohorts of non-metastatic BC patients from 2004–2015
| SEER | NCDB | |||
| Total patients | 130,751 | (100.0) | 343,163 | (100.0) |
| Year of diagnosis | ||||
| 2004 | 10,639 | (8.1) | 20,610 | (6.0) |
| 2005 | 10,469 | (8.0) | 20,204 | (5.9) |
| 2006 | 10,421 | (8.0) | 19,434 | (5.7) |
| 2007 | 10,721 | (8.2) | 21,578 | (6.3) |
| 2008 | 10,852 | (8.3) | 28,363 | (8.3) |
| 2009 | 10,692 | (8.2) | 31,832 | (9.3) |
| 2010 | 11,142 | (8.5) | 30,875 | (9.0) |
| 2011 | 10,840 | (8.3) | 31,802 | (9.3) |
| 2012 | 11,231 | (8.6) | 32,778 | (9.6) |
| 2013 | 11,007 | (8.4) | 34,487 | (10.1) |
| 2014 | 11,365 | (8.7) | 35,357 | (10.3) |
| 2015 | 11,372 | (8.7) | 35,843 | (10.4) |
| Age, year | ||||
| Median (IQR) | 72 (64–80) | 71 (62–79) | ||
| Sex | ||||
| Male | 100,081 | (76.5) | 259,817 | (75.7) |
| Female | 30,670 | (23.5) | 83,346 | (24.3) |
| Race/Ethnicity | ||||
| White | 109,135 | (83.5) | 290,842 | (84.8) |
| Black | 6,488 | (5.0) | 15,270 | (4.5) |
| Hispanic | 7,756 | (5.9) | 8,160 | (2.4) |
| Unknown/other | 7,372 | (5.6) | 28,891 | (8.4) |
| Region | ||||
| Northeast | 25,890 | (19.8) | 89,542 | (26.3) |
| South/Southeast | 13,825 | (10.6) | 90,035 | (26.5) |
| Midwest | 27,686 | (21.2) | 94,514 | (27.8) |
| West | 63,350 | (48.5) | 66,048 | (19.4) |
| Charlson | ||||
| Comorbidity | ||||
| Index (CCI) | ||||
| 0 | - | 243,019 | (70.8) | |
| 1 | - | 71,669 | (20.9) | |
| 2 | - | 21,070 | (6.1) | |
| ≥3 | - | 7,405 | (2.2) | |
| T stage | ||||
| at diagnostic | ||||
| TURBT | ||||
| LGTa | 42,445 | (37.8) | 110,400 | (37.0) |
| HGTa | 14,380 | (12.8) | 37,412 | (12.6) |
| is | 6,943 | (6.2) | 18,138 | (6.1) |
| LGT1 | 6,549 | (5.8) | 18,138 | (6.2) |
| HGT1 | 21,835 | (19.4) | 60,043 | 20.1 |
| 2 | 14,860 | (13.2) | 43,354 | (14.5) |
| 3 | 3,104 | (2.8) | 5,023 | (1.7) |
| 4 | 2,250 | (2.0) | 5,326 | (1.8) |
| Treatment | ||||
| NMIBC | ||||
| Cystectomy | ||||
| No | 108,507 | (98.2) | 282,488 | (97.6) |
| Yes | 1,563 | (1.4) | 6,274 | (2.2) |
| Unknown | 467 | (0.4) | 698 | (0.2) |
| Chemotherapy | ||||
| No | - | 235,487 | (81.4) | |
| Yes | - | 44,898 | (15.5) | |
| Unknown | - | 9,075 | (3.1) | |
| SEER | NCDB | |||
| Radiation | ||||
| No | - | 285,983 | (98.8) | |
| Yes | - | 1,264 | (0.4) | |
| Unknown | - | 2,213 | (0.8) | |
| MIBC | ||||
| Cystectomy | ||||
| No | 12,898 | (63.8) | 35,628 | (66.3) |
| Yes | 7,255 | (35.9) | 17,781 | (33.1) |
| Unknown | 61 | (0.3) | 294 | (0.6) |
| Chemotherapy | ||||
| No | - | 32,509 | (60.5) | |
| Yes | - | 19,458 | (36.2) | |
| Unknown | - | 1,736 | (3.2) | |
| Radiation | ||||
| No | - | 44,897 | (83.6) | |
| Yes | - | 8,440 | (15.7) | |
| Unknown | - | 366 | (0.7) | |
NCDB
NCDB database from 2004-2015 identified 343,163 with non-metastatic BC. Patients were predominantly male (75.7%) and white (84.8%) with a median age of 71 years at diagnosis (Table 1). Patients presented with predominantly NMIBC (82.0%) (LGTa, 37.0%; HGTa, 12.6%; Tis, 6.1%; LGT1, 6.2%; HGT1, 20.1%) versus MIBC (18.0%) (T2, 14.5%; T3, 1.7%; T4, 1.8%). Of patients with NMIBC, only a small percentage were treated with cystectomy within the first year of diagnosis (2.2%), systemic chemotherapy (15.5%), or radiation (0.4%) compared to MIBC (cystectomy, 33.1%; systemic che-motherapy, 36.2%; radiation, 15.7%) (Table 1).
Overall survival (SEER and NCBD)
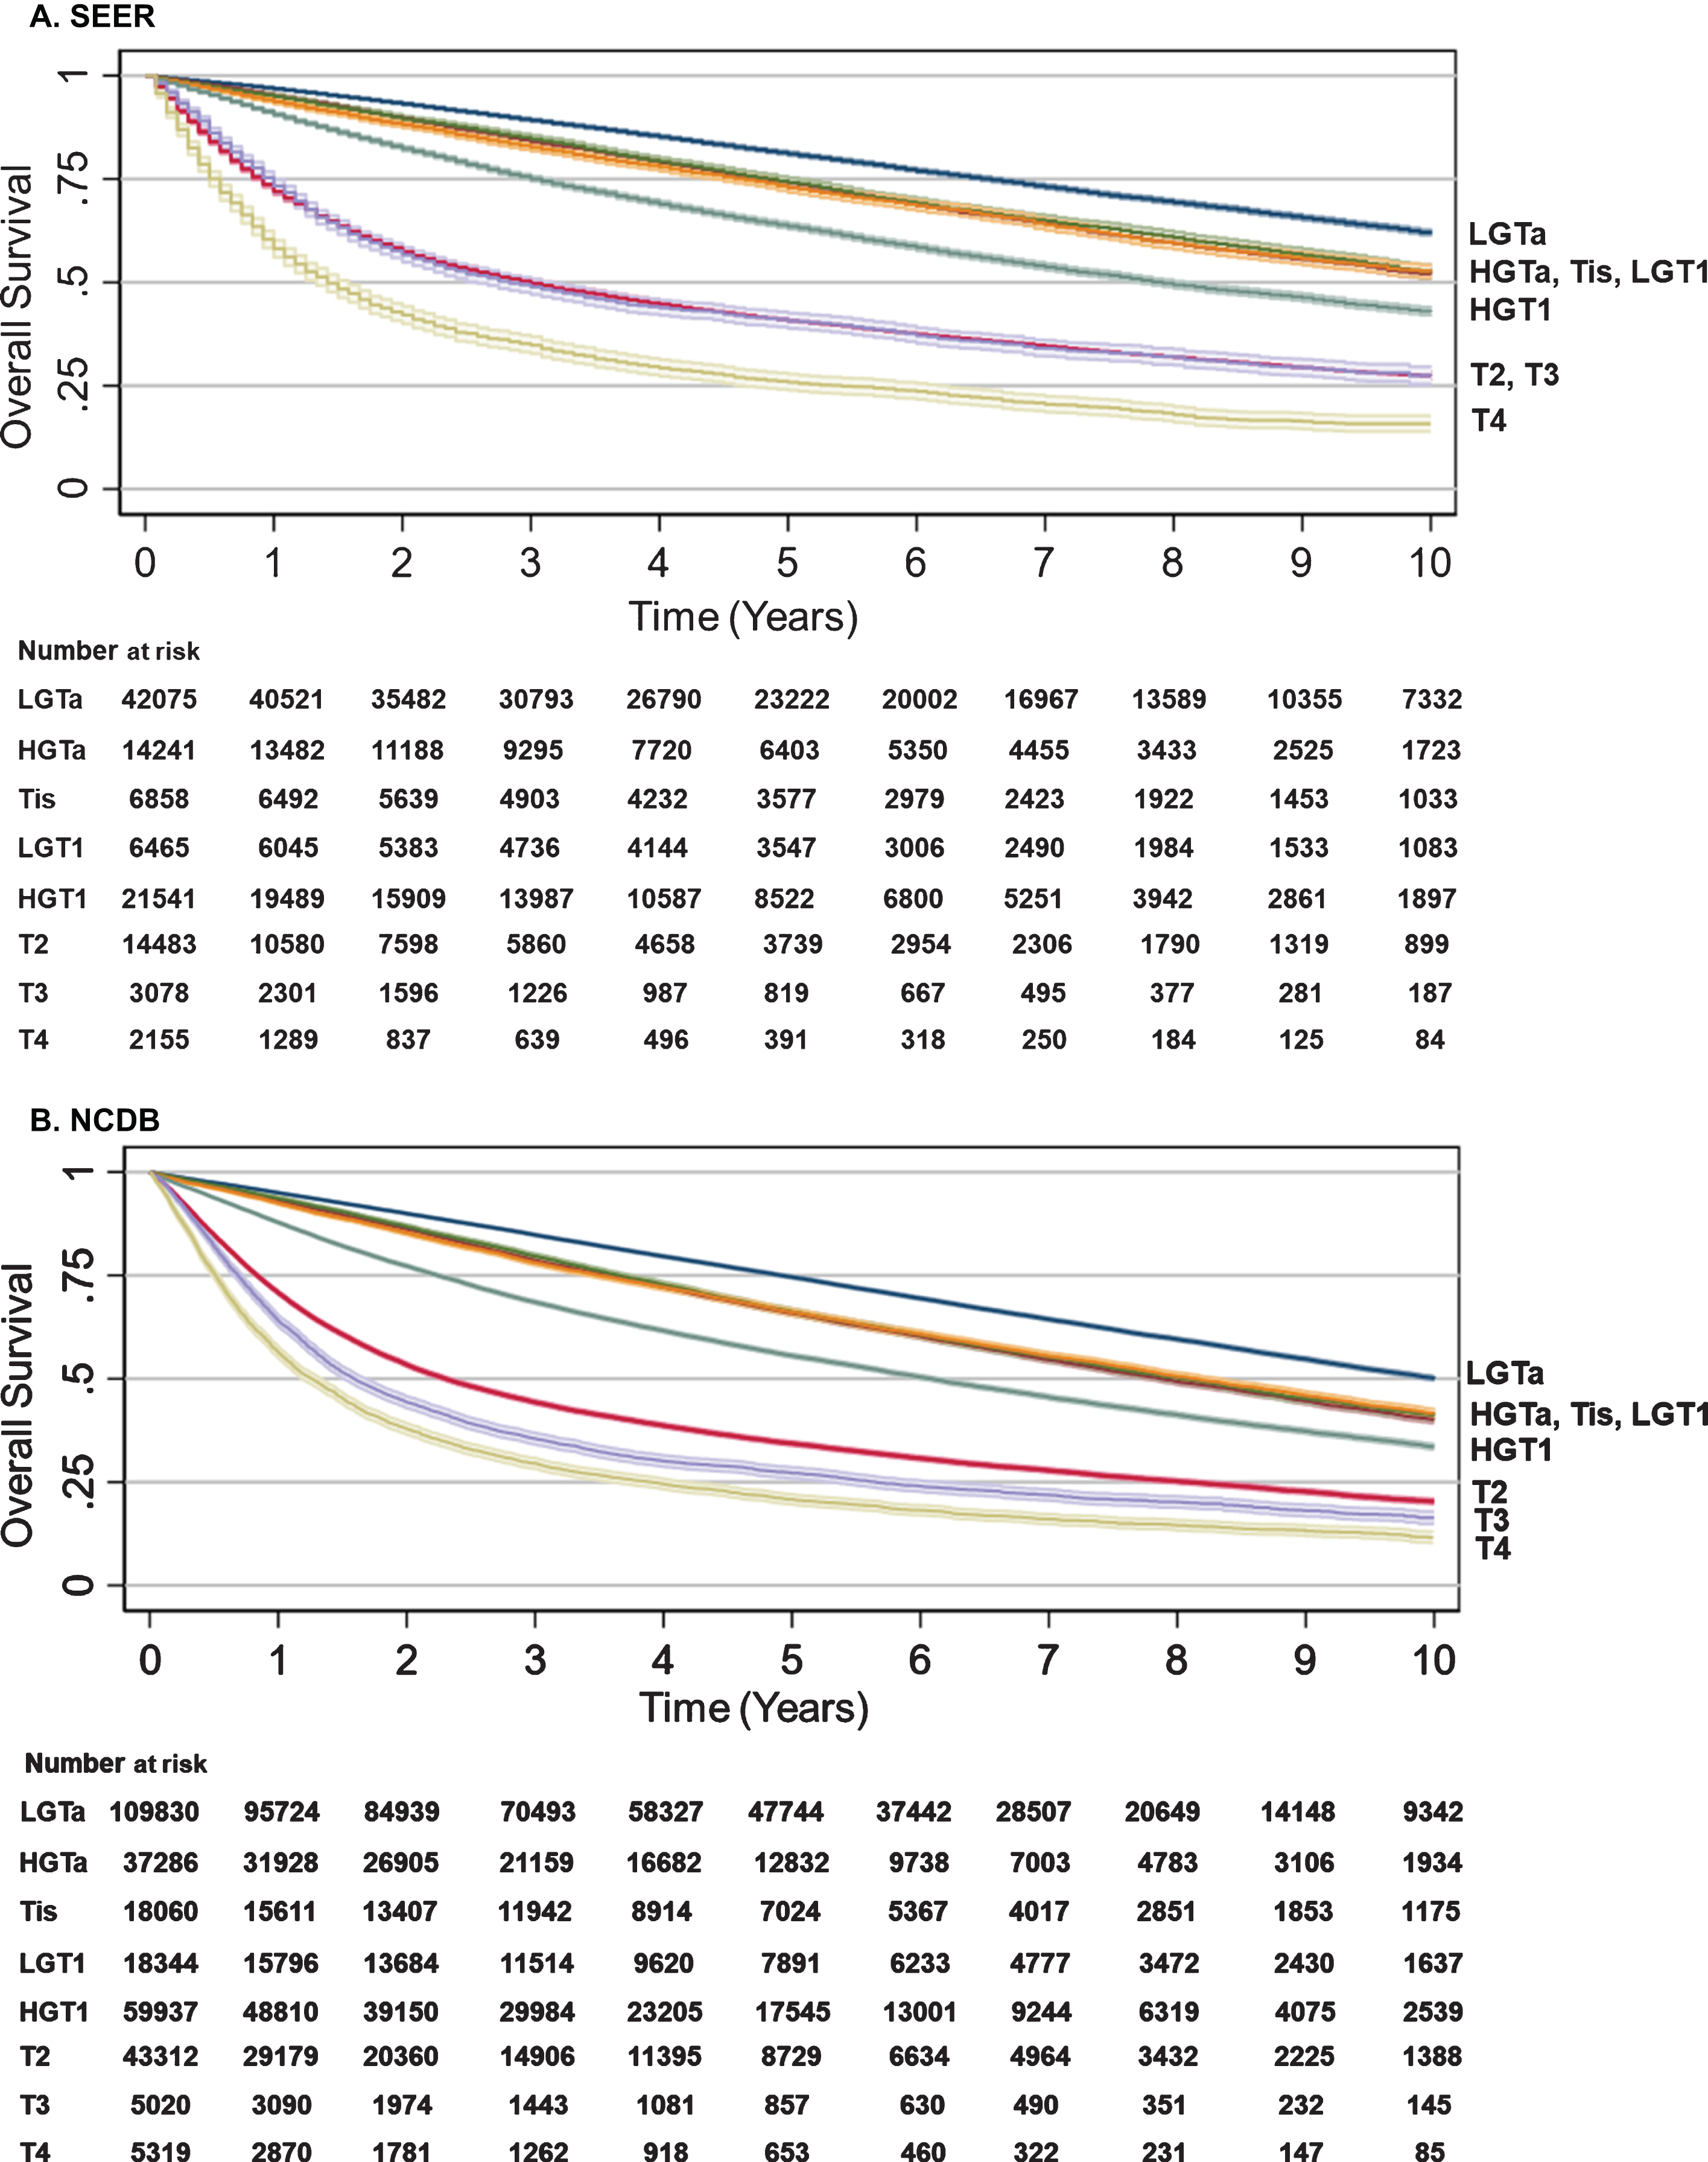
Median follow up for survivors in SEER was 5.5 years and 4.3 years in NCDB. Using SEER data with lowest T stage bladder cancer (LGTa) as a reference point and controlling for year of diagnosis, age per 10-year increase, sex, race/ethnicity, CCI and region in the US on multivariable analysis, OS ranged from HGTa (HR 1.17, CI 1.13–1.21, p < 0.001) to T4 (HR 5.70, CI 5.41–6.00, p < 0.001) with an inflection between HGT1 (HR 1.68, CI 1.63–1.73, p < 0.001) and T2 (HR 3.39, CI 3.20–3.49, p < 0.001), which was verified using NCDB (Table 2). For both SEER and NCDB data, separation of OS curve was seen as early as one-year post-diagnosis with increasing T stage demonstrating worse OS with each year post-diagnosis (Table 2; Figure 1). In SEER, 5-year OS for NMIBC was ∼60–75% while MIBC ranged from 25 to < 50% (Table 2; Fig. 1). For NCDB, 5-year OS for NMIBC was 50–75% versus ∼25% for MIBC (Table 2; Fig. 1). Univariate analysis of the association between year of diagnosis, age per 10-year increase, sex, race/ethnicity, CCI, region in the US or T stage at diagnosis and OS for SEER and NCDB are provided in Supplemental Table 1.
Table 2
Survival Trends by BC T stage. Multivariable cox regression1 comparing OS (SEER and NCDB), CSS (SEER only), and non-CSS (SEER only) by T stage at time of diagnostic TURBT with LGTa used as a reference point
| Overall Survival | Overall Survival | Cancer Specific | Non-Cancer Specific | |||||
| (SEER) | (NCDB) | Survival (SEER) | Survival (SEER) | |||||
| T stage at diagnosis | HR (95% CI) | p | HR (95% CI) | p | HR (95% CI) | p | HR (95% CI) | p |
| LGTa | Ref | Ref | Ref | Ref | ||||
| HGTa | 1.17 (1.13–1.21) | <0.001 | 1.16 (1.14–1.19) | <0.001 | 1.94 (1.81–2.08) | <0.001 | 1.01 (0.97–1.05) | 0.735 |
| is | 1.22 (1.16–1.27) | <0.001 | 1.22 (1.19–1.26) | <0.001 | 2.28 (2.09–2.47) | <0.001 | 0.99 (0.94–1.05) | 0.812 |
| LGT1 | 1.35 (1.29–1.41) | <0.001 | 1.29 (1.26–1.32) | <0.001 | 2.30 (2.11–2.51) | <0.001 | 1.15 (1.09–1.21) | <0.001 |
| HGT1 | 1.68 (1.63–1.73) | <0.001 | 1.65 (1.62–1.68) | <0.001 | 4.24 (4.01–4.47) | <0.001 | 1.14 (1.10-1.18) | <0.001 |
| 2 | 3.39 (3.30-3.49) | <0.001 | 3.22 (3.17–3.27) | <0.001 | 12.18 (11.57–12.82) | <0.001 | 1.44 (1.38–1.50) | <0.001 |
| 3 | 3.87 (3.68–4.06) | <0.001 | 4.23 (4.08–4.37) | <0.001 | 14.60 (13.63–15.64) | <0.001 | 1.39 (1.28–1.52) | <0.001 |
| 4 | 5.70 (5.41–6.00) | <0.001 | 5.13 (4.97–5.30) | <0.001 | 22.76 (21.19–24.44) | <0.001 | 1.77 (1.60–1.96) | <0.001 |
1Included in each multivariable Cox regression were the following covariates: year of diagnosis, age per 10-year increase, sex, race/ethnicity and region in the United States as shown in Table 1. For NCDB, Charlson comorbidity index was included and defined as 0, 1, 2, ≥3 with 0 being no associated comorbidities.
Fig. 1
Overall survival by BC T stage. Kaplan-Meier analyses were performed to estimate OS from time of diagnosis to censorings or death with LGTa as a reference. Blue (LGTa), maroon (HGTa), green (Tis), orange (LGT1), teal (HGT1), red (T2), purple (T3), yellow (T4). Shading represents 95% CI. (A) For SEER, OS hazard ratios, 95% CI, and p values when compared to LGTa were HGTa (1.17, CI 1.13–1.21, p < 0.001), Tis (1.22, CI 1.16–1.27, p < 0.001), LGT1 (1.35, CI 1.29–1.41, p < 0.001), HGT1 (1.68, CI 1.63–1.73, p < 0.001), T2 (3.39, CI 3.30–3.49, p < 0.001), T3 (3.87, CI 3.68–4.06, p < 0.001), and T4 (5.70, CI 5.41–6.00, p < 0.001). (B) For NCDB, OS hazard ratios, 95% CI, and p values when compared to LGTa were HGTa (1.16, CI 1.14–1.19, p < 0.001), Tis (1.22, CI 1.19–1.26, p < 0.001), LGT1 (1.29, CI 1.26–1.32, p < 0.001), HGT1 (1.65, CI 1.62–1.69, p < 0.001), T2 (3.22, CI 3.17–3.27, p < 0.001), T3 (4.23, CI 4.08–4.37, p < 0.001), and T4 (5.13, CI 4.97–5.30, p < 0.001).
Cancer specific and non-cancer specific survival (SEER)
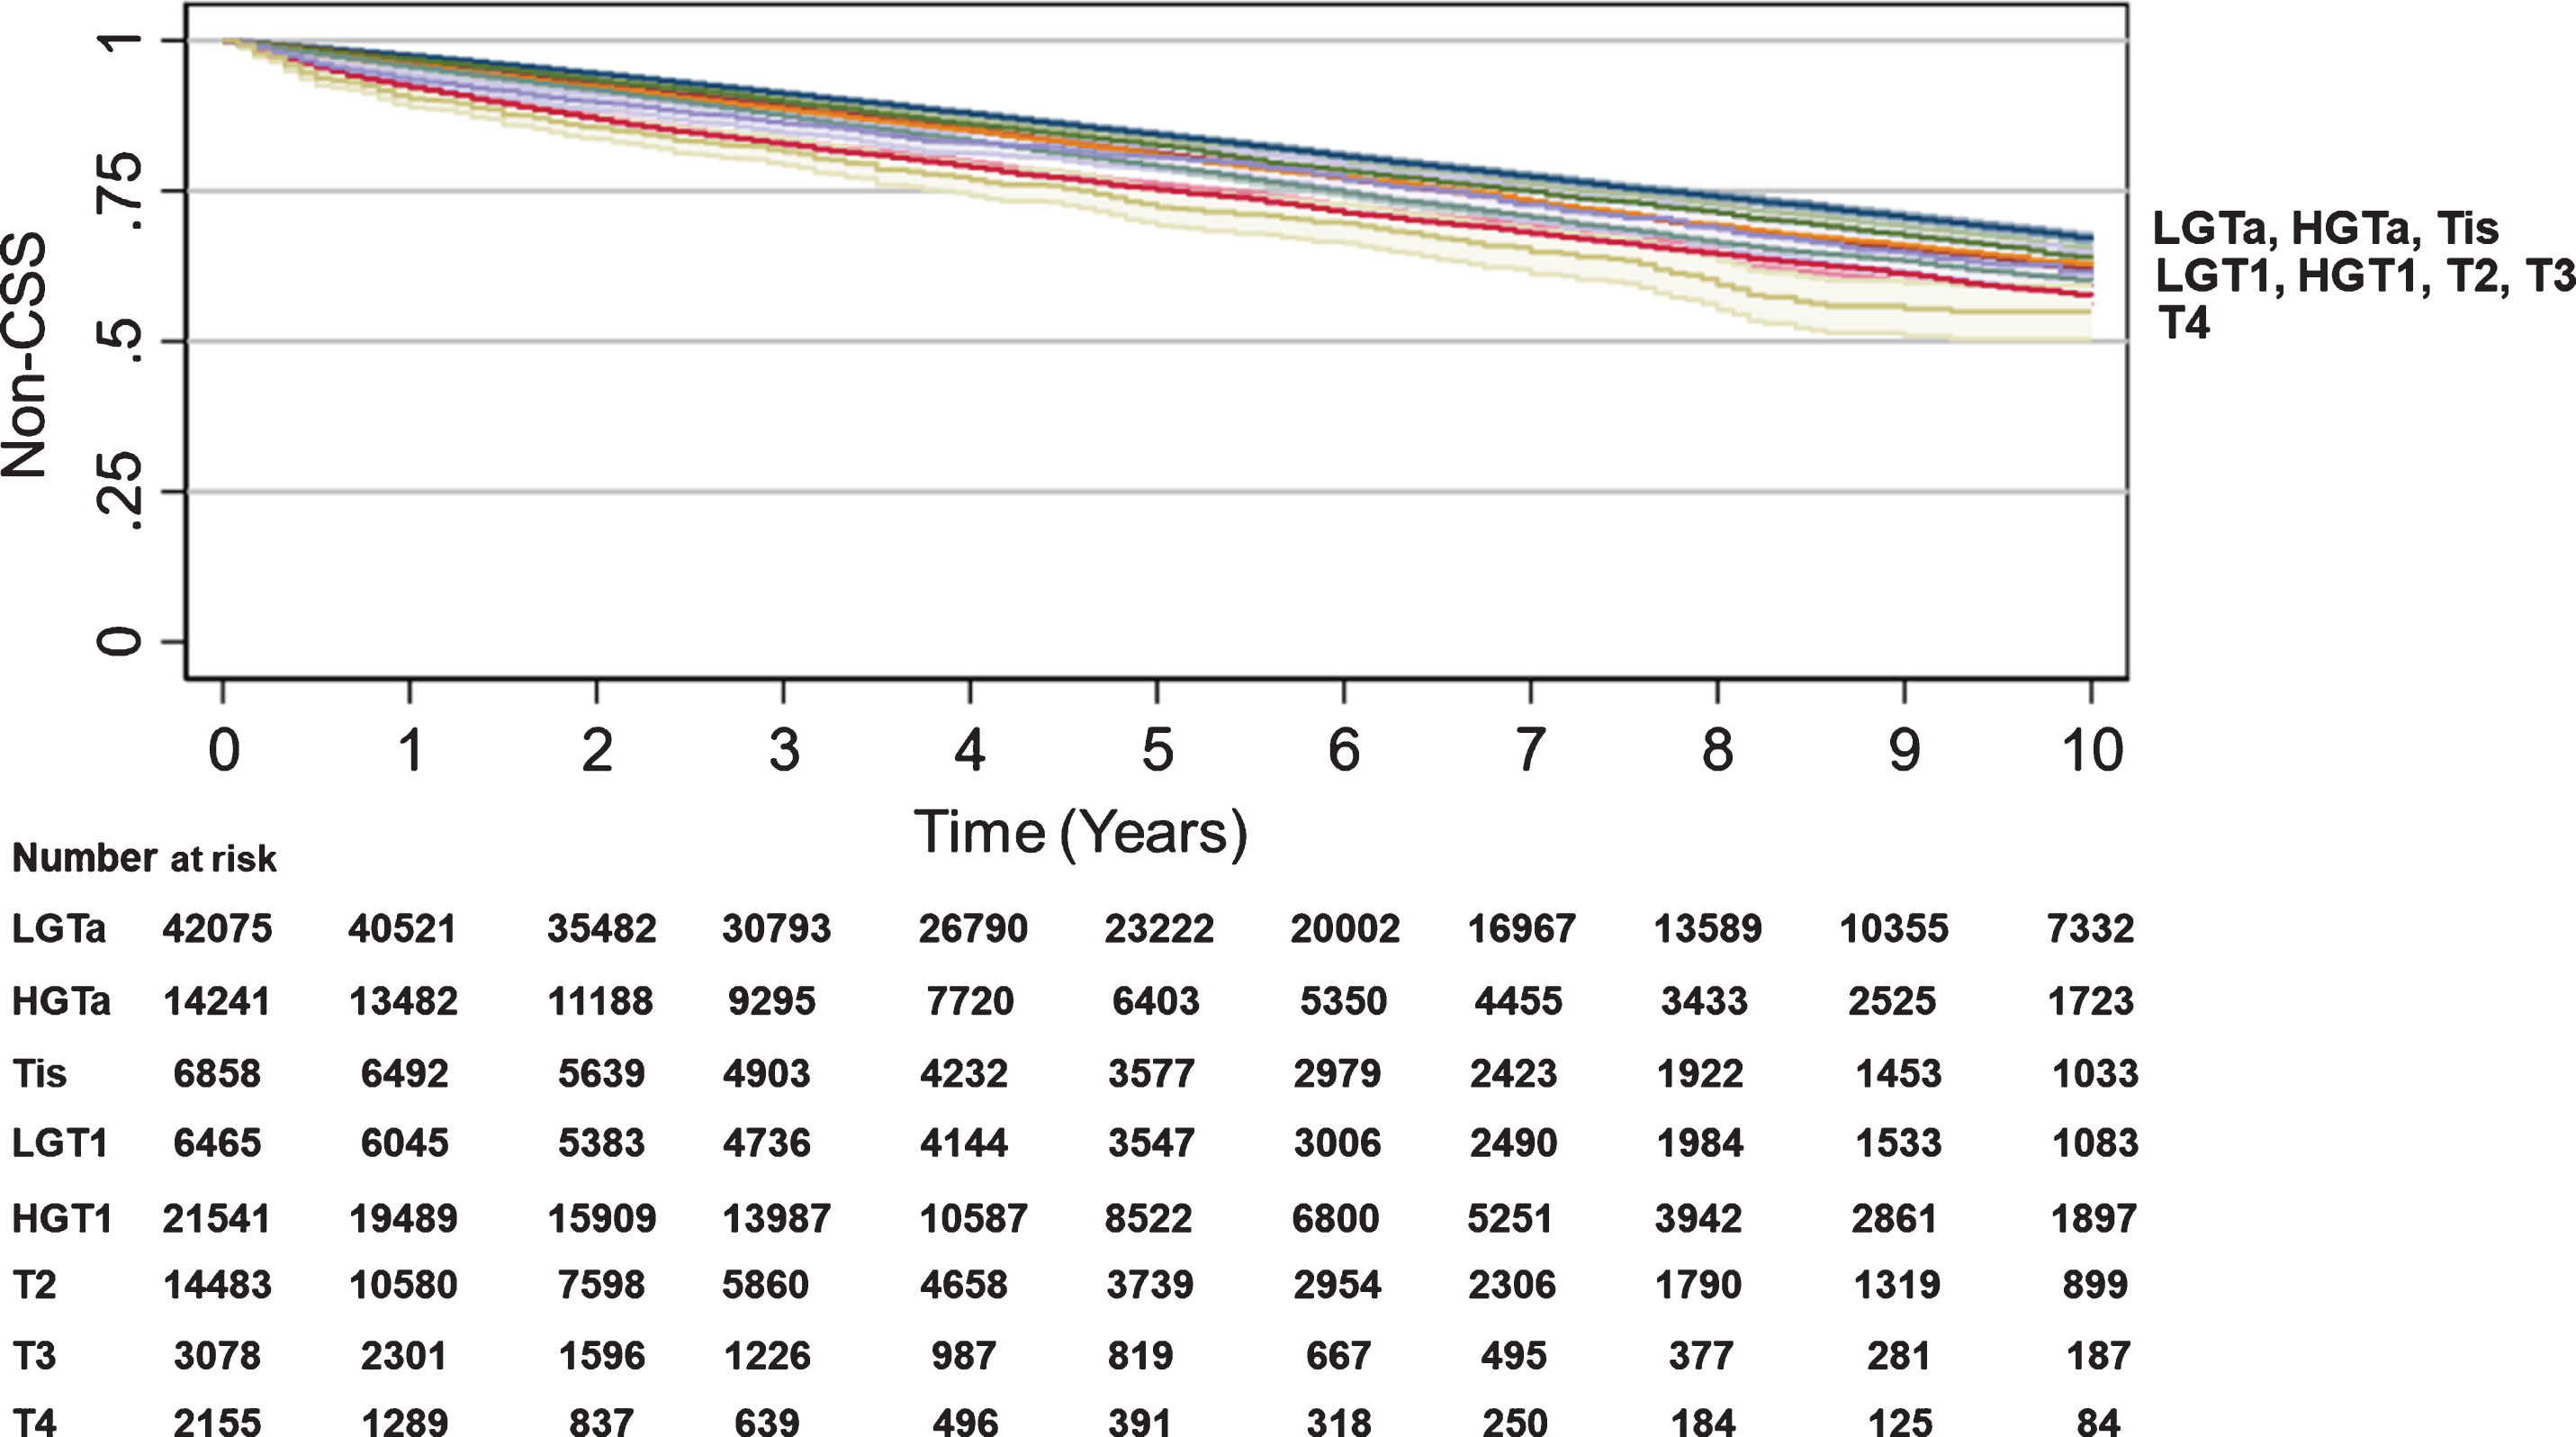
SEER data were used to assess CSS and non-CSS by T stage. While there were very modest differences in non-CSS by T stage, the differences in CSS were substantial and more reflective of OS differences: HGTa (84% 10 year-CSS, HR 1.94, CI 1.81–2.08, p < 0.001), Tis (82% 10 year-CSS, HR 2.28, CI 2.09–2.47, p < 0.001), LGT1 (84% 10 year-CSS, HR 2.30, CI 2.11–2.51, p < 0.001), HGT1 (72% 10 year-CSS, HR 4.24, CI 4.01–4.47, p < 0.001), T2 (48% 10 year-CSS, HR 12.18, CI 11.57–12.82, p < 0.001), T3 (45% 10 year-CSS, HR 14.60, CI 13.63–15.64, p < 0.001), and T4 (29% 10 year-CSS, HR 22.76, CI 21.19–24.44, p < 0.001) (Table 2, Fig. 2). While non-CSS was statistically different for LGT1 to T4 compared to LGTa as a baseline, LGT1 to T4 curves were closely clustered (Table 2, Fig. 3). Univariate analysis of the association between year of diagnosis, age per 10-year increase, sex, race/ethnicity, CCI, region in the US, or T stage at diagnosis and CSS or non-CSS for SEER are provided in Supplemental Table 1.
Fig. 2
Cancer-specific survival by T stage. Kaplan-Meier analyses were performed to estimate CSS from time of diagnosis to censorings or death using SEER data with LGTa as a reference. Blue (LGTa), maroon (HGTa), green (Tis), orange (LGT1), teal (HGT1), red (T2), purple (T3), yellow (T4). Shading represents 95% CI. For SEER, OS hazard ratios, 95% CI, and p values when compared to LGTa were HGTa (1.94, CI 1.81–2.08, p < 0.001), Tis (2.28, CI 2.09–2.47, p < 0.001), LGT1 (2.30, CI 2.11–2.51, p < 0.001), HGT1 (4.24, CI 4.01–4.47, p < 0.001), T2 (12.18, CI 11.57–12.82, p < 0.001), T3 (14.60, CI 13.63–15.64, p < 0.001), and T4 (22.76, CI 21.19–24.44, p < 0.001).
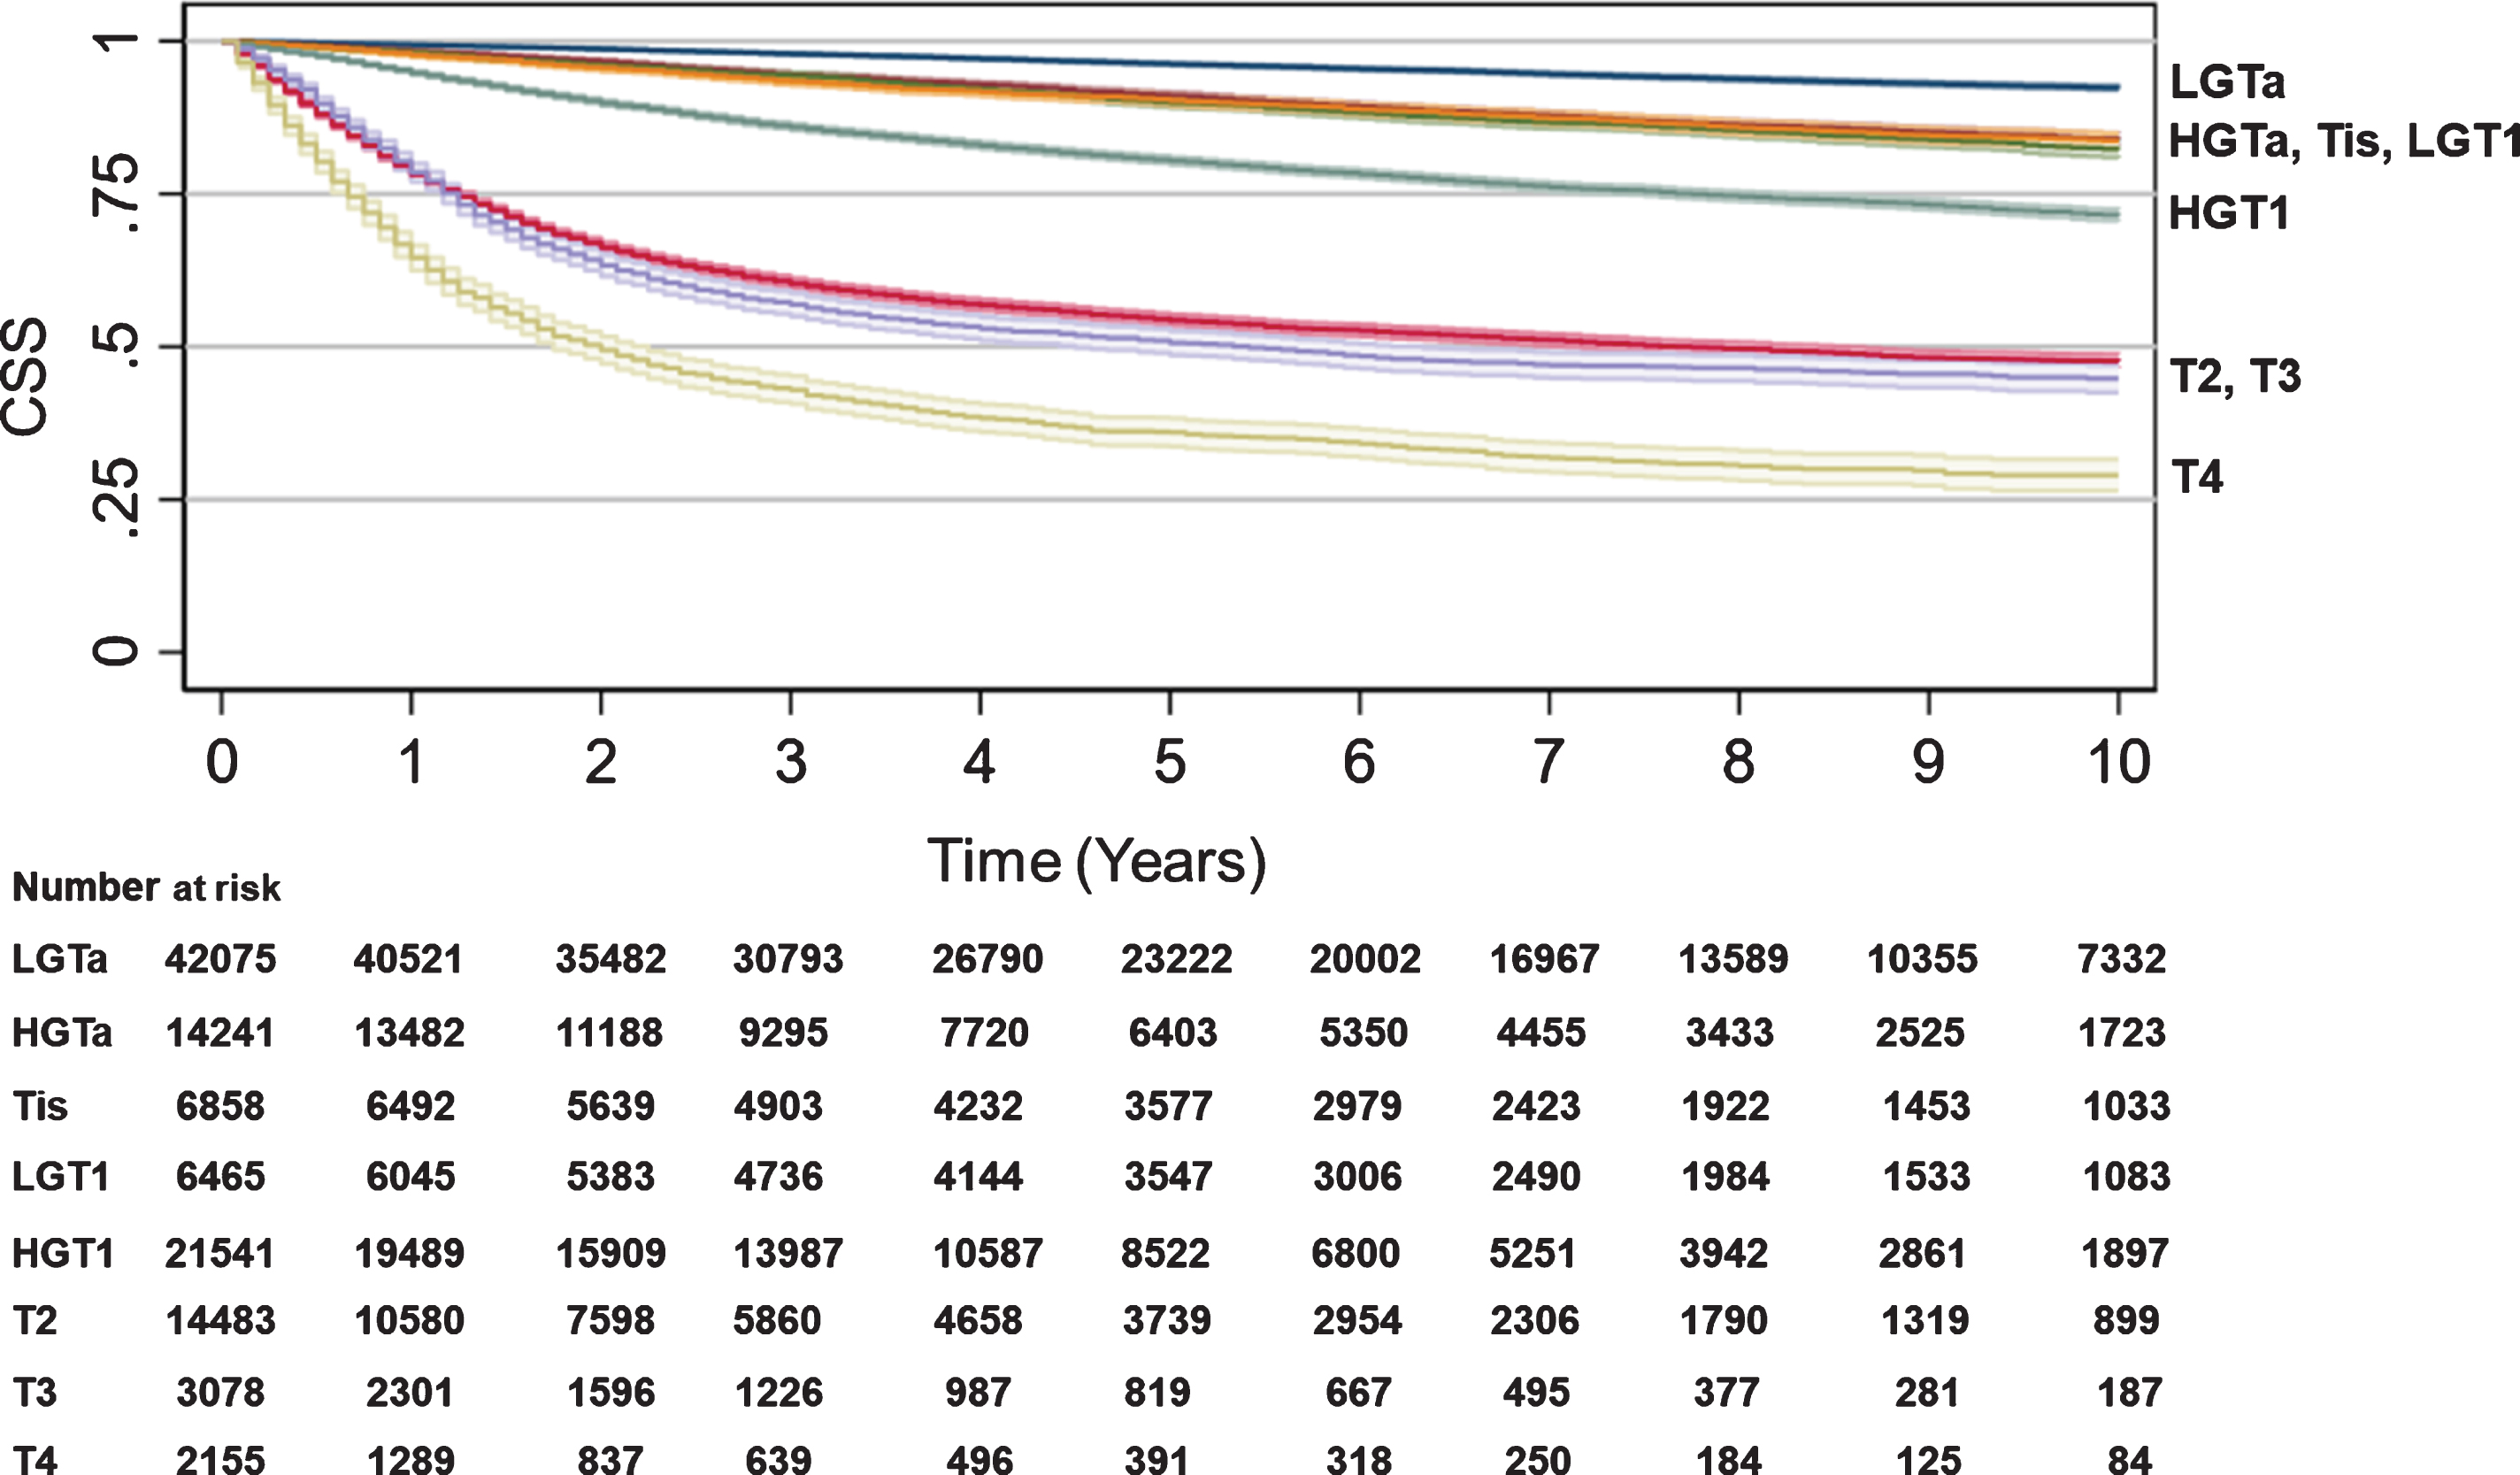
Fig. 3
Trend in Non-cancer-specific survival by BC T stage. Kaplan-Meier analyses were performed to estimate Non-CSS using SEER data with LGTa as a reference. Blue (LGTa), maroon (HGTa), green (Tis), orange (LGT1), teal (HGT1), red (T2), purple (T3), yellow (T4). Shading represents 95% CI. For SEER, OS hazard ratios, 95% CI, and p values when compared to LGTa were HGTa (1.01, CI 0.97–1.05, p = 0.735), Tis (0.99, CI 0.94–1.05, p = 0.812), LGT1 (1.15, CI 1.09–1.21, p < 0.001), HGT1 (1.14, CI 1.10–1.18, p < 0.001), T2 (1.44, CI 1.38–1.50, p < 0.001), T3 (1.39, CI 1.28–1.52, p < 0.001), T4 (1.77, CI 1.60–1.96, p < 0.001).
DISCUSSION/CONCLUSIONS
We analyzed overall and cancer-specific survival differences between T stages in patients with non-metastatic BC using two large cancer registries in the US (SEER and the NCDB). Both SEER and the NCDB demonstrated similar trends in OS with early curve separation at one year following diagnosis for NMIBC (LGTa, HGTa, Tis, LGT1, HGT1) vs. MIBC (T2-T4) with increasing stage demonstrating worse OS. This statistically significant trend in OS was mirrored by that of CSS and suggests that earlier diagnosis regardless of T stage was essential in the equation for improving survival for patients with BC.
Cancer screening aims to detect clinically-signifi-cant cancers at an earlier stage in asymptomatic pat-ients. Unlike some other cancers, BC is rarely found at autopsy [18, 19]. Therefore, rates of clinically in-significant cancer in asymptomatic patients should be low. Screening should be implemented when earlier diagnosis can significantly impact survival, while a delay in diagnosis can worsen CSS and expose patients to more radical, morbid treatment options. While BC screening is not currently recommended, prior investigation by Messing et al. suggested that screening for asymptomatic hematuria in a targeted population (male patients > 55 years old) led to reduction in later stage BC diagnosis as well as improved survival at 14 years of follow up [13]. Patient demographics herein reflect trends seen in practice with predominant incidence of diagnosis seen in white males over age 55 years [1]. Our data suggests that T stage at diagnosis is critical for both OS and CSS in BC patients with lower T stages inferring the best survival. Other targetable risk factors for a potential screening cohort include tobacco exposure, occupational exposure, and family history which also have been associated with increased risk of BC [20]. Krabbe et al. found that men older than 60 years with a smoking history of > 30 pack years were at highest risk for BC (rate 2/1,000 persons) using Prostate, Lung, Colorectal, and Ovarian Cancer Screening Trial (PLCO) and National Lung Cancer Screening Trial (NLST) datasets [21]. While the specifics of screening with regards to who and with what means needs to be elucidated, these questions represent future directions in improving BC survival.
This study has several limitations, including those limitations inherent to all retrospective studies of large administrate databases. NCDB data should re-flect systemic chemotherapy only (not intravesical), but there was no means to clarify type, method, or mode of chemotherapy administration within the confines of the dataset. CSS could only be assessed using SEER and therefore a secondary validating cohort was not possible given limitations of data available through the NCDB. Furthermore, while we demonstrated worsening OS largely due to differences in CSS with increasing T stage which suggests stage migration could be beneficial, we were unable to assess the true impact of screening on BC survival using these datasets. We could not determine who of the earlier staged patients would have progressed nor the potential for lead-time bias in the case of BC screening. Only prospective screening trials can determine the efficacy of BC screening (e.g. determining number needed to treat or harm). Despite these limitations, strengths of our study include utilization of two population-based cohorts with data from over 500,000 BC patients combined, with study demographics reflecting patients seen in clinical practice. While the two datasets differ, we found a congruence between OS trend: worse OS with each increasing T stage regardless of dataset. This congruence between datasets was particularly interesting as one criticism of the NCDB is its selection bias towards patients who choose and are able to travel to be treated at CoC accredited hospitals. While this direct comparison could not be made for CSS or non-CSS given limitations of the NCDB dataset, CSS trends reflected that of OS as hypothesized. Furthermore, while SEER captures all cancers diagnosed by region, NCDB data are queried from over 1,500 eligible hospitals which are predominantly academic or more comprehensive centers [14, 15]. Continuity of trend between these two datasets suggested that survival based on T stage was pervasive despite regional or institutional differences.
ACKNOWLEDGMENTS
The authors have no acknowledgements.
FUNDING
The authors report no funding.
AUTHOR CONTRIBUTIONS
Conception: LFC, ABW, XM, SLW, JJM, YL; Performance of Work: LFC, ABW, XM, JJM, YL; Interpretation and analysis of data: LFC, ABW, XM, SLW, JJM, YL; Writing the article: LFC, ABW, XM, SLW, JJM, YL
ETHICAL CONSIDERATIONS
Our study was considered Institutional Review Board exempt as we utilized only publicly available, deidentified data.
CONFLICTS OF INTEREST/DISCLOSURES
JJM: Honoraria (Cold Genesys; Janssen); Consulting or Advisory Role (AstraZeneca, Ferring, Merck), Research Funding (Epizyme, Merck Sharp & Dohme)
YL: Stock and other Ownership Interests (Vessi Medical); Consulting or Advisory Role (AstraZeneca; Augmenix; BioCancell; Cepheid; MDxhealth; Merck; Nucleix; pacific edge; Photocure; Urogen pharma; Vessi Medical); Research Funding (Abbott Molecular (Inst); Augmenix; BioCancell (Inst); Cepheid; Cepheid (Inst); GenomeDx (Inst); MDxHealth (Inst); pacific edge; pacific edge (Inst); Photocure (Inst)
LFC, ABW, XM and SLW have no conflicts of interest to report.
SUPPLEMENTARY MATERIAL
[1] The supplementary material is available in the electronic version of this article: https://dx.doi.org/10.3233/BLC-200381.
REFERENCES
[1] | American Cancer Society. Cancer-Facts-and-Figures-2020. Cancer Facts Fig 2020. 2020. |
[2] | Robertson AG , Kim J , Al-Ahmadie H , Bellmunt J , Gueo G , Cherniack AD , Hinoue T , et al. Comprehensive molecular characterization of muscle-invasive bladder cancer. Cell. (2017) ;171: :540–56. |
[3] | Chin JL , Siddiqui KM , Tran KC . Metastatic Bladder Cancer. In Introduction to Cancer Metastasis. Elsevier Inc. 2016. p. 177-198 |
[4] | Messing EM , Tangen CM , Lerner SP , Sahasrabudhe DM , Koppie TM , Wood DP , et al. Effect of intravesical instillation of gemcitabine vs saline immediately following resection of suspected low-grade non-muscle-invasive bladder cancer on tumor recurrence: SWOG S0337 Randomized Clinical Trial. JAMA. (2018) ;319: :1880–88. |
[5] | Pietzak EJ , Zabor EC , Bagrodia A , Armenia J , Hu W , Zehir A , et al. Genomic differences in primary and secondary muscle-invasive bladder cancer as a basis for disparate outcomes to cisplatin-based neoadjuvant chemotherapy. Eur Urol. (2019) ;75: :231–39. |
[6] | Barksi D . The arguments for an early cystectomy in patients with urothelial carcinoma. Cent European J Urol. (2014) ;67: :333–4. |
[7] | Ebbing J , Heckmann RC , Collins JW , Miller K , Erber B , Friedersdorff F , et al. Oncological outcomes, quality of life outcomes, and complications of partial cystectomy for selected cases of muscle-invasive bladder cancer. Sci Rep. (2018) ;8: :8360. |
[8] | Prasanna T , Craft P , Balasingam G , Haxhimolla H , Pranavan G . Intravesical Gemcitabine versus Intravesical Bacillus Calmette-Guérin for the Treatment of Non-Muscle Invasive Bladder Cancer: An Evaluation of Efficacy and Toxicity. Front Oncol. (2017) ;7: :260–5. |
[9] | Grossman HB , Natale RB , Tangen CM , Speights VO , Vogelzang NJ , Trump DJ , et al. Neoadjuvant chemotherapy plus cystectomy compared with cystectomy alone for locally advanced bladder cancer. N Engl J Med. (2003) ;349: :859–66. |
[10] | May M , Helke C , Nitzke T , Vogler H , Hoschke B . Survival rates after radical cystectomy according to tumor stage of bladder carcinoma at first presentation. Urol Int. (2004) ;72: :103–11. |
[11] | Chu AT , Holt SK , Wright JL , Ramos JD , Grivas P , Yu EY , et al. Delays in radical cystectomy for muscle-invasive bladder cancer. Cancer. (2019) ;125: :2011–17. |
[12] | Flaig TW , Spiess PE , Agarwal N , Bangs R , Boorjian SA , Buyyounouski MK , et al. NCCN Guidelines Insights: Bladder Cancer, Version 5. J Natl Compr Canc Netw. (2018) ;16: :1041–53. |
[13] | Messing EM , Madeb R , Young T , Gilchrist KW , Bram L , Greenberg EB , et al. Long-term outcome of hematuria home screening for bladder cancer in men. Cancer. (2006) ;107: :2173–9. |
[14] | Doll KM , Rademaker A , Sosa JA . Practical guide to surgical data sets: Surveillance, Epidemiology, and End Results (SEER) Database. JAMA Surg. (2018) ;153: :588–89. |
[15] | Winchester DP , Stewart AK , Bura C , Jones RS . The national cancer data base: a clinical surveillance and quality improvement tool. J Surg Oncol. (2004) ;85: :1–3. |
[16] | Deyo RA , Cherkin DC , Ciol MA . Adapting a clinical comorbidity index for use with ICD-9-CM administrative databases. J Clin Epidemiol. (1992) ;45: :613–9. |
[17] | Edge BD , Compton CC , Fritz AG et al. Compton CC, Fritz AG et al. American Joint Committee on Cancer Staging Manual (7th Ed), Springer. New York ((2009) ). |
[18] | Resseguie LJ , Nobrega FT , Farrow GM , Timmons JW , Worobec TG . Epidemiology of renal and ureteral cancer in Rochester, Minnesota, -with special reference to clinical and pathologic features. Mayo Clin Proc. (1978) ;53: :503–10. |
[19] | Kishi K , Hirota T , Matsumoto K , Kakizoe T , Murase T , Fujita J . Carcinoma of the bladder: a clinical and pathological analysis of 87 autopsy cases. J Urol. (1981) ;125: :36–9. |
[20] | Burger M , Catto JW , Dalbagni G , Grossman HB , Herr H , Karakiewicz P , et al. Epidemiology and risk factors of urothelial bladder cancer. Eur Urol. (2013) ;63: :234–41. |
[21] | Krabbe LM , Svatek RS , Shariat SF , Messing E , Lotan Y . Bladder cancer risk: Use of the PLCO and NLST to identify a suitable screening cohort. Urol Oncol. (2015) ;33: :65.e19–25. |


