
25-Year Trends in Stage-Specific Incidence Rates for Bladder Cancer in a Large Statewide Registry
Abstract
BACKGROUND:
Bladder cancer (BC) is a common genitourinary malignancy with over 80,000 new cases diagnosed annually and over 17,000 associated deaths.
OBJECTIVE:
We review 25-years of BC incidence (1993-2017) within the state of Pennsylvania to better define incidence, geographic distribution, and trends over time.
METHODS:
The Pennsylvania Cancer Registry was reviewed for statewide and component county age-adjusted BC incidence rates and stage distribution. Chloropleth maps plotting statewide and county-specific incidence rates across time were created using the GeoDa statistical package.
RESULTS:
93,476 cases of BC were recorded in Pennsylvania from 1993 to 2017. Age-adjusted annual rates of BC over the study interval were stable at 24.5 patients per 100,000 (range, 22.7–25.6). However, annual rates of distant disease increased from 0.5 to 1.1 patients per 100,000 (p < 0.001) with an average percent change increase of 6.6% over the study interval. The annual percent distribution of distant disease doubled from 2.3% to 5.1% (p < 0.001) with a greater increase in women compared to men. Chloropleth maps highlighted growing “hot spots” of bladder cancer incidence in the northwestern, northeastern, and southeastern portions of the state.
CONCLUSIONS:
While BC incidence in the state of Pennsylvania has remained relatively stable over the past 25 years, a concerning increase in distant disease was observed. Geospatial investigation implicates higher risk regions. Further studies are necessary to delineate the underlying etiologies for these observations.
INTRODUCTION
Urothelial carcinomas originate from the epithelial lining of the urinary tract including the bladder and upper urinary tract [1]. The incidence of bladder cancer (BC) continues to rise within the United States, increasing from approximately 50,000 new cases diagnosed annually during the 1990s to greater than 80,000 new cases in 2020 [2]. Among American men, it is the fourth most common cancer and the seventh leading cause of cancer-related mortality [2]. With similar trends outside of the United States [3], it is apparent that BC is a significant public health concern.
Cigarette smoking and occupational exposure to aryl amines are well-established risk factors for BC. Smoking, in particular, is a reported causal factor in approximately half of all bladder cancer cases [3]. Despite observing a decrease in the prevalence of cigarette smoking since 1998 [4] and stricter government regulations on the use of aryl amines, there has not been a reduction in the incidence of BC. In fact, there has been a paradoxical increase in its overall incidence. Although this could reflect the lag time between exposure and the development of the disease, these observations also suggest the impact of other potential carcinogenic exposures and risk factors including (but not limited to) arsenic, hair dye, dietary, and environmental factors [5, 6].
In Pennsylvania, the incidence rate for BC is the eighth highest in the United States with 22.7 cases per 100,000 per year [7]. The need for relatively intensive and lifelong surveillance coupled with expenses associated with treatment has resulted in bladder cancer incurring the highest per-patient costs (from diagnosis to death) of all cancers [8–10]. Thus, in addition to the impact on psychological health and well-being, there is a major economic burden placed on the patient, family, and society overall [11].
Previously published population-based registry studies have suggested an increase in the absolute and relative percentages of newly diagnosed BC cases [12, 13]. In this context, we review data from a large statewide cancer registry over a contemporary 25-year interval to determine incidence rates and trends for BC, stage distribution of these cancers, as well as specific geographic “hot spots” harboring higher rates of disease.
PATIENTS AND METHODS
BC incidence rates between 1993 and 2017 were extracted from the Pennsylvania Cancer Registry available through the Enterprise Data Dissemination Informatics Exchange (EDDIE; https://www.health.pa.gov/topics/HealthStatistics/EDDIE/Pages/EDDIE.aspx; referenced 7/3/20). The study was IRB exempt as the data were obtained from the database. No informed consent was obtained as this is available data.
Age-adjusted BC incidence rates were calculated annually for the entire state of Pennsylvania as well as component counties. The Joinpoint Regression Program (Version 4.8.0.1) examined trends of gender, race, and stage. Joinpoint Regression model uses a linear approach that fits incidence rate data for multiple years and allows adjustments for various factors such as age, race and gender while standardizing the incidence rates with the standard population. It therefore allows for a trend analysis and focus on relative percentage changes.
Stage distribution across the cohort was reported according to the SEER Summary Staging system (in situ, local, regional, and distant) as recorded within the PA Cancer Registry. The TNM system is not used within this dataset. The classification was based on the stage of incident cancer at diagnosis as opposed to disease progression from earlier stage disease. The GeoDa spatial statistical package created Chloropleth maps plotting incidence rates across time and counties. Localization to counties was based upon zip code of patients as opposed to sites where treatment was rendered. Rates were tailored towards local area means using a spatial Empirical Bayes smoothing technique. Empirical Bayes Smoothing uses the population in a region as a measure of the confidence in the data, with higher populations in a given area lending a higher confidence to the estimated number of events in that location. Statistical significance was set at a p value of <0.05.
RESULTS
From 1993 to 2017, a total of 93,476 cases of BC were recorded in the Pennsylvania Cancer Registry. Table 1 illustrates pathologic and demographic data for the cohort. Over 95% of patients were older than 50 years of age, over 90% were white, while approximately 75% were male. Stage distribution included in situ in 42.3%, local in 42.3%, regional in 7.1%, distant in 3.7%, and unstaged in 4.6%.
Table 1
Pathologic and Demographic data for Bladder Cancer from the Pennsylvania Cancer Registry 1993 –2017 (25 years)
| Variables | Number of Cases (Percent) |
| TOTAL CASES | 93476 |
| AGE | |
| 0–49 | 4134 (4.4%) |
| 50+ | 89342 (95.6%) |
| GENDER | |
| Female | 24080 (25.8%) |
| Male | 69396 (74.2%) |
| RACE | |
| White | 88443 (94.6%) |
| Black | 3822 (4.1%) |
| SEER STAGE | |
| In Situ | 39555 (42.3%) |
| Local | 39524 (42.3%) |
| Regional | 6676 (7.1%) |
| Distant | 3414 (3.7%) |
| Unstaged | 4266 (4.6%) |
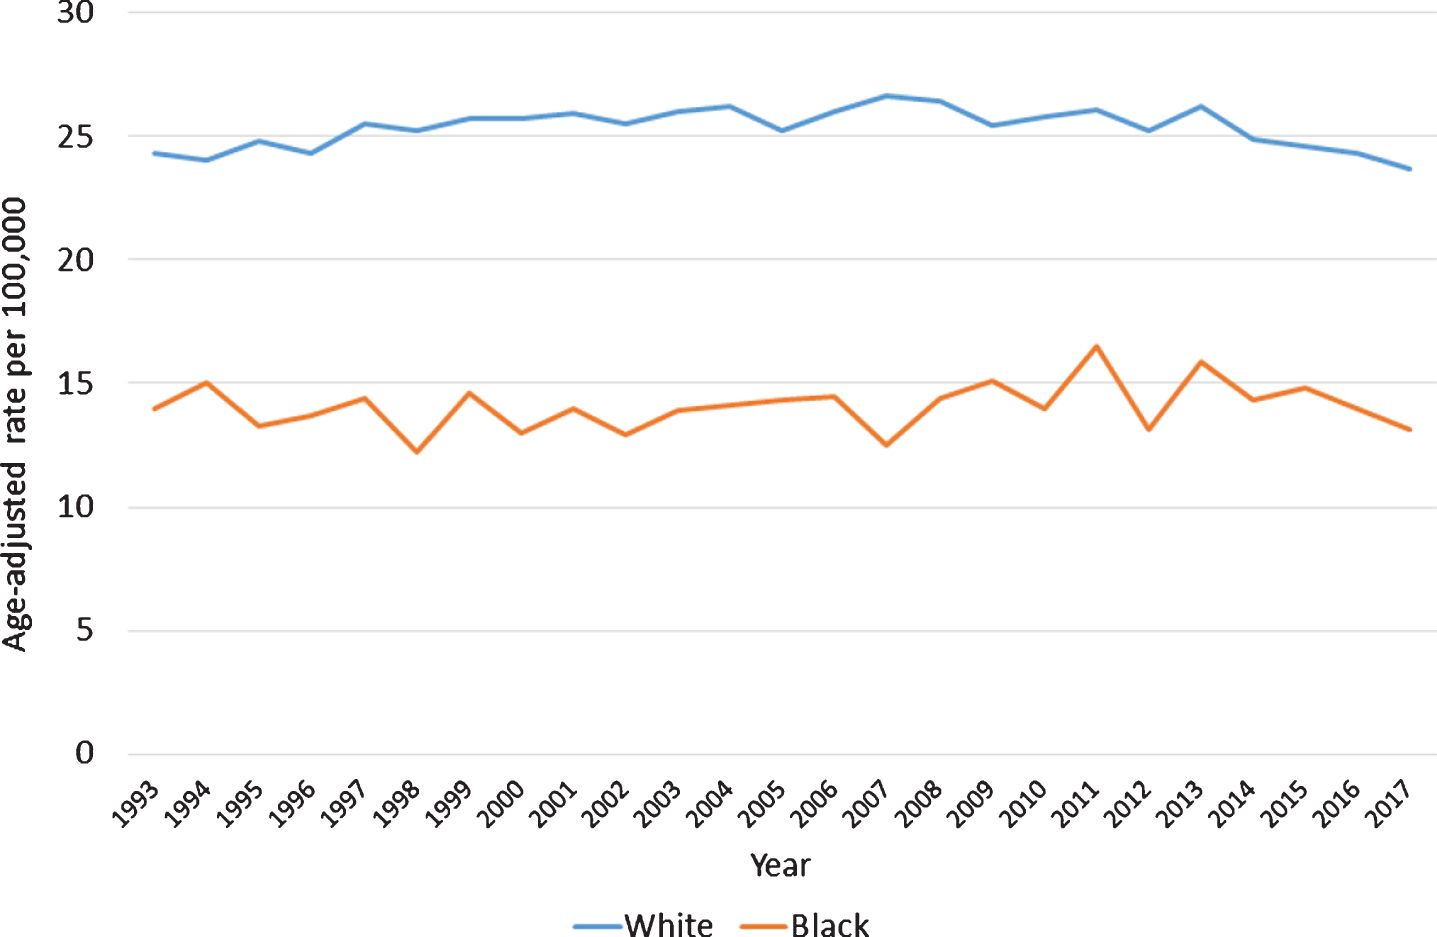
Age-adjusted rates of BC over the study interval were stable at 24.5 patients per 100,000 (range, 22.7–25.6) (Fig. 1). Similarly, when considering gender, overall rates for men (43.4 per 100,000 [range, 39. 6–46.7] and women (11.1 per 100,000 [range 10.1–12.0]) did not demonstrate significant changes between 1993 and 2017 (Fig. 2). A similar observation was noted with different racial groups, with white (25.3 per 100,000 [range, 23.7–26.6]) and black (14.1 per 100,000 [range, 12.2–16.5]) patients showing stable rates over the 25 years of study (Fig. 3).
Fig. 1
Age-Adjusted Rates of Bladder Cancer per 100,000 population, 1993–2017.
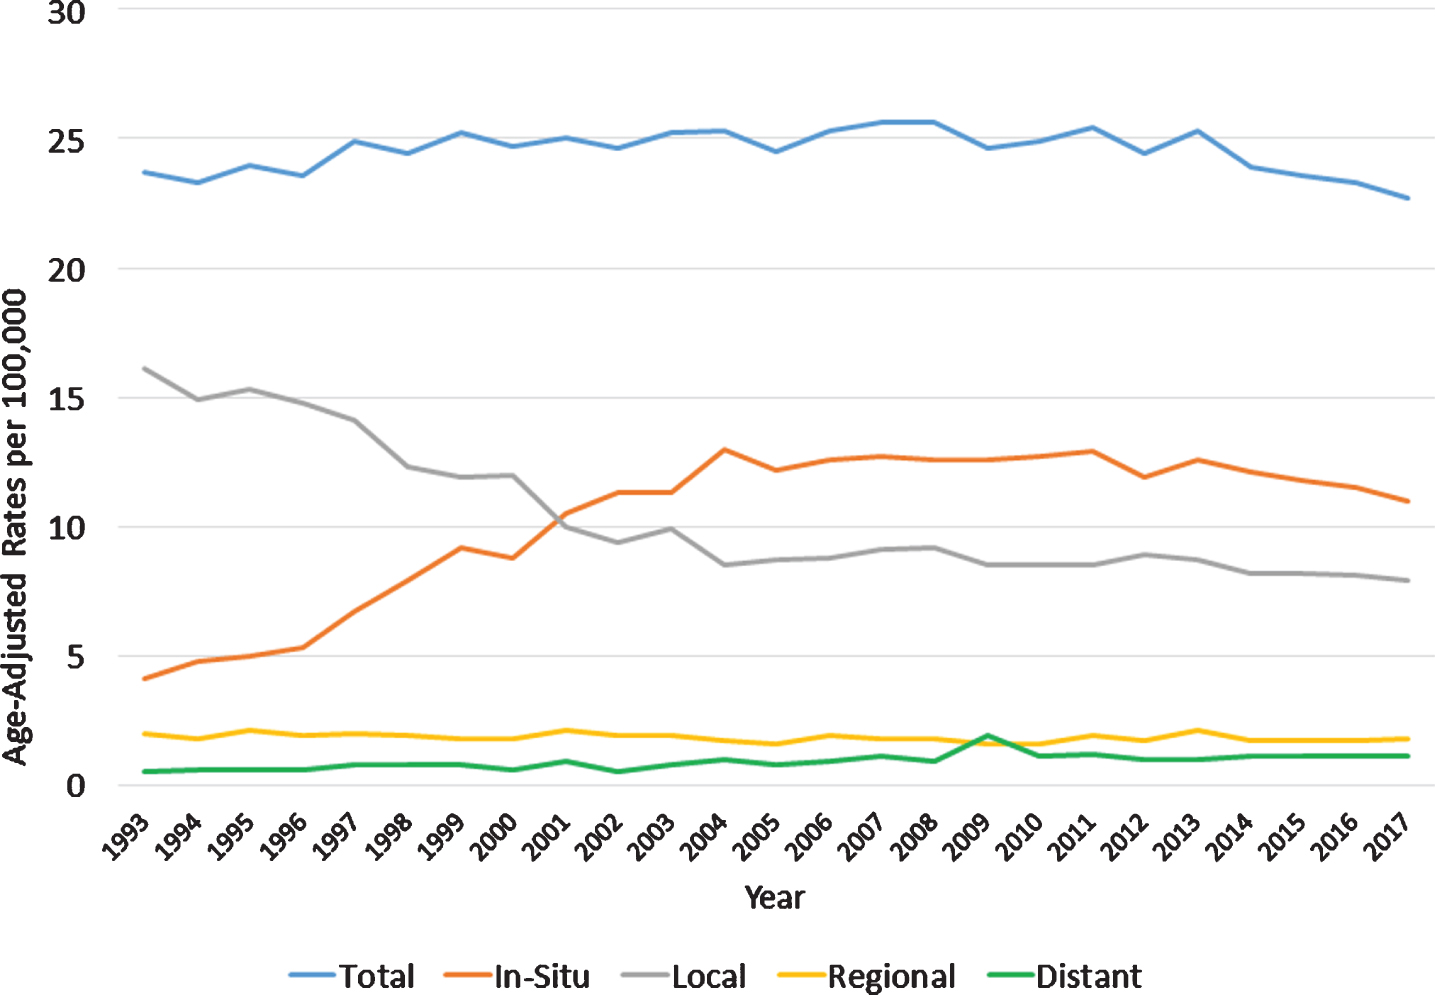
Fig. 2
Age-Adjusted Rates of Bladder Cancer per 100,000 population by gender, 1993–2017.
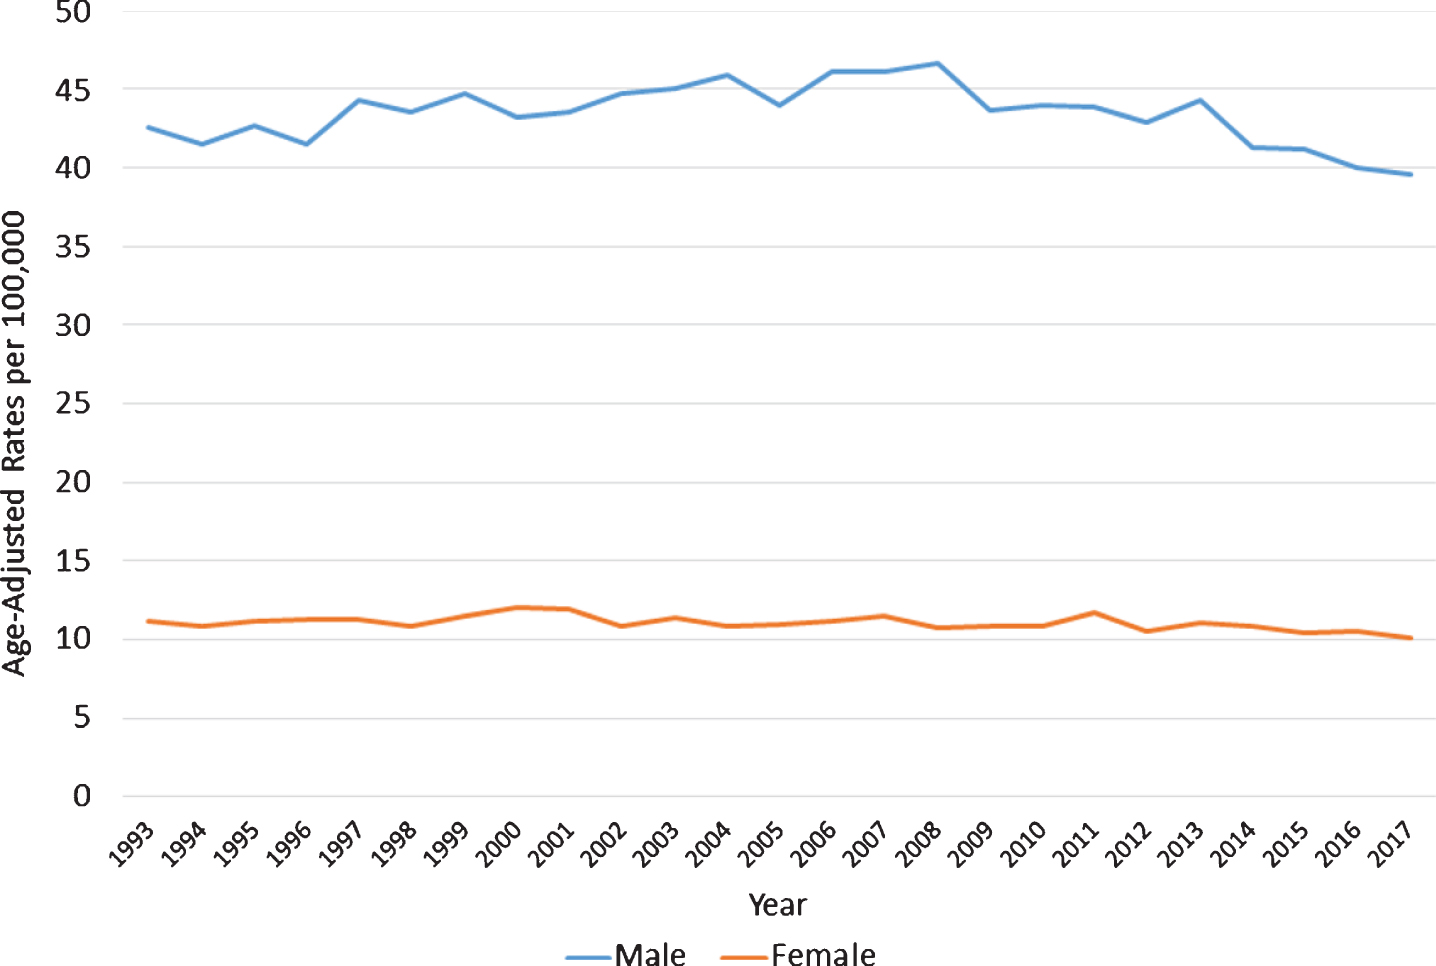
Fig. 3
Age-Adjusted Rates of Bladder Cancer per 100,000 population by race, 1993–2017.
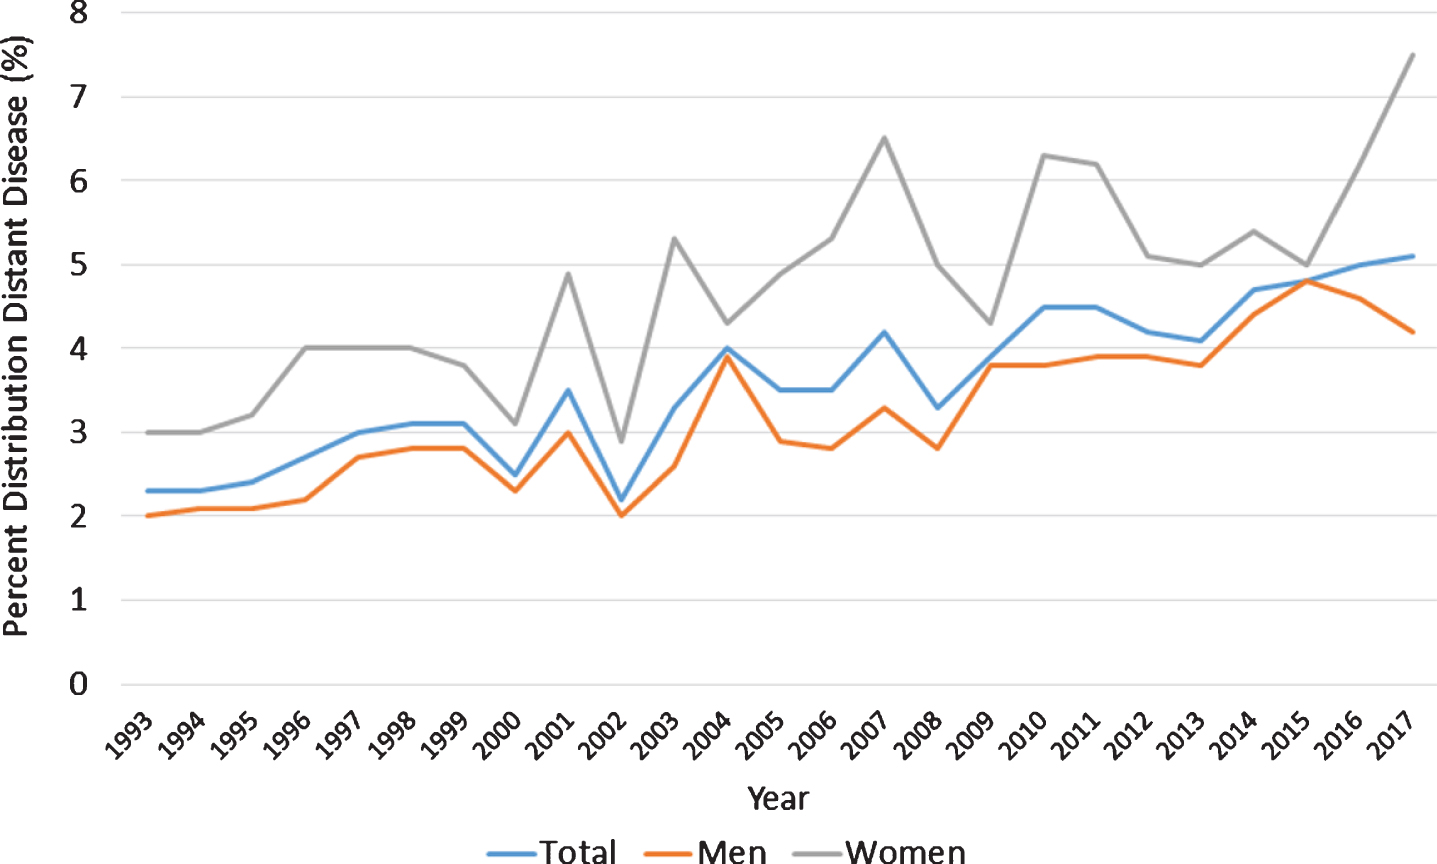
Although the overall age-adjusted rates of bladder cancer remained stable, interesting observations were noted when considering the stage distribution of newly diagnosed bladder cancer. Specifically, a significant increase with respect to in situ (APC 9.5%, p < 0.001) as well as distant disease (APC 6.6%, p < 0.001) over the 25-years was observed and these increases persisted across almost every 5-year interval evaluated (Table 2). Furthermore, the percent distribution of distant disease doubled from 2.3% to 5.1% (p < 0.001) with a greater increase in women than men over this time interval (Fig. 4).
Table 2
Annual Percentage Change in 5-year increments by Stage
| APC (%) 95%CI | Overall 1993–2017 | 1993–1997 | 1998–2002 | 2003–2007 | 2008–2012 | 2013–2017 |
| Total | 0.8 (0.5, 1.2) | 1.8 (1.3, 2.2) | 1.0 (0.7, 1.5) | 0.7 (0.6, 0.8) | 0.6 (0.4, 0.9) | –1.2 (–0.6, –1.9) |
| In Situ | 9.5 (8.4, 10.3) | 13.7 (12.2, 14.4) | 10.6 (9.9, 11.8) | 3.5 (2.9, 3.8) | 0.5 (0.4, 0.8) | –1.9 (–2.7, –1.3) |
| Local | –1.5 (–2.1, –0.8) | –2.4 (–3.3, –1.5) | –5.5 (–4.8, –6.0) | –1.6 (–0.5, –2.2) | 0.9 (0.6, 1.6) | –1.1 (–1.6, –0.8) |
| Regional | 0.5 (0.2, 0.9) | 1.6 (1.2, 1.9) | 1.5 (0.9, 2.1) | 1.0 (0.9, 1.4) | 1.5 (1.0, 2.3) | –2.1 (–2.9, –1.1) |
| Distant | 6.6 (5.5, 8.0) | 9.1 (8.4, 9.9) | –3.1 (–6.4, –1.3) | 7.7 (5.1, 8.8) | 7.2 (6.1, 8.8) | 4.0 (3.1, 5.8) |
Fig. 4
Annual Percent Distribution of Distant Bladder Cancer, 1993–2017.
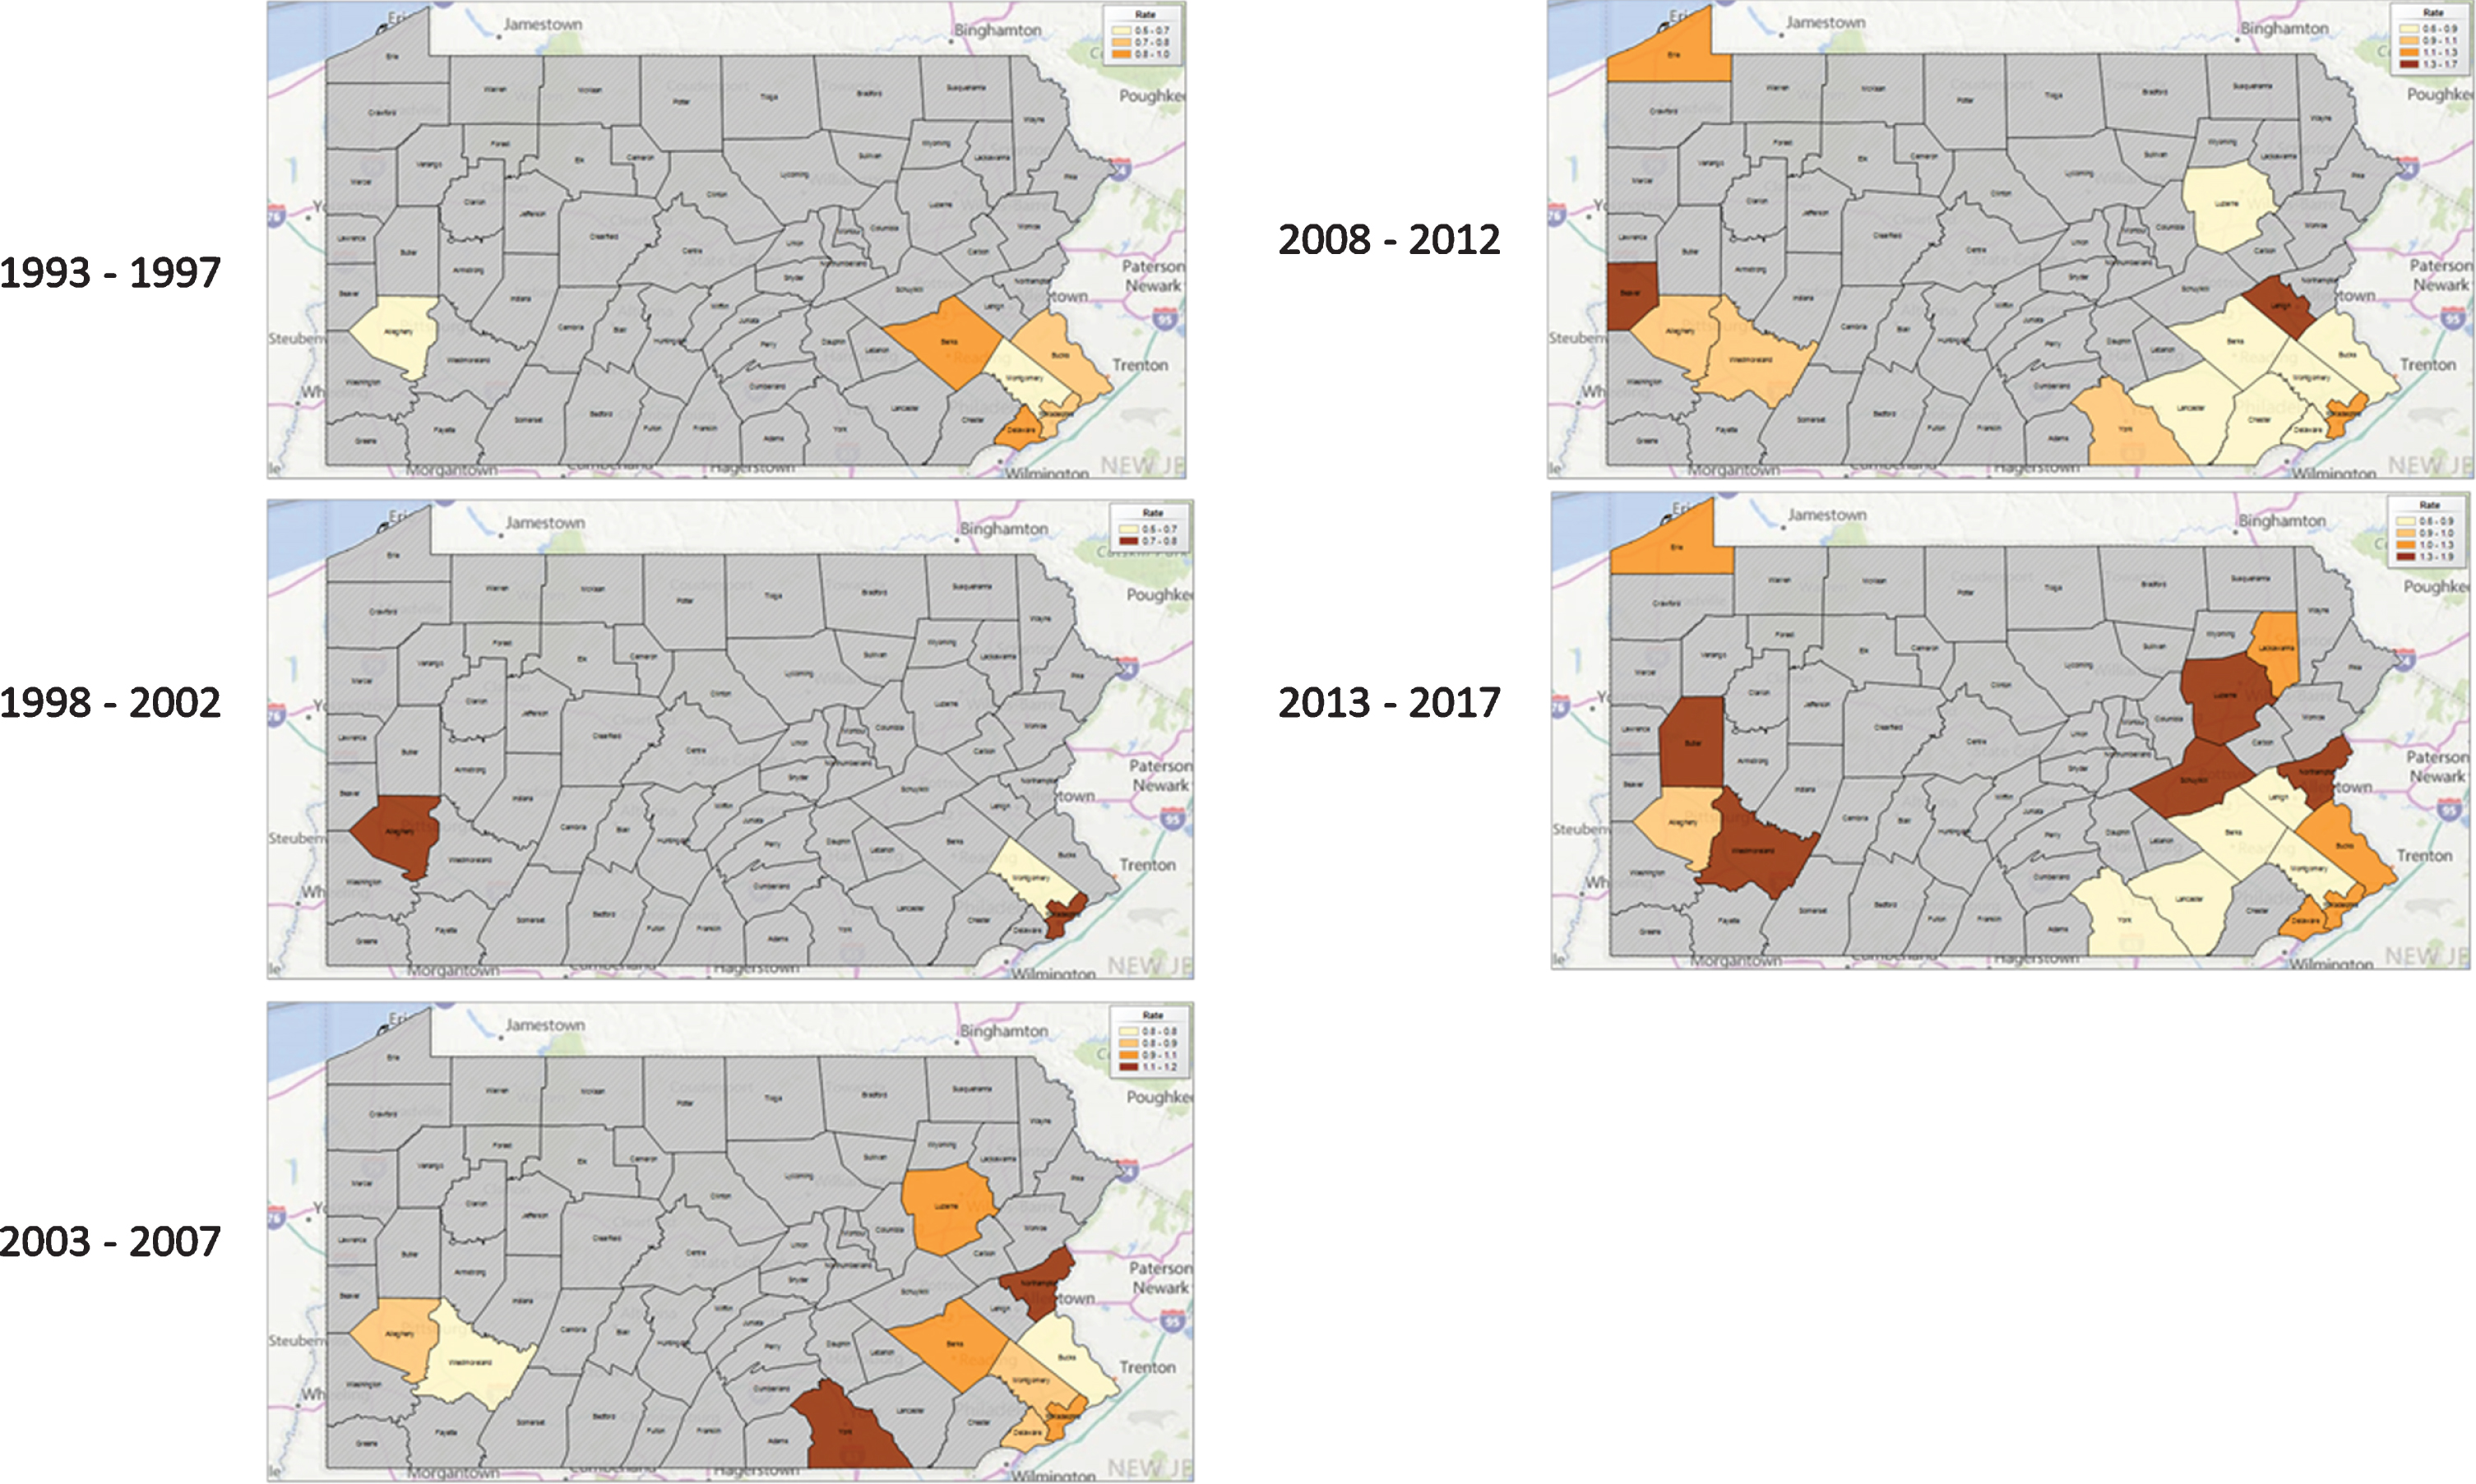
Chloropleth maps highlighted growing “hot spots” of BC incidence in the northwestern, northeastern, and southeastern portions of Pennsylvania (Fig. 5). Subgroup analysis of distant BC cases highlights that these same regions remain “hot spots” for these more aggressive cancers (Fig. 6).
Fig. 5
Age-Adjusted Bladder Cancer Incidence Rates with Spatial Empirical Bayes Smoothing by County in 5-year intervals, 1993–2017.
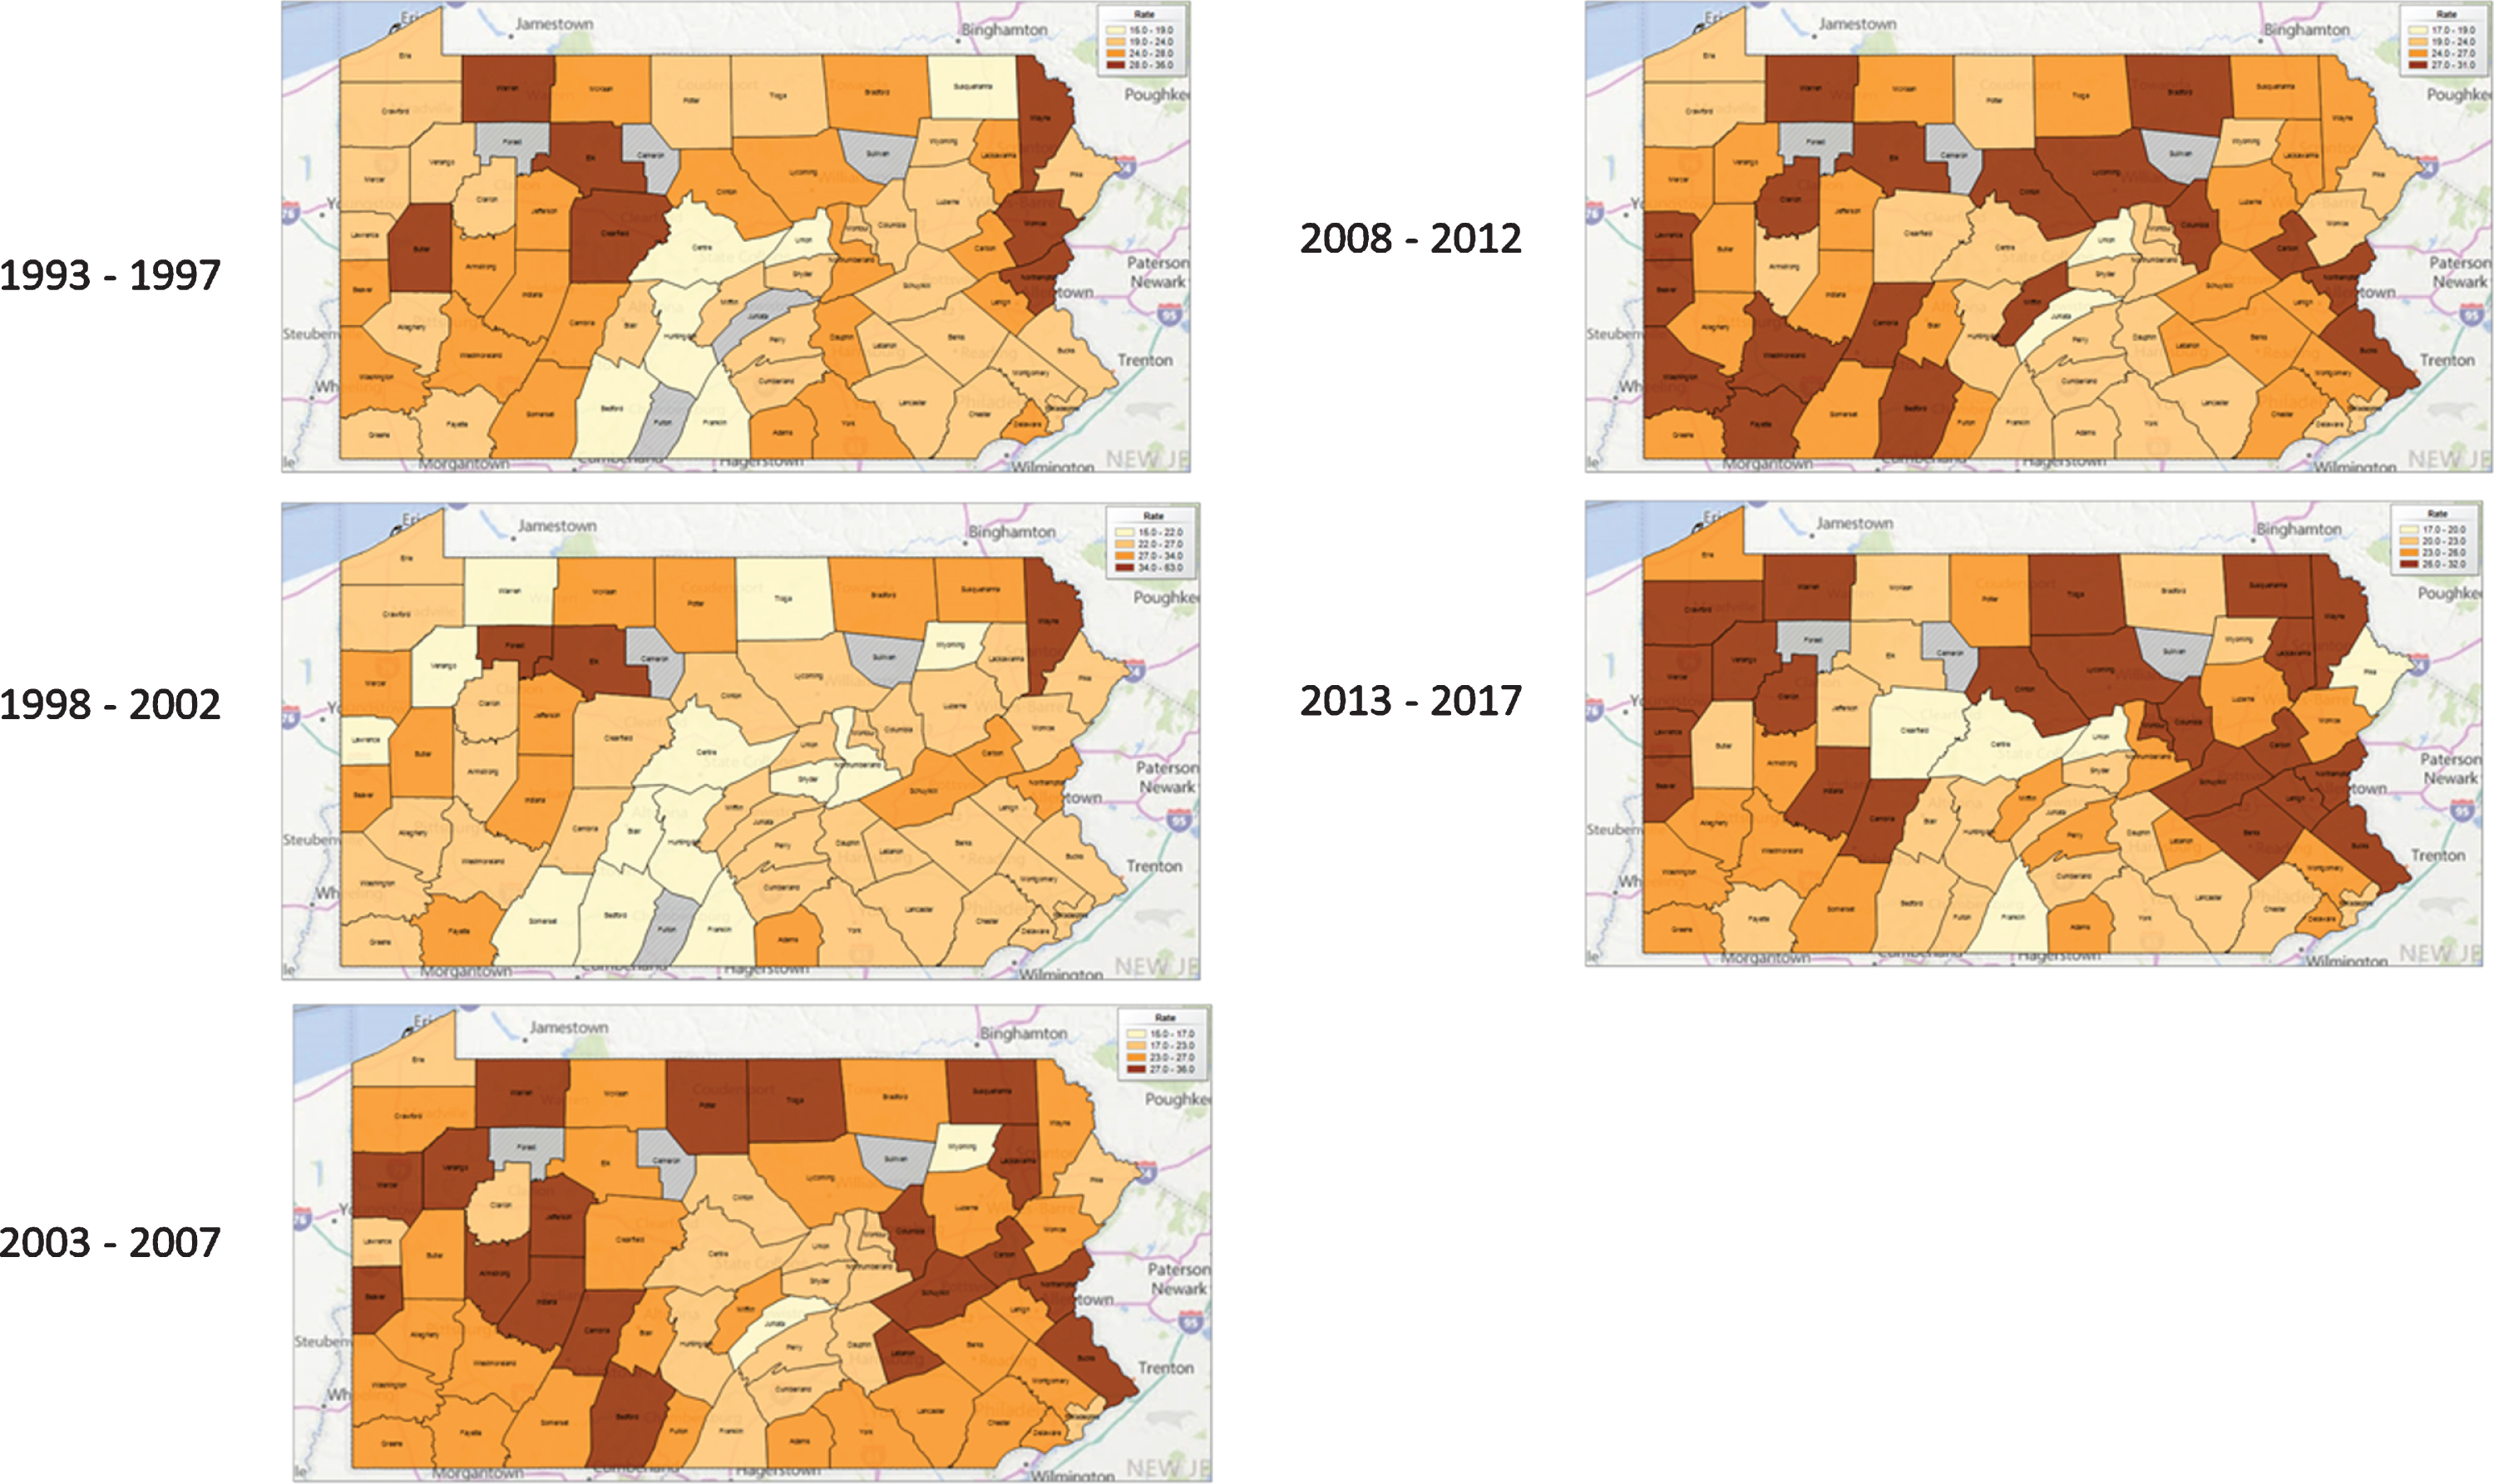
Fig. 6
Age-Adjusted Distant Bladder Cancer Incidence Rates with Spatial Empirical Bayes Smoothing by County in 5-year intervals, 1993–2017.
DISCUSSION
The aim of this study was to review contemporary data from a large statewide cancer registry to evaluate the incidence, trends, and geographic distribution of newly diagnosed bladder cancer. We found that, as with other population studies [12, 13], BC was more prevalent in the older, white, and male populations in Pennsylvania. Additionally, the majority of cases (>80%) were localized disease (in situ/local disease) with an increasing trend to in situ cancers over the time period.
BC incidence in Pennsylvania has remained relatively stable at a rate of 24.5 patients per 100,000 over the past 25 years. While male gender and Caucasian race both had higher rates of incident bladder cancers, the trends when stratified by gender and race did not change over time.
Importantly, we observed a shift in the stage specific, age-, race- and gender adjusted incidence rates of in situ and distant disease in Pennsylvania over the last 25 years. The rate of in situ disease increased steadily at an annual percentage change of 9.5%. For distant BC cases, the annual percentage increase was 6.6% over the last 25 years. These findings from the Pennsylvania Cancer Registry are consistent with other large hospital-based registry study [13] and population based data [12].
Generally, BC is more commonly diagnosed in the older patient population [14] and approximately 75% of BC patients in the PA Cancer Registry were older than 65 years of age. The overall increase in the incidence of in situ BC may be reflective of a variety of factors related to awareness of both health care professionals and patients. Indeed, professional guidelines statements from the American Urologic Association including those on microhematuria and bladder cancer provide standardized and evidence based approaches for diagnosis and treatment of this condition [15, 16].
Of concern, however, is the persistent increase in the incidence of distant bladder cancer diagnosed within the state. Analysis over 25-years noted a 6.6% annual percentage increase in distant disease. Furthermore, the percent distribution of distant cancers doubled over this time interval with women experiencing the most significant change (3% in 1993 to 7.7% in 2017) of newly diagnosed bladder cancers (Figure 4). These gender differences are not entirely surprising and may be explained by prior studies implicating delays in the evaluation of women with hematuria while attributing this symptom to infection or gynecologic causes [17]. The 5-year disease-free survival rate declines with increasing pathological stage. For in situ and localized disease, the survival rate is noted to be greater than 85%. However for distant disease, survival rate historically is poor, although contemporary systemic therapy regimens integrating chemotherapy and immunotherapy have dramatically shifted the landscape of treating such patients [18]. Indeed, focus should not only be on earlier diagnosis but refined therapy for those presenting with advanced stage disease.
The Chloropleth maps show growing hot spots of BC in the northwestern, northeastern, and southeastern portions of Pennsylvania with commiserate increase in distant cancers in these same geographic regions. The classic risk factors for BC are age, male sex and environmental exposure, in particular cigarette smoke [19] and occupational exposure to aromatic amines [20]. On a global level, arsenic exposure in natural food and water was thought to cause an increased incidence of bladder, lung and skin cancer. In the northeast portion of Pennsylvania, the historical high incidence of BC may be attributed to coal-mining exposure. Intensive coal-mining activities, along with natural gas extraction, in regions of the state have been identified as possible sources of surface water contamination [21, 22]. However, the direct relationship between these contaminations and the increased incidence of BC is unclear. The southwestern region, also a growing hotspot for bladder cancer, has traditionally been involved in the steel industry. However, it is unclear at this point whether these trends in BC are attributable to environmental exposures above or other factors including access to care. Further epidemiological studies are needed to better characterize these risk factors to help target diagnosis and treatment of BC cases.
There are several limitations in this study. As with any registry based observational data, there is the possibility of misclassification or unmeasured changes in stage reporting practices over time. There may also be selection bias base of data collection. Furthermore, the lack of standardized and centralized pathologic review precludes a uniform diagnostic assessment of malignancies both of the diagnosis and of the tumor stage. Despite these limitations, this work fills an important gap in the literature regarding the incidence and geographic distribution of UC disease and the regional conditions that may influence its incidence.
CONCLUSION
BC incidence in the state of Pennsylvania has remained relatively stable over the past 25 years. There was, however, a concerning 6% annual percentage increase in distant disease over the study period. Geospatial investigation implicates growing “hot spots” of BC in the certain portions of the state. The underlying cause for these trends requires further investigation.
ACKNOWLEDGMENTS
The Ken and Bonnie Shockey Fund for Urologic Oncology Research at Penn State Health.
FUNDING
The authors report no funding.
AUTHOR CONTRIBUTIONS
JL: drafting of the manuscript, substantial contributions to the conception or design of the work or the acquisition, analysis, or interpretation of data for the work, drafting the work for important intellectual content; YKL: data collection and analysis and manuscript creation; FC: statistical analysis and manuscript creation; GL: statistical analysis and manuscript creation; JDR: oversight of all aspects of project including construction of protocol, data collection and analysis and manuscript creation, substantial contributions to the conception or design of the work or the acquisition, analysis, or interpretation of data for the work, drafting the work and revising it critically for important intellectual content.
CONFLICT OF INTEREST
The authors have no conflicts of interest to disclose.
REFERENCES
[1] | Schulz WA . Understanding urothelial carcinoma through cancer pathways. Int J Cancer. (2006) ;119: (7):1513–8. |
[2] | Siegel RL , Miller KD , Jemal A . Cancer statistics, 2020. CA Cancer J Clin. (2020) ;70: (1):7–30. |
[3] | Saginala K , Barsouk A , Aluru JS , Rawla P , Padala SA . Epidemiology of Bladder Cancer. Med Sci (Basel). (2020) ;8: (1). |
[4] | Substance Abuse and Mental Health Services A, Office of the Surgeon G. Publications and Reports of the Surgeon General. Smoking Cessation: A Report of the Surgeon General. Washington (DC): US Department of Health and Human Services; 2020. |
[5] | Letasiova S , Medve’ova A , Sovcikova A , et al. Bladder cancer, a review of the environmental risk factors. Environ Health. (2012) ;11: Suppl 1:S11. |
[6] | Cumberbatch MGK , Jubber I , Black PC , et al. Epidemiology of Bladder Cancer: A Systematic Review and Contemporary Update of Risk Factors in 2018. Eur Urol. (2018) ;74: :784–95. |
[7] | U.S. Cancer Statistics Working Group. U.S. Cancer Statistics Data Visualizations Tool, based on 2019 submission data (1999–2017): U.S. Department of Health and Human Services, Centers for Disease Control and Prevention and National Cancer Institute; www.cdc.gov/cancer/dataviz, released in June 2020. |
[8] | Riley GF , Potosky AL , Lubitz JD , Kessler LG . Medicare payments from diagnosis to death for elderly cancer patients by stage at diagnosis. Med Car. (1995) ;33: (8):828–41. |
[9] | Avritscher EB , Cooksley CD , Grossman HB , et al. Clinical model of lifetime cost of treating bladder cancer and associated complications. Urology. (2006) ;68: :549–53. |
[10] | Svatek RS , Hollenbeck BK , Holmang S , et al. The economics of bladder cancer: costs and considerations of caring for this disease. Eur Urol. (2014) ;66: :253–62. |
[11] | Mossanen M , Gore JL . The burden of bladder cancer care: direct and indirect costs. Curr Opin Urol. (2014) ;24: :487–91. |
[12] | Nielsen ME , Smith AB , Meyer AM . Trends in stage specific incidence rates for urothelial carcinoma of the bladder in the United States: 1988 to 2006. Cancer. (2014) Jan 1;120: (1):86–95. |
[13] | David KA , Mallin K , Milowsky MI , Ritchey J , Carroll PR , Nanus DM . Surveillance of urothelial carcinoma: stage and grade migration, 1993-2005 and survival trends, 1993–2000. Cancer. 2009 Apr 1;115(7). |
[14] | Prout GR Jr , Wesley MN , Yancik R , Ries LA , Havlik RJ , Edwards BK . Age and comorbidity impact surgical therapy in older bladder carcinoma patients: a population-based study. Cancer. (2005) ;104: :1638–47. |
[15] | Barocas D , Boorjian S , Alvarez R , Downs TM , Gross C , Hamilton B , Kobashi K , Peterson A , Raman J , Smith-Bindman R , Souter L , MICROHEMATURIA: AUA/SUFU GUIDELINE. |
[16] | Chang SS , Boorjian SA , Chou R , Clark PE , Daneshmand S , Konety BR , et al. Diagnosis and Treatment of Non-Muscle Invasive Bladder Cancer: AUA/SUO Guideline. J Urol. (2016) ;196: (4):1021–9. |
[17] | Cohn JA , Vekhter B , Lyttle C , Steinberg GD , Large MC . Sex disparities in diagnosis of bladder cancer after initial presentation with hematuria: a nationwide claims-based investigation. Cancer. (2014) ;120: (4):555–61. |
[18] | Gust KM , Rebhan K , Resch I , Shariat SF , Necchi A . Immune checkpoint inhibition in muscle-invasive and locally advanced bladder cancer. Curr Opin Urol.. (2020) ;30: (4):547–56. |
[19] | Cole P , Monson RR , Haning H , Friedell GH . Smoking and cancer of the lower urinary tract. N Engl J Med. (1971) ;284: (3):129–34. |
[20] | Cole P , Hoover R , Friedell GH . Occupation and cancer of the lower urinary tract. Cancer. (1972) ;29: (5):1250–60. |
[21] | Raymond PA , Oh N-H , Long term changes of chemical weathering products in rivers heavily impacted from acid mine drainage: Insights on the impact of coal mining on regional and global carbon and sulfur budgets. Earth and Planetary Science Letters. (2009) ;284: (1–2):50–6. |
[22] | Niu X , Wendt A , Li Z , et al. Detecting the effects of coal mining, acid rain, and natural gas extraction in Appalachian basin streams in Pennsylvania (USA) through analysis of barium and sulfate concentrations. Environ Geochem Health. (2018) ;40: :865–85. |


