
Bladder Cancer Following Medicaid Expansion: No Changes in the Diagnosis of Muscle-Invasive Disease and Time to Treatment
Abstract
BACKGROUND:
Bladder cancer patients who are insured experience improved outcomes. Medicaid expansion aimed to increase insurance coverage and improve access to care. However, the association between Medicaid expansion and stage at diagnosis or time to treatment for those with advanced bladder cancer is unknown.
OBJECTIVE:
We sought to determine to association of Medicaid expansion with stage at diagnosis, and time to treatment for patients with muscle-invasive bladder cancer.
METHODS:
A US-based cancer registry was utilized to evaluate the association between Medicaid expansion and cancer stage at diagnosis, insurance rates, and time to treatment (>60 days from diagnosis) for those diagnosed with bladder cancer. We compared outcomes in non-Medicare-aged patients in non-expansion states (n = 16,602) and expansion states (n = 15,921) before (years 2012-2013) and after (years 2015-2016) Medicaid expansion with adjusted difference-in-differences (DIDs) using multivariable linear regression.
RESULTS:
The DIDs of percentage of bladder cancer patients with Stage≥II disease (0.02%; 95% confidence interval [CI] –1.91 to 1.95%, p = 0.9), without insurance (–0.65%; 95% CI –1.71 to 0.41), and with metastatic disease at diagnosis (–0.07%; 95% CI –1.14 to 1.00, both p > 0.10) did not change following insurance expansion despite an increase in Medicaid coverage (6.03%; 95% CI 4.79 to 7.29, p < 0.01). Any treatment with either cystectomy, radiation or systemic therapy > 60 days after diagnosis of stage≥II disease did not change (DID 1.48%; 95% CI –3.29 to 6.25%, p = 0.50). On subgroup analysis of patients living in low-income regions, the rates of stage≥II disease, no insurance, metastatic disease, and time to treatment did not significantly change.
CONCLUSION:
Medicaid expansion was not associated with changes in advanced cancer stage at diagnosis or time to treatment in newly diagnosed bladder cancer patients.
INTRODUCTION
Bladder cancer is the sixth most common type of malignancy and will be responsible for an estimated 17,700 deaths in 2019 across the United States [1]. Given the heavy financial burden of managing bladder cancer, insurance coverage has become an increasingly important aspect of coordinating patient care [2, 3]. Unsurprisingly, worse bladder cancer outcomes have been observed in patients without health insurance [4–6]. In an effort to reduce rates of un-insurance, the Affordable Care Act (ACA), passed in 2010, led to Medicaid expansion beginning in 2014 in several states which expanded coverage to individuals with an income up to 138% of the federal poverty line.
As of July 2019, 36 states and the District of Columbia have adopted Medicaid expansion. These changes have increased Medicaid enrollment by 13.1 million [7, 8] and subsequently decreased uninsured rates [9]. Early analyses following these expansions have documented an increase in earlier stage diagnoses of all cancers as a group; however, no significant change has been noted for bladder cancer [9]. Additional work has suggested the rates of surgery for bladder cancer did not change following expansion [10], yet no data has explored advanced disease nor assessed changes in access to timely treatment, an important factor related to outcomes for stage≥II disease [11].
We sought to determine the association between Medicaid expansion and stage at diagnosis of newly diagnosed bladder cancer and time to treatment for stage≥II disease. We queried a large national dataset and compared temporal trends between patients residing in states that did or did not expand Medicaid.
MATERIALS AND METHODS
Study design
This was a large, retrospective cohort study involving data from The National Cancer Database (NCDB). The NCDB is a large, hospital-based registry maintained by the American Cancer Society and the American College of Surgeons, which captures greater than 70% of new cancer diagnoses in the US [12]. The study was exempt from Institutional Review Board approval.
Patients
We examined non-Medicare-aged patients (aged 19–64) from the years of 2012 to 2013 (pre-expansion) and 2015 to 2016 (post-expansion) with a diagnosis of bladder cancer and known insurance status (n = 32,950). We excluded patients for whom data on regional income or education level was unavailable (n = 427, 1.3%). 32,523 patients were included in the final analysis. Information about metastatic disease at diagnosis, stage≥II disease at diagnosis, and time from diagnosis to treatment for stage≥II disease was available for 94.8% (n = 30,848), 92.4% (n = 30,064), and 16.9% (n = 5,485) of the cohort respectively.
Independent variables
The year of diagnosis was the primary exposure of interest. Pre-insurance expansion was defined from the years of 2012-2013 and post-insurance expansion was defined as years of 2015-2016, with 2014 excluded as a washout year to allow for insurance transition. Other covariates of interest included in the adjusted regression model were age, race/ethnicity (Non-Hispanic White, non-Hispanic Black, Hispanic, or other/unknown), Charlson/Deyo comorbidity index (0, 1, >1), geographic location, facility type (community, comprehensive, academic or other), median household income, and education level (rate of high school education attainment) [13]. The American Community Survey data from 2013-2017 was utilized to determine quartiles for income classification with low annual income defined as the lowest quartile or < $40,227, the lowest available category in NCDB for income from 2012-2016 [14].
Outcomes
The primary outcome of interest was percentage of patients diagnosed with stage≥II disease as defined by American Joint Committee on Cancer 8th edition. This stage cutoff was chosen as it is the inflection point of significantly increased cancer-specific mortality [15, 16]. Secondary outcomes included percentage of insured patients with bladder cancer, percentage of patients with metastatic disease at diagnosis, and time to treatment >60 days with cystectomy, radiotherapy or systematic therapy for stage≥II disease, and changes in Medicaid coverage [17].
Subgroup analysis
Given that the low annual income group was most likely to benefit from Medicaid expansion, we assessed the same primary and secondary outcomes for this subgroup. Comparisons of stage and treatment outcomes between low-income and the non-insured were not performed given the two were not mutually exclusive with the proportion of uninsured patients in each income group ranging from 10.4% in the lowest income tier to 3.3% in the highest tier.
Statistical analysis
Comparisons of patient characteristics between the expansion and non-expansion patients were performed using Mann-Whitney U for continuous variables and Chi-squared for the remaining categorical variables.
Given potential external confounders and pre-existing trends affecting insurance coverage, we utilized difference-in-difference (DID) analyses, which have previously been described to investigate insurance expansion outcomes [9, 18]. Unforeseen external factors or trends altering insurance status with time should be addressed with this method as the control group is subject to the same external factors as the exposure group and thus the DID reflects the effect of the exposure. The control group consisted of adults meeting the inclusion criteria that resided in a state without Medicaid expansion, while the intervention group consisted of individuals that resided in states experiencing Medicaid expansion on January 1, 2014. We used multivariable linear regression including all covariates in Table 1 for each outcome of interest with an interaction term to account for the relationship between intervention or control and pre- and post-exposure variables. This interaction coefficient generated the DID of the percentages for each outcome to examine the consequences of exposure status on the control and intervention groups. All statistical tests were performed using Stata 13 (College Station, TX) with two-sided tests and p-value <0.05 considered statistically significant.
Table 1
Patient Characteristics
| Characteristic | Non-expansion, n (%) | Expansion, n (%) | pa |
| Total | 16,602 (100.0) | 15,921 (100.0) | |
| Year | |||
| 2012 | 4,018 (24.2) | 3,947 (24.8) | 0.4 |
| 2013 | 4,098 (24.7) | 3,926 (24.7) | |
| 2015 | 4,290 (25.8) | 4,131 (26.0) | |
| 2016 | 4,196 (25.3) | 3,917 (24.6) | |
| Age, year | |||
| Median (IQR) | 58 (54–62) | 58 (54–62) | 0.6 |
| Sex | |||
| Male | 12,441 (74.9) | 11,893 (74.7) | 0.6 |
| Female | 4,161 (25.1) | 4,028 (25.3) | |
| Race/Ethnicity | |||
| White | 13,624 (82.1) | 13,436 (84.4) | <0.001 |
| Black | 1,566 (9.4) | 1,034 (6.5) | |
| Hispanic | 603 (3.6) | 435 (2.7) | |
| Unknown/other | 809 (4.9) | 1,016 (6.4) | |
| Comorbidities | |||
| 0 | 12,480 (75.2) | 12,239 (76.9) | 0.001 |
| 1 | 2,961 (17.8) | 2,591 (16.3) | |
| >1 | 1,161 (7.0) | 1,091 (6.9) | |
| Geographic Location | |||
| Northeast | 436 (2.6) | 5,481 (34.4) | <0.001 |
| South/Southwest | 3,096 (18.7) | 5,702 (35.8) | |
| Midwest | 10,234 (61.6) | 2,328 (14.6) | |
| West | 2,836 (17.1) | 2,410 (15.1) | |
| Facility Type | |||
| Community | 1,804 (10.9) | 1,828 (11.5) | <0.001 |
| Comprehensive | 7,358 (44.3) | 5,802 (36.4) | |
| Academic | 4,805 (28.9) | 6,596 (41.4) | |
| Other | 2,635 (15.9) | 1,695 (10.7) | |
| Income | |||
| ≤$40,227 | 3,875 (23.3) | 2,373 (14.9) | <0.001 |
| $40,227–50,353 | 4,496 (27.1) | 3,131 (19.7) | |
| $50,354–63,332 | 3,884 (23.4) | 3,696 (23.2) | |
| ≥$63,333 | 4,347 (26.2) | 6,721 (42.2) | |
| Non-high school educated in patient’s zip code | |||
| ≥17.6% | 4,087 (24.6) | 2,573 (16.2) | <0.001 |
| 10.9–17.5% | 4,852 (29.2) | 4,194 (26.3) | |
| 6.3–10.8% | 4,308 (26.0) | 4,709 (29.6) | |
| ≤6.3% | 3,355 (20.2) | 4,445 (27.9) | |
| No insurance | |||
| No | 15,061 (90.7) | 15,298 (96.1) | <0.001 |
| Yes | 1,541 (9.3) | 623 (3.9) | |
| Metastatic disease at diagnosisb | |||
| No | 14,767 (93.7) | 14,178 (94.0) | 0.2 |
| Yes | 999 (6.3) | 904 (6.0) | |
| Stage at diagnosis≥IIb,c | |||
| No | 11,105 (72.8) | 11,319 (76.4) | <0.001 |
| Yes | 4,151 (27.2) | 3,489 (23.6) | |
| For those with stage at diagnosis≥II, treatment >60 days after diagnosisb | |||
| No | 2,125 (71.7) | 1,796 (71.3) | 0.8 |
| Yes | 841 (28.4) | 723 (28.7) | |
aMann-Whitney U analysis was performed to compare median age, rest of categorical variables were compared with Chi-squared. bNot every patient had information on this outcome, see Table 2. cBased on AJCC 8th Edition. Abbreviations: IQR, inter-quartile range.
RESULTS
Patient characteristics
Of the 32,523 patients included for the analysis, 16,602 patients resided in non-expansion states and 15,921 patients resided in expansion states. When compared to patients in non-expansion states, patients in expansion states were more likely to be white (84.4% vs. 82.1%), have lower baseline comorbidities (23.2% vs. 24.8%), be treated at academic facility (41.4% vs. 28.9%), reside in regions of higher income (< $63,333 annual income; 42.2% vs. 26.2%), and live in areas of greater high school attainment (highest quartile of high school educated zip code; 27.9% vs. 20.2%; all p < 0.01). No differences were seen in year of diagnosis, age, or gender when comparing patients residing in expansion vs non-expansion states (Table 1).
Insurance status
Across the period of interest, the percent of patients without insurance was low. A total of 15,061 or 90.7% of patients residing in non-expansion states had insurance coverage compared to 15,298 or 96.1% (p < 0.001) of patients residing in expansion states (Table 1). Rates of no insurance decreased with time for both the control and exposure groups (11.1% to 7.5% in non-expansion states vs. 6% to 1.9% in expansion states; Fig. 1). Relative to non-expansion states, expansion states saw a decrease in uninsured rates of 0.65%, although this was not statistically significant (95% CI –1.71% to 0.41%, p = 0.23; Table 2). There was an increase in Medicaid coverage (6.03% DID, 95% CI 4.79 to 7.29, p < 0.001) post-expansion. On subgroup analysis of patients living in regions of low-income, the DID was also not significant (–2.28% DID, 95% CI –5.34 to 0.79, p = 0.146; Table 3). Again, Medicaid coverage also increased in this subgroup (8.5% DID, 95% CI 4.41 to 11.70, p < 0.001).
Fig.1
Temporal Trends in Outcomes Pre- and Post-Medicaid Expansion. Vertical line denotes pre- and post-insurance expansion. Error bars denote 95% confidence intervals. Treatment delay analysis included only stage≥II cancer.
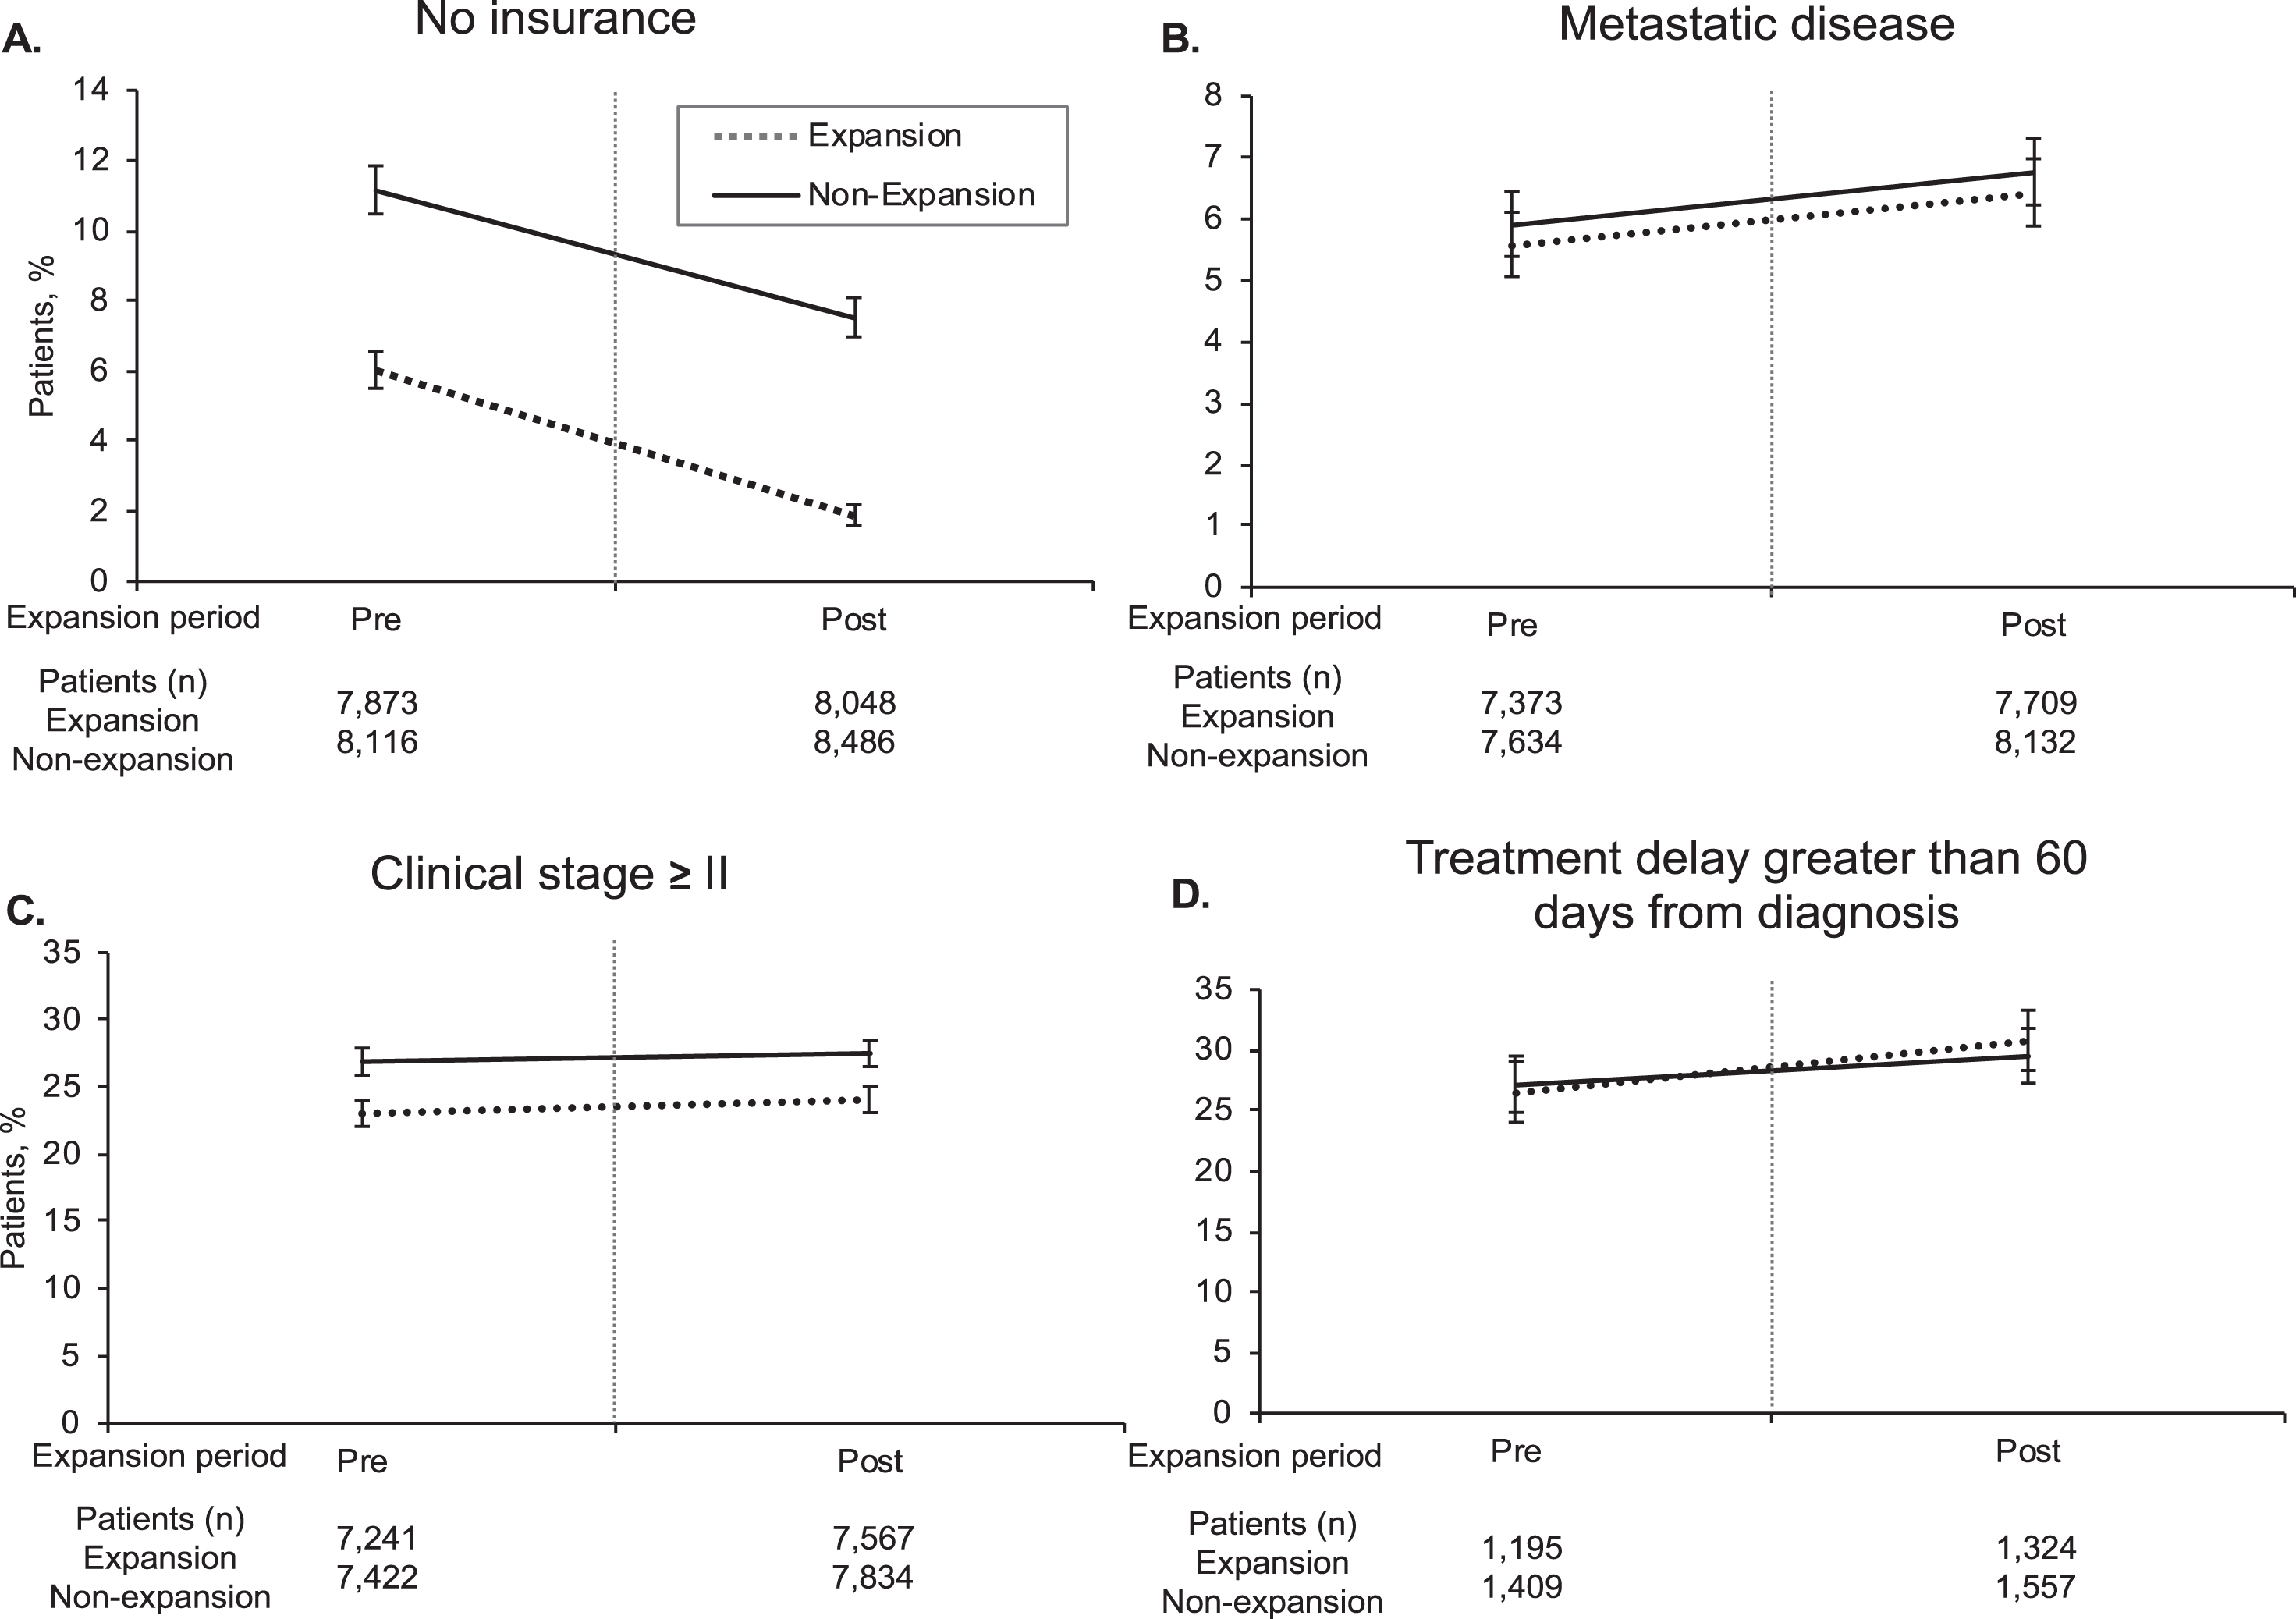
Table 2
Adjusted Difference-in-Difference Analysis Pre- and Post-Expansion for Patients Diagnosed with Bladder Cancer
| Outcome | DID, % (95% CI) | p | n |
| No Insurance | –0.65 (–1.71 to 0.41) | 0.229 | 32523 |
| Metastatic Disease | –0.07 (–1.14 to 1.00) | 0.897 | 30848 |
| Stage≥II | 0.02 (–1.91 to 1.95) | 0.985 | 30064 |
| Treatment >60 days after diagnosis | 1.48 (–3.29 to 6.25) | 0.543 | 5485 |
| Medicaid coverage | 6.03 (4.79 to 7.29) | <0.001 | 32523 |
Difference-in-differences were calculated using multivariable linear regression that included an interaction term between pre- and post-expansion and whether or not a patient lived in an expansion or non-expansion state. All covariates from Table 1 starting from year of diagnosis to high school educational attainment were included in the regression model. Abbreviation: DID, difference-in-differences.
Table 3
Adjusted Difference-in-Difference Analysis Pre- and Post-Expansion for Low-Income Patients Diagnosed with Bladder Cancera
| Outcome | DID, % (95% CI) | ||
| No Insurance | –2.28 (–5.34 to 0.79) | 0.146 | 6248 |
| Metastatic Disease | –0.98 (–3.75 to 1.78) | 0.485 | 5860 |
| Stage≥II | –0.36 (–5.23 to 4.52) | 0.886 | 5727 |
| Treatment >60 days after diagnosis | 7.97 (–3.08 to 19.01) | 0.157 | 1225 |
| Medicaid Coverage | 8.5 (4.41 to 11.70) | <0.001 | 6248 |
Difference-in-differences were calculated using multivariable linear regression that included an interaction term between pre- and post-expansion and whether or not a patient lived in an expansion or non-expansion state. All covariates from Table 1 starting from year of diagnosis to high school educational attainment were included in the regression model. aLow-income was defined as a median household income of ≤$40,227 a year, the lowest quartile used by the American Community Survey in 2016.
Stage at diagnosis and time to treatment
There were fewer patients diagnosed with stage≥II in patients residing in expansion states compared to non-expansion states (23.6% vs. 27.2%, p < 0.01) with no difference in presentation of metastatic disease at diagnosis (6% vs. 6.3%, p = 0.2; Table 1). Delayed treatment time (>60 days after diagnosis) for stage≥II cancer was also not different between the expansion and non-expansion groups (28.7% vs. 28.4%, p = 0.8; Table 1). On adjusted analysis, there was no significant difference in rates of stage≥II diagnosis (0.02%; 95% CI –1.91 to 1.95, p = 0.985), rates of metastatic disease at diagnosis (–0.07%; 95% CI –1.14 to 1, p = 0.897), or treatment time >60 days after diagnosis amongst the two groups (1.48%; 95% CI –3.29 to 6.25, p = 0.543) (Table 2). On subgroup analysis of the low-income cohort, there were also no significant DIDs for rates of stage≥II disease at diagnosis, rates of metastatic disease at diagnosis or treatment time >60 days after diagnosis (–0.36%; 95% CI –5.23 to 4.52; –0.98%; 95% CI –3.75 to 1.78; 7.97%; 95% CI –3.08 to 19.01, all p > 0.05) respectively (Table 3).
DISCUSSION
The high financial burden of bladder cancer may explain why lack of insurance coverage has been linked with worse oncologic outcomes [2–6]. The ACA led to Medicaid expansion in 2014, which expanded coverage for select individuals in 36 states and the District of Columbia [7, 9]. Despite an increase in Medicaid coverage, we found no change in earlier stage≥II diagnosis. Moreover, there was no difference in the overall, no insurance rates of patients diagnosed with bladder cancer residing in expansion states relative to non-expansion states, rates of metastatic disease on presentation, and time to treatment >60 days.
Delays in the diagnosis of bladder cancer is a predictor of increased risk of mortality independent of tumor characteristics [19]. Recent studies have shown that Medicaid expansion has increased access to screening, rates of overall cancer detection and earlier-stage diagnoses in some cancers, particularly those with clear screening guidelines (e.g. colorectal, breast, cervical) [6, 9, 20, 21]. Contrary to these findings, we did not find an increase in stage≥II diagnoses following Medicaid expansion, regardless of income status. This may be attributable to the higher prevalence of bladder cancer in elderly patients precluding them from Medicaid eligibility and our analyses [22]. There were only 30,064 patients with stage information that met our inclusion criteria and this number may not have been robust enough to detect a significant difference. Our findings of no increase in overall insurance coverage despite Medicaid expansion in this population, may also explain the comparable stage≥II diagnosis rates following expansion. The similar rates of metastatic disease on presentation pre- and post-expansion on DID analysis is also not surprising given no increase in earlier diagnosis with insurance expansion. We did not evaluate changes in stage and treatment between the uninsured group vs. low-income as the two were not mutually exclusive, thus it is difficult to interpret differences between these two groups. Furthermore, the limited number of non-insured patients with stage information (<2000) diminishes any strong conclusions between the two groups.
Eguia and colleagues using the Healthcare Cost and Utilization Project (HCUP) and State Inpatient Database (SID) found that uninsured rates were 3.8% in expansion states and 8.9% in non-expansion states, similar to our findings [10]. The higher rates of Medicaid coverage in the expansion group found in that study suggests that expansion resulted in increased rates of Medicaid coverage which mirrors our findings. While there was a significant difference favoring lower rates of no insurance in the expansion cohort in our analysis, this difference was not seen when DID was calculated. This discrepancy between no change in no insurance rates despite an increase in Medicaid coverage post-expansion in this cohort suggests these patients are transitioning from one form of insurance to Medicaid rather than converting from no insurance to Medicaid. A recent analysis of self-reported reasons for non-insurance in cancer survivors revealed an alarming 2.65 increased odds ratio of not having insurance coverage despite Medicaid expansion amongst smokers [23]. Given the well-established link between smoking and bladder cancer, it may explain why we did not find an increase in overall insurance coverage due to Medicaid expansion on a population level, although further investigation in this area is warranted [24].
In addition to delay in diagnosis, delayed time to definitive treatment has also been correlated with worse survival for stage II and higher bladder cancer [11, 25]. A recent, systematic review reiterated that delays from diagnosis to treatment of >12 weeks are associated with increased risk of death [26]. We found no difference in time to local or systemic treatment (>60 days from diagnosis) following Medicaid expansion for stage II or higher disease. The stability seen in uninsured rates in the years following expansion likely explains this observation. A study evaluating the impact of Medicaid expansion for cancer surgery, which likewise found no significant difference in rates of surgery for bladder cancer, lends credence to our findings pertaining to time to treatment [10].
Our results must be interpreted in the context of the several limitations of this study. First, the total number of patients included in the analysis may be too low to detect statistical significance. This is an inherent problem in investigating this question given that the median age of bladder cancer is in the 70s, which lies in the range of Medicare eligibility [22, 27]. An analysis of over 2.4 million patients to evaluate cancer diagnosis stage following Medicaid expansion found that patients with bladder cancer comprised less than 1% of patients studied [9]. Second, this is a retrospective, NCDB study, which has inherent limitations with selection bias. NCDB data comes from accredited Commission on Cancer hospitals, which may not reflect the general US population [28]. Moreover, on our low-income subgroup analysis, the lowest NCDB income category (≤$40,227), may include patients ineligible for Medicaid; however, an increase in Medicaid coverage was still noted in this subgroup. A third limitation of this study is the relatively short follow-up after insurance expansion (2015-2016). The effects of this policy change may take more time to manifest and longer follow-up is needed. Finally, our selected endpoints serve as surrogate makers of quality cancer care, cancer-specific survival and overall survival.
To conclude, our analysis of NCDB data revealed no differences in stage≥II diagnoses, rates of no insurance coverage, rates of metastatic disease on presentation, nor percentage of patients experiencing time to treatment with cystectomy, radiotherapy, or systemic treatment >60 days following Medicaid expansion. Future efforts should focus on exploring what factors are prohibitive to increasing insurance coverage following Medicaid expansion in this population. It would be valuable to understand why the positive effects of Medicaid expansion on the diagnosis and treatment of other cancers are not currently seen for patients with bladder cancer, as well as why uninsured rates did not change. Longer-term follow-up is needed to assess if these outcomes will change with time and wider adoption of Medicaid expansion.
CONCLUSIONS
In a national cohort of Medicaid-eligible patients diagnosed with bladder cancer, there were no differences between patients residing in expansion states vs non-expansion states with regard to stage at diagnosis or time to definitive or systemic treatment following Medicaid expansion for muscle-invasive disease, likely explained by stable no insurance rates. A better understanding of why no insurances rates did not increase with Medicaid expansion is necessary as is longer follow-up and survival outcomes to understand the impact of this legislation on patients with bladder cancer.
ACKNOWLEDGMENTS
The authors have no acknowledgements.
FUNDING
The authors report no funding.
AUTHOR CONTRIBUTIONS
OK: Software, Validation, Formal analysis, Data Curation, Writing – Original Draft, Writing Review & Editing, Visualization, Supervision, Project administration; AW: Conceptualization, Methodology, Software, Formal analysis; AD: Conceptualization, Methodology, Writing – Review & Editing; AV: Writing- Review & Editing, Visualization; JM: Writing – Review & Editing, Visualization; LC: Writing – Review & Editing; SK: Conceptualization, Supervision, Project administration.
CONFLICT OF INTEREST
The authors have no conflicts of interest to report.
REFERENCES
[1] | Howlader N NA , Krapcho M , Miller D , Brest A , Yu M , Ruhl J , Tatalovich Z , Mariotto A , Lewis DR , Chen HS , Feuer EJ , Cronin KA (eds). SEER Cancer Statistics Review, 1975-2016, National Cancer Institute. Bethesda, MD, https://seer.cancer.gov/csr/1975_2016/, based on November SEER data submission, posted to the SEER web site, April 2019. Accessed. |
[2] | Botteman MF , Pashos CL , Redaelli A , Laskin B , Hauser R . The health economics of bladder cancer: a comprehensive review of the published literature. PharmacoEconomics. (2003) ;21: (18):1315–30. |
[3] | Williams SB , Shan Y , Ray-Zack MD , et al. Comparison of Costs of Radical Cystectomy vs Trimodal Therapy for Patients With Localized Muscle-Invasive Bladder Cancer. JAMA Surgery. (2019) :e191629. |
[4] | Niu X , Roche LM , Pawlish KS , Henry KA . Cancer survival disparities by health insurance status. Cancer Medicine. (2013) ;2: (3):403–11. |
[5] | Nazemi A , Ghodoussipour S , Pearce S , Bhanvadia S , Daneshmand S . Socioeconomic and insurance status are independent prognostic indicators of higher disease stage and worse prognosis in bladder cancer. Urologic Oncology. (2019) . |
[6] | Sung JM , Martin JW , Jefferson FA , et al. Racial and Socioeconomic Disparities in Bladder Cancer Survival: Analysis of the California Cancer Registry. Clinical Genitourinary Cancer. (2019) . |
[7] | Medicaid.gov. https://www.medicaid.gov. Accessed 2019 |
[8] | Commission MaCPaA. https://www.macpac.gov/subtopic/medicaid-enrollment-changes-following-the-aca/. Accessed. |
[9] | Han X , Yabroff KR , Ward E , Brawley OW , Jemal A . Comparison of Insurance Status and Diagnosis Stage Among Patients With Newly Diagnosed Cancer Before vs After Implementation of the Patient Protection and Affordable Care Act. JAMA Oncology. (2018) ;4: (12):1713–20. |
[10] | Eguia E , Cobb AN , Kothari AN , et al. Impact of the Affordable Care Act (ACA) Medicaid Expansion on Cancer Admissions and Surgeries. Annals of Surgery. (2018) ;268: (4):584–90. |
[11] | Gore JL , Lai J , Setodji CM , Litwin MS , Saigal CS . Mortality increases when radical cystectomy is delayed more than 12 weeks: results from a Surveillance, Epidemiology, and End Results-Medicare analysis. Cancer. (2009) ;115: (5):988–96. |
[12] | Boffa DJ , Rosen JE , Mallin K , et al. Using the National Cancer Database for Outcomes Research: A Review. JAMA oncology. (2017) ;3: (12):1722–8. |
[13] | Deyo RA , Cherkin DC , Ciol MA . Adapting a clinical comorbidity index for use with ICD-9-CM administrative databases. Journal of Clinical Epidemiology. (1992) ;45: (6):613–9. |
[14] | American Community Survey United States Census Bureau. https://www.census.gov/programs-surveys/acs. Accessed 2019. |
[15] | Stein JP , Lieskovsky G , Cote R , et al. Radical cystectomy in the treatment of invasive bladder cancer: long-term results in 1,054 patients. Journal of Clinical Oncology: Official Journal of the American Society of Clinical Oncology. (2001) ;19: (3):666–75. |
[16] | Messing EM , Tangen CM , Lerner SP , et al. Effect of Intravesical Instillation of Gemcitabine vs Saline Immediately Following Resection of Suspected Low-Grade Non-Muscle-Invasive Bladder Cancer on Tumor Recurrence: SWOG S0337 Randomized Clinical Trial. Jama. (2018) ;319: (18):1880–8. |
[17] | Amin MB , Greene FL , Edge SB , et al. The Eighth Edition AJCC Cancer Staging Manual: Continuing to build a bridge from a population-based to a more “personalized” approach to cancer staging. CA: A Cancer Journal for Clinicians. (2017) ;67: (2):93–9. |
[18] | Dimick JB , Ryan AM . Methods for evaluating changes in health care policy: the difference-in-differences approach. Jama. (2014) ;312: (22):2401–2. |
[19] | Hollenbeck BK , Dunn RL , Ye Z , et al. Delays in diagnosis and bladder cancer mortality. Cancer. (2010) ;116: (22):5235–42. |
[20] | Choi SK , Adams SA , Eberth JM , et al. Medicaid Coverage Expansion and Implications for Cancer Disparities. Am J Public Health. (2015) ;105 Suppl5: (Suppl 5):S706–S712. |
[21] | Soni A , Simon K , Cawley J , Sabik L . Effect of Medicaid Expansions of 2014 on Overall and Early-Stage Cancer Diagnoses. Am J Public Health. (2018) ;108: (2):216–8. |
[22] | Cancer Stat Facts: Bladder Cancer. NIH NCI: Surveillance E, and End Results Program. 2019 |
[23] | Sanford NN , Lam MB , Butler SS , et al. Self-reported Reasons and Patterns of Noninsurance Among Cancer Survivors Before and After Implementation of the Affordable Care Act, 2000-2017. JAMA Oncology. (2019) :e191973. |
[24] | Freedman ND , Silverman DT , Hollenbeck AR , Schatzkin A , Abnet CC . Association between smoking and risk of bladder cancer among men and women. Jama. (2011) ;306: (7):737–45. |
[25] | Lin-Brande M , Pearce SM , Ashrafi AN , et al. Assessing the Impact of Time to Cystectomy for Variant Histology of Urothelial Bladder Cancer. Urology. (2019) ;133: :157–63. |
[26] | Russell B , Liedberg F , Khan MS , et al. A Systematic Review and Meta-analysis of Delay in Radical Cystectomy and the Effect on Survival in Bladder Cancer Patients. European Urology Oncology. (2019) . |
[27] | HHS.gov. Medicare Eligibility https://www.hhs.gov/answers/medicare-and-medicaid/who-is-elibible-for-medicare/index.html. Accessed 2019. |
[28] | Bilimoria KY , Stewart AK , Winchester DP , Ko CY . The National Cancer Data Base: a powerful initiative to improve cancer care in the United States. Ann Surg Oncol. (2008) ;15: (3):683–90. |


