
Genomic Biomarkers and Underlying Mechanism of Benefit from BCG Immunotherapy in Non-Muscle Invasive Bladder Cancer
Abstract
BACKGROUND:
Optimal therapy for high-risk non-muscle invasive bladder cancer (NMIBC) includes intravesical instillation of Bacillus Calmette-Guérin (BCG). However, about 25-45% of patients do not benefit from BCG immunotherapy, and there is no biomarker to guide therapy. Also, many questions regarding BCG mechanisms of action remain unanswered.
OBJECTIVE:
To identify genomic biomarkers and characterize the underlying mechanism of benefit from BCG in NMIBC.
PATIENTS AND METHODS:
Pre-treatment archival index-tumors of 35 patients with NMIBC treated with BCG were analyzed by whole-exome sequencing (WES). Tumor mutation burden (TMB) and neoantigen load (NAL) were correlated with BCG response rate (RR) and recurrence-free survival (RFS). The presence of deleterious mutations in DNA damage response (DDR) genes was also compared between BCG-responsive (BCG-R, N = 17) and unresponsive (BCG-UR, N = 18) subgroups.
RESULTS:
TMB and NAL were higher in BCG-R compared to BCG-UR patients (median TMB 4.9 vs. 2.8 mutations/Mb, P = 0.017 and median NAL 100 vs. 65 neoantigens, P = 0.032). Improved RR and RFS were observed in patients with high vs. low TMB (RR 71% vs. 28%, P = 0.011 and mRFS 38.0 vs. 15.0 months, P = 0.009) and with high vs. low NAL (RR 71% vs. 28%, P = 0.011 and mRFS 36.0 vs. 18.5 months, P = 0.016). The presence of deleterious mutations in DDR genes was associated with improved RFS (mRFS 35.5 vs. 11.0 months, P = 0.017).
CONCLUSIONS:
In our cohort, improved outcomes after BCG immunotherapy were observed in patients with high TMB, high NAL and deleterious mutations in DDR genes. BCG may induce tumor-specific immune response by enhancing the recognition of neoantigens.
INTRODUCTION
Optimal therapy for high-risk non-muscle invasive bladder cancer (NMIBC) remains complete transurethral resection of the bladder tumor (TURBT) followed by intravesical therapy with Bacillus Calmette-Guérin (BCG) [1]. However, 25–45% of the patients will not benefit from BCG immunotherapy and, despite optimal management, as many as 40% of patients recur and approximately 20% may present with disease progression to muscle invasive bladder cancer (MIBC) [2]. Moreover, the global production of BCG has been significantly affected, leading to BCG shortages in several countries and a substantial increase in treatment cost [3]. To date, there is no validated predictive biomarker to guide patient selection for BCG immunotherapy [4]. The identification of predictive biomarkers is critical to maximize clinical use in patients more likely to benefit from therapy and potentially reduce the risk of BCG supply shortages.
Although BCG immunotherapy has been used to treat NMIBC for more than 40 years, its mechanisms of action are not yet completely understood. BCG acts through the induction of a local and systemic inflammatory response. However, it is not clear if the antitumor effect is mediated by the recognition of tumor antigens and the induction of a tumor-specific immune response or by a global intravesical inflammatory response with a side effect antitumor activity [5, 6]. A deeper understanding of the mechanisms behind BCG antitumor activity is a first step to improve efficacy and develop combined therapeutic approaches for NMIBC.
Recently, tumor mutation burden (TMB), neoantigen load (NAL) and the presence of mutations in DNA damage response (DDR) genes have been identified as promising biomarkers of benefit from immunotherapy with immune-checkpoint inhibitors in several malignancies, including urothelial carcinoma [7–11]. As of today, only two studies investigated the association between TMB and benefit from BCG immunotherapy. In both studies, TMB was estimated using targeted-sequencing of comprehensive cancer-gene panels (CCGP) and they were unable to identify a significant association between TMB assessed in pre-treatment specimens and tumor recurrence and progression after BCG immunotherapy [12, 13]. So far, no study investigated the association between NAL, the presence of mutations in DDR genes and benefit from BCG immunotherapy.
We hypothesize that BCG may act by enhancing the recognition of tumor antigens and sought to investigate the association between TMB, NAL and the presence of mutations in DDR genes with improved outcomes after BCG immunotherapy.
PATIENTS AND METHODS
Patient and biological samples
From a database of 418 patients with NMIBC consecutively treated with BCG (Moreau strain [14]) at the Instituto do Câncer do Estado de São Paulo (ICESP) from 2009 to 2016, we retrospectively identified 83 patients with NMIBC treated with TURBT, repeat TUR and intravesical BCG immunotherapy (≥6 instillations). The main reason for exclusion was the unavailability of pre-BCG archived samples or patient who did not undergo re-TUR prior to BCG. Of the 83 patients initially selected, high-quality DNA (low fragmentation and chemical modification levels) for successful WES was only possible in 35 (42%), which was the final number of patients included in this study.
Patients were followed at ICESP according to institutional guidelines with clinical visits every 3-6 months and cystoscopy and urine cytology usually every 6 months during the first 3 years and yearly afterward. On cystoscopic examinations, random bladder biopsies were not routinely indicated, unless in patients with positive cytology. Suspicious areas or papillary lesions suspected for disease recurrence were biopsied or resected according to standard urologic guidelines. Patients were classified as BCG-responsive and BCG-unresponsive based on the International Bladder Cancer Group criteria [15]. BCG responsive included patients with histologic disappearance of malignancy on bladder biopsy and normal cytology and cystoscopy on follow-up. BCG unresponsive included patients with recurrence or progression during therapy, classified as BCG relapsing (recurrence of high-grade disease after achieving a disease-free state at 6 months after adequate BCG - within 6 months of last BCG exposure) or BCG refractory (a persistent high-grade disease at 6 months despite adequate BCG treatment - at least five of six induction instillations and at least one maintenance in 6 months - including any stage or grade progression by 3 months after the first BCG cycle).
Informed consent was obtained from all subjects, and the study was approved by the Institutional Review Board (Protocol #852/15). Formalin-fixed paraffin-embedded sections of treatment-naive index tumors were used for genomic DNA extraction. A genitourinary pathologist reviewed representative hematoxylin and eosin slides to confirm grade, stage, and urothelial histology. To enrich for tumor purity macrodissection of tumor regions was performed whenever necessary before DNA extraction. Tumor sections were required to contain at least 60% tumor cell nuclei with less than 20% necrosis for inclusion in the study.
Whole-exome sequencing
Genomic DNA from tumor samples was extracted using GeneRead DNA FFPE kit (Qiagen), containing Uracyl-D Glycosylase, according to the manufacturer’s instructions. DNA concentration was determined using dsDNA BR Assay Kit (Thermo Fisher Scientific) in a Qubit fluorometer. Whole-exome libraries were prepared using SureSelect XT Clinical Research Exome Target Enrichment kit (Agilent Technologies # 5190-7338). Briefly, 200 ng of genomic DNA was sheared into 100-300 bp fragments using a Covaris S2 sonicator (Covaris Inc). The ends of the DNA fragments were enzymatically repaired and adenylated at the 3’ end before sequencing adaptor ligation. DNA fragments were then PCR amplified for 10 cycles. Library concentration was determined using a Qubit fluorometer, and fragment size distribution was checked using the DNA 1000 Bioanalyzer assay (Agilent). DNA fragments were then hybridized to capture baits and selected using streptavidin beads. Captured fragments were PCR amplified for 12 cycles. Library concentration was determined using a Qubit fluorometer, and fragment size distribution was checked using the DNA 1000 Bioanalyzer assay (Agilent). Sequences (150bp paired-end) were generated on a NextSeq 500 sequencing platform (Illumina). WES data have been deposited at European Nucleotide Archive (ENA) under the accession number PRJEB31851.
Mutational analysis, TMB and DDR mutations
Sequences were aligned to the human reference genome (GRCh38/hg38) using BWA (v.0.7.9) [16]. We excluded low mapping quality reads (Q < 30) using SAMtools (v.1.6) [17] and marked potential PCR duplicates with Picard (v.1.114) MarkDuplicates tool (https://broadinstitute.github.io/picard). Sequencing metrics (coverage and depth) were determined using SAMtools and Perl scripts (www.perl.org.br). Base quality score recalibration was performed using GATK’s (v.3.7) BaseRecalibrator and PrintReads using dbSNP (v.146) and 1000 Genome gold standard indels provided by GATK’s resource bundle [18]. Genetic variations were identified using GATK’s HaplotypeCaller following GATK’s recommendation for joint genotyping analysis [19]. We filtered out low-quality variants using the two steps Variant Quality Score Recalibration (VQSR) procedure. Variant score was adjusted with GATK’s VariantRecalibrator and ApplyRecalibration methods with appropriated training datasets as recommended by GATK. Passing filter variants were then annotated with Annovar [20], using cancer-related, functional and populational allele frequency annotations available from reference databases such as COSMIC (Catalogue of Somatic Mutations in Cancer V.70) [21], ExAC (Exome Sequence Aggregation Consortium) [22] and 1000 Genomes Project Phase3 v.5 [23].
Since we did not sequence matched-normal samples, we used populational allele frequencies of known SNVs and the COSMIC mutation frequency information to filter putative germline variants. All variants that were present in ExAC and 1000 Genomes databases were filtered, except if the variant was cataloged in COSMIC and detected in more than 3 tumor samples from any tumor type. From the variants present in COSMIC in more than 3 tumor samples, we excluded those present in ExAC and 1000 Genomes databases with populational allele frequencies greater than 0.005. After careful manual inspection, we also excluded recurrent variants that were not present in ExAC, but were reported in two or more samples in our cohort, except for those located in the FGFR3 gene, which are catalogued in COSMIC and frequently observed in NMIBC. Finally, we excluded all variants located outside exonic or donor/acceptor splice-site regions, as well as those exhibiting mutant allele frequencies (MAFs) bellow 20% and present in genomic sites covered by less than 30 reads.
Genes with a significant excess of non-synonymous mutations relative to the estimated density of background mutations were identified using MutSig2.0 [24]. We performed a systematic decomposition of mutational signatures (COSMIC mutational signatures) using Mutalisk [25]. The decomposition of mutational signatures was performed using the Maximum Likelihood Estimation method. We used the linear regression model and all the COSMIC Mutational Signatures (v3 from May 2019). The result is composed with a compilation of the best decomposition models, ranked based on Bayesian information criterion to discourage overfitting
We estimated tumor mutation burden (TMB) by dividing the total number of somatic mutations (synonymous and non-synonymous point mutations, splice-site mutations and indels) by the size of the whole-exome target region in Megabases (Mb). High TMB was defined as equal or above the median TMB of the cohort (3 mutations/Mb for WES analysis and 4.4 mutations/Mb for MSK-IMPACT analysis) as described by Rizvi at al [26].
For the association analysis between DDR gene mutations, BCG RR, and RFS, we used a list of 34 DDR genes, previously associated with clinical benefit from PD-1/PD-L1 blockade in advanced urothelial cancer [8] and a more comprehensive list of 193 DDR genes known to have a role in all 6 different DNA damage repair pathways [27]. A list of 167 chromatin-modifying genes was downloaded from dbEM (http://crdd.osdd.net/raghava/dbem/index.php). dbEM is a database of epigenetic modifiers curated from cancerous and normal genomes [28]. Damaging missense mutations in chromatin-modifying and DDR genes were identified using PolyPhen (v.2) [29] and SIFT (v.6.2.1) [30]. Missense mutations were considered as damaging missense mutations only if they were classified as “Deleterious” by SIFT AND “Probably damaging” by PolyPhen HVAR.
HLA typing and neoantigen prediction
Tumor HLA-A, B, and C genes were genotyped using raw reads from fastqs as inputs to Optitype (V.1.3.1) [31]. Peptide sequences flanking somatic mutations were annotated using Variant Effect Predictor (https://www.ensembl.org/info/docs/tools/vep/index.html). For neoantigen prediction, HLA alleles, wild-type, and mutant peptide sequences of every mutation of each tumor sample were used as inputs to pVAC (V.4.0.10) [32]. This algorithm uses NetMHCpan (v.3.0) [33] and NetChop (v.3.1) [34] for each peptide-HLA pair binding affinity and proteasome cleavage sites predictions, following default parameters. Considering missense SNVs, frameshift, and inframe indels, we evaluated all potential neoantigen peptide sequences with sizes of 8, 9 and 10-mers, including the mutated amino acid(s), and the respective wild-type sequence. Only predicted neoantigens with strong HLA-binding affinities (KMT< =500 nM) were selected, and, for mutations with multiple strongly binding epitopes, the one with highest KMT was chosen. NAL was calculated as the absolute number of selected neoantigens per tumor. Tumor high or low neoantigen load classification was based on the median number of predicted neoantigens per sample (median = 78). Pearson correlation was used to determine the association between the number of somatic mutations and the number of predicted neoantigens.
Statistical analysis
The Shapiro-Wilk normality test was used to analyzed data distribution and define the use of appropriate parametric or non-parametric tests. Pearson Chi-Square or Fisher’s exact tests were used to analyzing categorical associations, and the Wald method was used to calculate the odds ratio (OR) and the 95% confidence interval (CI). Mann-Whitney test was used for continuous variables. Binary logistic regression was used to determine the association between genomic alterations and response to BCG immunotherapy. The Hosmer-Lemeshow goodness of fit test was used to validate the binary logistic regression model. The Kaplan-Meier method and Log-rank test were used for estimations of Recurrence Free Survival (RFS). Only 5 progression events were observed in our cohort. Therefore, genomic correlates to progression were not performed. Cox regression was used to determine the association between genomic alterations and recurrence after BCG immunotherapy, and the Wald test was used to calculate the adjusted hazard ratio (HR) and the 95% CI. Validation of the Cox proportional hazards assumptions was assessed with the Schoenfeld test. DDR status, TMB and NAL were not entered simultaneously in multivariable models because of the collinearity between DDR status, TMBand NAL. We were unable to carry out stratified analysis using TMB, NAL and DDR status due to the small size of our cohort. Co-variables that achieved a level of significance ≤ 0.1 were entered into multivariate analysis. All tests were two-sided and a p-value of ≤0.05 (type I “alpha” error probability ≤ 5%) considered statistically significant. For statistical power calculation, we considered the association between TMB (as a continuous variable) and response rate to BCG as an endpoint. The observed difference in TMB between BCG-R and BCG-UR patients was 2.1 mutations/Mb, with a ponderal standard deviation of 1.375 mutations/Mb. Considering our sample size of 35 patients, we then calculated the statistical power of our analysis as 0.992. For this calculation, we considered an approximation for normal distribution in the comparison of independent samples, with an alpha-risk> =0.0.5 for error type I and beta-risk< =0.2 for error type II. All analyses were conducted using R (v. 3.5.0), with the support of the following packages: gmodels (v.2.18.1), epitools (v.0.5.10), ResourceSelection (v.0.3.4), forestmodel (v.0.5.0), survminer (v.0.4.3), survival (v.2.43.3), survcomp (v.1.32.0).
RESULTS
Patient cohort
We retrospectively identified 35 patients with NMIBC treated with BCG immunotherapy from 2009 to 2016. The majority of patients was male (91%), former smoker (60%), and presented with high-risk NMIBC (91%), high-grade urothelial carcinoma (86%) and/or T1 staging (71%) (Table 1). Lymphovascular invasion was identified in only one patient (3%) of this cohort. Patients were classified as BCG-R (48.6%) and BCG-UR (51.4%) based on the International Bladder Cancer Group criteria [15]. Within the BCG-UR group, 5 patients (27.8%) were classified as BCG refractory, and 13 patients (72.2%) were BCG relapsing. The median (range) number of BCG instillations was 15 (8-34) in the entire cohort, 14 (8-24) in the BCG-R group, and 15.5 (8-34) in the BCG-UR group. Median follow-up was 46.0 months for BCG-R and 52.0 months for BCG-UR patients. The median time for recurrence and progression in the BCG-UR group was 10.5 and 19.0 months, respectively. None of the clinicopathologic characteristics of these 35 patients, except for age at diagnosis, was associated with benefit from BCG immunotherapy (Tables 1–3).
Table 1
Clinicopathologic characteristics of patients treated with BCG
| BCG-R | BCG-UR | Total | p-value | |
| N=17 | N=18 | N=35 | ||
| Median age (range) | 75 (54-80) | 63 (42-84) | 64 (42-84) | 0.014 |
| Sex | ||||
| Male | 15 (88%) | 17 (97%) | 32 (91%) | 0.603 |
| Female | 2 (12%) | 1(6%) | 3 (9%) | |
| Smoking | ||||
| Never | 5 (29%) | 0 (0%) | 5 (14%) | 0.050 |
| Former | 10 (59%) | 11 (61%) | 21 (60%) | |
| Current | 1 (6%) | 3 (17%) | 4 (12%) | |
| Unknown | 1 (6%) | 4 (22%) | 5 (14%) | |
| Initial symptom | ||||
| Incidental | 4 (24%) | 3 (16%) | 7 (20%) | 0.562 |
| Hematuria | 13 (76%) | 14 (78%) | 27 (77%) | |
| Dysuria | 0 (0%) | 1 (6%) | 1 (3%) | |
| Stage | ||||
| Ta | 5 (29%) | 5 (28%) | 10 (29%) | 1.0 |
| T1 | 12 (71%) | 13 (72%) | 25 (71%) | |
| Grade | ||||
| Low | 1 (6%) | 4 (22%) | 5 (14%) | 0.338 |
| High | 16 (94%) | 14 (78%) | 30 (86%) | |
| Concomitant CIS | ||||
| Yes | 1 (6%) | 2 (11%) | 3 (9%) | 1.0 |
| No | 16 (94%) | 16 (89%) | 32 (91%) | |
| Histology | ||||
| Pure urothelial carcinoma | 15 (88%) | 16 (88%) | 31 (88%) | 0.512 |
| UC with squamous differentiation | 2 (12%) | 1 (6%) | 3 (9%) | |
| UC micropapillary | 0 (0%) | 1 (6%) | 1 (3%) | |
| Number of tumors | ||||
| 1 | 7 (41%) | 3 (17%) | 10 (29%) | 0.156 |
| 2 | 4 (24%) | 3 (17%) | 7 (20%) | |
| ≥3 | 6 (35%) | 12 (66%) | 18 (51%) | |
| Tumor size (cm) | ||||
| <3 cm | 7 (41%) | 5 (28%) | 12 (34%) | 0.404 |
| ≥3 cm | 10 (59%) | 13 (72%) | 23 (66%) | |
| Treatment (BCG) | ||||
| Induction only | 3 (18%) | 1 (6%) | 4 (11%) | 1.0 |
| Induction+maintenance | 14 (82%) | 17 (94%) | 31 (89%) |
Table 2
Univariate and multivariate analyses of response rate according to relevant clinical and molecular characteristics
| Variable | Univariate Analysis | Multivariate Analysis TMB* | Multivariate Analysis NAL* | ||||||
| OR | 95% CI | p-value | OR | 95% CI | p-value | OR | 95% CI | p-value | |
| Age (<75 vs.> =75) | 5.62 | 1.18 –26.85 | 0.024 | 4.50 | 0.84 –24.01 | 0.078 | 5.97 | 1.05 –33.89 | 0.044 |
| Gender (female vs. male) | 0.44 | 0.04 –5.37 | 0.603 | NA | NA | NA | NA | NA | NA |
| Grade (low vs. high) | 4.57 | 0.46 –45.86 | 0.338 | NA | NA | NA | NA | NA | NA |
| No. tumors (single vs. multiple) | 0.29 | 0.06 –1.38 | 0.146 | NA | NA | NA | NA | NA | NA |
| Tumor Size (<3 vs.> =3) | 0.55 | 0.13 –2.26 | 0.404 | NA | NA | NA | NA | NA | NA |
| Tumor Stage (Ta vs. T1) | 0.92 | 0.21 –4.00 | 1 | NA | NA | NA | NA | NA | NA |
| Concomitant CIS (no vs. yes) | 0.50 | 0.04 –6.08 | 1 | NA | NA | NA | NA | NA | NA |
| Histological type (pure vs. others) | 1.07 | 0.13 –8.56 | 1 | NA | NA | NA | NA | NA | NA |
| TMB (low vs. high) | 6.24 | 1.44 –27.06 | 0.011 | 5.20 | 1.11 –24.34 | 0.036 | NA | NA | NA |
| NAL (low vs. high) | 6.24 | 1.44 –27.06 | 0.011 | NA | NA | NA | 6.57 | 1.32 –32.67 | 0.021 |
| DDR (wt vs. mut) | 3.73 | 0.79 –17.68 | 0.088 | NA | NA | NA | NA | NA | NA |
*TMB, NAL and DDR status were not entered simultaneously in multivariable models because of the collinearity between these variables. Other co-variables that achieved a level of significance ≤ 0.1 in univariate analysis were entered into multivariate analysis. OR = odds ratio, CI = confidence interval, CIS = carcinoma in situ, TMB = tumor mutation burden, NAL = neoantigen load, DDR = DNA damage response, wt = wild type, mut = mutated, NA = not analyzed.
Table 3
Univariate and multivariate analyses of recurrence-free survival according to relevant clinical and molecular characteristics
| Variable | Univariate Analysis | Multivariate Analysis TMB* | Multivariate Analysis NAL* | Multivariate Analysis DDR* | ||||||||
| HR | 95% CI | p-value | HR | 95% CI | p-value | HR | 95% CI | p-value | HR | 95% CI | p-value | |
| Age (<75 vs.> =75) | 0.24 | 0.07 –0.84 | 0.016 | 0.24 | 0.07 –0.92 | 0.037 | 0.22 | 0.06 –0.80 | 0.022 | 0.20 | 0.05 –0.72 | 0.014 |
| Gender (female vs. male) | 1.78 | 0.24 –13.39 | 0.565 | NA | NA | NA | NA | NA | NA | NA | NA | NA |
| Grade (low vs. high) | 0.44 | 0.14 –1.35 | 0.141 | NA | NA | NA | NA | NA | NA | NA | NA | NA |
| No. tumors (single vs. multiple) | 2.22 | 0.64 –7.70 | 0.191 | NA | NA | NA | NA | NA | NA | NA | NA | NA |
| Tumor Size (<3 vs.> =3) | 1.64 | 0.58 –4.61 | 0.354 | NA | NA | NA | NA | NA | NA | NA | NA | NA |
| Tumor Stage (Ta vs. T1) | 1.12 | 0.40 –3.15 | 0.817 | NA | NA | NA | NA | NA | NA | NA | NA | NA |
| Concomitant CIS (no vs. yes) | 2.68 | 0.61 –11.86 | 0.186 | NA | NA | NA | NA | NA | NA | NA | NA | NA |
| Histological type (pure vs. others) | 1.46 | 0.33 –6.46 | 0.632 | NA | NA | NA | NA | NA | NA | NA | NA | NA |
| TMB (low vs. high) | 0.27 | 0.09 –0.77 | 0.009 | 0.28 | 0.10 –0.82 | 0.021 | NA | NA | NA | NA | NA | NA |
| NAL (low vs. high) | 0.30 | 0.11 –0.85 | 0.016 | NA | NA | NA | 0.28 | 0.10 –0.81 | 0.019 | NA | NA | NA |
| DDR (wt vs. mut) | 0.33 | 0.13 –0.86 | 0.017 | NA | NA | NA | NA | NA | NA | 0.27 | 0.10 –0.72 | 0.009 |
* TMB, NAL and DDR status were not entered simultaneously in multivariable models because of the collinearity between these variables. Other co-variables that achieved a level of significance ≤ 0.1 in univariate analysis were entered into multivariate analysis. HR = hazard ratio, CI = confidence interval, CIS = carcinoma in situ, TMB = tumor mutation burden, NAL = neoantigen load, DDR = DNA damage response, wt = wild type, mut = mutated, NA = not analyzed.
Mutational landscape of NMIBC
To characterize the mutational landscape of BCG-treated NMIBC, we sequenced 35 treatment-naive index tumors (median coverage 158 X with 97.4% of target bases sequenced to at least 30 X depth). WES identified 11,482 somatic mutations (11,025 point mutations and 457 indels), with a median of 151 ([IQR] 132-285) point mutations and 8 ([IQR] 6-11) indels per tumor (Fig. 1 and Table S1).
Fig. 1
Mutational landscape of high-grade NMIBC. Top to the bottom: tumor mutation burden; somatic mutation pattern of frequently mutated genes (>8%) in 35 NMIBC samples; patient classification according to BCG benefit - responsive (BCG-R - blue) and unresponsive (BCG-UR - red); patient classification according to DDR status –wild-type (blue) and mutated (red); patient classification according to TMB status –high (blue) and low (red).
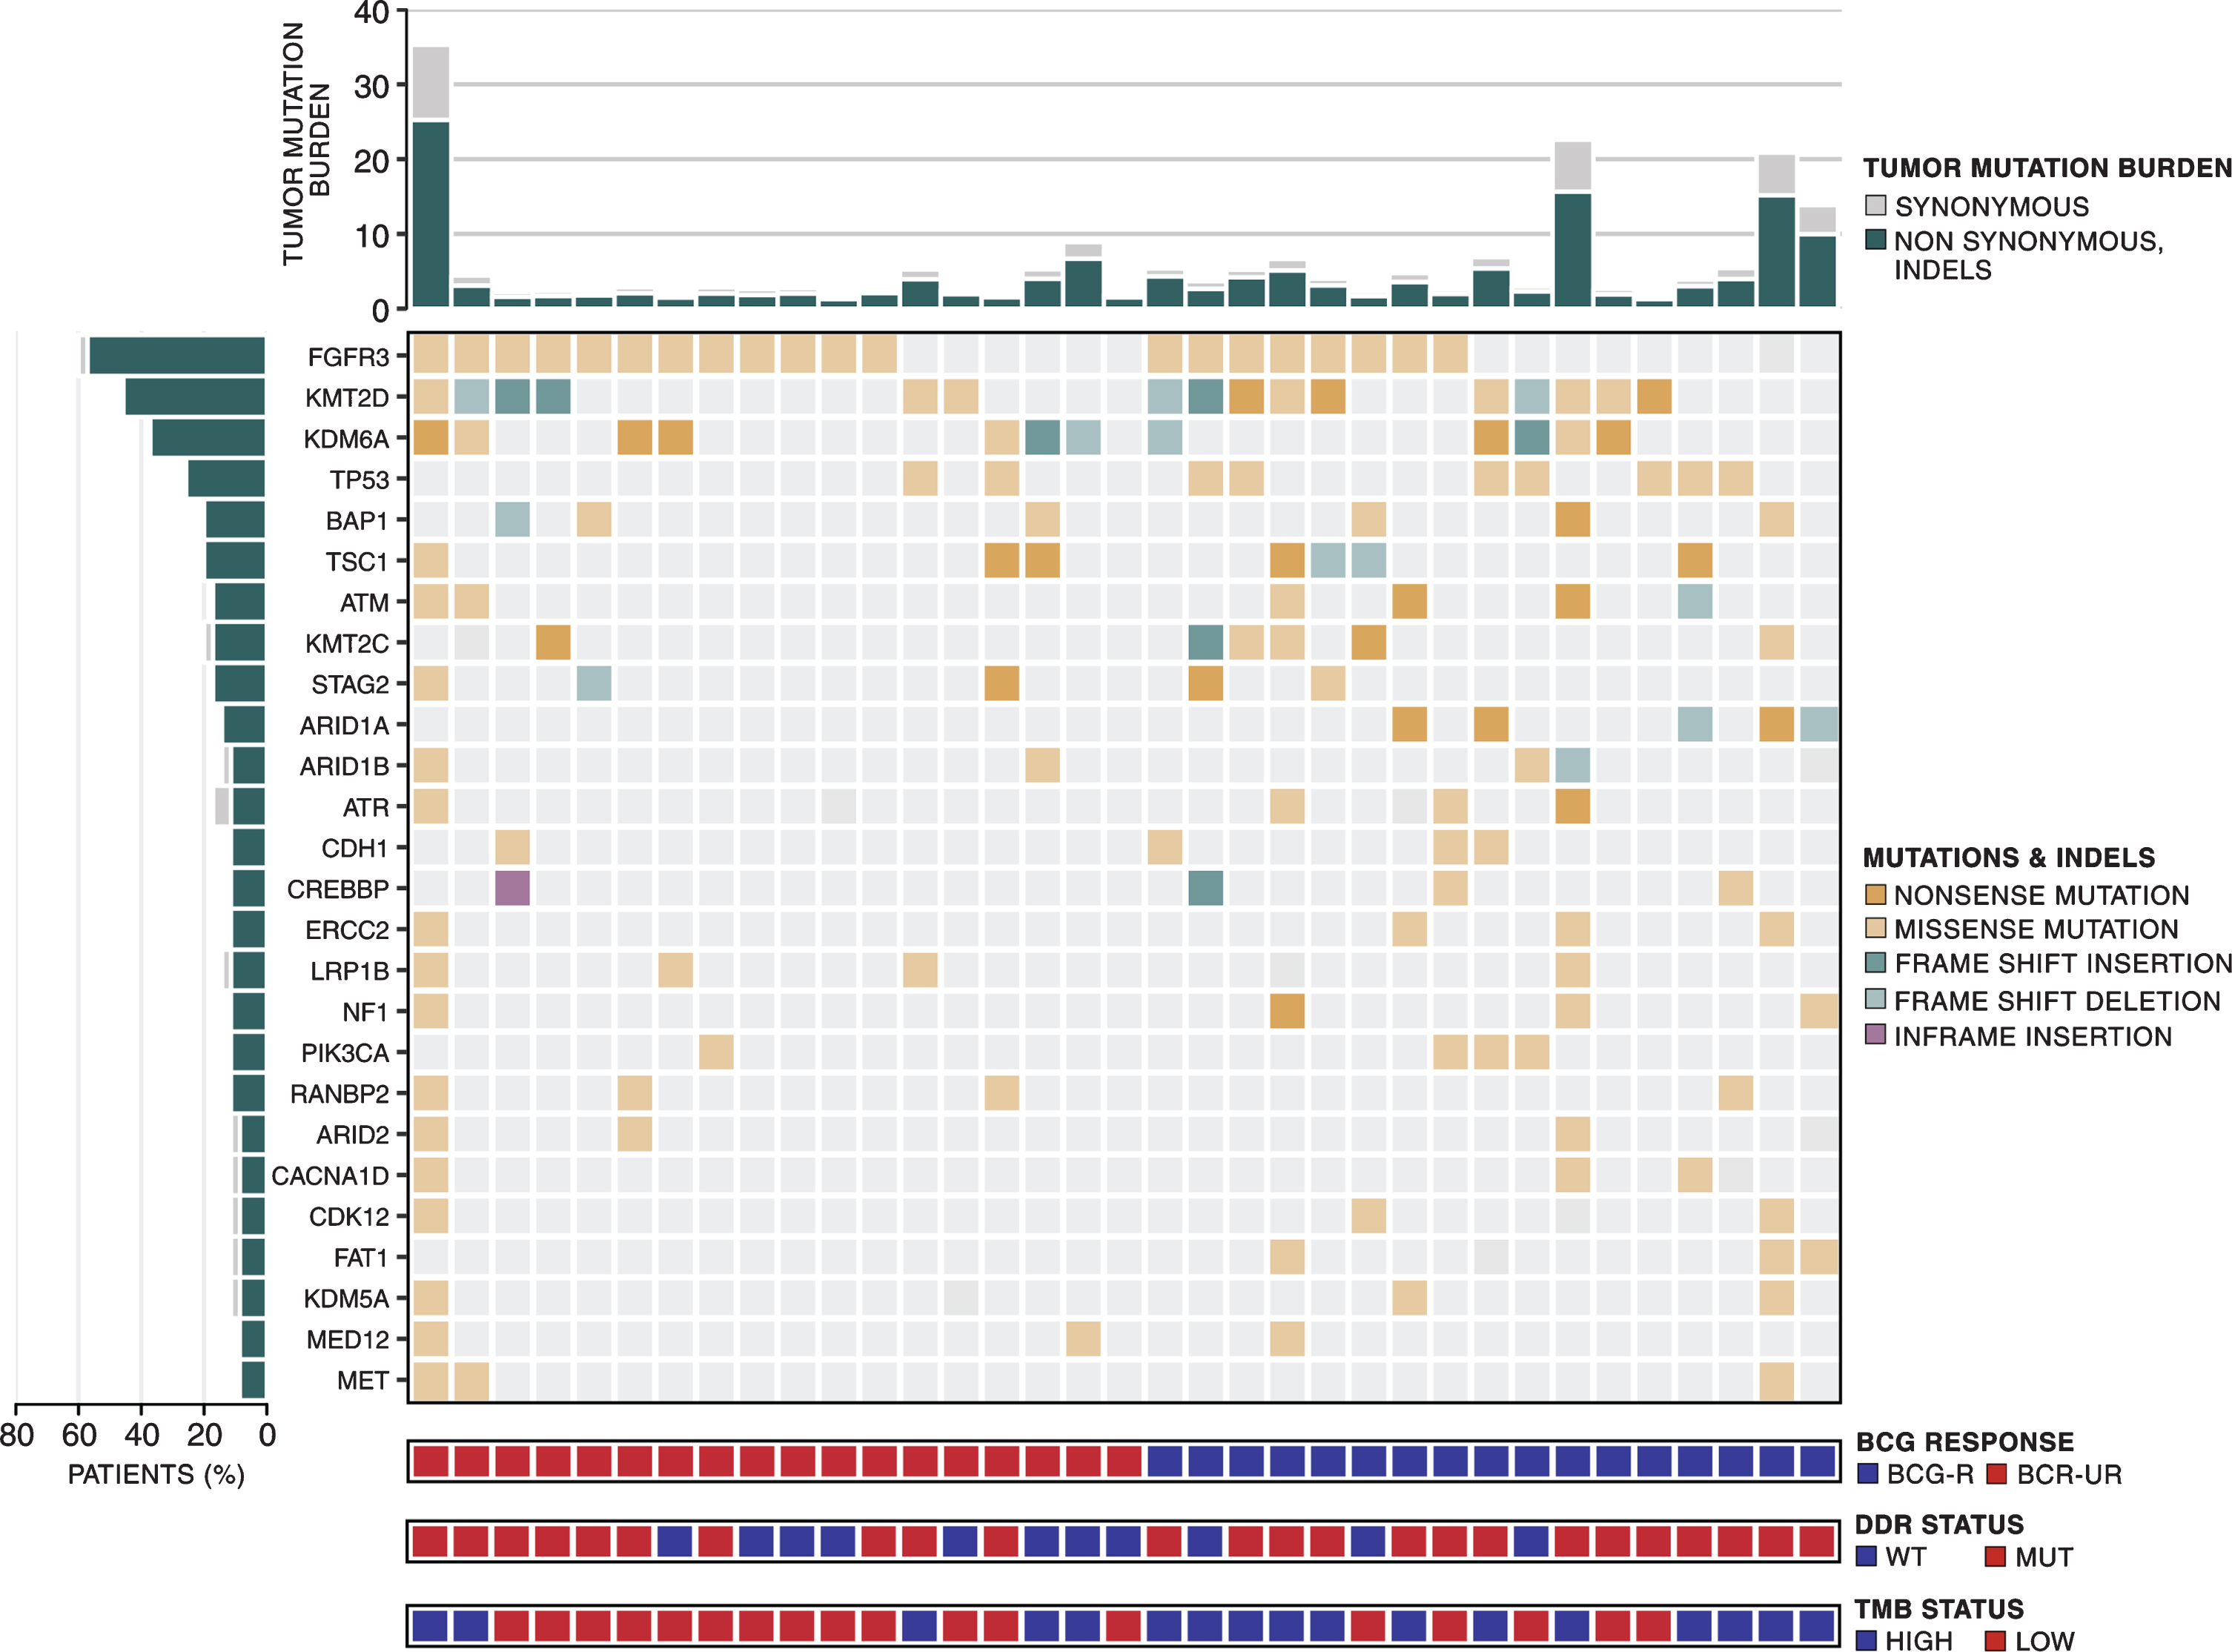
We were able to confirm most of the previously reported genomic findings reported for NMIBC [12, 13, 35–38]. Most point mutations were C > T transitions (57.9%) (Fig. S1A), and the APOBEC mutational signature was detected in 80% of the samples (Fig. S1B). Mutations in chromatin-modifying genes were present in 71.4% of the tumors and KMT2D, and KDM6A were the two most frequently mutated (>30%) chromatin-modifying genes (Fig. S2 and Table S2). Recurrent somatic mutations were detected in 2 genes (TP53 and KDM6A) using MutSig. Other genes, including FGFR3, KMT2D, BAP1, TSC1, ATM, KMT2 C, STAG2, ARID1A were mutated in at least 5 patients (14.3%) but did not reach statistical significance according to MutSig (Fig. 1). Mutations in none of the 10 frequently mutated genes were associated with recurrence rate (RR) to BCG immunotherapy or improved recurrence-free survival (RFS) (Data not shown).
Tumor mutation burden and benefit from BCG immunotherapy
Since high TMB has been associated with response to immune-checkpoint inhibitors in several malignancies [9], we examined the association between TMB and clinical benefit from BCG immunotherapy. For the entire cohort, the median TMB was 3 ([IQR] 2.6-5.5) mutations/Mb (Table S1).
TMB was higher in BCG-R compared to BCG-UR patients (TMB 4.9, [IQR] 3.0-6.8 vs. 2.8, [IQR] 2.4-4.1 mutations/Mb, Mann-Whitney P = 0.032, Fig. 2A). BCG RR was higher in patients with high TMB (defined as equal or above the median TMB of the cohort:≥3 mutations/Mb) and high TMB was significantly associated with RR to BCG immunotherapy when compared to low TMB (RR 71 vs. 28%, Odds Ratio (OR)=6.24, 95% CI: 1.44-27.06, Pearson Chi-Square P = 0.011, Fig. 2B and Table 2). In multivariate analysis, high TMB remained an independent predictor of BCG response (OR = 5.20, 95% CI: 1.11-24.34, P = 0.036, Table 2).
Fig. 2
TMB and benefit from BCG immunotherapy. (A) TMB in tumors from patients responsive (BCG-R) and unresponsive (BCG-UR) to BCG immunotherapy (TMB BCG-R=4.9 vs. BCG-UR=2.8, mutations/Mb, Mann-Whitney P = 0.032) (B) BCG response rate in patients harboring tumors with high TMB (HIGH-TMB) compared to tumors with low TMB (LOW-TMB) (RR HIGH-TMB=71% vs. LOW-TMB=28%, Odds Ratio (OR)=6.24, 95% CI: 1.44-27.06, Pearson Chi-Square P = 0.011) (C) Kaplan-Meier curve for recurrence-free survival after BCG immunotherapy for patients harboring tumors with HIGH-TMB compared to tumors with LOW-TMB. (RFS HIGH-TMB=38 vs. LOW-TMB=15 months, Hazard Ratio (HR)=0.27, 95% CI: 0.10- 0.77, Log-rank P = 0.009).
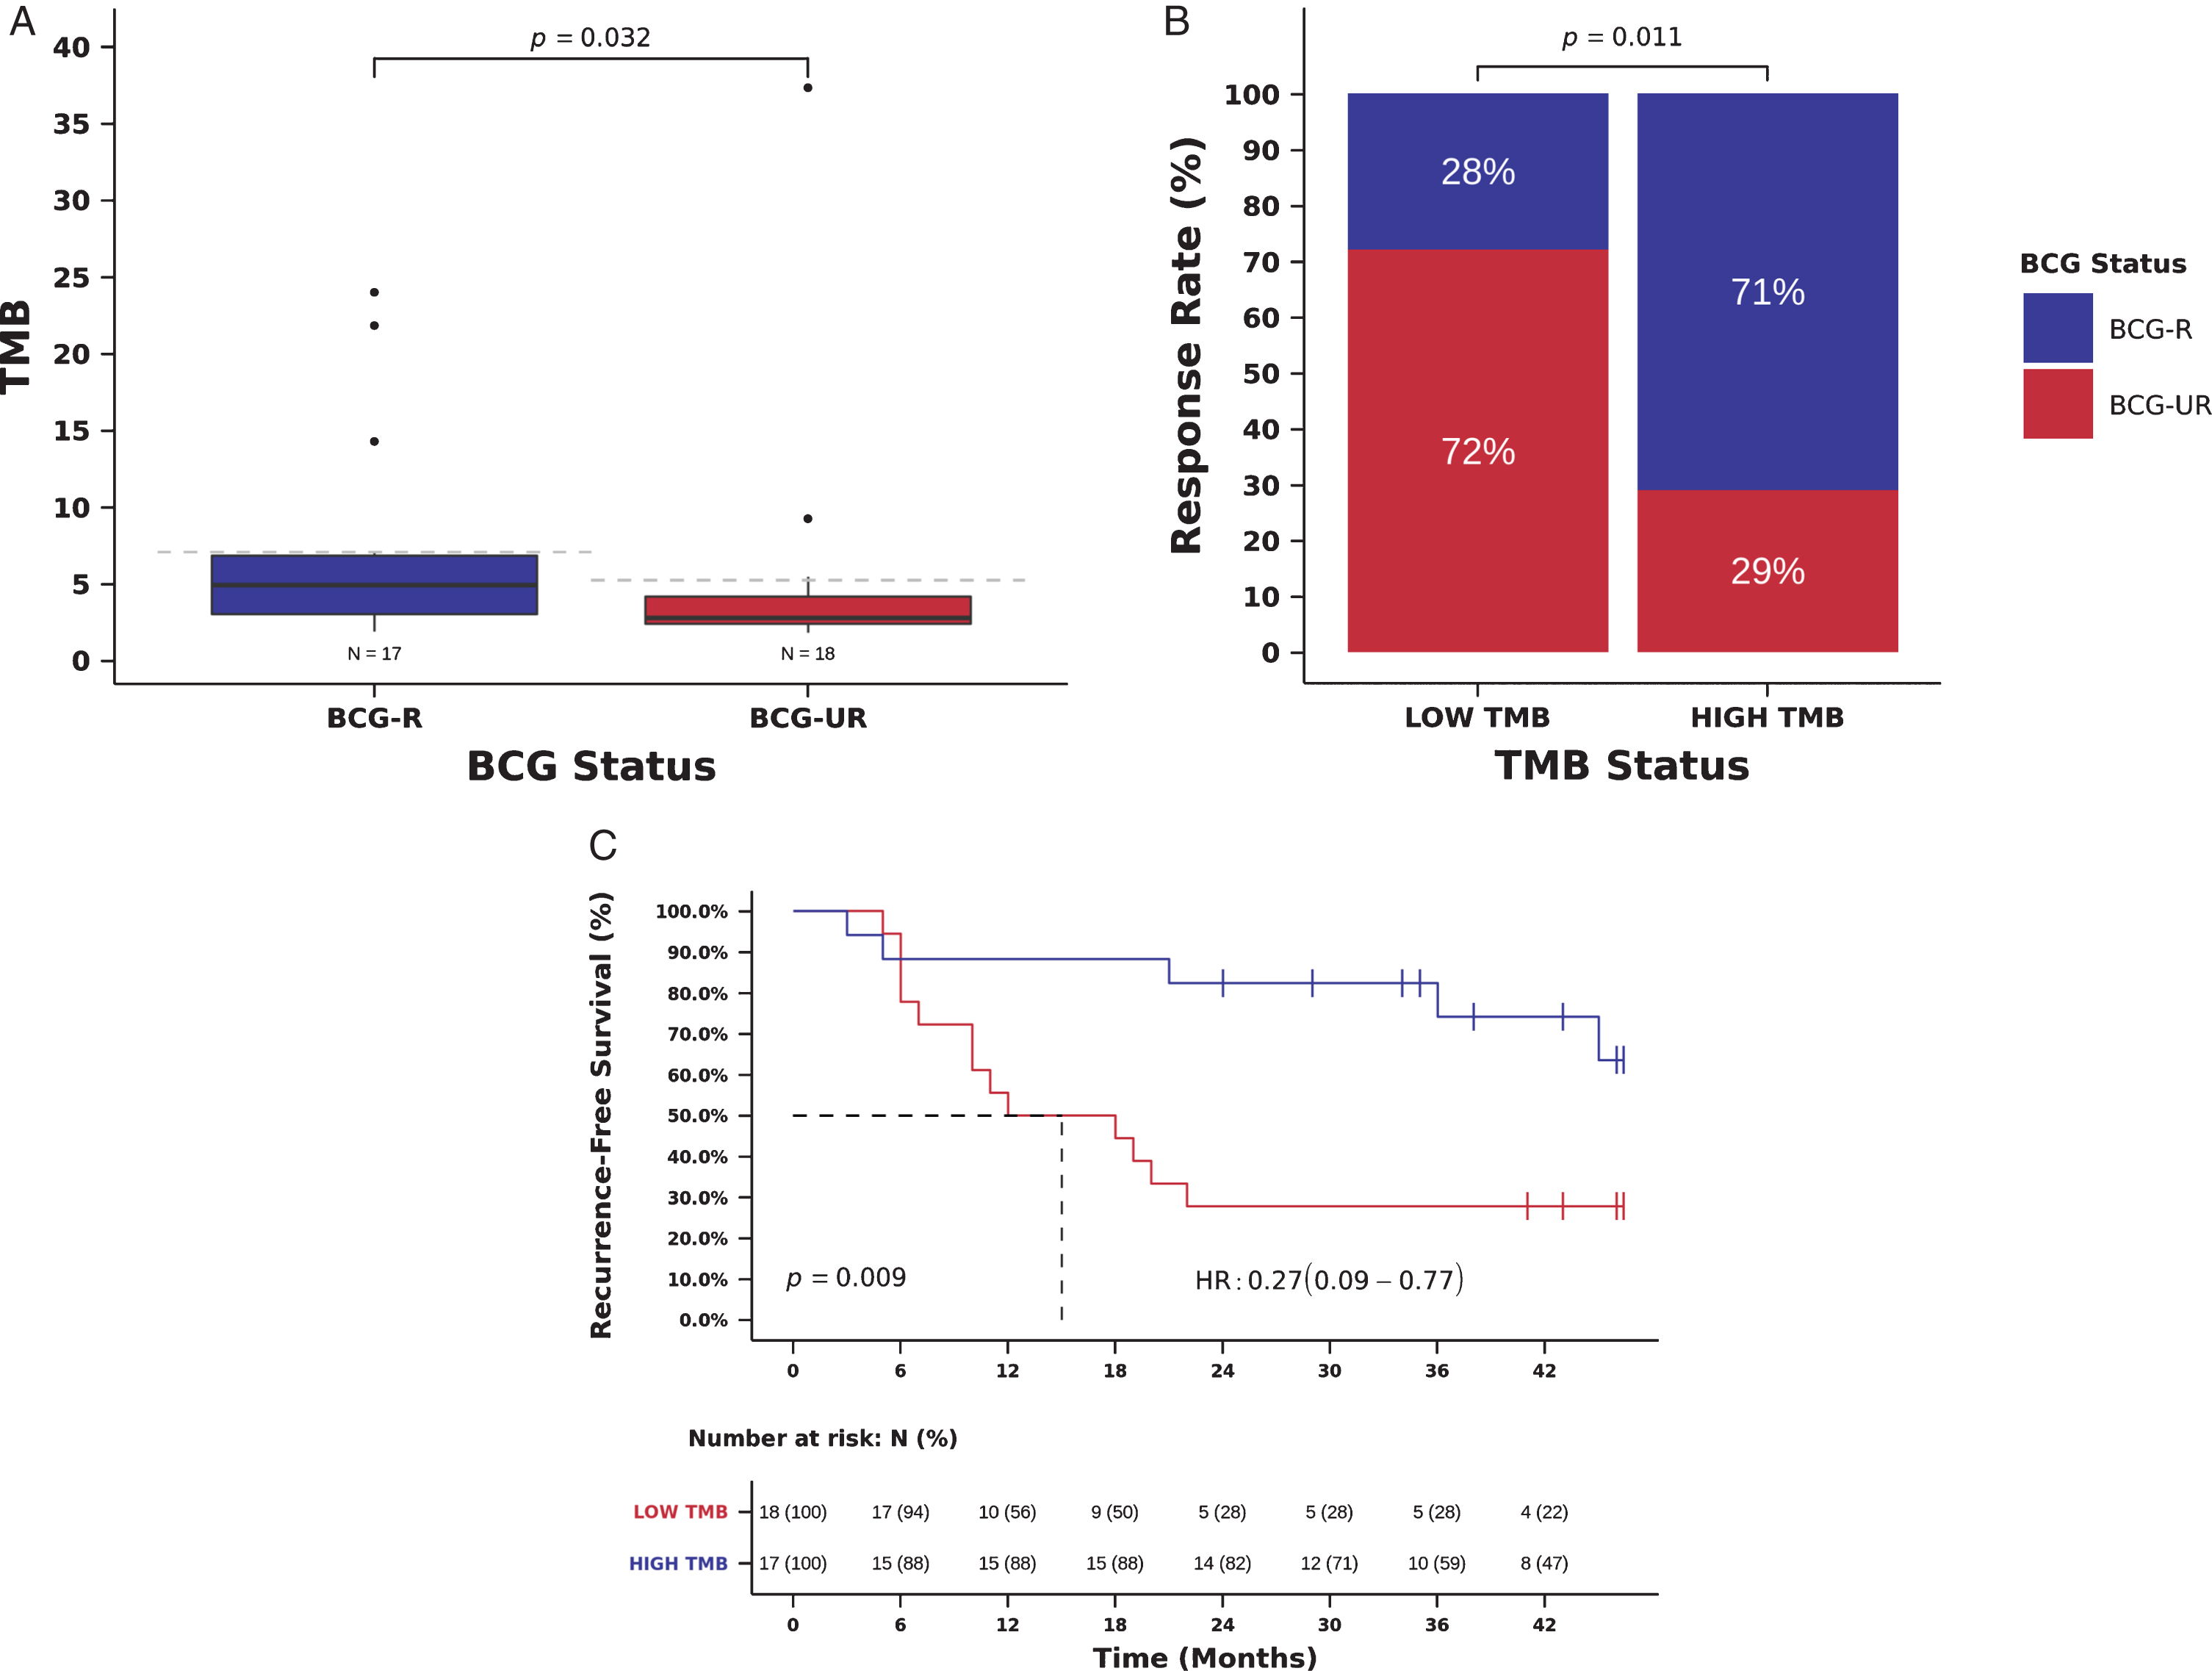
We also examined the relation between TMB and RFS. Patients with high TMB had an improved RFS compared to those with low TMB, and high TMB was significantly associated with a decreased risk of recurrence (mRFS 38 vs. 15 months, RFS 82 vs 28% at 24 months, Hazard Ratio (HR)=0.27, 95% CI: 0.09- 0.77, Log-rank P = 0.009, Fig. 2C and Table 3). In multivariate analysis, TMB remained an independent predictor of recurrence after BCG immunotherapy (HR = 0.28, 95% CI: 0.10-0.82, Wald test P = 0.021, Table 3).
We have previously shown that Comprehensive Cancer Gene Panels (CCGP) can be used to estimate mutational load and predict clinical benefit to immunotherapy [39]. To evaluate if TMB estimated using CCGP (instead of WES) could also demonstrate an association with BCG benefit, we re-calculated the TMB using somatic mutations present in genes included in the FDA approved Memorial Sloan Kettering-Integrated Mutation Profiling of Actionable Cancer Targets panel (MSK-IMPACT –468 genes). The MSK-IMPACT TMB was higher in BCG-R compared to BCG-UR patients (TMB 5.4, [IQR] 4.4-8.3 vs. 3.4, [IQR] 2.6-4.8 mutations/Mb, Mann-Whitney P = 0.022, Fig. S3A). BCG RR was higher in patients with high MSK-IMPACT TMB (defined as equal or above the median MSK-IMPACT TMB of the cohort:≥4.4 mutations/Mb) compared to patients with low MSK-IMPACT TMB (RR 69 vs. 32%, OR = 4.77, 95% CI: 1.14-19.98, Pearson Chi-Square P = 0.028, Fig. S3B). Also, patients with high MSK-IMPACT TMB had an improved RFS compared to those with low MSK-IMPACT TMB (mRFS 36.5 vs. 19 months, RFS 75 vs. 37% at 24 months, HR = 0.36, 95% CI: 0.13-1.02, Log-rank P = 0.045, Fig. S3C).
In our cohort, TMB was not significantly associated with any specific gene alteration. Interestingly, an exploratory analysis of patients harboring FGFR3 mutations demonstrated a lower TMB compared with FGFR3 wild type (TMB 2.9, [IQR] 2.5-4.7 vs. 4.7, [IQR] 2.7-7.6 mutations/Mb, Mann-Whitney P = 0.271, Fig. S4A), although not statistically significant. The same non-significant trend was observed in the NAL of patients with FGFR3 mutations (NAL 68, [IQR] 57.5-96.0 vs. 103, [IQR] 55.8-175.8 predicted neoantigens, Mann-Whitney P = 0.243, Fig. S4B).
Neoantigen load and benefit from BCG immunotherapy
We next examined the association between NAL and clinical benefit from BCG immunotherapy. We identified a median of 78 predicted neoantigens per tumor ([IQR] 55.5-124.0) (Table S1 and Table S3) and predicted NAL correlated strongly with TMB (Spearman correlation 0.88, P < 0.001, Fig. S5). NAL was higher in BCG-R compared to BCG-UR patients (NAL 100.0, [IQR] 75.0-145.0 vs. 65, [IQR] 48.3-82.5 predicted tumor antigens, Mann-Whitney P = 0.032, Fig. 3A). BCG RR was higher in patients with high NAL (defined as equal or above the median NAL of the cohort:≥78 predicted neoantigens) and high NAL was significantly associated with RR to BCG immunotherapy when compared to low NAL (RR 71 vs. 28%, Odds Ratio (OR)=6.24, 95% CI: 1.44-27.06, Pearson Chi-Square P = 0.011, Fig. 3B and Table 2). In multivariate analysis, high NAL remained an independent predictor of BCG response (OR = 6.57, 95% CI: 1.32-32.67, P = 0.021, Table 2).
Fig. 3
NAL and benefit from BCG immunotherapy. (A) NAL in tumors from patients responsive (BCG-R) and unresponsive (BCG-UR) to BCG immunotherapy (NAL BCG-R=100.0 vs. BCG-UR=65, mutations/Mb, Mann-Whitney P = 0.032) (B) BCG response rate in patients harboring tumors with high NAL (HIGH-NAL) compared to tumors with low NAL (LOW-NAL) (RR HIGH-NAL=71% vs. LOW-NAL=28%, Odds Ratio (OR)=6.24, 95% CI: 1.44-27.06, Pearson Chi-Square P = 0.011) (C) Kaplan-Meier curve for recurrence-free survival after BCG immunotherapy for patients harboring tumors with HIGH-NAL compared to tumors with LOW-NAL. (RFS HIGH-NAL=36 vs. LOW-NAL=18.5 months, Hazard Ratio (HR)=0.30, 95% CI: 0.11- 0.85, Log-rank P = 0.017).
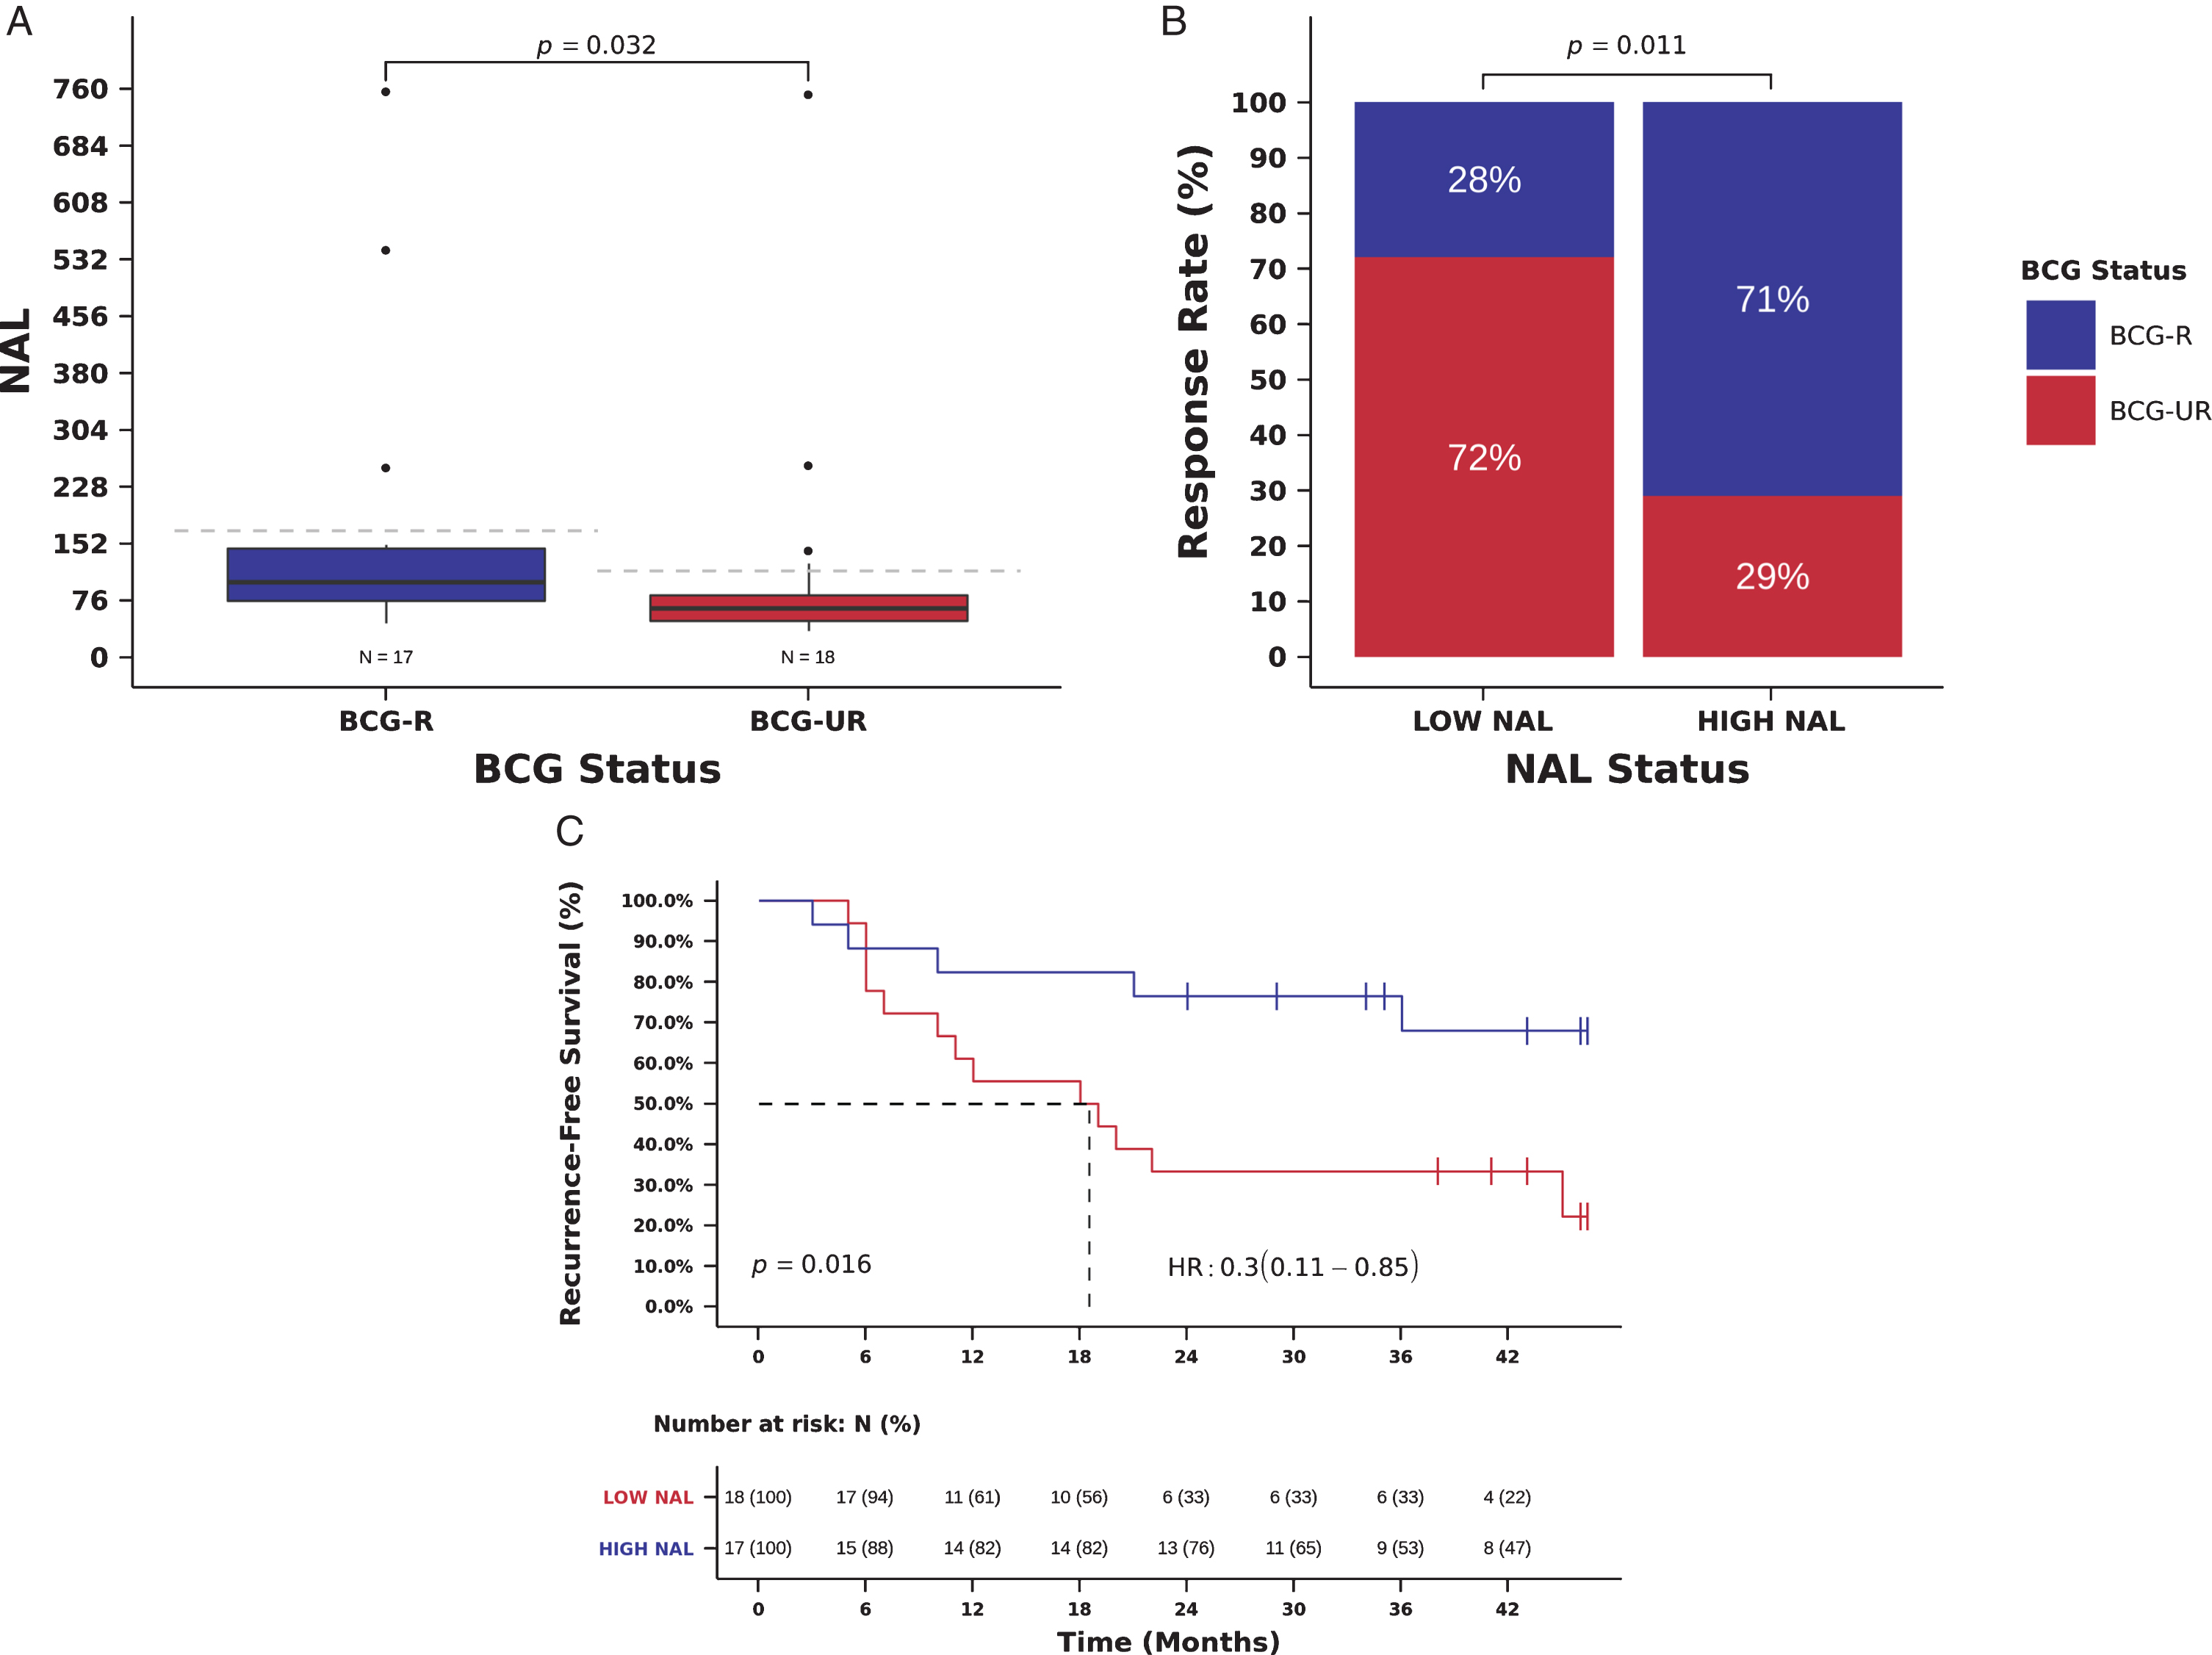
We also examined the relation between NAL and patient outcome. Patients with high NAL had an improved RFS compared to those with low NAL, and high NAL was significantly associated with a decreased risk of recurrence (mRFS 36.0 vs. 18.5 months, RFS 76 vs. 33% at 24 months, Hazard Ratio (HR)=0.30, 95% CI: 0.11- 0.85, Log-rank P = 0.016, Fig. 3C and Table 3). In multivariate analysis, NAL remained an independent predictor of recurrence after BCG immunotherapy (HR = 0.28, 95% CI: 0.10-0.81, Wald test P = 0.019, Table 3). NAL and TMB were not entered simultaneously in multivariable models because of the collinearity between NAL and TMB (Fig. S5), and we were unable to carry out stratified analysis using TMB and NAL status due to the small size of our cohort.
Mutations in DNA damage response genes and benefit from BCG immunotherapy
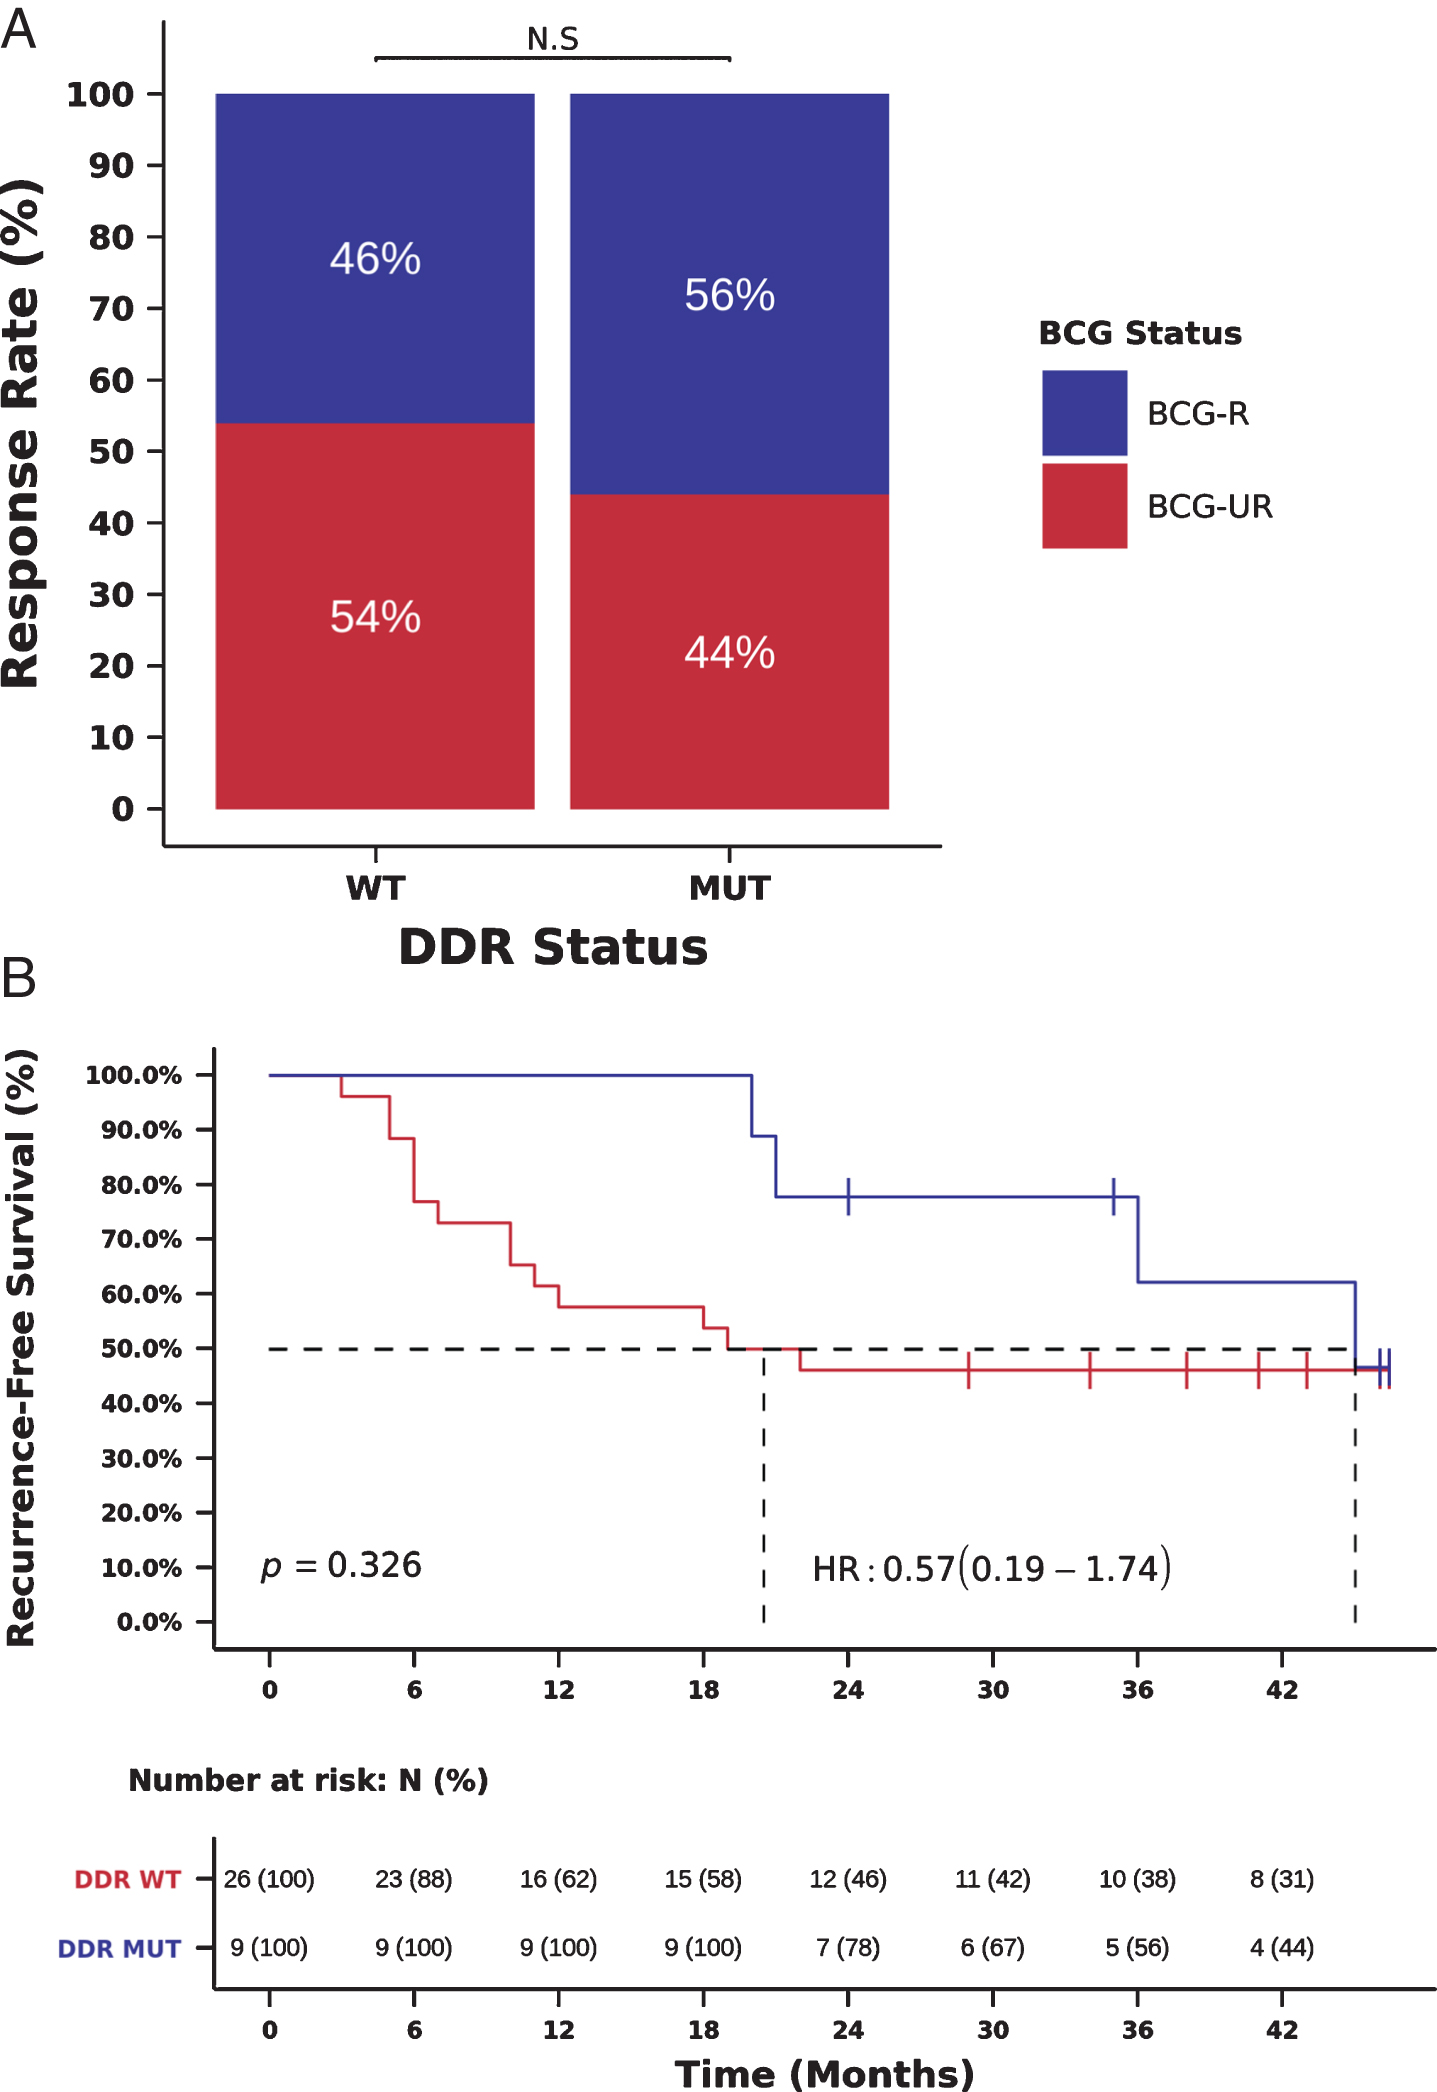
As recent reports also indicate that DDR gene alterations are associated with high TMB and sensitivity to immunotherapy in MIBC [8, 11], we also investigated the association between the presence of deleterious mutations in DDR genes and benefit from BCG immunotherapy. We initially used a list of 34 DDR genes, frequently mutated in cancer and previously associated with clinical benefit from PD-1/PD-L1 blockade in advanced urothelial cancer [8]. Using this list of 34 DDR genes, we observed a trend towards the association between DDR gene alterations, RR to BCG and RFS, which probably did not reach statistical significance due to the small number of patients (N = 9) with DDR gene alterations (Fig. 4A-B).
Fig. 4
Mutations in DDR genes (34 gene list) and benefit from BCG immunotherapy. (A) BCG response rate in patients harboring tumors with deleterious mutations in DDR genes (DDR-MUT) compared to tumors with wild-type DDR genes (DDR-WT). (RR DDR-MUT=56% vs. DDR-WT=46%, OR = 1.58, 95%, CI: 0.32-6.70, Chi-Square p = 0.711) (B) Kaplan-Meier curve for recurrence-free survival after BCG immunotherapy for patients harboring tumors with deleterious mutations in DDR genes (DDR-MUT) compared to tumors with wild-type DDR genes (DDR-WT). (RFS DDR-MUT=36.0 vs. DDR-WT=20.0 months, HR = 0.57, 95% CI: 0.19-1.74, Log-rank p = 0.326).
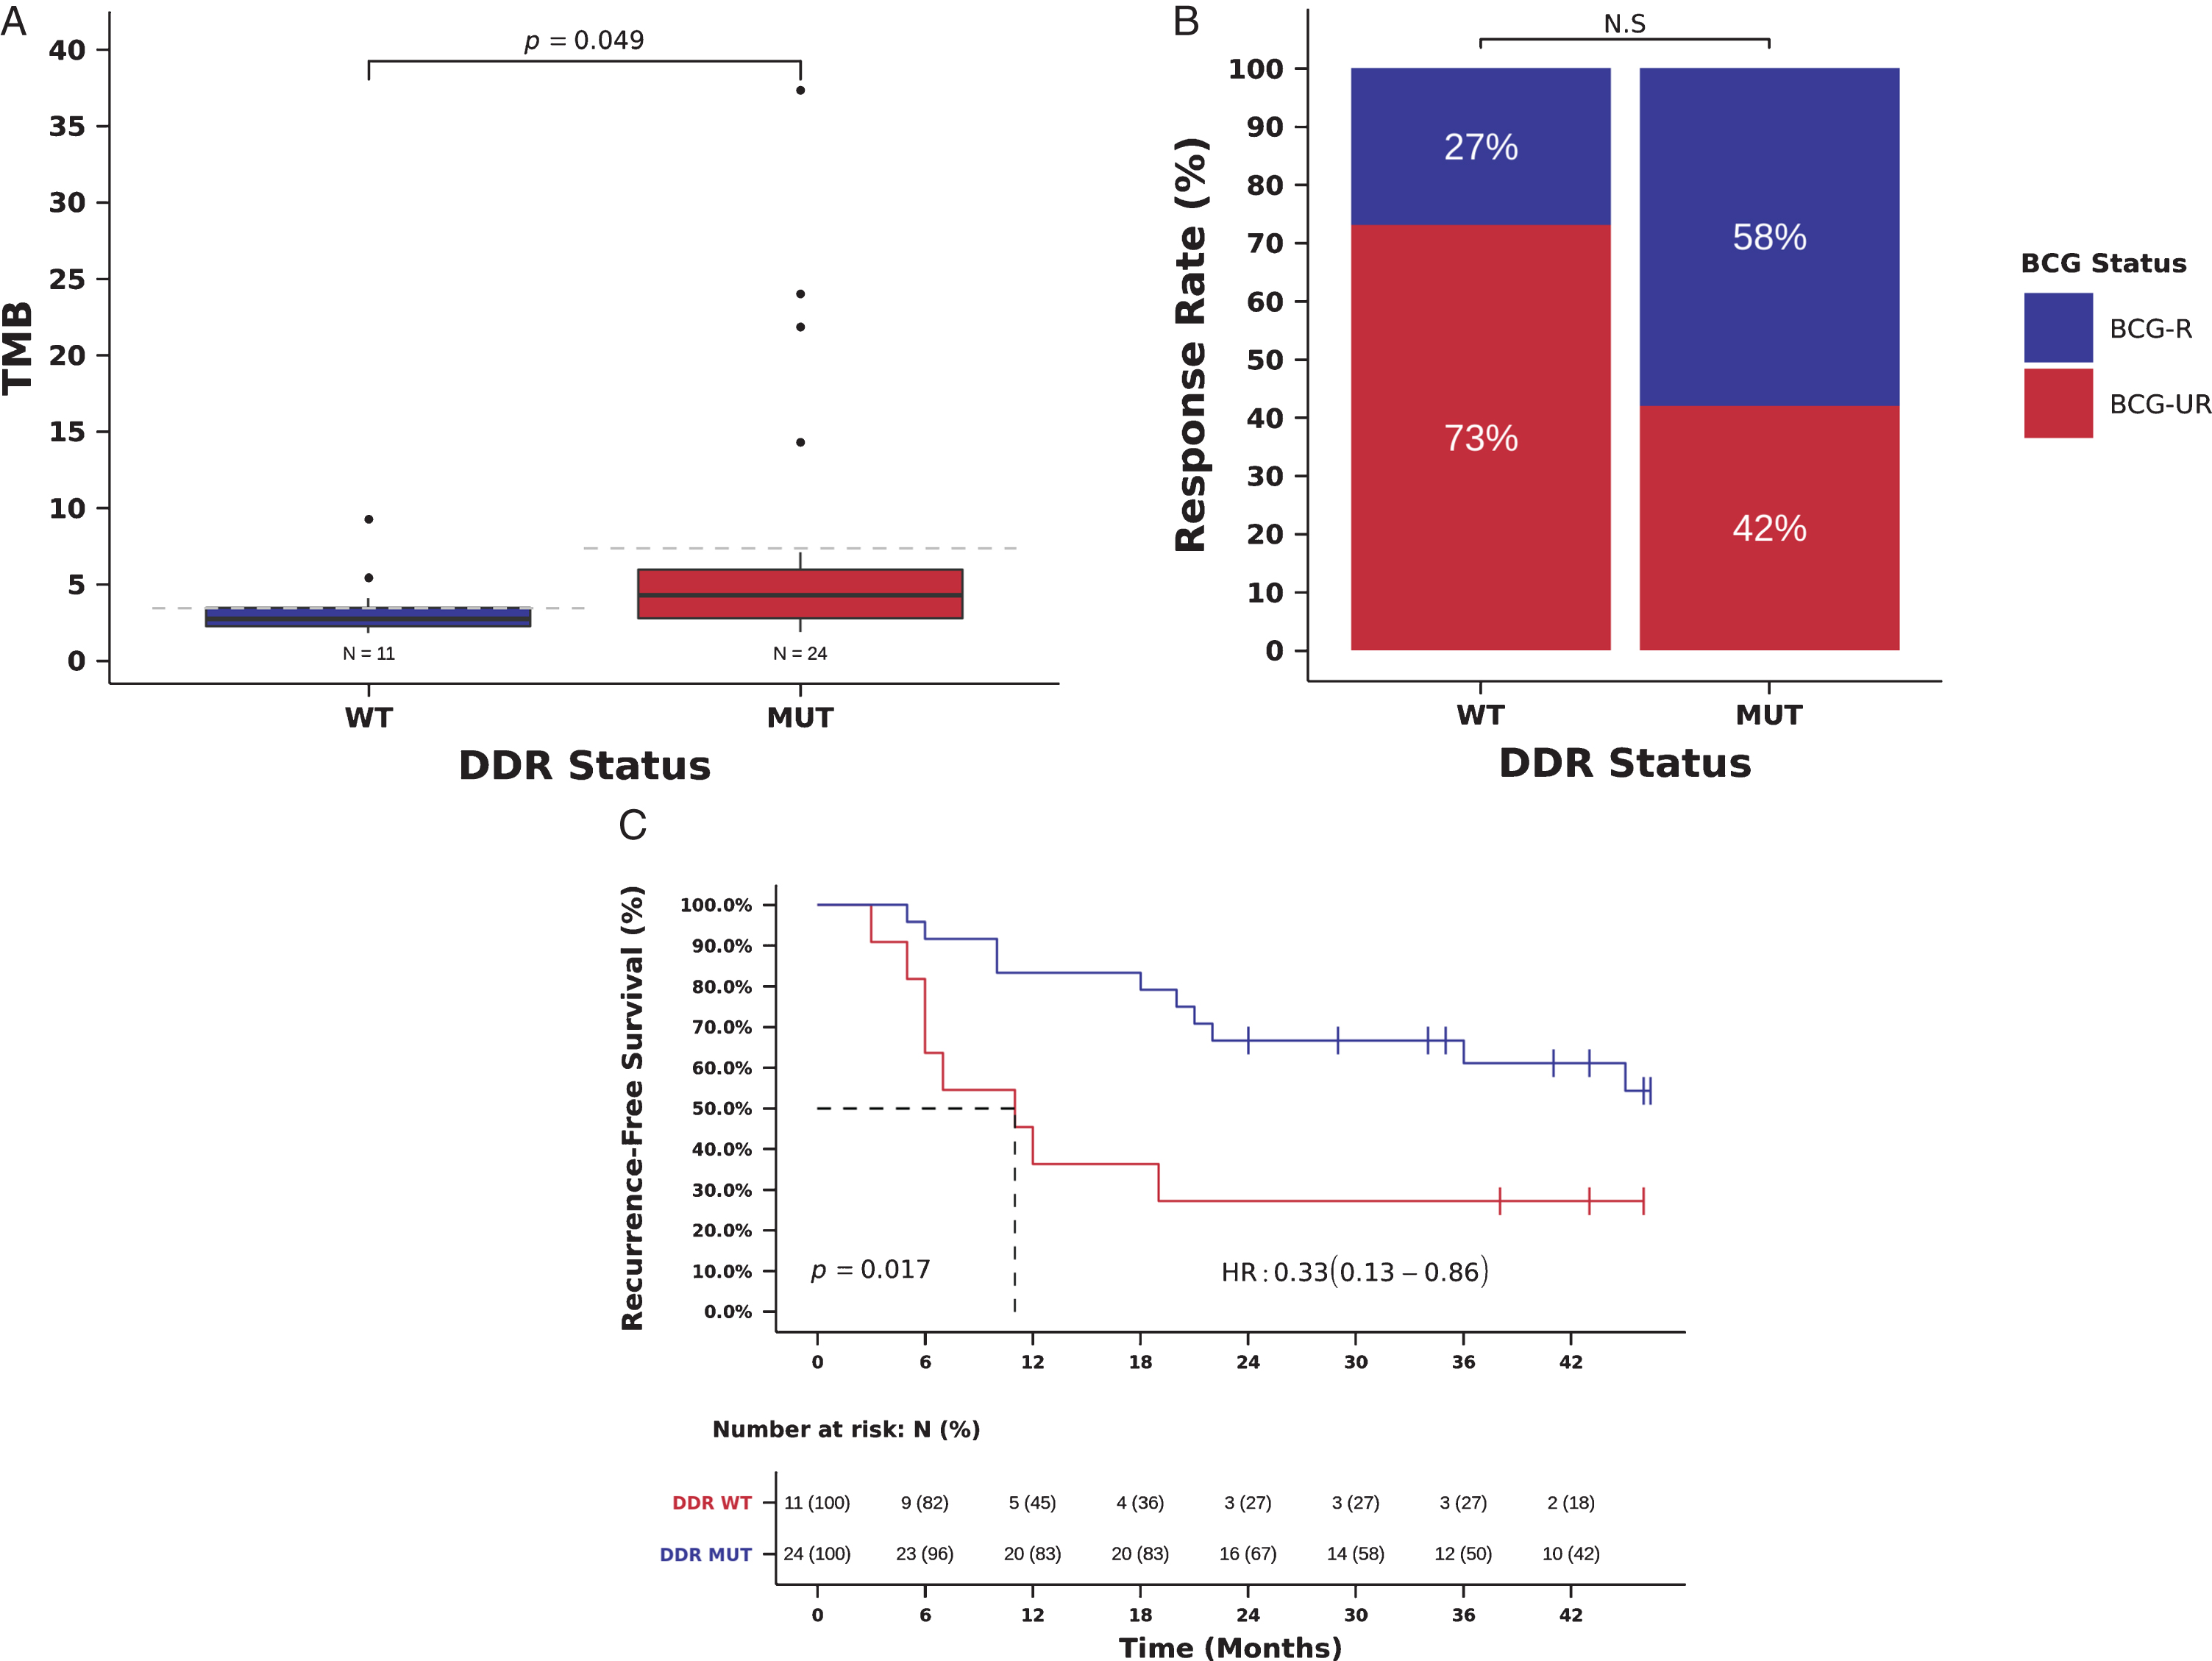
We therefore used a comprehensive list of 193 genes known to have a direct role in DNA damage repair, as well as of genes involved in DNA damage response [27]. Twenty-four tumors (68.6%) had at least 1 deleterious mutation in DDR genes (Table S1). As expected, we observed a statistically significant association between the presence of deleterious mutations in DDR genes and high TMB (TMB 4.3, [IQR] 2.8 –5.9, vs. 2.7, [IQR] 2.2-3.4 mutations/Mb, Mann-Whitney P = 0.049, Fig. 5A). All 3 patients with TMB > 20 mutations/Mb harbor deleterious mutations in ERCC2 (Fig. 1). A total of 48 out of 139 (34.5%) somatic mutations in DDR genes were classified as deleterious mutations (including damaging missense mutations, nonsense mutations, splice-site mutations, and frameshift indels) (Table S4).
BCG RR was numerically higher in patients with deleterious mutations in DDR genes, but DDR status was not significantly associated with response to BCG immunotherapy (RR 58 vs. 27%, OR = 3.73, 95% confidence interval [CI]: 0.79-17.68, Pearson Chi-Square P = 0.088, Fig. 5B and Table 2). Patients with deleterious mutations in DDR genes, had an improved RFS compared to those with wild-type DDR genes and the presence of deleterious mutations in DDR genes was significantly associated with a decreased risk of recurrence in univariate (mRFS 35.5 vs. 11.0 months, RFS 78 vs 46% at 24 months, HR = 0.33, 95% CI: 0.13-0.86, Log-rank P = 0.017, Fig. 5C, Table 3) and multivariate analyses (HR = 0.27, 95% CI: 0.10-0.72; Wald test P = 0.009, Table 3). DDR status and TMB were not entered simultaneously in multivariable models because of the collinearity between DDR status and TMB (Fig. 5A), and we were unable to carry out stratified analysis using TMB and DDR status due to the small size of our cohort.
Fig. 5
Mutations in DDR genes (193 gene list) and benefit from BCG immunotherapy. (A) TMB in tumors with deleterious mutations in DDR genes (DDR-MUT) compared to tumors with wild-type DDR genes (DDR-WT). (TMB DDR-MUT=4.3 vs. DDR-WT=2.7 mutations/Mb, Mann-Whitney P = 0.049). (B) BCG response rate in patients harboring tumors with deleterious mutations in DDR genes (DDR-MUT) compared to tumors with wild-type DDR genes (DDR-WT). (RR DDR-MUT=58% vs. DDR-WT=27%, OR = 3.73, 95%, CI: 0.79-17.68, Pearson Chi-Square P = 0.088) (C) Kaplan-Meier curve for recurrence-free survival after BCG immunotherapy for patients harboring tumors with deleterious mutations in DDR genes (DDR-MUT) compared to tumors with wild-type DDR genes (DDR-WT). (RFS DDR-MUT=35.5 vs. DDR-WT=11.0 months, HR = 0.33, 95% CI: 0.13-0.86, Log-rank P = 0.017).
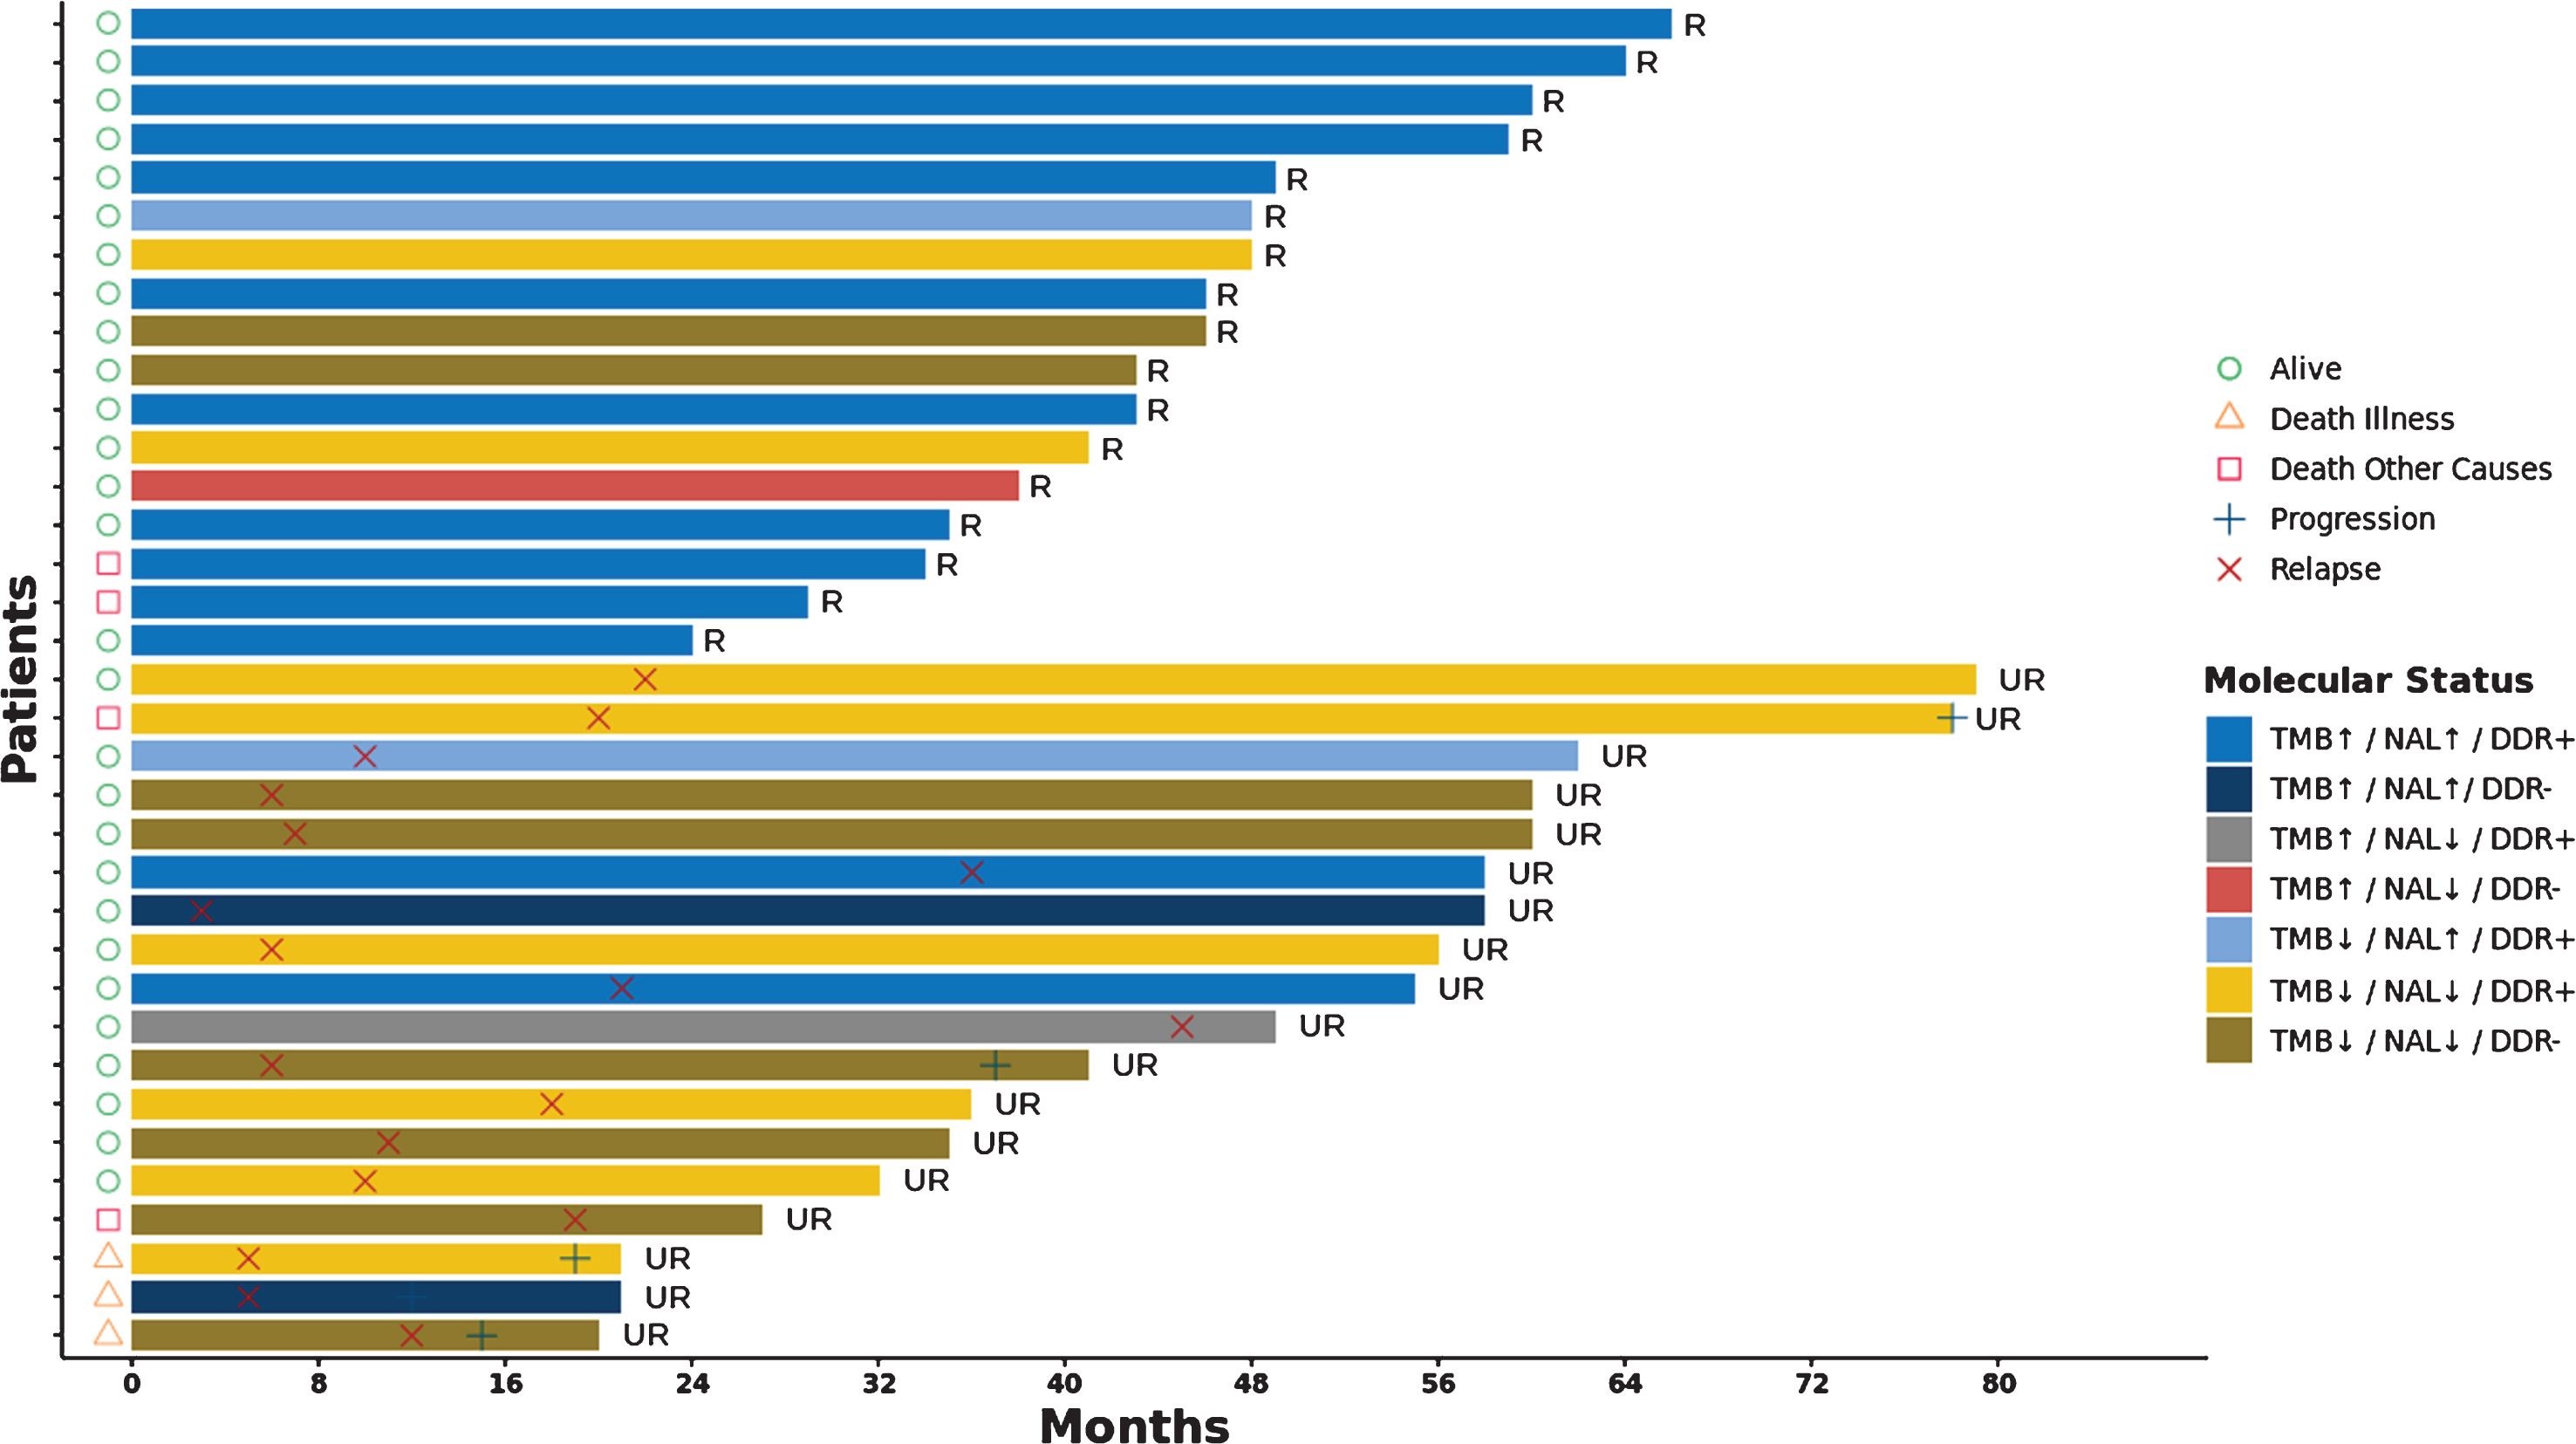
A detailed description of the outcomes of the patients in the BCG-R and BCG-UR according to their molecular status (TMB, NAL and DDR) is provided in the Fig. 6.
Fig. 6
Swimmers plot of NMIBC patients treated with BCG immunotherapy. Clinical outcomes (relapse × and progression +) and survival (alive ○, death illness ∇ and death from other causes □) of BCG responsive (R) and unresponsive (UR) patients are shown in a timeline in months. Patients are represented using different colours according their TMB (high ↑ and low ↑), NLA (high ↑ and low ↑) and DDR status (wild type − and mutant +).
DISCUSSION
For several decades, clinicopathological features have been used to determine whether patients with NMIBC should be treated with BCG as an attempt to reduce recurrence and progression after TURBT. Factors such as T stage, tumor grade, number and size of tumors are widely used to identify patients with higher chance of benefit from BCG [2, 4]. However, these factors are mainly prognostic and an unmet need for patients with NMIBC is the identification of predictive biomarkers to guide therapy selection after TURBT. In fact, an important unmet need for patients with urothelial carcinoma, regardless of disease stage, is the identification of predictive biomarkers to select patients for immunotherapy. A recent proposed urothelial cancer immunogram aims to classify potential immune biomarkers based on tumor- and host-specific parameters into seven axes: tumor foreignness, immune cell infiltration capacity, immune checkpoints, soluble inhibitors, inhibitory tumor metabolism, general immune status, and tumor sensitivity to immune effector mechanisms [40, 41]. One of the most studied categories is the tumor foreignness, which includes the tumor mutations, TMB and NAL. Thus, the main objective of our study was to identify genomic biomarkers of benefit from BCG by performing WES in tumors from patients with high-risk NMIBC treated with BCG.
Our most important finding was the independent association of high TMB (calculated using both WES and CCGP) with increased likelihood of BCG response and improved RFS. High TMB has been identified as a potential predictive biomarker to immunotherapy across multiple solid tumors [9, 10]. Moreover, even in less advanced stages, TMB appears to correlate with response to neoadjuvant immunotherapy in a phase II study of patients with MIBC [42]. Determining TMB became increasingly feasible with the introduction of next-generation sequencing technology in the clinics, and validation studies are underway to confirm TMB as a treatment selection tool [10]. If our findings are confirmed in larger independent datasets, TMB could be integrated to other potential biomarkers to maximize clinical benefit to BCG immunotherapy.
The mechanism of action of BCG immunotherapy has been widely studied over the past years, but it is still not entirely understood. Bladder cancer cells and the immune system both play a role in the therapeutic antitumor effect of BCG. However, it is not clear if the antitumor effect is mediated by the recognition of tumor antigens and the induction of a tumor-specific immune response or by a global intravesical inflammatory response with a side effect antitumor activity [5, 6]. In the present work, we observed a significant association of high NAL with an increased likelihood of BCG response and improved RFS. Although the use of NAL as a predictive marker has not been incorporated in the clinical practice yet, this observation provides, for the first time, indirect evidence that BCG may act by enhancing the recognition of neoantigens. A deeper understanding of the mechanisms behind BCG-mediated immunity is a first step to improve efficacy and develop combined therapeutic approaches for NMIBC. In particular, the association between NAL and improved outcomes after BCG therapy indicate that NMIBC patients may benefit from simultaneous use of BCG and immune-checkpoint inhibitors.
Whether checkpoint inhibition has a role in BCG therapy, or more specifically, BCG failure, is currently being intensively investigated [43]. Recently, Kates et al. demonstrated that baseline tumor PD-L1 expression predicts unfavorable response to BCG immunotherapy, indicating that subset of patients with BCG unresponsive tumors may benefit from the combined use of immune checkpoint inhibitors and BCG [44]. Also, results from the Keynote-057 trial with pembrolizumab for BCG-unresponsive NMIBC demonstrated a 41% complete response rate, with half of responders maintaining complete response over one year [45]. Moreover, two trials are testing the efficacy of BCG in synergy with checkpoint blockade inhibitors in NMIBC (NCT02324582, NCT03528694) and a third one is evaluating the effect of locally instilled checkpoint blockade inhibitors in combination with BCG (NCT02808143). The activity of anti-PD-L1 and anti-PD-1 antibodies is also being tested in patients with NMIBC who are unresponsive to BCG or patients with very-high-risk NIMBC who have not been exposed to BCG (NCT02451423 and NCT02792192).
Presently, there is increasing interest in evaluating DDR gene mutations in urothelial carcinoma, since several studies have demonstrated a higher likelihood of benefit to cisplatin-based chemotherapy and anti-PD1/PDL-1 blockade in patients with DDR gene mutated tumors [8, 46, 47]. Also, recent studies reported an association between DDR gene mutations and higher TMB [12, 48]. Our study confirmed the presence of a high prevalence (68.6%) of deleterious mutations in DDR genes in this high-risk NMIBC cohort and the association between DDR gene mutations and higher TMB. Interestingly, using a comprehensive list of 193 DDR genes, we were able to demonstrate that patients with deleterious mutations in DDR genes had higher TMB and numerically higher RR compared to patients with wild-type DDR genes (although not statistically significant). Moreover, deleterious mutations in DDR genes correlated with improved RFS in univariate and multivariate analysis. A similar trend was observed using a smaller list of 34 DDR genes previously associated with clinical benefit from PD-1/PD-L1 blockade in advanced urothelial cancer [8], but statistical significance was not reached probably due to the small number of patients (N = 9) with alteration in this subset of DDR genes. Recently, it has been suggested that ATM mutations may be correlated with worse prognosis in urothelial cancer, in the opposite direction of other DDR gene alterations [49, 50]. In our cohort we did not observe this signal, although the small sample size limits a more reliable conclusion.
An interesting implication of our findings is that BCG-UR patients may relapse or progress with tumors with low TMB and low likelihood of harboring somatic DDR gene alterations, which have been associated with increased response rates to cisplatin-based chemotherapy and immunotherapy in more advanced scenarios [45]. Indeed, one recent study compared patients with de novo MIBC versus secondary MIBC (progressing after NMIBC) and demonstrated that patients with secondary MIBC were less likely to benefit from neoadjuvant chemotherapy prior to cystectomy [51]. Moreover, it was demonstrated that de novo MIBC tumors had a higher median mutation burden than secondary MIBC by targeted exon capture sequencing.
For patients with non-muscle invasive relapse or progression after BCG, combination strategies and/or targeted therapy could be effective. Since a significant proportion of patients with NMIBC harbor FGFR alterations (57.1% in our cohort), the use of FGFR inhibitors such as erdafitinib (already FDA approved for advanced disease), rogaratinib, pemigatinib and others, may also play a role and prospective studies evaluating this strategy are underway. In terms of combination therapies for BCG-treated NMIBC, potential synergistic approaches include anti-PD(L)1 combinations with BCG, radiation therapy, vaccines, and cytotoxic agents.
Lastly, in our cohort, age was associated with response to BCG immunotherapy when analyzed both as continuous and categorical variable. Patients older than 75 years old had increased RR in univariate, but not in multivariate analysis. Also, age above 75 years was independently associated with improved RFS in both univariate and multivariate analyses in our cohort. This finding contrast with previous reports that demonstrated worse outcomes in BCG treated patients older than 80 years old. This discrepancy may be related to the larger number of elderly patients in the BCG-R group and a higher TMB in older patients in our cohort. However, a mutational signature associated with ageing was detected in only 5.7% (2/35) of our patients (Fig. S6). Also Pietzak et al found that ARID1A mutations were significantly associated with an increased risk of recurrence after BCG immunotherapy [12], while Balbás-Martínez et al. observed that NMIBC with mutations in STAG2 gene are less likely to recur and progress to muscle invasion than NMIBC with wild-type STAG2 gene [35]. In our study, we were unable to confirm these findings and we did not find association between any specific gene alteration with BCG benefit.
There are many limitations to this single-centered retrospective study. First, we must emphasize that our analyses are exploratory due to its small sample size, low number of events and potential selection bias in our cohort due to the unavailability of high-quality DNA for successful WES. Second, it lacks a randomized control and an independent pathology review. It also does not contemplate factors associated with the tumor microenvironment and patient’s immunity that are also known to influence response to BCG immunotherapy. Third, matched germline DNA was not available to precisely determine the somatic nature of the reported mutations. To minimize this confounding factor, we filtered common germline variants using public databases of known human germline variants and removed recurrent variants resulting from sequencing and alignment artifacts. Although this approach is expected to remove most germline variants and artifacts, it does not efficiently remove rare polymorphisms restricted to small and specific populations. Since these rare polymorphisms account for a small fraction of the polymorphisms present in the human genome and are not frequent in racially mixed populations, we do not expect them to impact our results significantly. Finally, deleterious mutations in DDR genes were identified based on computational predictions only and the impact of mutations in different DDR genes described in this work are not likely to have an equivalent effect in DDR proficiency and TMB.
In conclusion, our most notable findings were the better outcomes after BCG therapy in patients with higher TMB. If these results are confirmed in larger cohorts, TMB could be the first predictive biomarker to BCG immunotherapy and hopefully will be integrated to other biomarkers to maximize the benefit to available therapies. We also provided indirect evidence that BCG may act by enhancing the recognition of neoantigens. Our results improve our understanding of the mechanisms behind BCG-mediated immunity and provide further support for clinical investigation of immune-checkpoint inhibitors in NMIBC. Future studies should consider collaborations with other centers to increase sample size and provide external validation.
ACKNOWLEDGMENTS
We thank Ramon T. do Carmo for helping with HLA typing and Dr. Jonathan E. Rosenberg for critically reading the manuscript.
FUNDING
This work was supported by Instituto Sírio Libanês de Ensino e Pesquisa, Ludwig Institute for Cancer Research and Fundação de Amparo à Pesquisa do Estado de São Paulo.
AUTHOR CONTRIBUTIONS
DAB and AAC conceived the study and drafted the manuscript. RLM, JMS, MZTL, and FB performed laboratory analyses. RB, FFS, VB, GWF, CM, and PAFG performed bioinformatics analyses. DAB, RLM, CD, DLJ, RC, LARF, MDC, WCN, ESM, RC, LFLR collected clinical information. All authors read and approved the final manuscript.
CONFLICT OF INTEREST
DAB declares having received research funding from Janssen, Astellas and Pfizer and honoraria from Janssen, Astellas, BMS, MSD, Roche and AstraZeneca.
CD declares having received travel support from MSD and Jansen as well as honoraria from Bayer, MSD and Janssen and virtual meeting support from MSD.
DLFJ declares having received speaker fees from Roche, Janssen, Astellas, MSD, Bristol-Myers Squibb and Libbs, as well as consultant fees from Janssen, Bristol-Myers Squibb and Libbs.
The other authors declare no competing personal or financial interests that could inappropriately influence, or be perceived to influence, the present work.
SUPPLEMENTARY MATERIAL
[1] The supplementary material is available in the electronic version of this article: https://dx.doi.org/10.3233/BLC-200289.
REFERENCES
[1] | Monteiro LL , Witjes JA , Agarwal PK , et al. ICUD-SIU International Consultation on Bladder Cancer management of non-muscle invasive bladder cancer. World J Urol. (2019) ;37: (1):51–60. |
[2] | Cambier S , Sylvester RJ , Collette L , et al. EORTC Nomograms and Risk Groups for Predicting Recurrence, Progression, and Disease-specific and Overall Survival in Non-Muscle-invasive Stage Ta-T1 Urothelial Bladder Cancer Patients Treated with 1–3 Years of Maintenance Bacillus Calmette-Guerin. Eur Urol. (2016) ;69: (1):60–9. |
[3] | Ourfali S , Ohannessian R , Fassi-Fehri H , et al. Recurrence Rate and Cost Consequence of the Shortage of Bacillus Calmette-Guerin Connaught Strain for Bladder Cancer Patients. Eur Urol Focus. (2019) ;S2405-4569: (19):30109–9. |
[4] | Kamat AM , Li R , O’Donnell MA , et al. Predicting Response to Intravesical Bacillus Calmette-Guerin Immunotherapy: Are We There Yet? A Systematic Review. Eur Urol. (2018) ;73: (5):738–48. |
[5] | Pettenati C , Ingersoll MA . Mechanisms of BCG immunotherapy and its outlook for bladder cancer. Nat Rev Urol. (2018) ;15: (10):615–25. |
[6] | Redelman-Sidi G , Glickman MS , Bochner BH . The mechanism of action of BCG therapy for bladder cancer–a current perspective. Nat Rev Urol. (2014) ;11: (3):153–62. |
[7] | Yarchoan M , Hopkins A , Jaffee EM . Tumor Mutational Burden and Response Rate to PD-1 Inhibition. N Engl J Med. (2017) ;377: (25):2500–1. |
[8] | Teo MY , Seier K , Ostrovnaya I , et al. Alterations in DNA Damage Response and Repair Genes as Potential Marker of Clinical Benefit From PD-1/PD-L1 Blockade in Advanced Urothelial Cancers. J Clin Oncol. (2018) ;36: (17):1685–94. |
[9] | Samstein RM , Lee CH , Shoushtari AN , et al. Tumor mutational load predicts survival after immunotherapy across multiple cancer types. Nat Genet. (2019) ;51: (2):202–6. |
[10] | Chan TA , Yarchoan M , Jaffee E , et al. Development of tumor mutation burden as an immunotherapy biomarker: utility for the oncology clinic. Ann Oncol. (2019) ;30: (1):44–56. |
[11] | Mouw KW , Goldberg MS , Konstantinopoulos PA , D’Andrea AD . DNA Damage and Repair Biomarkers of Immunotherapy Response. Cancer Discov. (2017) ;7: (7):675–93. |
[12] | Pietzak EJ , Bagrodia A , Cha EK , et al. Next-generation Sequencing of Nonmuscle Invasive Bladder Cancer Reveals Potential Biomarkers and Rational Therapeutic Targets. Eur Urol. (2017) ;72: (6):952–9. |
[13] | Meeks JJ , Carneiro BA , Pai SG , et al. Genomic characterization of high-risk non-muscle invasive bladder cancer. Oncotarget. (2016) ;7: (46):75176–84. |
[14] | D’Andrea D , Soria F , Abufaraj M , et al. Comparative Effectiveness of Intravesical BCG-Tice and BCG-Moreau in Patients With Non-muscle-invasive Bladder Cancer. Clin Genitourin Cancer. (2020) ;18: (1):20–25e2. |
[15] | Kamat AM , Sylvester RJ , Bohle A , et al. Definitions, End Points, and Clinical Trial Designs for Non-Muscle-Invasive Bladder Cancer: Recommendations From the International Bladder Cancer Group. J Clin Oncol. (2016) ;34: (16):1935–44. |
[16] | Li H , Durbin R . Fast and accurate short read alignment with Burrows-Wheeler transform. Bioinformatics. (2009) ;25: (14):1754–60. |
[17] | Li H , Handsaker B , Wysoker A , et al. The Sequence Alignment/Map format and SAMtools. Bioinformatics. (2009) ;25: (16):2078–9. |
[18] | McKenna A , Hanna M , Banks E , et al. The Genome Analysis Toolkit: a MapReduce framework for analyzing next-generation DNA sequencing data. Genome Res. (2010) ;20: (9):1297–303. |
[19] | Van der Auwera GA , Carneiro MO , Hartl C , et al. From FastQ data to high confidence variant calls: the Genome Analysis Toolkit best practices pipeline. Curr Protoc Bioinformatics. (2013) ;43: :11.10.1–11.10.33. |
[20] | Wang K , Li M , Hakonarson H . ANNOVAR: functional annotation of genetic variants from high-throughput sequencing data. Nucleic Acids Res. (2010) ;38: (16):e164. |
[21] | Tate JG , Bamford S , Jubb HC , et al. COSMIC: the Catalogue Of Somatic Mutations In Cancer. Nucleic Acids Res. (2019) ;47: (d1):D941–7. |
[22] | Lek M , Karczewski KJ , Minikel EV , et al. Analysis of protein-coding genetic variation in 60,706 humans. Nature. (2016) ;536: (7616):285–91. |
[23] | 1000 Genomes Project Consortium, Auton A , Brooks LD , et al. A global reference for human genetic variation. Nature. (2015) ;526: (7571):68–74. |
[24] | Lawrence MS , Stojanov P , Polak P , et al. Mutational heterogeneity in cancer and the search for new cancer-associated genes. Nature. (2013) ;499: (7457):214–8. |
[25] | Lee J , Lee AJ , Lee JK , et al. Mutalisk: a web-based somatic MUTation AnaLyIS toolKit for genomic, transcriptional and epigenomic signatures. Nucleic Acids Res. (2018) ;46: (W1):W102–8. |
[26] | Rizvi NA , Hellmann MD , Snyder A , et al. Cancer immunology. Mutational landscape determines sensitivity to PD-1 blockade in non-small cell lung cancer. Science. (2015) ;348: (6230):124–8. |
[27] | Chae YK , Anker JF , Carneiro BA , et al. Genomic landscape of DNA repair genes in cancer. Oncotarget. (2016) ;7: (17):23312–21. |
[28] | Singh Nanda J , Kumar R , Raghava GP . dbEM: A database of epigenetic modifiers curated from cancerous and normal genomes. Sci Rep. (2016) ;6: :19340. |
[29] | Adzhubei IA , Schmidt S , Peshkin L , et al. A method and server for predicting damaging missense mutations. Nat Methods. (2010) ;7: (4):248–9. |
[30] | Ng PC , Henikoff S . SIFT: Predicting amino acid changes that affect protein function. Nucleic Acids Res. (2003) ;31: (13):3812–4. |
[31] | Szolek A , Schubert B , Mohr C , et al. OptiType: precision HLA typing from next-generation sequencing data. Bioinformatics. (2014) ;30: (23):3310–6. |
[32] | Hundal J , Carreno BM , Petti AA , et al. pVAC-Seq: A genome-guided in silico approach to identifying tumor neoantigens. Genome Med. (2016) ;8: (1):11. |
[33] | Jurtz V , Paul S , Andreatta M , et al. NetMHCpan-4.0: Improved Peptide-MHC Class I Interaction Predictions Integrating Eluted Ligand and Peptide Binding Affinity Data. J Immunol. (2017) ;199: (9):3360–8. |
[34] | Nielsen M , Lundegaard C , Lund O , Kesmir C . The role of the proteasome in generating cytotoxic T-cell epitopes: insights obtained from improved predictions of proteasomal cleavage. Immunogenetics. (2005) ;57: (1-2):33–41. |
[35] | Balbas-Martinez C , Sagrera A , Carrillo-de-Santa-Pau E , et al. Recurrent inactivation of STAG2 in bladder cancer is not associated with aneuploidy. Nat Genet. (2013) ;45: (12):1464–9. |
[36] | Hurst CD , Alder O , Platt FM , et al. Genomic Subtypes of Non-invasive Bladder Cancer with Distinct Metabolic Profile and Female Gender Bias in KDM6A Mutation Frequency. Cancer Cell. (2017) ;32: (5):701–5e707. |
[37] | Nassar AH , Umeton R , Kim J , et al. Mutational Analysis of 472 Urothelial Carcinoma Across Grades and Anatomic Sites. Clin Cancer Res. (2019) ;25: (8):2458–70. |
[38] | Nordentoft I , Lamy P , Birkenkamp-Demtroder K , et al. Mutational context and diverse clonal development in early and late bladder cancer. Cell Rep. (2014) ;7: (5):1649–63. |
[39] | Campesato LF , Barroso-Sousa R , Jimenez L , et al. Comprehensive cancer-gene panels can be used to estimate mutational load and predict clinical benefit to PD-1 blockade in clinical practice. Oncotarget. (2015) ;6: (33):34221–7. |
[40] | van Dijk N , Funt SA , Blank CU , et al. The Cancer Immunogram as a Framework for Personalized Immunotherapy in Urothelial Cancer. Eur Urol. (2019) ;75: (3):435–44. |
[41] | Zahoor H , Grivas P . The Cancer Immunogram: A Pledge for a Comprehensive Biomarker Approach for Personalized Immunotherapy in Urothelial Cancer. Eur Urol. (2019) ;75: (3):445–7. |
[42] | Necchi A , Anichini A , Raggi D , et al. Pembrolizumab as Neoadjuvant Therapy Before Radical Cystectomy in Patients With Muscle-Invasive Urothelial Bladder Carcinoma (PURE-01): An Open-Label, Single-Arm, Phase II Study. J Clin Oncol. 2018;JCO1801148. |
[43] | Lattanzi M , Balar AV . Current Status and Future Direction of Immunotherapy in Urothelial Carcinoma. Curr Oncol Rep. (2019) ;21: (3):24. |
[44] | Kates M , Matoso A , Choi W , et al. Adaptive Immune Resistance to Intravesical BCG in Non-Muscle Invasive Bladder Cancer: Implications for Prospective BCG-Unresponsive Trials. Clin Cancer Res. (2020) ;26: (4):882–91. |
[45] | Balar AV , Kulkarni GS , Uchio EM , et al. Phase II trial of Pembrolizumab (pembro) for patients (pts) with high-risk (HR) nonmuscle invasive bladder cancer (NMIBC) unresponsive to bacillus calmette-guérin (BCG). J Clin Oncol. (2019) ;37: (7):350. |
[46] | Van Allen EM , Mouw KW , Kim P , et al. Somatic ERCC2 mutations correlate with cisplatin sensitivity in muscle-invasive urothelial carcinoma. Cancer Discov. (2014) ;4: (10):1140–53. |
[47] | Plimack ER , Dunbrack RL , Brennan TA , et al. Defects in DNA Repair Genes Predict Response to Neoadjuvant Cisplatin-based Chemotherapy in Muscle-invasive Bladder Cancer. Eur Urol. (2015) ;68: (6):959–67. |
[48] | Chae YK , Davis AA , Raparia K , et al. Association of Tumor Mutational Burden With DNA Repair Mutations and Response to Anti-PD-1/PD-L1 Therapy in Non-Small-Cell Lung Cancer. Clin Lung Cancer.88-96e. (2019) ;20: (6):86. |
[49] | Yin M , Grivas P , Emamekhoo H , et al. ATM/RB1 mutations predict shorter overall survival in urothelial cancer. Oncotarget. (2018) ;9: (24):16891–8. |
[50] | Yin M , Grivas P , Wang QE , et al. Prognostic Value of DNA Damage Response Genomic Alterations in Relapsed/Advanced Urothelial Cancer. Oncologist. 2020. |
[51] | Pietzak EJ , Zabor EC , Bagrodia A , et al. Genomic Differences Between “Primary” and “Secondary” Muscle-invasive Bladder Cancer as a Basis for Disparate Outcomes to Cisplatin-based Neoadjuvant Chemotherapy. Eur Urol. (2019) ;75: (2):231–9. |


