
CD8+ Cytotoxic Immune Infiltrate in Non-Muscle Invasive Bladder Cancer: A Standardized Methodology to Study Association with Clinico-Pathological Features and Prognosis
Abstract
Background:
Major interest lies in the evaluation of immune infiltrate in bladder cancer. CD8+ cytotoxic lymphocytes are key effectors of adaptive immune response.
Objectives:
The aims of the study were to set up a standardized methodology for CD8+ lymphocytes estimation in NMIBC and investigate how intra-tumoral heterogeneity influences CD8+ immune infiltrate.
Methods:
We considered 995 NMIBC included in the Spanish Bladder Cancer (SBC)/EPICURO Study. Duplicate 0.6 mm TMA spots and paired full sections (FS) for 50 selected cases were double stained with anti-pan cytokeratin antibody and anti-CD8 antibody. Slides were digitalized and CD8+ cells were automatically counted after tissue recognition (tumor vs stroma). Spatial heterogeneity was assessed and a resampling strategy was applied to estimate the proper number of 0.6 mm TMA spots providing an adequate CD8+ cell estimate. Association between CD8+ count and expression of urothelial differentiation markers was estimated. Cox regression models were performed to assess association between CD8+ cell count and risk of recurrence and progression.
Results:
Microscopic examination of full sections showed spatial heterogeneity for CD8+ infiltrates. Simulation analyses demonstrated that 5 TMA regions provided a correct sampling of tumor and stromal compartments in Ta while 2 and 6 TMA regions were necessary in T1, respectively. CD8+ cells infiltration was associated with stage, regardless of the histological compartment analyzed (median CD8 + /mm2 were 25/mm2 and 129/mm2 in tumor and stroma respectively in Ta and 111/mm2 and 344/mm2 in T1; p-value = 0.006). CD8+ infiltration in tumor compartment was significantly associated with low FGFR3 expression. CD8 + /mm2 count in the tumor compartment was not associated with prognosis.
Conclusion:
Differences identified between Ta and T1 tumours supported the hypothesis that rigorous efforts should be placed in proper study design. These results provide a new framework to investigate microenvironment complexity in bladder cancer.
INTRODUCTION
Recent successes in the usage of immune checkpoints inhibitors for cancer treatment have confirmed that restoration of antitumor immunity is a powerful anticancer strategy [1]. A key effector of adaptive cellular immune response are CD8+ lymphocytes that have the ability to exert cytotoxicity through different pathways [2, 3]. Consequently, major interest has emerged in assessing CD8+ immune cells. Numerous studies in different cancer types have shown association between CD8+ tumour infiltration and cancer prognosis [4]. In bladder cancer, characterization of immune microenvironment and assessment of association with prognosis has initially been done independently from molecular subtyping. Sharma and colleagues investigated in 2007 the prognosis of 69 bladder cancer and demonstrated that patients with muscle invasive bladder cancer (MIBC) had better prognosis when the tumours were associated with strong CD8+ tumour infiltration than their “low-infiltrated” counterparts [5]. Other authors studied association between CD8+ cells and prognosis in both MIBC and non-muscle invasive bladder cancers (NMIBC) with mitigated results [6]. Meanwhile, independent groups have described a molecular taxonomy of muscle invasive bladder cancer (MIBC) [7– 9]. Recently, the TCGA consortium reported 5 expression subtypes that may stratify response to different treatments [10]. Among subtypes, variable expression of urothelial differentiation markers and different association with immune cells infiltration (CD3, CD8, CD68) has been described [11]. These observations suggest possible associations between molecular subtyping and immune response triggering [12, 13]. While the molecular taxonomy of NMIBC was less investigated, some analogies with MIBC have already been demonstrated [14, 15], enhancing the interest in assessing the association between molecular subtyping and immune response also in NMIBC. More recently, Patschan et al. demonstrated that usage of both molecular subtyping and T cells immune-histochemical markers provided finer prognosis classification than the use of molecular subtypes alone [15].
However, proper evaluation of immune infiltrate is challenging. Methodological drawbacks limit the applicability of the study results and consensus is needed about how to best consider the immune response as a component of tumour sub-classification [6]. For instance, crucial questions such as the relevance of tumour micro arrays (TMA) for microenvironment assessment, the importance of normalization, and the potential variations between tumour and stromal infiltration have not been investigated. Due to the strong molecular heterogeneity of NMIBC and disrupted architecture after to trans urethral resection of the bladder (TURB), those challenges are even more considerable in those tumours than in MIBC.
The aims of the study were to set up a standardized methodology for CD8+ lymphocytes estimation in NMIBC and to investigate how intra-tumoral heterogeneity influences CD8 immune infiltrate assessment.
MATERIAL AND METHODS
Ethics statement
Signed informed consent was obtained from study participants in accordance with the Ethics Committees of each participating hospital.
Study population and tissue samples
We primarily considered 995 newly diagnosed patients with urothelial NMIBC included in the Spanish Bladder Cancer (SBC)/EPICURO Study, a multicentre hospital-based study conducted between 1997– 2001 in 18 hospitals [16]. Tumors were reviewed and confirmed by trained uropathologists who classified their stage and grade homogeneously using TNM 2018 AJCC, and both 1973 and 2004 WHO grade classifications. Clinical data and information on primary treatment was retrieved from the hospital charts by trained monitors using a structured questionnaire. Patients were followed up for > 10 years both using the hospital charts and through direct telephone calls to patients/families. The follow-up rate for NMIBC patients was 94%. One Formalin Fixed Paraffin Embedded (FFPE) block representative of each tumour was selected and used for TMA building using two 0.6 mm cores. TMA building was anterior to the present study. Each TMA was representative of one stage and grade. Two cores from the same patient were geometrically opposed on the TMA block. For 50 cases representative of each tumour stage and grade (8 TaG1, 7 TaG2, 6 TaG3, 4 T1G2 and 25 T1G3), the same initial block was used for full section study. Those cases were selected from the full cohort. We decided to over represent T1G3 tumors compared to the clinical distribution of NMIBC stages because we hypothesised that on a biological point of view, those tumors might be the one experiencing the highest level of infiltrate heterogeneity.
Immunohistochemistry and automated morphometry
Duplicate 0.6 mm TMA spots (all cases) and paired full sections (FS) for the 50 selected cases were double stained with anti-pan cytokeratine AE1-AE3 antibody cocktail to identify tumor cells and anti-CD8 antibody to identify cytotoxic T-cells. Double staining was performed using a Bond automated immunohistochemistry stainer from Leica Biosystems™, with monoclonal mouse anti- human CD8 antibody (clone C8/144B, 1/200, Dako, United States), and monoclonal mouse anti-human CKAE1/AE3 (clone AE1/AE3, 1/500 Dako, United States). Dewaxing, antigen retrieval and primary antibody dilution were performed using Bond – Dewax solution (ref. AR9222, Leica biosystem). Bond – Epitope retrieval solution (ref. AR9961, Leica biosystem) and Bond – Primary antibody diluent (Leica biosystem). Counter coloration was performed using Haematoxylin to visualize cell nucleus. Bluing reagent was incubated for 4 minutes. TMA sections were also stained for urothelial differentiation markers including GATA3 (mouse monoclonal Ab L50-823, BiocareMedical), and CK5/6 (mouse monoclonal Ab D5/16B4, Dako) and FGFR3 (mouse monoclonal Ab B-9 sc-13121, Santa Cruz).
All slides were digitalized using Aperio scanscope XT (Leica). The commercial Calopix™ software (Tribvn, France) was used for 1) tumour/stroma compartment delineating using colour recognition provided by tumour cell cytokeratin staining 2) automated CD8+ cells counting. Non-suitable areas with holes were retrieved automatically, tumour cell and stroma areas were identified differentially using the AE1AE3 staining. CD8+ cells were identified using a combination of colour, shape and size recognition, and cell density was computed as number of CD8+ cells/mm2 in tumour or stroma compartment respectively. For comparison purpose, CD8+ cells counting was also performed through human eye examination for all TMA cases with at least one spot available. GATA3 nuclear staining was determined automatically using Calopix software, FGFR3 and CK5/6 were assessed manually. The Quick Score (percentage stained cells×intensity ranging from 0 to 3) was computed for these 3 markers.
Statistical analyses
Spearman correlation was computed between manual and automated counting. CD8+ count/mm2 was computed as the mean value of 2 spots on TMA when 2 spots where available or absolute value of the unique available spot when only one spot was remaining after staining. On full section, CD8+ count was computed as the mean value for all the respective areas considered. A resampling strategy was applied to estimate the proper number of 0.6 mm TMA spots providing an adequate CD8+ cell estimate in comparison with full sections, as described before [17]. Briefly, number of CD8 was counted in up to 10 randomly selected regions in full sections. Area of the regions was similar to the area of a 0.6 mm TMA spot (0.28 mm2). 500 bootstrapped samples were generated to simulate estimation of CD8+ infiltrate according to the number of regions selected. To reflect CD8+ spatial heterogeneity in the tumor/stroma, the Inter Quartile Range (IQR) of these estimates was used as a measure of statistical dispersion (difference between upper and lower quartiles; Q3-Q1). The median IQR of the CD8+ count according to the number of regions analyzed were compared with the reference value obtained for 10 regions using Wilcoxon test. Numbers of CD8 + /mm2 were compared according to tumor stages (Ta/T1) and histological compartment (tumor/stroma) using Wilcoxon test and correlation between histological compartments was assessed through Spearman coefficient.
Association between CD8 count and protein expression of urothelial differentiation markers was performed using Kruskal-Wallis and logistic regression tests. The mean number of CD8/mm2 according to the 4 FGFR3 categories was compared using Kruskal-Wallis rank sum test. Time to first recurrence (TFR) was defined as time elapsed between first TURB and histological diagnosis of a new NMIBC of any stage/grade. Time to progression (TP) was defined as time between first TURB and a subsequent histological diagnosis of a MIBC, occurrence of metastasis, or death due to bladder cancer. Survival curves were modeled using Kaplan Meier method. Log rank test was performed to assess univariate differences between survivals. Cox proportional hazard regression was used to estimate the hazard ratio (HR) and 95% confidence intervals (95% CI) of the association between CD8 count and the outcomes of interest. Cox regression models were adjusted for classical clinico-pathological prognosticators for TFR and TP (Table S1). All analyses were run in R-language (http://www.R-project.org).
RESULTS
Standardized methodology for CD8+ lymphocytes estimation in bladder tumours
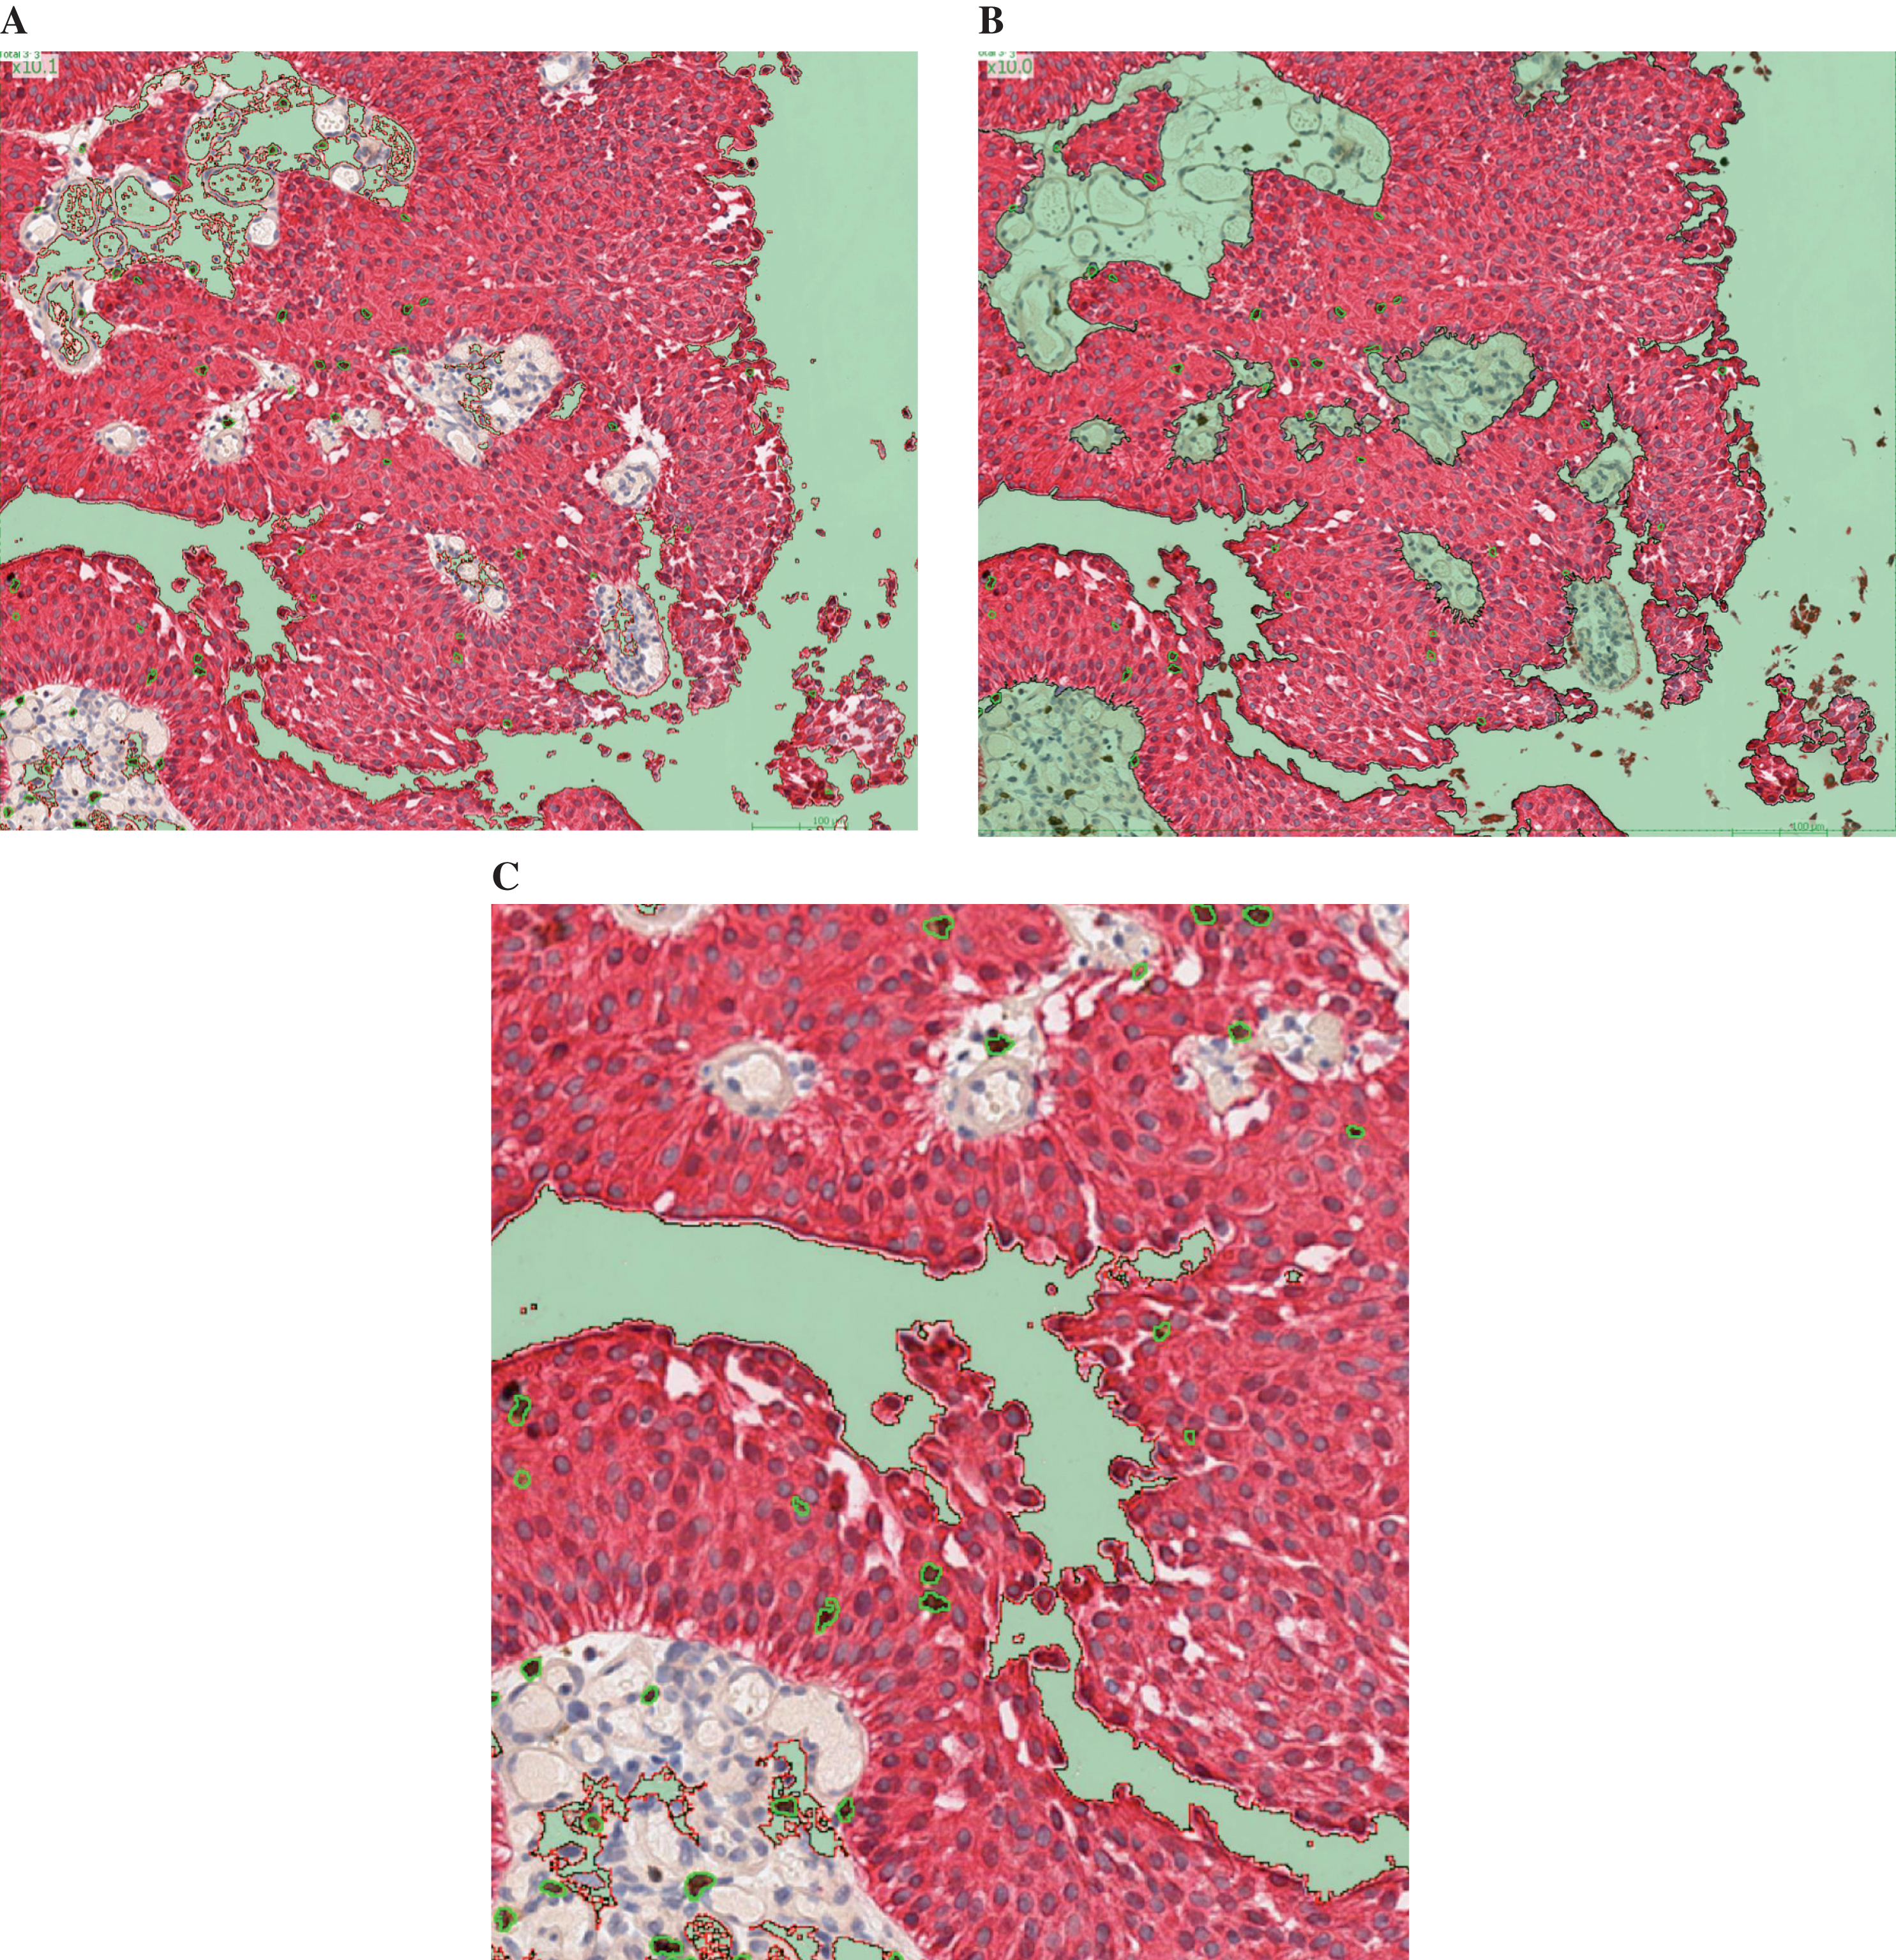
The automated morphometric approach allowed distinction between CD8+ lymphocytes in contact with tumour cells or scattered within stroma associated with tumour cells. The full tissue compartment (tumour + stroma) suitable for analysis was delimited first (Fig. 1A). Secondly, the tumour compartment was separated from the stroma compartment (Fig. 1B). CD8+ cells were automatically identified and counted within each histological compartment (tumour and stroma) (Fig. 1C). The surface of the tumour and stromal compartments were provided along with the CD8+ count, allowing further normalization to mm2. Spearman correlation coefficient between manual and automated counting was 0.88 validating the use of the software (Fig. S1).
Fig.1
After digitalization of the slides using the Aperio scanscope XT, Leica scanner, Calopix™ software (Tribvn, France) allowed background suppression (green) and separate recognition of tumour (pink) and stroma (white) (Fig. 1A). Secondly, the count could be performed exclusively in the tumour, suppressing the stroma (Fig. 1B). CD8+ cells were automatically identified using a combination of colour, shape and size recognition (see CD8+ cells circled in green, Fig. 1C).
Influence of tumor heterogeneity on CD8+ immune infiltrate assessment
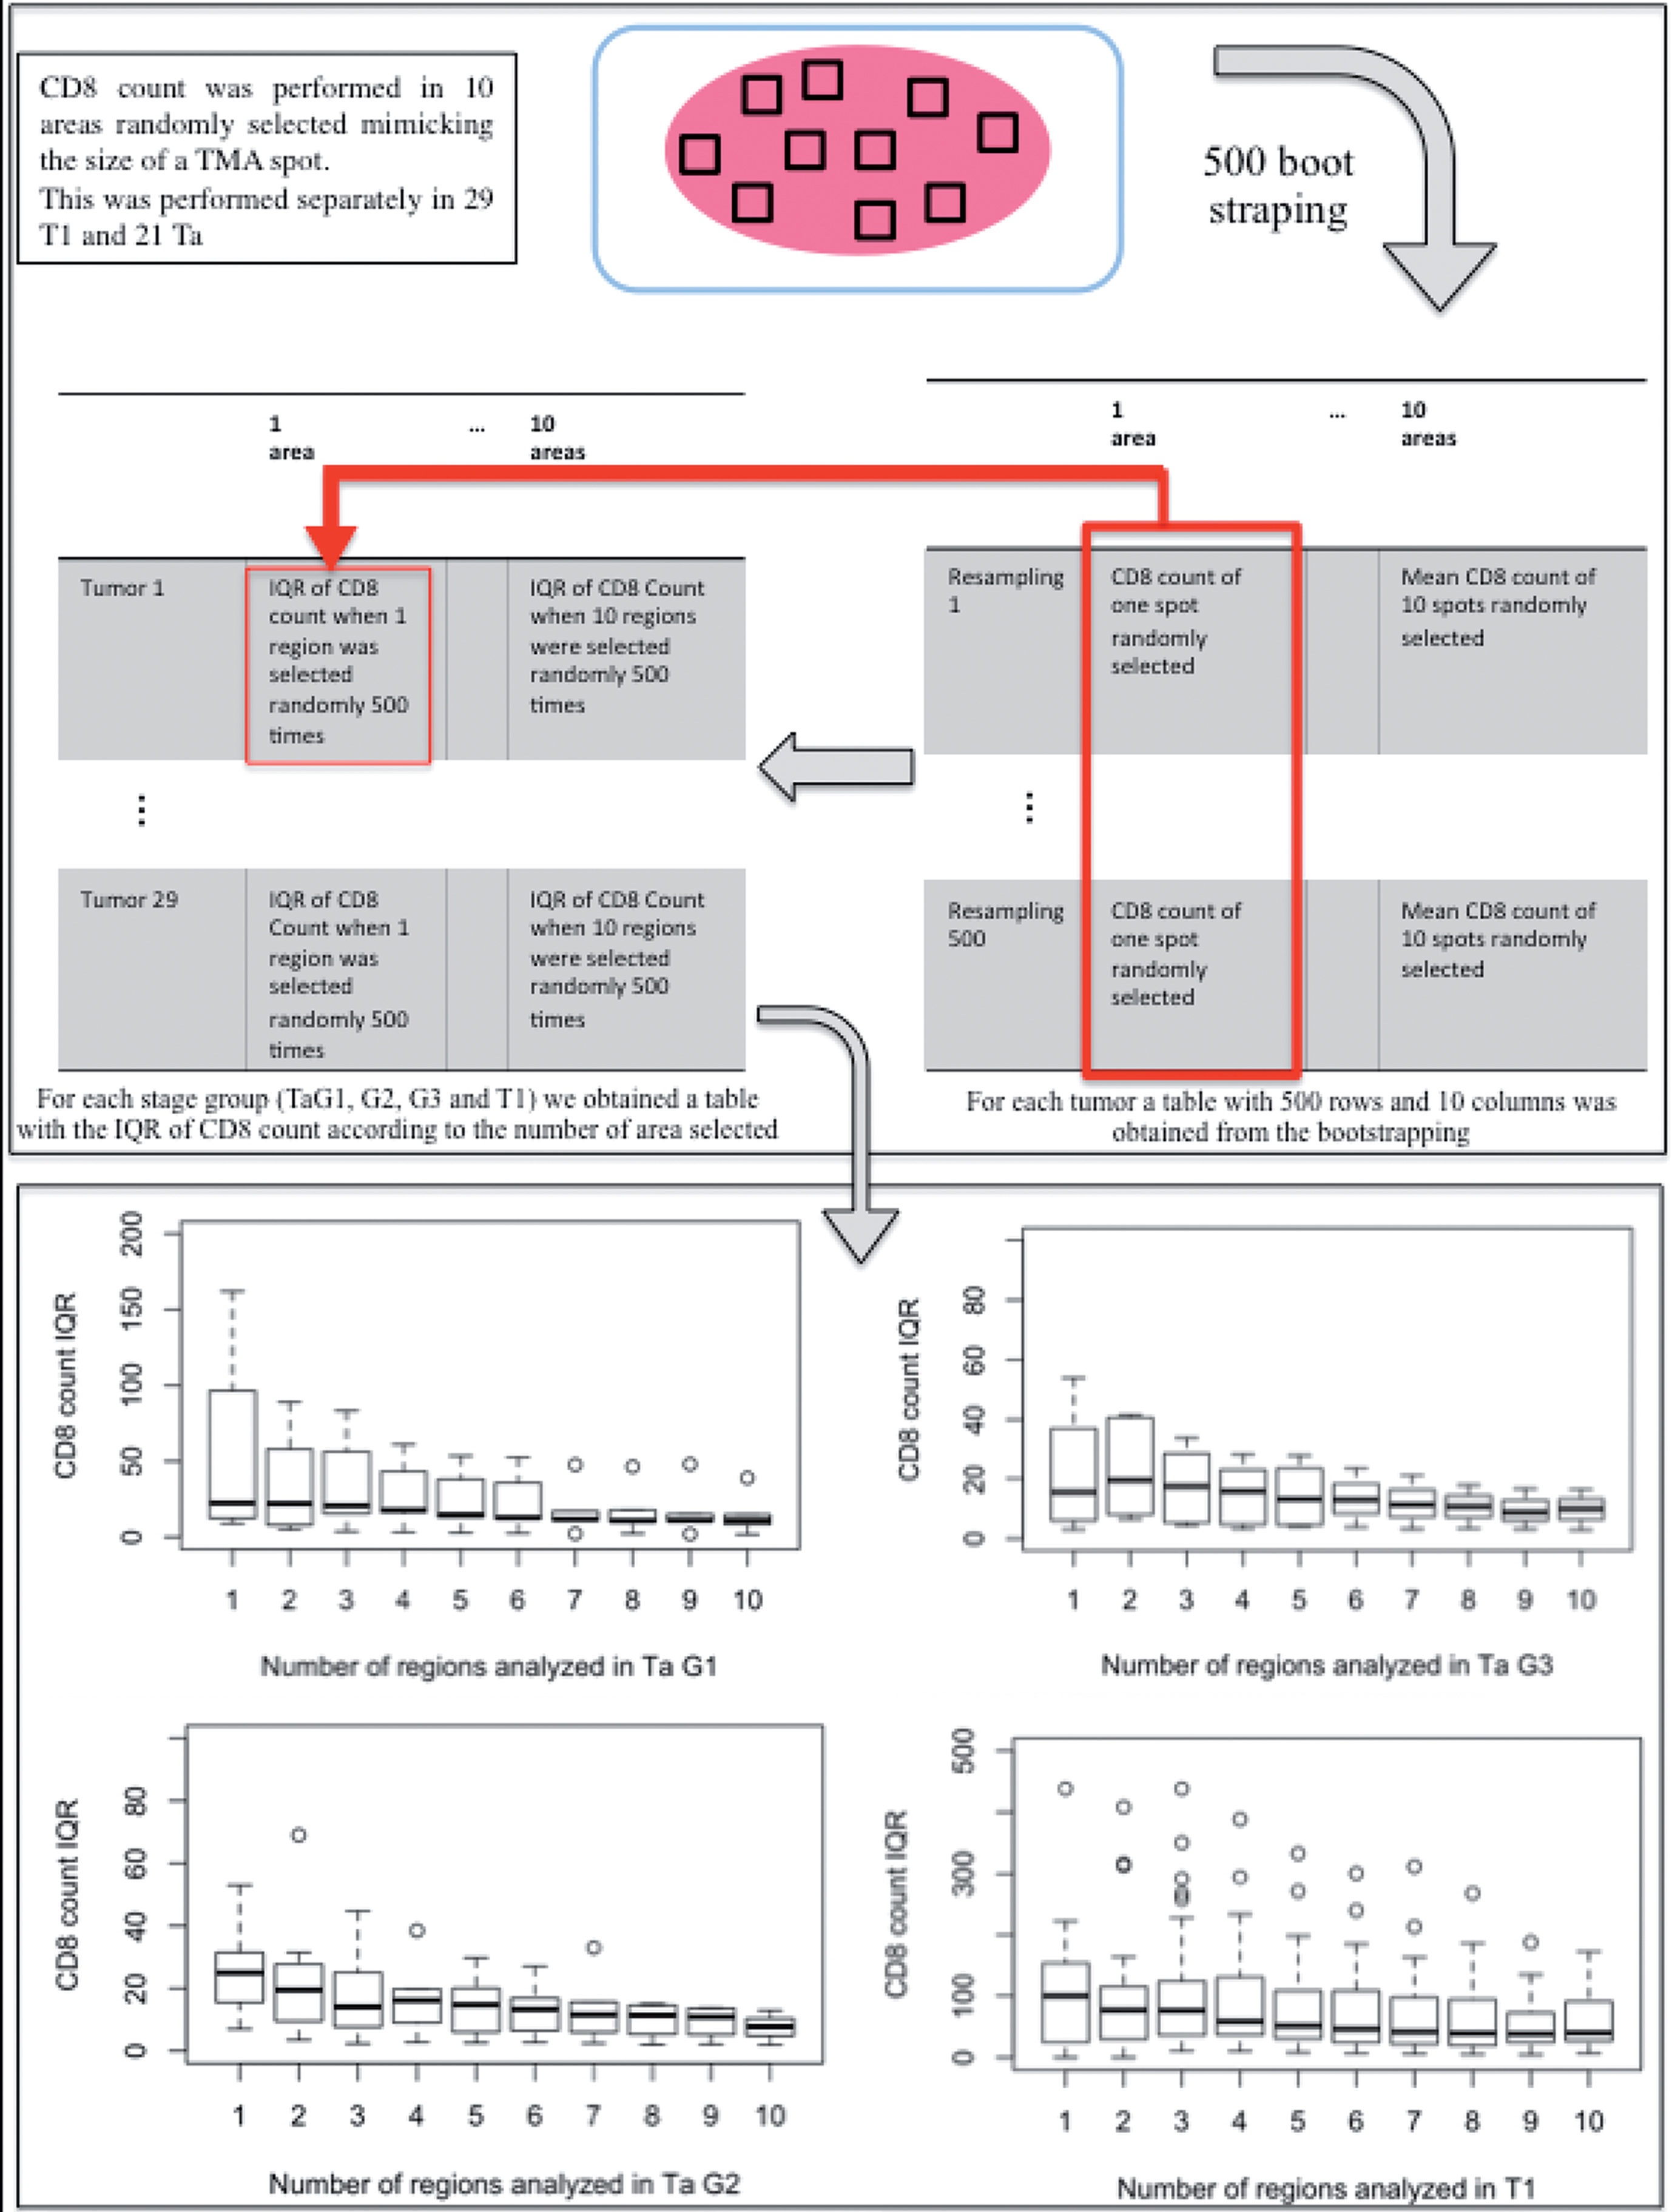
Microscopic examination of full sections was performed separately for 21 Ta and 29 T1 tumors. We visually identified spatial heterogeneity for CD8+ infiltrates questioning the use of TMA for CD8+ cells number assessment. Consequently, simulations were performed using bootstrapping to estimate the proper number of 0.6 mm TMA cores necessary for accurate CD8+ estimate, considering separately Ta and T1 tumors. Ten areas were randomly selected on full sections, each one mimicking the area of a 0.6 mm TMA spot (Fig. 2). CD8+ count / mm2 was estimated in each area. Using a 500 bootstrapping (resampling) strategy, a matrix simulating the CD8+ count according to the number of regions selected was constructed for each tumor (each row corresponding to a resampling round and each column to a number of areas selected, Fig. 2). Once the resampling strategy had been applied to each of the tumors, a second matrix was constructed for the full tumor cohort calculating the interquartile range of CD8+ count according to the number of areas considered (each row corresponding to a tumor and each column to a number of areas selected). Visualization of the IQR of CD8+ count in the tumor compartment was performed using boxplots (Fig. 2) and comparison of IQR distribution using Wilcoxon test between different numbers of regions selected (Table 1) demonstrated that 5 regions provided a precise sampling in Ta while only 2 regions were enough in T1. The same procedure was performed to assess heterogeneity in the stroma compartment (Table 1 and Fig. S2). In Ta tumors, stroma heterogeneity was comparable to the one observed in the tumor compartment with 5 regions necessary to obtain a precise sampling. In T1, the heterogeneity observed in the stroma compartment was much higher than the one in the tumor compartment with 6 regions necessary for precise sampling (Table 1).
Fig.2
Determining the optimal number of 0.6 mm TMA cores to sample. Each box plot is the distribution of the Interquartile range (IQR) of mean CD8+ infiltration calculated from 500 random observations of a specified number of regions. The variability decreases as the number of regions (figuring TMA cores) increases. By statistical comparison of IQR distributions, the minimal number of regions for an accurate estimate of CD8+ expression as compared with the standard was reached at 5 cores per tumour region in Ta and 2 cores in T1.
Moreover, examination of full sections demonstrated that the rate of CD8+ cells infiltration was associated with the stage, regardless of the histological compartment analyzed (tumor or stroma). We did not observe any accumulation of lymphocytes at the interface between tumor and stroma. Median numbers of CD8 + /mm2 in tumour compartment were 25/mm2 in Ta and 111/mm2 in T1 (p-value = 0.006). In Ta median number of CD8/mm2 in stroma was 129/mm2 while median number of CD8/mm2 in stroma in T1 was 344/mm2 (p-value = 0.005). Correlation coefficients between tumor and stroma CD8 count were 0.51 in Ta and 0.62 in T1 (Fig. 3). Correlation was moderate, demonstrating heterogeneity between tumour and stroma immune infiltrate.
Table 1
Results of the Wilcoxon test for comparison of the CD8+ count inter quartile range according to the number of regions selected on the FS slide
| 1 vs 10 areas | 2 vs 10 areas | 3 vs 10 areas | 4 vs 10 areas | 5 vs 10 areas | 6 vs 10 areas | 7 vs 10 areas | 8 vs 10 areas | 9 vs 10 areas | ||
| Tumor | p-value in Ta | 0.008 | 0.05 | 0.02 | 0.02 | 0.10 | 0.19 | 0.47 | 0.77 | 0.77 |
| p-value in T1 | 0.03 | 0.17 | 0.07 | 0.14 | 0.29 | 0.44 | 0.69 | 0.83 | 0.83 | |
| Stroma | p-value in Ta | 0.019 | 0.04 | 0.03 | 0.02 | 0.10 | 0.15 | 0.34 | 0.61 | 0.64 |
| p-value in T1 | <0.0001 | 0.0004 | 0.0004 | 0.001 | 0.02 | 0.05 | 0.21 | 0.49 | 0.89 |
Overall, 586 patients had at least one TMA core available for analysis (467 Ta, 115 T1 and 4 Tis). Patients’ characteristics are presented in Table 2. No significant differences were observed between those patients and the full SBC/EPICURO series except for grade (Chi square p = 0.0018 for the comparison between high and low risk patients distribution, Supplementary Table 1). As observed on full section, the CD8 + /mm² count in tumor compartment was significantly higher in T1 vs. Ta tumors (median CD8/mm² = 43/mm² in T1 vs 18/mm² in Ta, Table 3). Correlation coefficient between paired TMA and full section CD8+ count were 0.26 in Ta tumours vs 0.68 in T1 tumours, corroborating the inaccuracy of TMA for CD8+ cells count in Ta at individual level.
Fig.3
Correlation between tumour and stroma CD8+ count according to tumour stage (Ta vs T1). Each blue spot represents a patient. X-axis figures the CD8 count in the tumor and the Y-axis in the stroma.
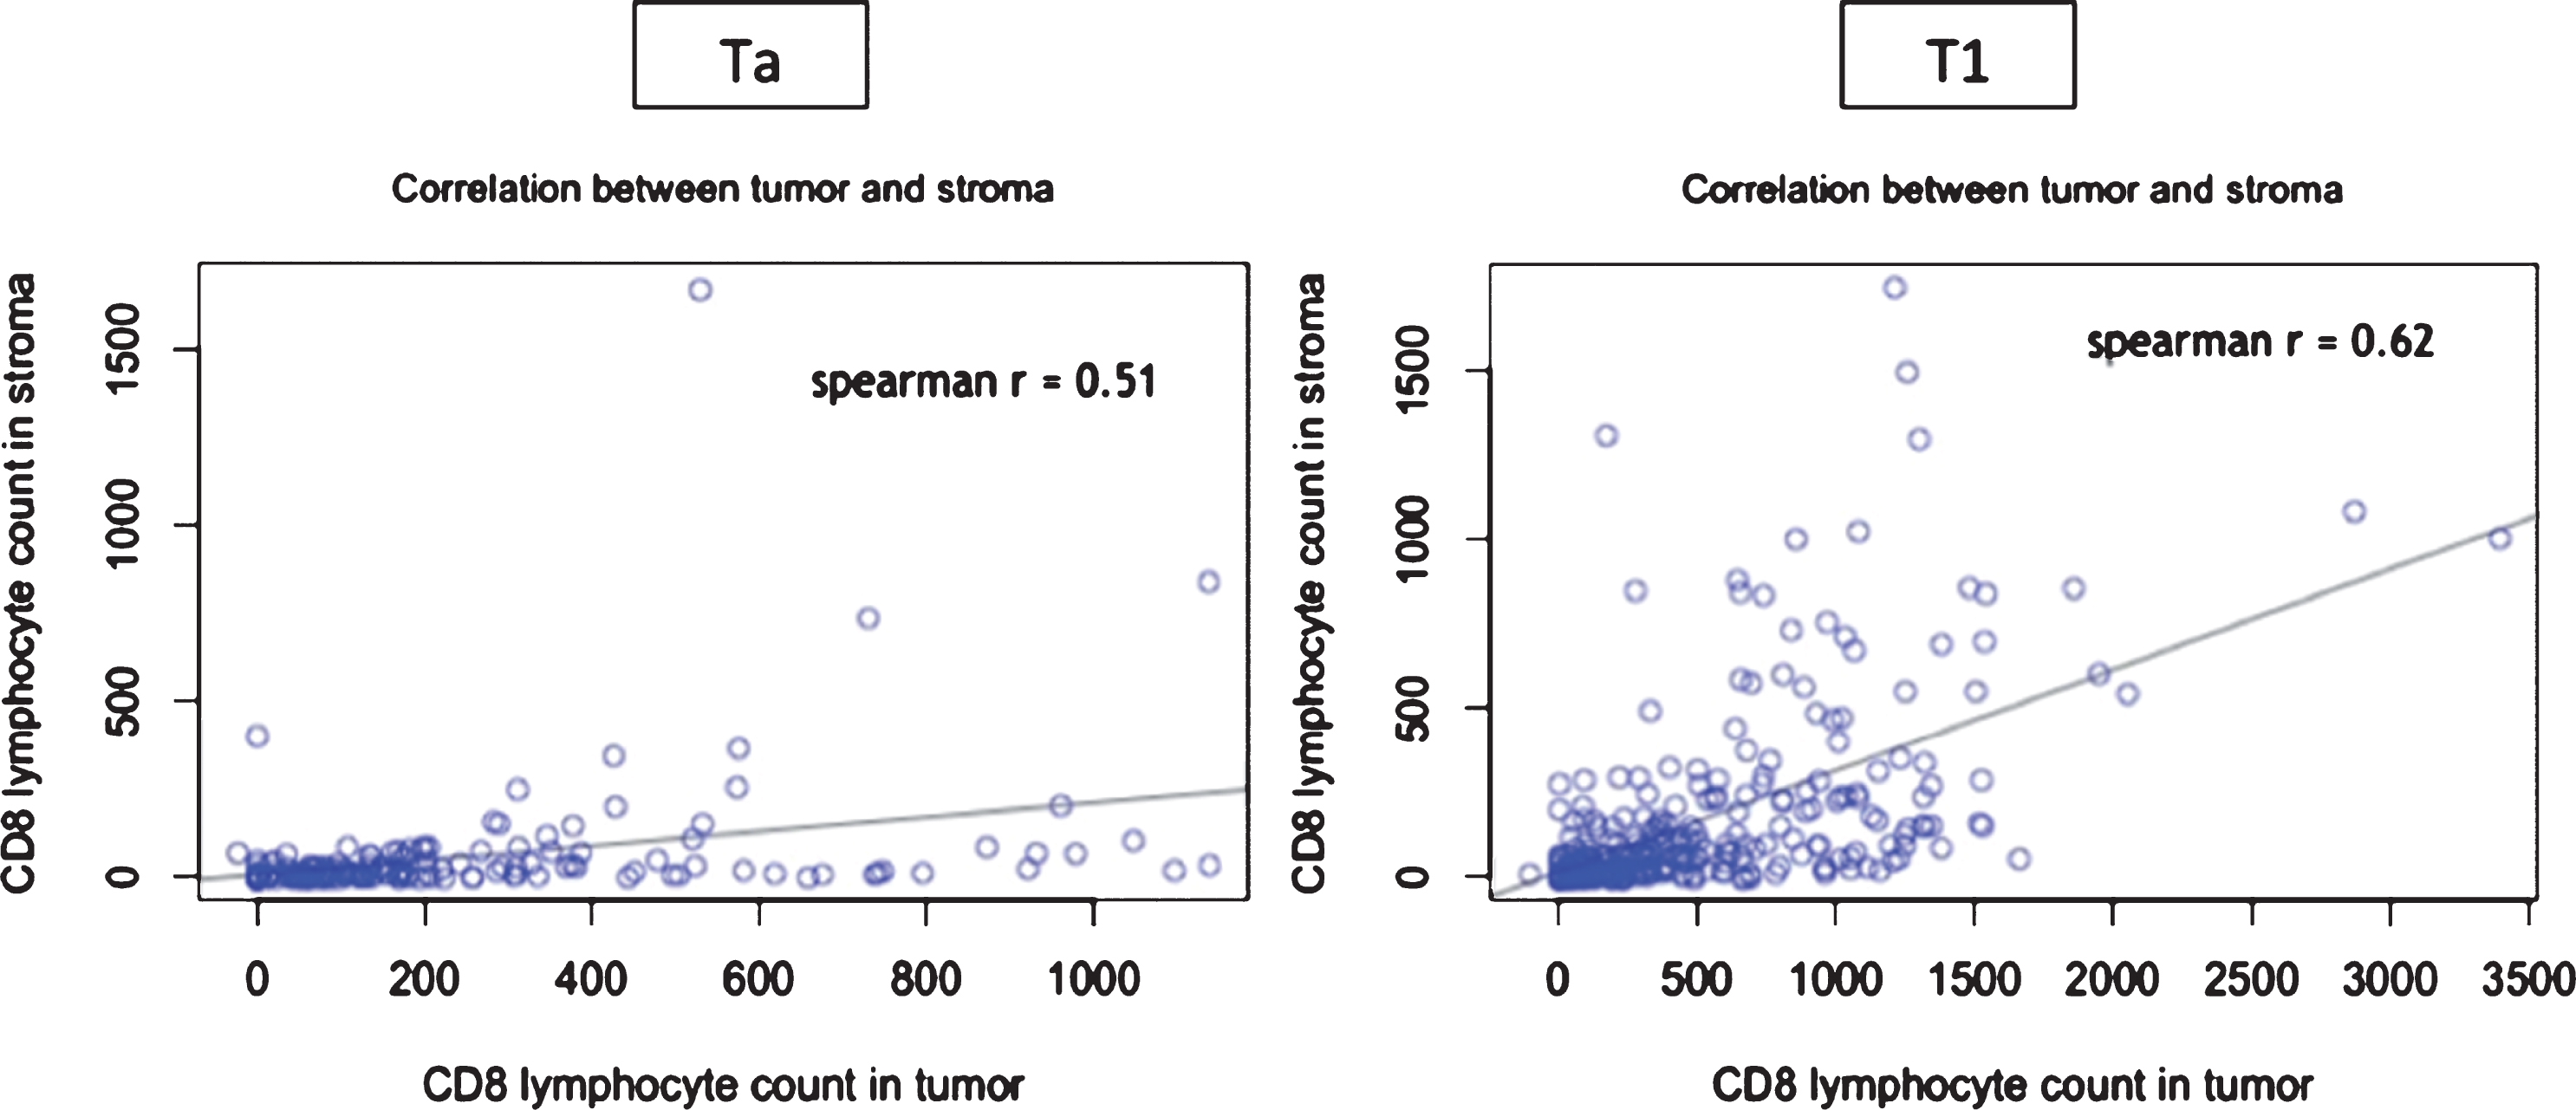
Table 2
Reduced cohort of patient characteristics
| Characteristics | N (%) |
| Total | |
| Age | 586 |
| Mean | 65.8 |
| Median | 68 |
| Min | 22 |
| Max | 80 |
| Gender | |
| Male | 517 (88%) |
| Female | 69 (12%) |
| Area | |
| 1 = Barcelona | 116 (20%) |
| 2 = Vallès | 97 (17%) |
| 3 = Elx | 56 (10%) |
| 4 = Tenerife | 117 (20%) |
| 5 = Astúries | 199 (34%) |
| Stage and Grade | |
| TaG1 | 179 (31%) |
| TaG2 | 214 (37%) |
| TaG3 | 74 (13%) |
| T1G2 | 13 (2%) |
| T1G3 | 102 (17%) |
| Tis | 4 (1%) |
| EORTC Risk | |
| High | 250 (43%) |
| Low | 336 (57%) |
| Multiplicity | |
| 1 tumor | 364 (62.1%) |
| ≥2 tumors | 187 (31.9%) |
| Missing | 35 (0.06%) |
| Size | |
| <3cm | 307 (52.4%) |
| ≥3cm | 114 (19.5%) |
| Missing | 165 (28.2%) |
| Traitement | |
| TURB alone | 222 (37.9%) |
| TURB + IC | 132 (22.5%) |
| TURB + BCG | 206 (35.2%) |
| Others | 26 (4.4%) |
| Number of CD8 / mm2 | |
| Mean +/– SD | 83.8 +/– 191.02 |
| Median [IQR] | 20.08 [0– 346.48] |
| Min | 0 |
| Max | 2029 |
Table 3
Comparison of median CD8+ count / mm2 in tumor and stroma in stage Ta and T1 tumors
| Ta | T1 | p-value | ||
| Tumor | FS | 25 | 111 | 0.006 |
| TMA | 18 | 43 | 0.001 | |
| Stroma | FS | 129 | 344 | 0.005 |
| TMA | NA | NA | NA |
FS = Full Section, TMA = Tumor Micro Array.
Association between CD8 + infiltrate and urothelial differentiation markers
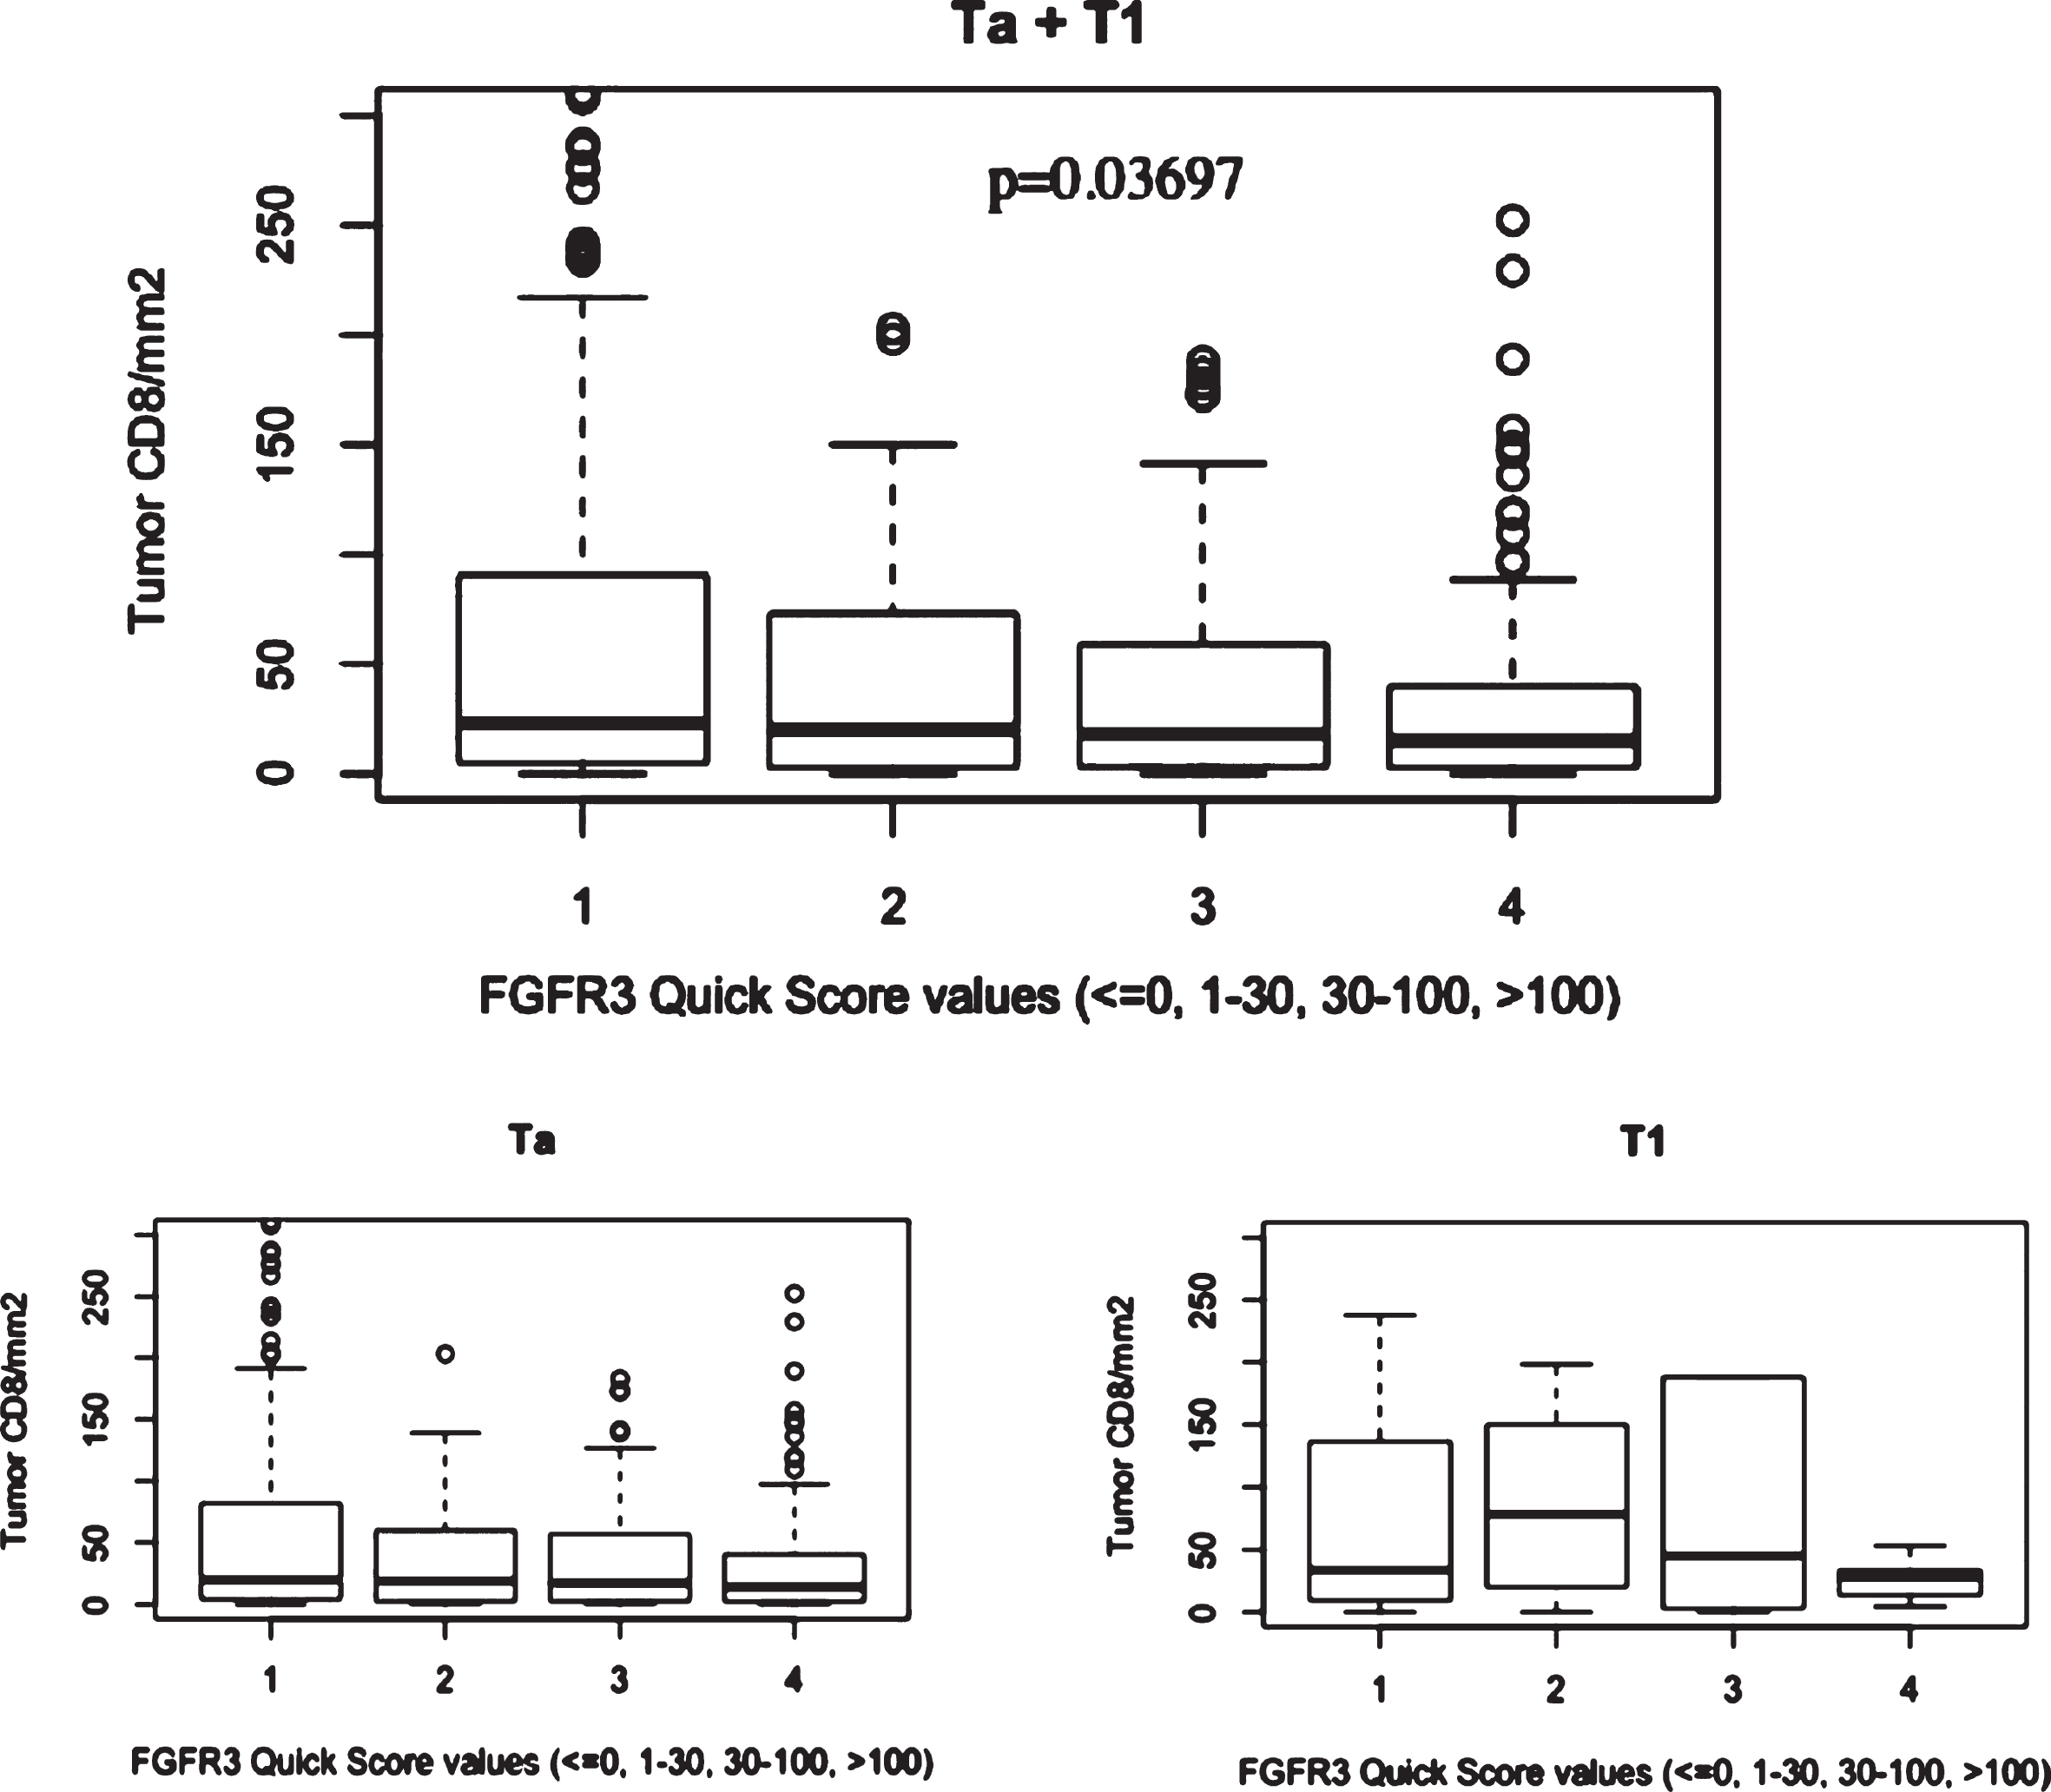
Distribution of FGFR3, GATA3 and CK5/6 expressions in the NMIBC series determined on the TMA cohort (Table 2) and were plotted through histograms presented in Supplementary Figure 3. No association was found between CD8+ count (assessed on the same tissue cores included in the TMA blocks) and GATA3 or CK5/6 expression, but CD8+ infiltration in tumor compartment was significantly associated with FGFR3 status with stronger infiltration seen in patients with low FGFR3 expression in tumor (Fig. 4). Logistic regression adjusted for stage demonstrated that the association between CD8+ count and FGFR3 expression was dependent from stage (p-value = 0.28).
Fig.4
Boxplots figuring mean CD8 + /mm2 count in the EPICURO cohort according to FGFR3 expression and stage.
Association between TMA CD8+ count and prognosis in T1 NMIBC
Based on results from the methodological part, association between CD8+ count in the tumor compartment and prognosis could be assessed using TMAs only in T1 tumors (N = 115) as tumors were sampled in TMA only by two cores maximum. Up to July 2007, mean follow-up period for patients “free of disease” was 82.7 months (2.5– 117.6 months). According to the abovementioned definitions, 55 (47.8%) patients suffered, at least, one event in the T1 cohort (23 recurrences and 32 progressions). Out of 115 T1 patients, 48 could not be included in the prognosis analysis as they had only one remaining spot available after staining. Number of CD8 + /mm2 was categorized in 2 groups according to the median value. Adjusted Cox regression analysis results for the T1 cohort are presented in Table S2. No association with recurrence or progression could be identified.
DISCUSSION
Activating anti-tumor immunity using attenuated BCG has been the baseline of high risk NMIBC treatment for decades [18]. With the approval of anti PDL1 therapies, metastatic MIBC treatment is being re-designed with possible usage of those drugs at earlier stages of the disease. Evading immune response is one of the hallmarks of cancer [19] and anti PD1/PDL1 therapies have the power of reactivating CD8+ T cells mediated anti-tumor activity with excellent response [20]. Consequently, assessing both the extent and the type of immune infiltrate in tumors could have major prognosis implications.
This study is the first to describe a standardized methodological process for tumor- or stroma associated CD8+ cytotoxic lymphocytes evaluation in urinary bladder cancer. Using tissue recognition approaches based on tumor cell pan-cytokeratin immunostaining and automated counting, we were able to normalize results to mm2 of tumor in TMA spots and full sections enabling easiest replication/validation. While the usage of TMAs allows sparing both time, resources and samples when studying large cohorts, no study ever demonstrated the applicability of TMA to immune infiltrate assessment. Resampling strategies allowed the identification of spatial heterogeneity in Ta tumors resulting in inaccuracy of CD8+ cells infiltration assessment based on 2 TMA spots (0.6 mm diameter). Consequently, correlation between CD8+ count in the tumour compartment on full section and TMA in Ta was very low (r = 0.26). For T1 tumours, 2 TMA spots were enough to reliably estimate the CD8+ associated with tumour compartment. We also demonstrated a moderate correlation between tumor and stroma CD8+ count on full sections both in Ta and T1 tumors indicating that tumor CD8+ count and stromal CD8+ count have to be performed separately. Overall, it results that spatial heterogeneity in NMIBC and a potential core selection bias have to be considered when assessing immune infiltrate on TMAs. While recommendation of systematic usage of full section is probably excessive, TMAs have to be designed keeping tissue heterogeneity in mind by increasing the number and the size of the spots. Tumor and stromal compartments should be assessed independently using full section or TMAs designed for micro environmental studies. The interest of separate counting between tumour and stromal compartments was recently confirmed at the biological level in a publication demonstrating that metastatic urothelial carcinoma commonly displays a strong CD8+ phenotype in the stroma while the tumour compartment is not infiltrated. Usage of anti TGFbeta antibody allowed T-cell penetration into the centre of tumours, and provoked vigorous anti-tumour immunity [21].
Many studies have already been published suggesting associations between CD3, CD8 and CD68 positive cells and bladder cancer prognosis [5, 22– 25]. Using a strong methodology we replicated some published results regarding CD8+ infiltrate. We confirmed previously observed association between CD8+ infiltration and stage. Pichler et al. recently described a highest CD3+, CD8+ and CD68+ T cells count in T1 tumours compared to Ta [26]. Area in which CD8+ cells were counted was unclear in their study (per high power fields/per tumour region) emphasizing the absolute need for standardization. The association between tumour stage and intensity of infiltrate may explain some of the prognosis associations found only in univariate analyses. Kitamura et al. found strong univariate association between CD8+ T cells infiltrate and recurrence free survival of NMIBC, but it was not identified anymore after adjustment for stage [27]. Sharma et al. failed to find association between CD8+ cells and disease free survival and overall survival in NMIBC but in a very limited series of cases [5]. Regarding prognosis, we were unable to identify association between CD8+ infiltrate and NMIBC risk of recurrence and progression. Based on results from the methodological part, we only used TMAs for prognosis evaluation in T1 for which two stained spots were available for assessment. Our results need to be interpreted cautiously because of limited sample size and contradictory results published recently [26, 28]. In general, the context in which the immune infiltrate is being assessed has to be taken into consideration when deciding on the best methodology to apply. At the individual level, prognosis prediction needs precision as classifying the patient in the wrong category could have major implications at the therapeutic level. On the other hand, some level of imprecision can be accepted when assessing the level infiltration in a large cohort. Indeed, in this study, the mean of CD8+ immune infiltrate was very close when evaluated on full section and on TMA. The very high number of patients available in the TMA cohort compensated for the imprecision in the CD8+ rate calculation at the individual level.
Moreover, considering only one cell subpopulation is clearly insufficient to get a complete insight into the processes of immune response. As suggested elsewhere, it is likely that the ratio between effector cells (CD8+), regulatory cells (FOXP3+) and tumour associated macrophages (CD68+) displays the better prognosis information [11, 26, 29]. Those three populations in the context of PD1/PDL1 expression all need to be assessed together using a well-defined methodology as described herein. At the biological level, the usage of the mean as reference value for CD8+ cells quantification could be questioned. In fact, using the maximum or minimum CD8+ value could be considered more relevant as a small component of “non-infiltrated “tumour cells could allow progression to higher stage and alter patient prognosis. However, we explored statistical association with prognosis using both the mean and minimum-maximum values (data not shown) that did not modify negative associations.
Finally we assessed association between CD8+ infiltrate and urothelial differentiation markers. Stage and histological compartment heterogeneity did not impact potential association since they were measured in the same tissue core and tumour compartment than CD8+ cells. Several studies recently described molecular subgroups of MIBC, each defined by different biomarkers and potential actionable targets [30]. Although those subgroups have been described using RNA expression profiles, they are associated with different marker expression patterns in immunohistochemistry. In our study, molecular sub-classification based on RNA expression was not available. Based on immunostaining as surrogate for molecular subgroups, we only identified reverse association between CD8 infiltration and FGFR3 expression. This association is dependent from stage as Ta tumours display a higher amount of FGFR3 mutations, but it is consistent with results published for FGFR3 activated MIBC that were reported to be not T cell inflamed in comparison with other molecular subtypes [13].
CONCLUSION
This study is the first to describe a robust and standardized methodological pipe-line for CD8+ cell assessment in bladder cancer. Differences identified between Ta and T1 tumours supported the hypothesis that rigorous efforts should be placed in proper study design. The association identified between CD8+ infiltrate and stage supports the usefulness of immune biomarkers in the management of patients, both for improved assessment of prognosis and to guide therapy. Researchers are only at the dawn of molecular subtyping of NMIBC and even though no clear association was identified between urothelial differentiation markers and CD8 infiltrate, integrated approaches need to be promoted to get a comprehensive insight into the biology of urothelial carcinomas.
FUNDING
The work was partially supported by Fondo de Investigaciones Sanitarias (FIS, #PI00-0745, #PI05-1436, and #PI06-1614) and Red Temática de Investigación Cooperativa en Cáncer (RTICC, #RD12/0036/0050 and #RD12/0036/0034), Instituto de Salud Carlos III; and Asociación Española Contra el Cáncer (AECC), Spain; the Intramural Research Program of the Division of Cancer Epidemiology and Genetics, National Cancer Institute, USA (Contract NCI NO2-CP-11015); and EU-FP7-HEALTH-F2-2008-201663-UROMOL and EU-7FP-HEALTH-TransBioBC #601933. AML was funded by a fellowship of the European Urological Scholarship Program from the European Association of Urology (EUSP Scholarship S-01-2013).
AUTHORS’ CONTRIBUTION
Alexandra Masson-Lecomte: conception, experiments, statistical analysis, interpretation of the data, paper redaction.
Pascale Maillé: conception, experiments
Silvia Pineda: statistical analysis, interpretation of the data
Pascale Soyeux: experiments
Ana Sagrera: experiments
Marta Rava: statistical analyses, interpretation of the data
Evangelina Lopez de Maturana: conception, satatistical analyses
Mirari Márquez: data mangement
Adonina Tardón: conception and management of the cohort
Alfredo Carrato: conception and management of the cohort
Manolis Kogevinas: conception and managemetn of the cohort
Alexandre de la Taille: interpretation of the data
Arndt Hartmann: conception, data interpretation
Núria Malats: conception, interpretation of the data, paper redaction, paper correction.
Paco Real: conception, interpretation of the data, paper redaction, paper correction
Yves Allory: conception, interpretation of the data, paper redaction, paper correction
CONFLICTS OF INTEREST
The authors have no conflicts of interest to report.
SUPPLEMENTARY MATERIAL
[1] The supplementary material is available in the electronic version of this article: http://dx.doi.org/10.3233/BLC-180206.
ACKNOWLEDGMENTS
The authors have no acknowledgments.
REFERENCES
[1] | Powles T , Eder JP , Fine GD , et al. MPDLA (anti-PD-L1) treatment leads to clinical activity in metastatic bladder cancer. Nature. (2014) ;515: :558–62. |
[2] | Antony PA , Piccirillo CA , Akpinarli A , et al. CD8+ T cell immunity against a tumor/self-antigen is augmented by CD4+ T helper cells and hindered by naturally occurring T regulatory cells. J Immunol. (2005) ;174: :2591–601. |
[3] | Dobrzanski MJ , Reome JB , Dutton RW . Type 1 and type 2 CD8+ effector T cell subpopulations promote long-term tumor immunity and protection to progressively growing tumor. J Immunol. (2000) ;164: :916–25. |
[4] | Gooden MJ , de Bock GH , Leffers N , et al. The prognostic influence of tumour-infiltrating lymphocytes in cancer: A systematic review with meta-analysis. Br J Cancer. (2011) ;105: :93–103. |
[5] | Sharma P , Shen Y , Wen S , et al. CD8 tumor-infiltrating lymphocytes are predictive of survival in muscle-invasive urothelial carcinoma. Proc Natl Acad Sci U S A. (2007) ;104: :3967–72. |
[6] | Masson-Lecomte A , Rava M , Real FX , et al. Inflammatory biomarkers and bladder cancer prognosis: A systematic review. Eur Urol. (2014) ;66: :1078–91. |
[7] | Cancer Genome Atlas Research N Comprehensive molecular characterization of urothelial bladder carcinoma. Nature. (2014) ;507: :315–22. |
[8] | Choi W , Porten S , Kim S , et al. Identification of distinct basal and luminal subtypes of muscle-invasive bladder cancer with different sensitivities to frontline chemotherapy. Cancer Cell. (2014) ;25: :152–65. |
[9] | Sjodahl G , Lauss M , Lovgren K , et al. A molecular taxonomy for urothelial carcinoma. Clin Cancer Res. (2012) ;18: :3377–86. |
[10] | Robertson AG , Kim J , Al-Ahmadie H , et al. Comprehensive Molecular Characterization of Muscle-Invasive Bladder Cancer. Cell. (2017) ;171: :540–556 e525. |
[11] | Sjodahl G , Lovgren K , Lauss M , et al. Infiltration of CD3(+) and CD68(+) cells in bladder cancer is subtype specific and affects the outcome of patients with muscle-invasive tumors. Urol Oncol. (2014) ;32: :791–7. |
[12] | Rosenberg JE , Hoffman-Censits J , Powles T , et al. Atezolizumab in patients with locally advanced and metastatic urothelial carcinoma who have progressed following treatment with platinum-based chemotherapy: A single-arm, multicentre, phase 2 trial. Lancet. (2016) ;387: :1909–20. |
[13] | Sweis RF , Spranger S , Bao R , et al. Molecular Drivers of the Non-T-cell-Inflamed Tumor Microenvironment in Urothelial Bladder Cancer. Cancer Immunol Res. (2016) ;4: :563–8. |
[14] | Hedegaard J , Lamy P , Nordentoft I , et al. Comprehensive Transcriptional Analysis of Early-Stage Urothelial Carcinoma. Cancer Cell. (2016) ;30: :27–42. |
[15] | Patschan O , Sjodahl G , Chebil G , et al. A Molecular Pathologic Framework for Risk Stratification of Stage T1 Urothelial Carcinoma. Eur Urol. (2015) ;68: :824–832; discussion 835–826. |
[16] | Garcia-Closas M , Malats N , Silverman D , et al. NAT2 slow acetylation, GSTM1 null genotype, and risk of bladder cancer: Results from the Spanish Bladder Cancer Study and meta-analyses. Lancet. (2005) ;366: :649–59. |
[17] | Rubin MA , Dunn R , Strawderman M , Pienta KJ . Tissue microarray sampling strategy for prostate cancer biomarker analysis. Am J Surg Pathol. (2002) ;26: :312–9. |
[18] | Lamm DL , Blumenstein BA , Crissman JD , et al. Maintenance bacillus Calmette-Guerin immunotherapy for recurrent TA, T1 and carcinoma in situ transitional cell carcinoma of the bladder: A randomized Southwest Oncology Group Study. J Urol. (2000) ;163: :1124–1129. |
[19] | Hanahan D , Coussens LM . Accessories to the crime: Functions of cells recruited to the tumor microenvironment. Cancer Cell. (2012) ;21: :309–22. |
[20] | Romano E , Romero P . The therapeutic promise of disrupting the PD-1/PD-L1 immune checkpoint in cancer: Unleashing the CD8 T cell mediated anti-tumor activity results in significant, unprecedented clinical efficacy in various solid tumors. J Immunother Cancer. (2015) ;3: :15. |
[21] | Mariathasan S , Turley SJ , Nickles D , et al. TGFbeta attenuates tumour response to PD-L1 blockade by contributing to exclusion of T cells. Nature. (2018) ;554: :544–8. |
[22] | Ayari C , LaRue H , Hovington H , et al. Bladder tumor infiltrating mature dendritic cells and macrophages as predictors of response to bacillus Calmette-Guerin immunotherapy. Eur Urol. (2009) ;55: :1386–95. |
[23] | Otto W , Denzinger S , Wieland WF , Hartmann A . First analysis of immune cell infiltration in stage pT1 urothelial bladder carcinoma: CD3 positivity as a prognostic marker for cancer-specific survival. World J Urol. (2012) ;30: :875–7. |
[24] | Sjodahl G , Lovgren K , Lauss M , et al. Infiltration of CD3 and CD68 cells in bladder cancer is subtype specific and affects the outcome of patients with muscle-invasive tumors. Urol Oncol. (2014) ;32: (6):791–7. |
[25] | Takayama H , Nishimura K , Tsujimura A , et al. Increased infiltration of tumor associated macrophages is associated with poor prognosis of bladder carcinoma in situ after intravesical bacillus Calmette-Guerin instillation. J Urol. (2009) ;181: :1894–900. |
[26] | Pichler R , Fritz J , Zavadil C , et al. Tumor-infiltrating immune cell subpopulations influence the oncologic outcome after intravesical bacillus calmette-guerin therapy in bladder cancer. Oncotarget. (2016) ;7: (26):39916–39930. |
[27] | Kitamura H , Torigoe T , Honma I , et al. Effect of human leukocyte antigen class I expression of tumor cells on outcome of intravesical instillation of bacillus calmette-guerin immunotherapy for bladder cancer. Clin Cancer Res. (2006) ;12: :4641–4. |
[28] | Faraj SF , Munari E , Guner G , et al. Assessment of tumoral PD-L1 expression and intratumoral CD8+ T cells in urothelial carcinoma. Urology. (2015) ;85: :703 e701–706. |
[29] | Horn T , Laus J , Seitz AK , et al. The prognostic effect of tumour-infiltrating lymphocytic subpopulations in bladder cancer. World J Urol. (2016) ;34: :181–7. |
[30] | Aine M , Eriksson P , Liedberg F , et al. On Molecular Classification of Bladder Cancer: Out of One, Many. Eur Urol. (2015) ;68: :921–3. |


