
A Gene Expression Signature Predicts Bladder Cancer Cell Line Sensitivity to EGFR Inhibition
Abstract
Background:
Bladder cancer remains a cancer type in need of novel and alternative therapies. While multiple inhibitors of EGFR have been evaluated for efficacy in bladder cancer, the results have largely been disappointing with few patients responding to these therapies. Yet, there is a subset of patients that positively responds to EGFR inhibition with tumor shrinkage, indicating it is an effective treatment for a targeted set of bladder tumors.
Objective:
To derive a gene expression signature capable of predicting the response to EGFR inhibition in bladder cancer cell lines.
Methods:
he response to cetuximab for 68 colorectal cancer patients was used as training data to generate a gene expression signature. We applied this signature to bladder cancer cell lines and predictions were compared to the responses to seven EGFR inhibitors.
Results:
A novel 67-gene signature derived from colorectal cancer was able to significantly identify bladder cancer cell lines by their response to several EGFR inhibitors.
Conclusions:
The 67-gene signature can determine bladder cancer cell line sensitivity to EGFR inhibition. This work demonstrates a preclinical strategy to identify bladder cancer cell lines for EGFR-targeted therapy.
INTRODUCTION
In the United States, bladder cancer accounts for roughly 79,000 new cancer cases and 17,000 cancer-related deaths, making it the 6th most common and 8th most deadly cancer type [1]. Current standards of care are the same cisplatin-based chemotherapy regimens that have been used for the past three decades, despite only having a 50% response rate [2–6]. Even with recent developments in immunotherapies [7], bladder cancer still represents a cancer type in need of more effective and diverse treatment options to improve patient outcomes.
The epidermal growth factor receptor (EGFR) represents a potential therapeutic target in bladder cancer. Targeting of EGFR using small molecule tyrosine kinase inhibitors (TKIs) or monoclonal antibodies are effective strategies in multiple cancer types, including lung, colorectal, and head and neck [8]. However, the EGFR alteration landscape differs across these cancer types. For example, activating mutations in non-small cell lung cancer have been found in one third of patients [9]. While these mutations are rare in colorectal, bladder, and head and neck cancers [10–14], EGFR copy number amplifications can be found in roughly 10% of colorectal [15–17], 9% of bladder [13] and 25% of head and neck cancers [18, 19]. Accordingly, the EGFR landscape in bladder cancer more closely resembles that in colorectal and head and neck cancers compared to non-small cell lung cancer.
Several clinical trials targeting EGFR have been performed in bladder cancer with mixed results. Two studies failed to find any benefit of adding the dual HER2 and EGFR TKI, lapatinib, or the EGFR-targeted monoclonal antibody, cetuximab to chemotherapy [20, 21]. However, several trials have found at least some bladder cancer patients benefit from EGFR inhibition [22–25]. Of 20 patients with stage T2 muscle-invasive bladder cancer receiving the EGFR-specific TKI, erlotinib, prior to radical cystectomy, 5 (25%) and 7 (35%) patient tumors were down-staged to pT0 or pT1, respectively, prior to surgery [24]. This study demonstrates the potential of erlotinib as a single agent to provide at least short-term benefit in the neoadjuvant setting for select group of patients with bladder cancer. Another promising trial evaluated the TKI, gefitinib, as a single agent for patients with metastatic bladder cancer who have progressed past first-line chemotherapy. In this trial, 3 of the 31 patients (9.7%) demonstrated stable disease or partial response [25]. Further pre-clinical work by Rebouissou, et al. [26] supports the findings that a subset of bladder cancers will likely be responsive to anti-EGFR therapy due to gains and activation of EGFR signaling.
These studies support the notion that there is a subset of patients that could benefit from targeted EGFR inhibition. Identifying these patients will be crucial for future clinical trials looking to advance the targeting of EGFR in bladder cancer. One potential approach to accomplish this is to use available data for patients treated with targeted EGFR inhibitors in another cancer type to develop a biomarker that identifies these bladder cancer patients. Large-scale, in vitro pharmacogenomic profiling experiments have revealed that biomarkers of therapeutic response developed in one cancer type can be effectively applied across multiple cancer types [27–29]. This notion is also gaining clinical support with clinical trials such as the NCI-MATCH trial, which uses a panel of single genomic biomarkers to identify therapies for cancer patients independent of cancer type [30].
The goal of this work is to develop a gene expression signature to predict response to EGFR inhibition in colorectal cancer that can be used to predict response to EGFR TKIs in bladder cancer cell lines. Colorectal cancer was chosen to build the predictive signature because of the similarities in EGFR alterations between colorectal and bladder cancer. We focus on EGFR TKIs because they have demonstrated the most effectiveness in bladder cancer clinical trials [24, 25] and because gene signatures have been show to be translatable for predicting both cetuximab and TKI response [31]. We demonstrate the effectiveness of this approach by applying our gene expression signature to predict responsiveness of bladder cancer cell lines to EGFR inhibition. Collectively, this work demonstrates increased potential for applying a gene expression signature developed in one cancer type to a second cancer type. Specifically, we demonstrate the effectiveness of a pre-clinical biomarker that at one point may advance the selection of bladder cancer patients for specific experimental therapy.
MATERIALS AND METHODS
Data preparation
We downloaded Affymetrix gene expression CEL files directly from Gene Expression Omnibus (GEO), containing 68 colorectal tumors with annotated clinical response (GSE5851, Human Genome U133A 2.0 Array) or from ArrayExpress (MTAB-783, GeneChip HT Human Genome U133A array) containing 17 bladder cancer cell lines [32, 33]. Note that we selected the 17 bladder cancer cell lines contained within the full compendium of cancer cell lines made available through the Genomics of Drug Sensitivity in Cancer (GDSC) [32, 33]. The Affymetrix CEL files of 33 bladder cancer cell lines were previously generated by the Theodorescu laboratory (BLA40, GSE5845, Human Genome U133A Array) [34, 35]. Note that we removed 7 cell lines from the BLA40 that are potentially contaminated by other cell lines to arrive at the 33 bladder cancer cell lines used in this study.
For each of the three datasets, we calculated gene expression values using the fRMA method in the ‘frma’ R package [36–39]. For the HT Human Genome U133A arrays, we used the “frozen parameters” available through the the R packages for the associated microarray platforms. For the U133A arrays, we used the ‘hgu133afrmavecs’ R package [41], and for the U133A 2.0 arrays, we used the ‘hgu133a2frmavecs’ R package [42]. All other fRMA parameters were kept as the default options. Probe set expression values were summarized as log2 of the expression intensity. We compiled an aggregate matrix of expression values across datasets using like probe sets and batch effects were removed using the ‘limma’ R package function ‘removeBatchEffect’ where the batches were defined as the 3 datasets [43]. Finally, gene expression values were calculated by averaging the probe sets that mapped to the same gene.
Generation of the EGFRi67 gene expression signature
According to the clinical annotations provided by Khambata-Ford, et al. [32], colorectal tumors with stable disease, partial response, or complete response following cetuximab treatment were classified as responsive. Of the 68 patients with gene expression and response information, 25 were classified as responsive and 43 were nonresponsive. We used the Prediction Analysis for Microarrays (PAM) method through the ‘pamr’ R package [44] to develop a gene signature for classifying patient response in the colorectal cancer data using the gene expression data as described in the previous section. We tested a range of 100 thresholds using the ‘pamr.train’ function and chose a threshold where the model fit provided the lowest error rate and greatest number of genes. This optimal threshold corresponded to a set of 67 genes. We chose this approach to select a threshold to avoid over fitting when applying the PAM model to new datasets. We named this model the EGFRi67 and we then used it to classify all of the samples in the combined gene expression dataset of bladder cancer cell lines and colorectal tumors. For figure display, the signature was visualized using Z-score transformation of the genes (mean-centered and divided by the standard deviation).
Prediction of cell line sensitivity by the EGFRi67
The EGFRi67 was used to predict EGFR sensitivity for the 17 and 33 bladder cancer cell lines of the GDSC and BLA40, respectively. The ‘pamr.predict’ function takes the EGFRi67 model fit and the matrix of compiled gene expression data as input. Predictions using PAM are made using nearest shrunken centroid classification as fully described in ref. [45]. Briefly, for the 68 colorectal samples, a standardized shrunken centroid is calculated for each class (i.e. response, nonresponse for this study) by taking the average expression for each gene in a class divided by the within-class standard deviation. The centroid is shrunk according to the threshold we identified. A new sample (bladder cancer cell line) is classified as the minimum of the squared distances to each centroid. The prior probability of a responder or nonresponder can be directly calculated from the colorectal data set (responder = 25/68; nonresponder = 43/68). The posterior probability for a new sample is calculated as a combination of the discriminant scores (squared distance to shrunken class centroid) and the prior probabilities. We report the posterior probability that a bladder cancer cell line is a responder, that is, the cell line is sensitive to EGFR inhibition.
Evaluation of the EGFRi67 in the GDSC
We classified the 17 bladder cancer cell lines of the GDSC by predicted EGFR sensitivity using the EGFRi67. We then compared the predictions to the IC50 values for the three tested TKIs specific to EGFR (gefitinib, erlotinib, and pelitinib), three TKIs against both EGFR and HER2 (afatinib, lapatinib, and CP724714) and one anti-EGFR antibody (cetuximab) [33]. The IC50 values for each drug and cell line were plotted according to their predicted EGFRi67 sensitivity. Because the direction of response (sensitive compared to resistant) was being tested, we performed statistical comparisons using a one-sided Wilcoxon rank sum test.
Drug enrichment analysis in the GDSC
We compared the median IC50 values for all 265 drugs in the GDSC across the EGFRi67 predicted sensitive and resistant groups. The drugs were then ranked according to their ratio of the median IC50 of the EGFRi67 predicted resistant cell lines compared to the median IC50 in the sensitive cell lines. Following the statistical approach used in Gene Set Enrichment Analysis (GSEA), we used the Kolmogorov Smirnov test (1000 permutations) to calculate the statistical enrichment of each pathway targeted by the drugs represented in the GDSC [46, 47].
Evaluation of the EGFRi67 in publically available bladder cancer cell line response to erlotinib and lapatinib
Previous studies determined the response of bladder cancer cell lines to lapatinib [35] and erlotinib [26]. We identified the overlap of the cell lines used in these two studies with the 33 bladder cancer cell lines from the BLA40 [34, 35] and found 13 lines that overlapped with the erlotinib data and 27 lines with the lapatinib data. As reported in refs. [26, 35], these bladder cancer cell lines fell into 3 groups of EGFR TKI response based on GI50: sensitive, intermediate, and resistant. For our purposes, we included the intermediate resistant cell lines in the resistant group. We used the EGFRi67 to predict cell line response to EGFR inhibition. For each of these drugs, we compared EGFRi67 predictions to their actual response using a Fisher’s exact test.
Cell culture and gefitinib dose response
The 12 bladder cancer cell lines used in this study to evaluate the response to gefitinib are described and documented in Refs. [34, 35]. Cell line authentication was confirmed by short tandem repeat profiling (PowerPlex® 16 HS System, Promega). To keep the concentration of gefitinib consistent, the same media, Minimum Essential Medium (Gibco) + 10% fetal bovine serum (Sigma-Aldrich) was used for all cell lines. Cells were grown in a humidified incubator containing 5% CO2 at 37°C. We treated each bladder cancer cell line with the indicated concentration of gefitinib (BIOTANG, Inc.) for 72 hours. We measured cell viability using a CellTiter-Glotrademark luminescent cell viability assay (Promega). We calculated dose response curves and GI50 concentrations for each line using the ‘drc’ R package [48]. Statistical comparisons were done using a one-side Wilcoxon rank sum test.
Molecular subtype classification of bladder cancer cell lines
Two studies in bladder cancer have identified two putative transcriptional subtypes in bladder cancers. Damrauer, et al. identified a 47-gene signature, the BASE47, which separated bladder tumors in proposed “basal-like” and “luminal” subtypes [54]. Rebouissou, et al. identified a 40-gene signature that separated bladder tumors into “basal-like” and “non-basal” subtypes [26]. We used each signature to select the associated genes from the combined dataset. Our data included 45 of the 47 genes of the BASE47 and all of the 40 genes from Rebouissou, et al. For clustering, each gene was Z-score transformed followed by hierarchical clustering (Pearson correlation and complete linkage) using the MultiExperiment Viewer software (MeV version 4.8.1) [49]. The putative clusters derived from hierarchical clustering were compared to the results in Damrauer, et al. and Rebouissou, et al. respectively to determine subtype classification. We then compared the subtype classifications from each gene signature to each other, followed by pharmacologic evaluation as described above for EGFRi67 predictions.
Code and data availability
Supplementary figures and tables, along with all code and necessary data to reproduce the results of the paper are publically accessible at: https://www.synapse.org/EGFRi67.
RESULTS
Defining the EGFRi67 gene expression signature
Gene expression signatures have been successfully used to predict response to cancer treatments, most often in the same cancer type in which the signature was derived [34, 50–53]. Importantly, and supporting the premise of this study, a gene expression signature generated using TKI response in lung cancer was able to predict cetuximab response in colorectal cancer [31]. This study demonstrates the translatability of a gene expression signature of response to both EGFR antibody and TKI therapeutics. Here, we expand on this body of work to focus on translating response of targeted EGFR inhibition in colorectal to bladder cancer.
Khambata-Ford, et al. produced a rich resource of 68 colorectal tumors with associated gene expression and patient response to cetuximab [32]. Using the well-established PAM method [44] and the data from Khambata-Ford, et al., we defined a 67-gene signature (Fig. 1 and Table 1), named EGFRi67 that classifies colorectal tumors by their response to cetuximab (Supplementary Table 1). When evaluated over the 68 colorectal patients using 10-fold cross validation, the average cross-validated accuracy was 0.78, suggesting that the gene expression data holds strong predictive power. The final model is shown in Fig. 1, including the expression profile of all 67 genes ranked on the posterior probability that the colorectal patient is a responder. To illustrate the impact of individual genes on the model predictions, we display the gene’s model weights (shrunken class centroids). The EGFRi67 signature includes the EGFR ligands AREG and EREG, consistent with the original analysis of the data [32]. Additional components of the gene signature consists of genes encoding two phosphatases of the MAPK pathway and several genes related to tyrosine kinase signaling, including FGFR3, LCK, AREG, and EREG.
Fig. 1
Stratification of colorectal cancer using the EGFRi67 gene signature. The EGFRi67 signature classified 68 colorectal tumors by their response to cetuximab [32]. Predicted and actual responses are shown at the top. The gene expression data, shown at the bottom, was Z-score transformed. The gene weights (shrunken class centroids) are shown at the right.
![Stratification of colorectal cancer using the EGFRi67 gene signature. The EGFRi67 signature classified 68 colorectal tumors by their response to cetuximab [32]. Predicted and actual responses are shown at the top. The gene expression data, shown at the bottom, was Z-score transformed. The gene weights (shrunken class centroids) are shown at the right.](https://content.iospress.com:443/media/blc/2018/4-3/blc-4-3-blc170161/blc-4-blc170161-g001.jpg)
Table 1
The nearest shrunken centroids derived from the PAM algorithm. These genes define the EGFRi67 signature
| Gene | Nonresponsive | Responsive |
|---|---|---|
| EREG | −0.1466 | 0.2521 |
| CKB | −0.09 | 0.1548 |
| MME | −0.0808 | 0.1389 |
| SLC26A2 | −0.0712 | 0.1225 |
| AREG | −0.0671 | 0.1154 |
| PCP4 | −0.0657 | 0.1131 |
| TAC1 | −0.0602 | 0.1035 |
| ACE2 | −0.0577 | 0.0992 |
| LY6G6D | −0.0561 | 0.0965 |
| VAV3 | −0.0467 | 0.0804 |
| NKX2-1 | −0.0437 | 0.0751 |
| CTSL2 | −0.0426 | 0.0732 |
| SCRN1 | −0.0379 | 0.0651 |
| SLC39A2 | −0.0338 | 0.0581 |
| FGFR3 | −0.0338 | 0.0581 |
| PLAGL2 | −0.0298 | 0.0513 |
| FABP3 | −0.0291 | 0.05 |
| HAVCR1 | −0.0284 | 0.0489 |
| PTP4A3 | −0.0249 | 0.0429 |
| GGH | −0.0233 | 0.0402 |
| KCNK5 | −0.0211 | 0.0363 |
| GZMB | −0.0197 | 0.0338 |
| UGT2B17 | −0.0186 | 0.0319 |
| ProSAPiP1 | −0.0141 | 0.0243 |
| LRRC31 | −0.0114 | 0.0197 |
| ELF5 | −0.0089 | 0.0152 |
| SNCAIP | −0.0077 | 0.0132 |
| SLC5A6 | −0.0075 | 0.013 |
| EPB41L4B | −0.0054 | 0.0094 |
| NINL | −0.0019 | 0.0033 |
| SLC11A2 | −0.0016 | 0.0028 |
| HAS2 | −0.0015 | 0.0025 |
| SEMA5A | 0 | 1.00E-04 |
| ABHD2 | 0.0013 | −0.0022 |
| IL13RA1 | 0.0035 | −0.006 |
| PRKCDBP | 0.0038 | −0.0065 |
| FAM114A1 | 0.004 | −0.0069 |
| DUSP6 | 0.0059 | −0.0101 |
| C16orf62 | 0.0073 | −0.0125 |
| LMO4 | 0.0073 | −0.0126 |
| LCK | 0.0074 | −0.0127 |
| IGSF6 | 0.0078 | −0.0134 |
| TIMP2 | 0.008 | −0.0138 |
| INPP1 | 0.0089 | −0.0154 |
| NAT1 | 0.01 | −0.0172 |
| CCL8 | 0.0109 | −0.0187 |
| KIAA0802 | 0.0132 | −0.0227 |
| PHLDA1 | 0.0138 | −0.0237 |
| WDR44 | 0.0138 | −0.0238 |
| ATP6V1B2 | 0.017 | −0.0293 |
| WASF1 | 0.0176 | −0.0303 |
| DPYSL2 | 0.0189 | −0.0325 |
| PITPNC1 | 0.0194 | −0.0334 |
| PLK2 | 0.0244 | −0.042 |
| KLK10 | 0.0261 | −0.0448 |
| BNIP3L | 0.028 | −0.0482 |
| DDX60 | 0.0343 | −0.0589 |
| FCGR2B | 0.0351 | −0.0604 |
| AKAP12 | 0.0378 | −0.0651 |
| LYZ | 0.0431 | −0.0741 |
| BHLHE41 | 0.0449 | −0.0772 |
| TPK1 | 0.0519 | −0.0893 |
| DUSP5 | 0.0534 | −0.0918 |
| ETV5 | 0.0683 | −0.1175 |
| TBXAS1 | 0.0751 | −0.1292 |
| DUSP4 | 0.0813 | −0.1398 |
| NT5E | 0.1632 | −0.2808 |
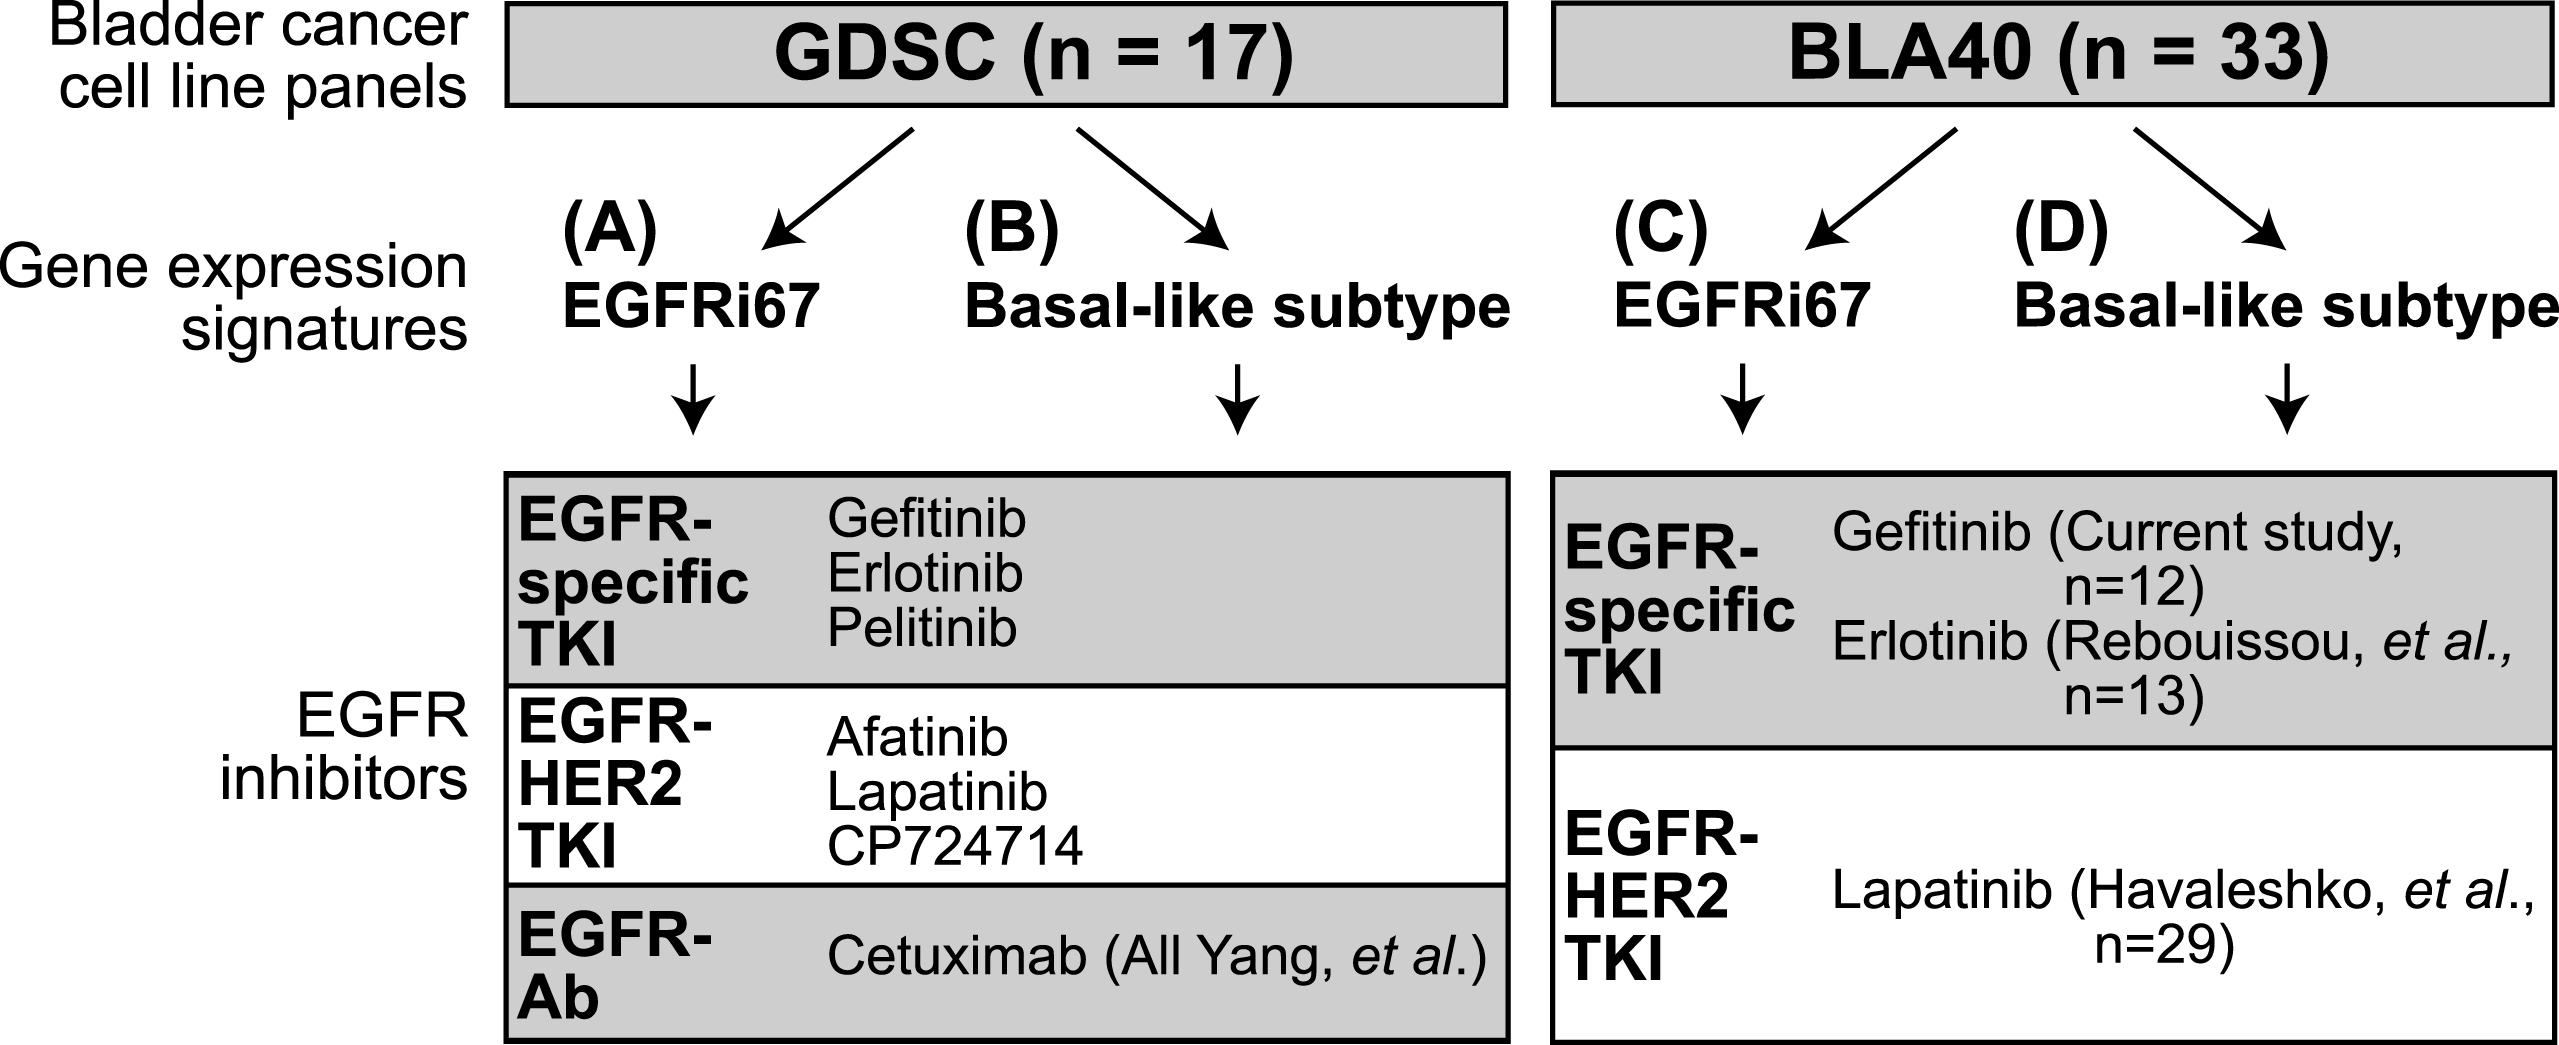
To evaluate the effectiveness of the EGFRi67, we applied it to two independently generated bladder cancer cell lines panels, 33 lines from the BLA40 panel [34, 35] and 17 bladder lines from the GDSC [33]. Figure 2 captures the cell lines and the 7 EGFR inhibitors evaluated in this study. In addition to the EGFRi67 (Fig. 2A, C), we evaluate the basal-like subtype (Fig. 2B, D) because basal-like bladder cancer cell lines were shown to be more sensitive to EGFR inhibition [26].
Fig. 2
Experimental outline of the study. Two bladder cancer cell line panels were classified using gene expression signatures. The EGFRi67 was applied to the (A) GDSC and the (C) BLA40 to predict EGFR sensitivity. Two subtype gene expression signatures were used to identify basal-like bladder cancer cell lines in the (B) GDSC and (D) BLA40. Each classification was then compared to the responses of the listed EGFR inhibitors.
Evaluation of the EGFRi67 in bladder cancer cell lines from the GDSC
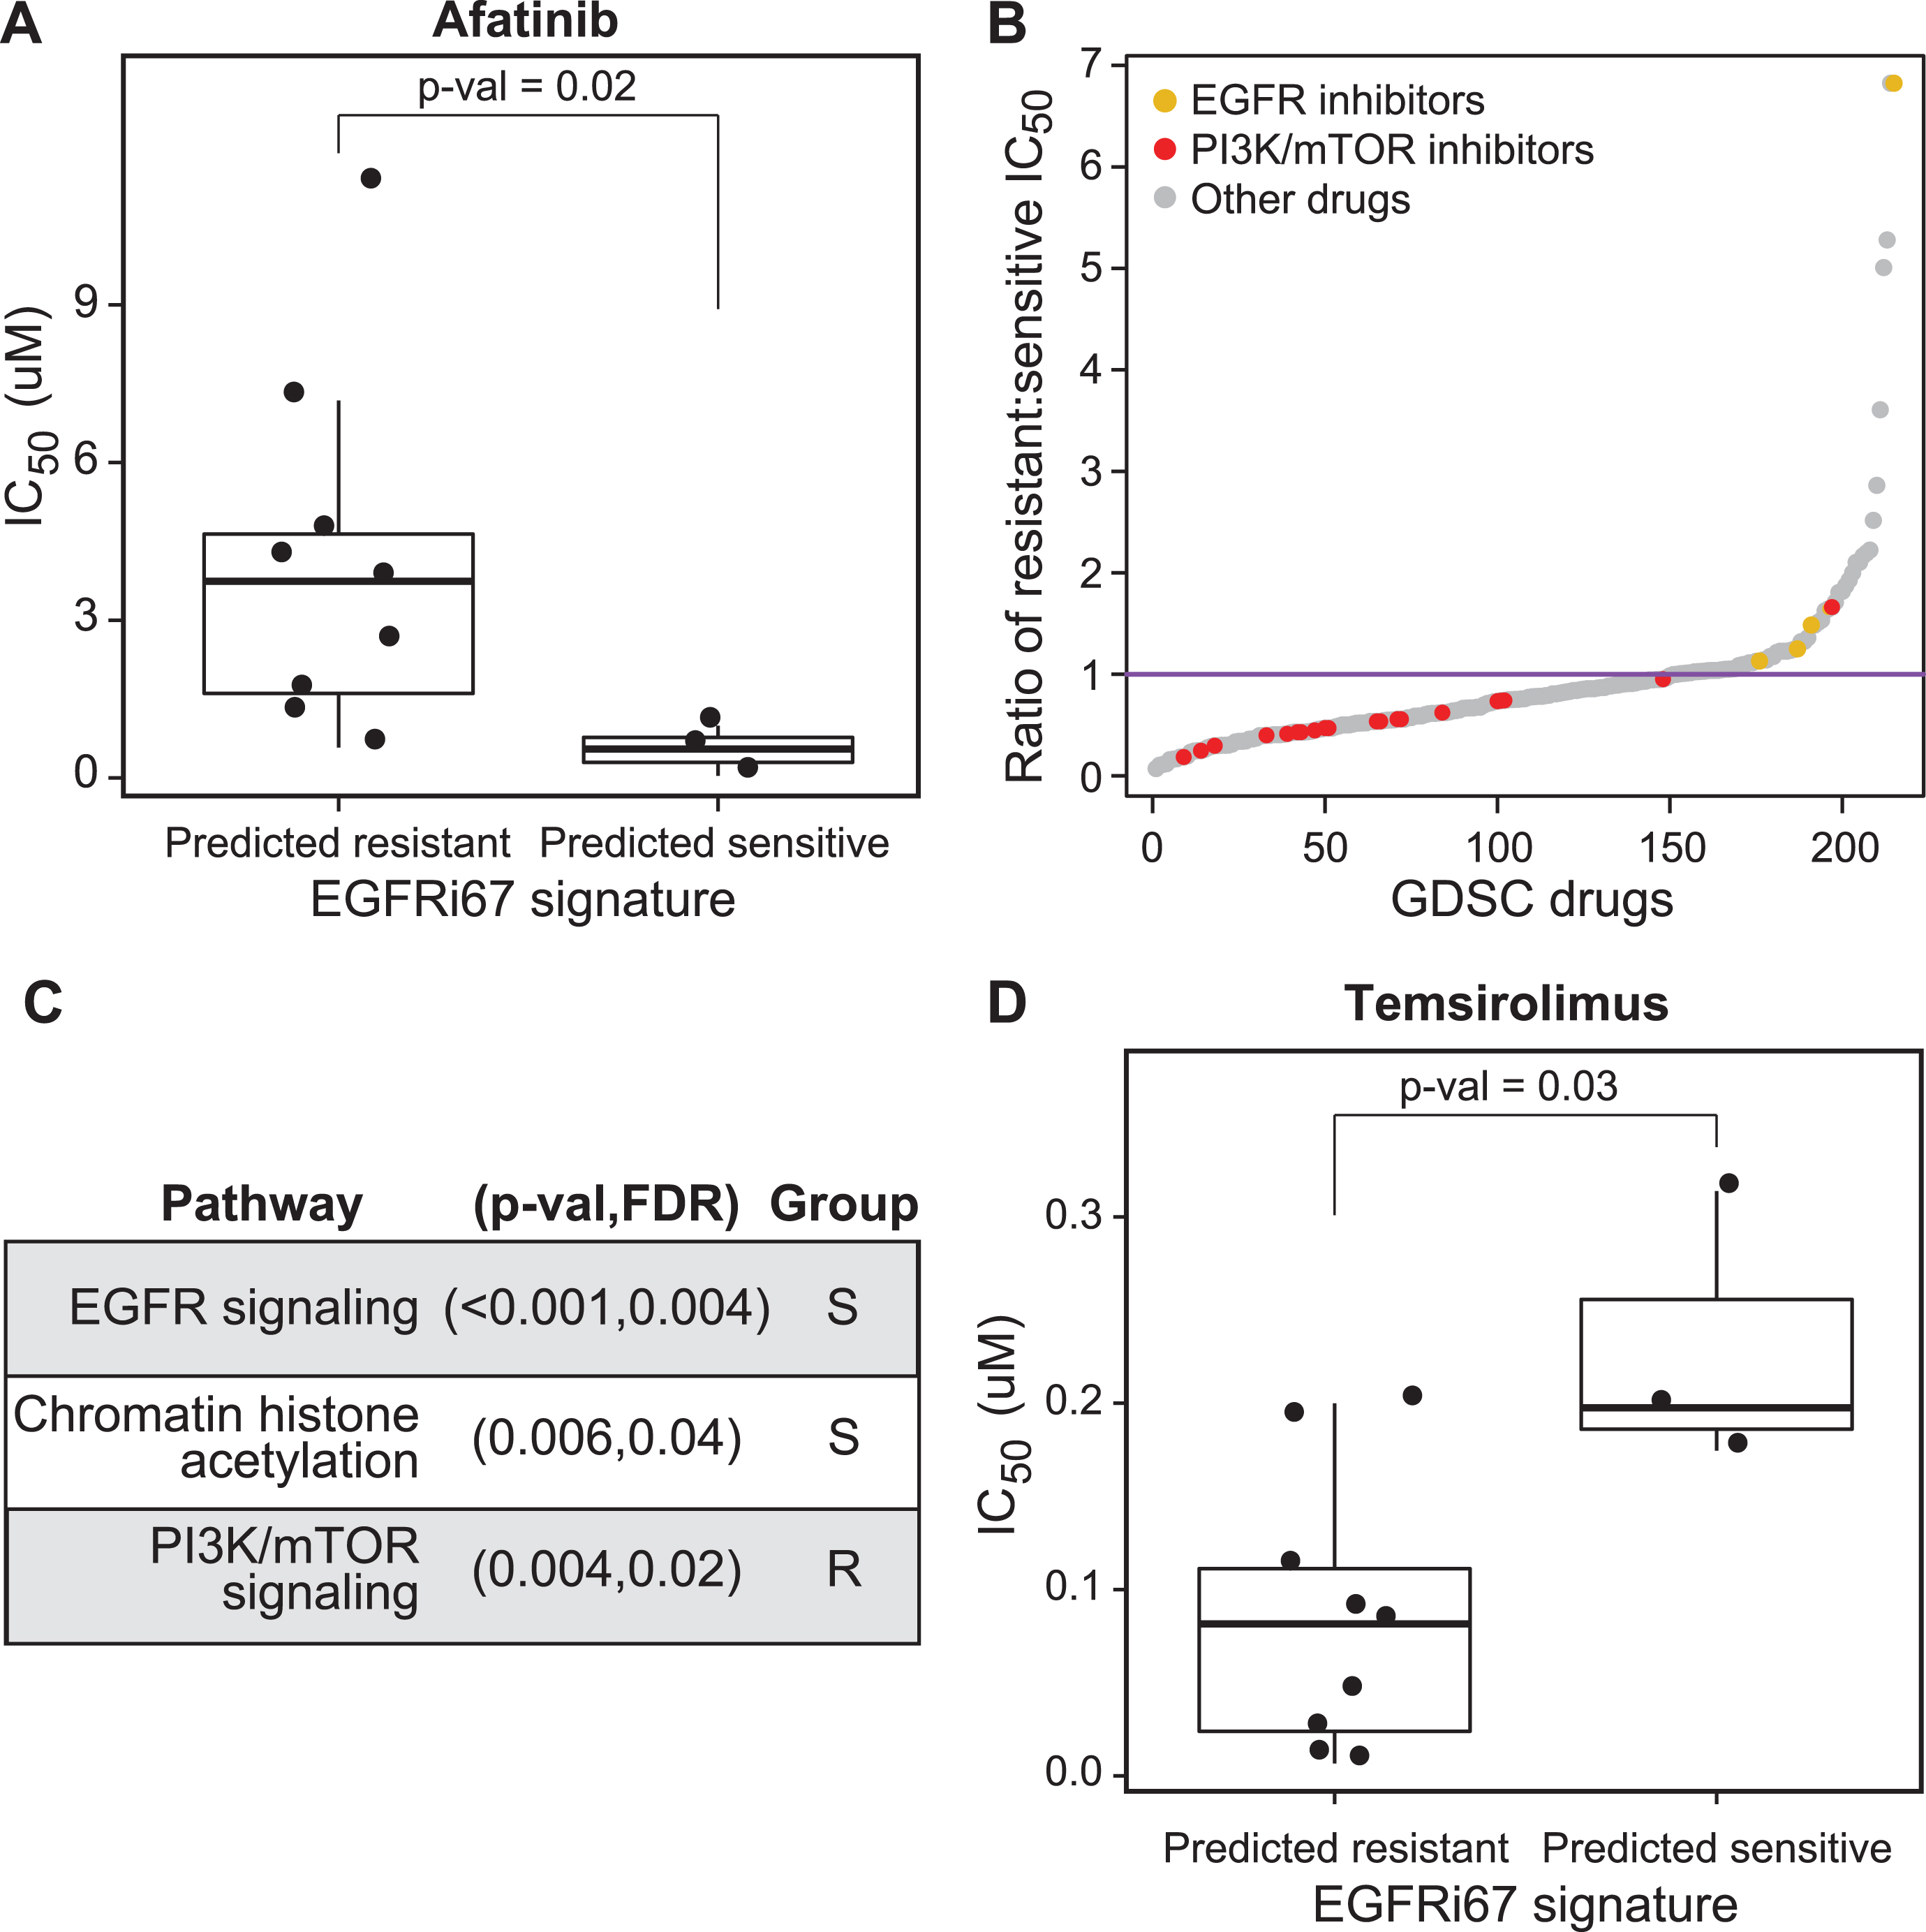
To determine the effectiveness of the EGFRi67 to predict sensitivity across different EGFR inhibitors, we first applied the signature to classify the 17 bladder cancer cell lines in the GDSC into two categories, sensitive (n = 5) and resistant (n = 12) (Fig. 2A, Supplementary Table 2) [33]. For each of the 6 EGFR TKIs and the anti-EGFR antibody cetuximab, we plotted the IC50 of each cell line according to their sensitive/resistant classification, although not all cell lines were tested with each drug. The EGFRi67 correctly, as determined by statistical significance using a Wilcoxon rank sum test, predicted cell line sensitivity to the dual EGFR/HER2 TKI, afatinib (Fig. 3A; p = 0.01). The IC50 of cetuximab and gefitinib trended to be lower in the predicted sensitive bladder cancer cell lines but did not reach significance (Supplementary Figure 1; p = 0.09 and p = 0.2, respectively). Finally, no difference was observed between the EGFRi67 predicted cells when treated with pelitinib or CP724714. We could not effectively evaluate erlotinib and lapatinib as the GDSC only tested two bladder cancer cell lines with each drug.
Fig. 3
Evaluation of the EGFRi67 gene signature in bladder cancer cell lines from the GDSC. The EGFRi67 was applied to bladder cancer cell lines in the GDSC to predict sensitivity or resistance to EGFR inhibition. (A) The IC50 of afatinib is plotted according to EGFRi67 prediction (p = 0.02, Wilcoxon rank sum test). (B) The median IC50 for each drug was calculated for EGFRi67 sensitive and responsive GDSC cancer cell lines. (C) Enrichment analysis identified drugs targeting three pathways to be statistically significant (FDR <0.05, Kolmogorov Smirnov test). Whether the pathway targeted by the drug was more effective in the EGFRi67 sensitive (S) or resistant (R) cell lines is indicated. (D) The IC50 of temsirolimus is plotted according to EGFRi67 prediction (p = 0.03, Wilcoxon rank sum test).
Cancer cell lines classified as resistant by the EGFRi67 are more sensitive to PI3K and mTOR pathway inhibition
In the context of precision oncology, predicted resistance or nonresponse presents a new challenge, which is to identify an alternative treatment option. For the 17 bladder cancer cell lines in the GDSC, we leveraged the set of 265 drugs tested on these cell lines to address this challenge. Here, we identified therapeutic agents that were more effective in the EGFRi67 predicted resistant lines. As we expected, and supporting our previous results, drugs targeting the EGFR signaling pathway are significantly more effective in the cell lines predicted to be sensitive by the EGFRi67. In contrast, we found drugs that target the PI3K and mTOR signaling pathway were enriched in lines predicted to be resistant according to the EGFRi67, suggesting these drugs may be attractive therapeutic targets in cases when cells are resistant to EGFR inhibition (Fig. 3B, C, Supplementary Table 3). We also noted that the predicted EGFR inhibitor sensitive cell lines are also more sensitive to drugs targeting chromatin histone acetylation (Fig. 3B, C). The results for one of the mTOR inhibitors, temsirolimus, are shown in Fig. 3D (Wilcoxon rank sum test; p = 0.03).
EGFRi67 predicts bladder cancer cell lines sensitive to EGFR TKI inhibition
To further evaluate the effectiveness of the EGFRi67 signature for predicting response to EGFR inhibition in bladder cancer outside of the GDSC, we compared predicted response to 3 EGFR inhibitors with cell lines overlapping the BLA40 (Fig. 2C). First, we generated our own experimental data to evaluate the response to gefitinib. We selected 12 of these bladder cancer cell lines (4 predicted sensitive and 8 predicted resistant) to test their response to gefitinib using an ATP-based assay following treatment (Fig. 4A,B, Supplementary Table 4). The bladder cancer cell lines predicted to be sensitive to EGFR inhibition had significantly lower GI50 of gefitinib compared to cell lines predicted to be resistant (Wilcoxon rank sum test; p = 0.05).
Fig. 4
Prediction of EGFR inhibition sensitivity by the EGFRi67 gene signature in bladder cancer cell lines from the BLA40. The EGFRi67 was applied to the BLA40. (A) Dose response curves of 12 bladder cancer cell lines treated with gefitinib. (B) The bladder cancer cell lines were grouped by their predicted response to EGFR inhibition and the GI50 of each cell line is shown (p = 0.05, Wilcoxon rank sum test). Two publically available datasets were used to evaluate the prediction of (C) erlotinib and (D) lapatinib sensitivity by the EGFRi67 (p = 0.03 and p = 0.06, respectively, Fisher’s exact test).
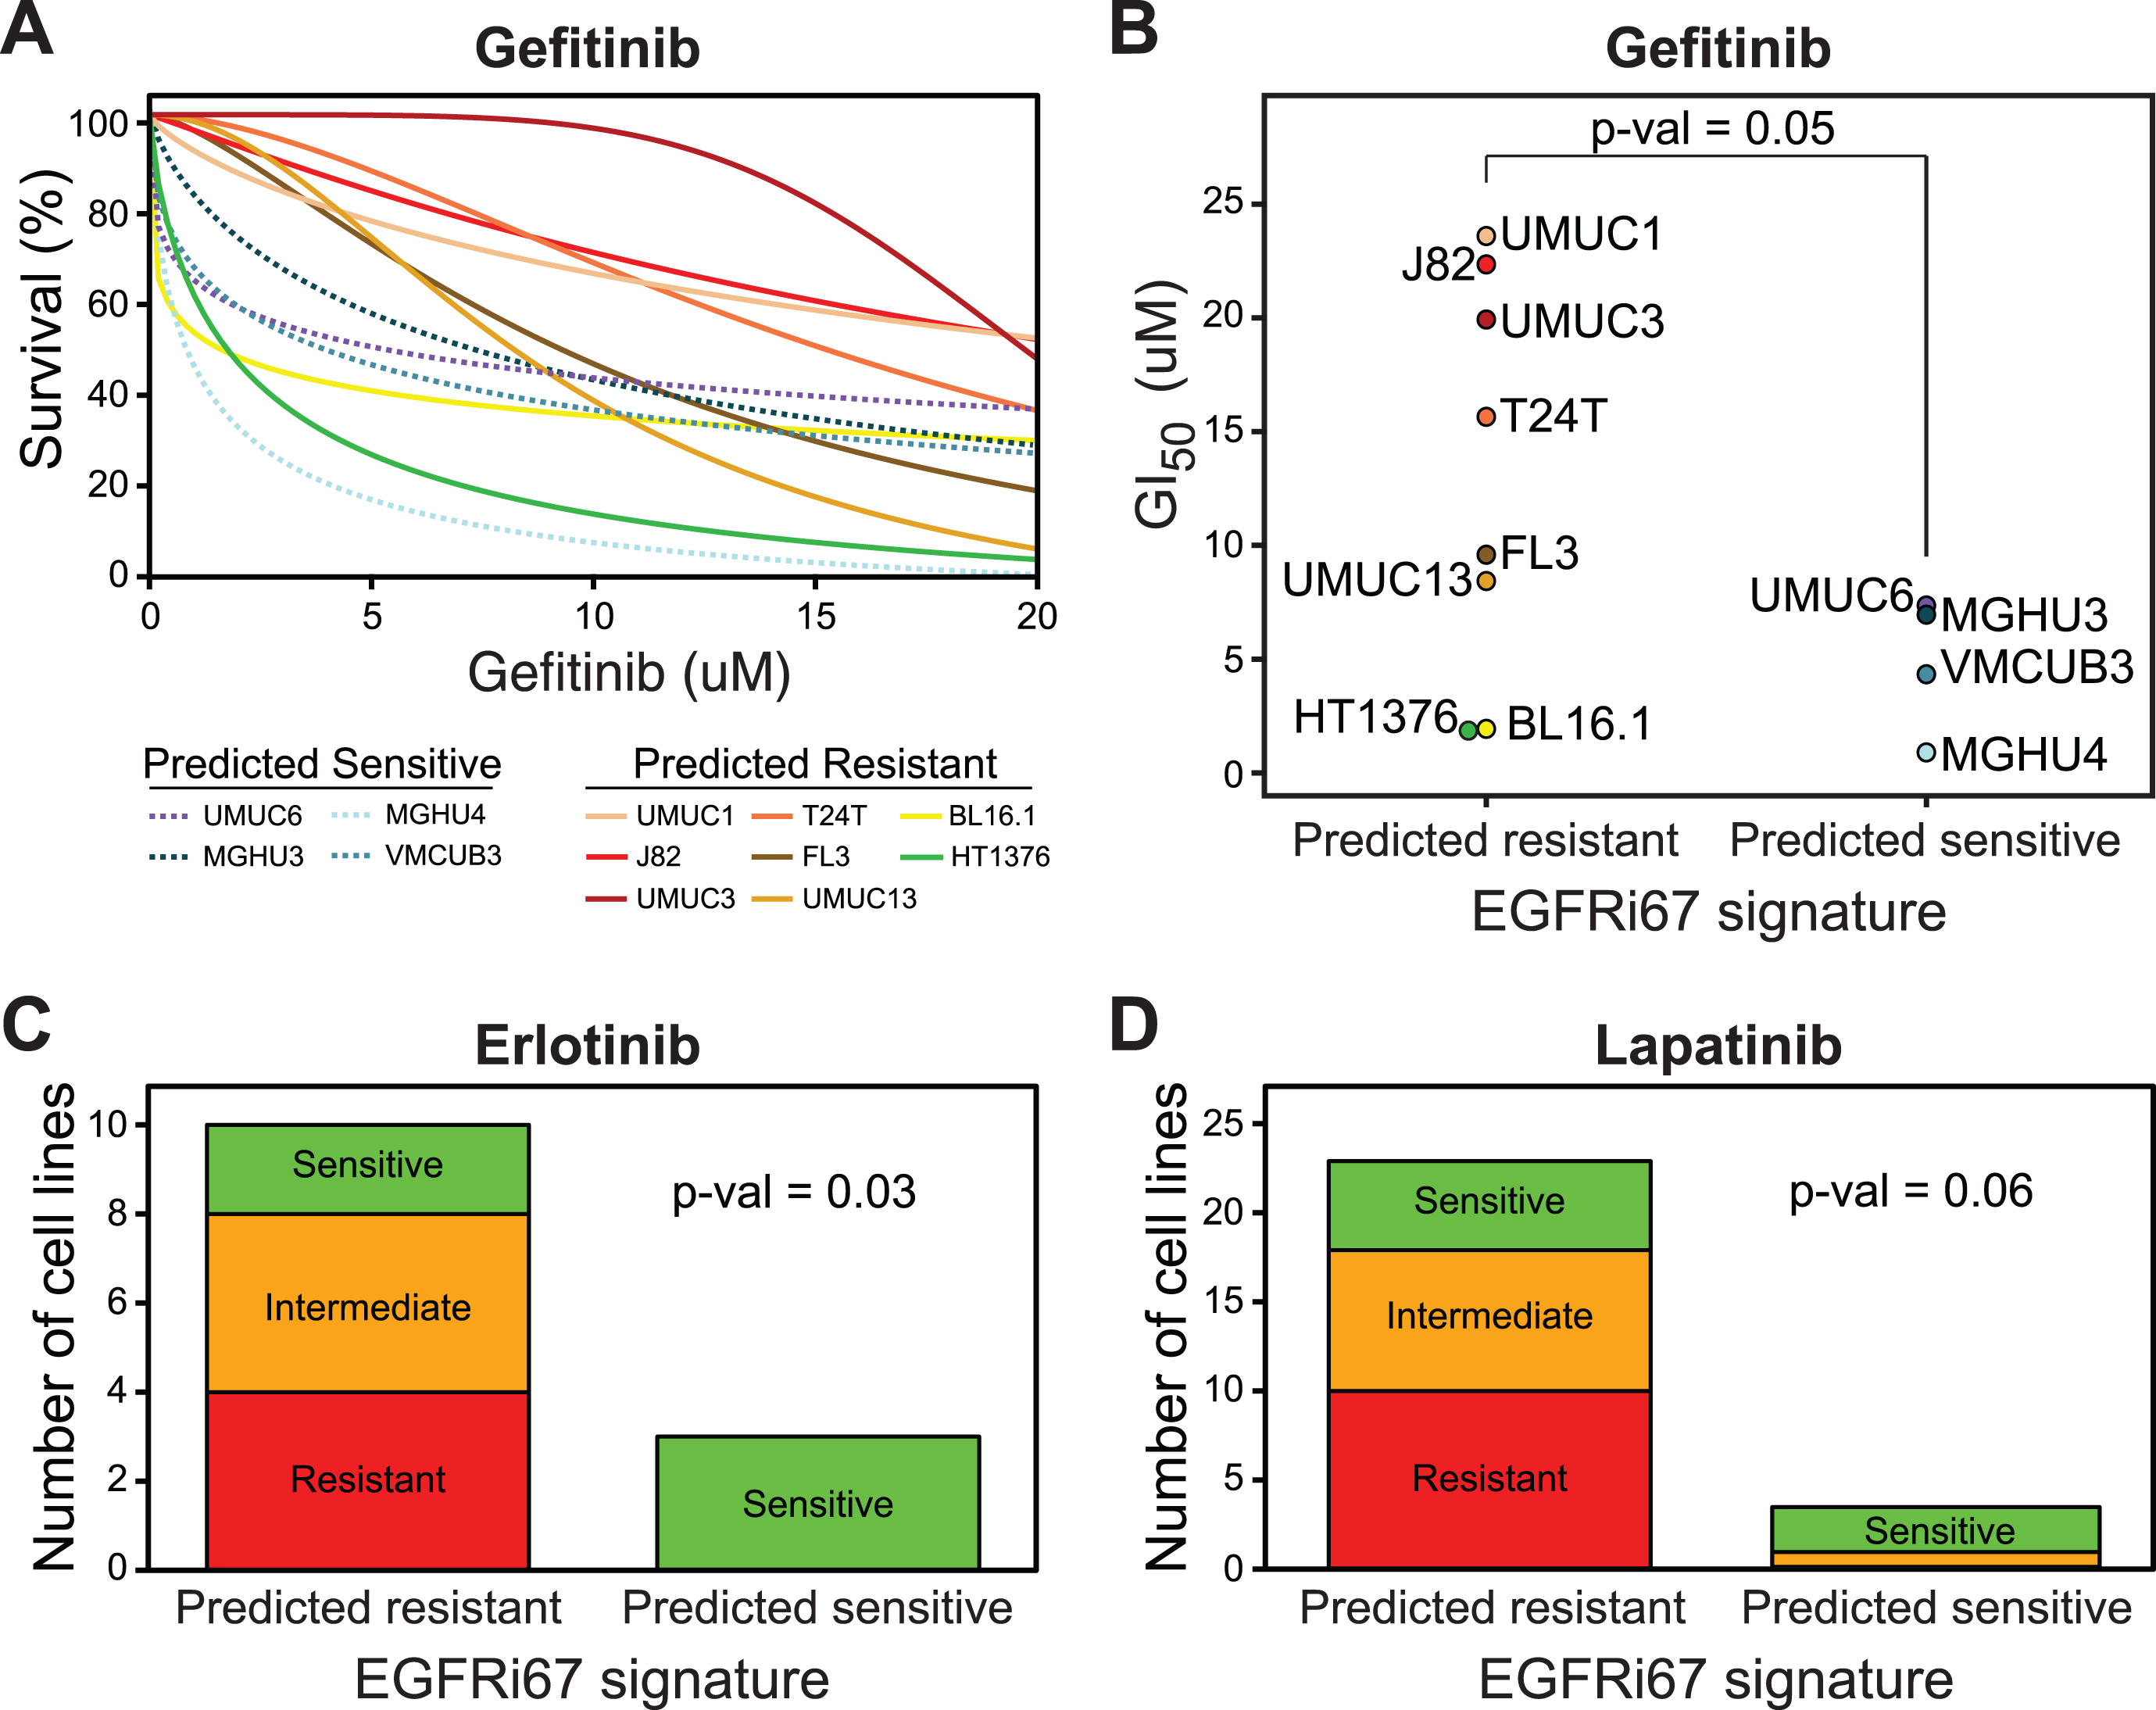
Next, we evaluated the response to erlotinib and lapatinib in two publically available datasets [26, 35]. The EGFRi67 predicted erlotinib sensitivity at an accuracy of 85% (Fig. 4C, Fisher’s exact test, p = 0.03). The EGFRi67 predicted sensitivity to lapatinib at an accuracy of 78% (Fig. 4D, Fisher’s exact test, p = 0.06). The results in BLA40 cell lines are consistent with the GDSC in that the EGFRi67 identifies bladder cancer cell lines that are more sensitive to a variety of EGFR inhibitors.
Basal-like bladder cancer cell lines are not more sensitive to EGFR inhibition
It has previously been reported that basal-like bladder cancer cell lines were more sensitive to the EGFR inhibitors, erlotinib and cetuximab [26]. Given these results, we determined the transcriptional subtypes of the bladder cancer cell lines in our study, and evaluated their relationship to EGFR inhibition response.
To determine the molecular subtype of the bladder cancer cell lines, we identified basal-like cell lines using two previously published bladder cancer subtype gene signatures, namely the BASE47 signature presented by Damrauer, et al. and the 40 gene signature developed by Rebouissou, et al. (Fig. 2B,C, Supplementary Figures 2, 3, Supplementary Table 5) [26, 54]. We compared the identified molecular subtypes from each signature and found strong consistency between the two signatures (Fig. 5A, 90% overlap). For downstream analysis, we only considered the cell lines that were identified as basal-like or non-basal under both signatures. In contrast to what we expected, we found that the basal-like subtype was not more sensitive to any EGFR inhibitor evaluated (Fig. 5). However, basal-like cell lines were strongly trending to be more sensitive to pelitinib and CP724714 (Supplementary Figure 4, Wilcoxon rank sum test; p = 0.07 and p = 0.1, respectively).
Fig. 5
EGFR inhibition sensitivity according to transcriptional subtype in bladder cancer cell lines. (A) The gene expression values of bladder cancer cell lines and the genes of the two subtype gene expression signatures are shown, namely the BASE47 [54] and Rebouissou, et al. [26]. The gene expression data was Z-score transformed. The putative subtype classification is shown at the bottom. The consensus subtype predictions were used to compare the impact of subtype on response to (B) gefitinib (Wilcoxon rank sum test), (C) erlotinib (Fisher’s exact test), (D) lapatinib (Fisher’s exact test), and (E) afatinib (Wilcoxon rank sum test).
![EGFR inhibition sensitivity according to transcriptional subtype in bladder cancer cell lines. (A) The gene expression values of bladder cancer cell lines and the genes of the two subtype gene expression signatures are shown, namely the BASE47 [54] and Rebouissou, et al. [26]. The gene expression data was Z-score transformed. The putative subtype classification is shown at the bottom. The consensus subtype predictions were used to compare the impact of subtype on response to (B) gefitinib (Wilcoxon rank sum test), (C) erlotinib (Fisher’s exact test), (D) lapatinib (Fisher’s exact test), and (E) afatinib (Wilcoxon rank sum test).](https://content.iospress.com:443/media/blc/2018/4-3/blc-4-3-blc170161/blc-4-blc170161-g005.jpg)
DISCUSSION
Despite the introduction of immunotherapies, the majority of bladder cancer patients who fail or do not qualify for first-line chemotherapy will not have a secondary treatment for which their cancer will likely respond [7]. Attempts to treat bladder cancer with EGFR inhibitors have yielded mixed results, yet a targeted cohort of patients do respond to these therapies [20–25]. Since the responding patients are a small percentage of the population, any success from inhibiting EGFR in bladder cancer will likely require an accompanying molecular test to more accurately identify the patients likely to respond to treatment.
The goal of this study is to generate a gene expression signature to predict bladder cancer cell line sensitivity to EGFR inhibition. Among other features, gene expression signatures lack the direct measure of mutations, which is relevant because EGFR activating mutations impact response to EGFR inhibition [55–57]. Importantly, we chose to use colorectal cancer to build the EGFRi67 signature because bladder and colorectal cancer rarely have EGFR mutations, but both cancer types have EGFR copy number gains [10–13]. This alleviates concerns of a gene expression signature being confounded by the presence of activating EGFR mutations in the training or testing data. Related, KRAS mutations are a major mechanism of resistance to EGFR inhibition, but tumors with these mutations harbor a prominent transcriptional profile, suggesting current knowledge of EGFR inhibitor resistance will be captured at the gene expression level [58]. Therefore, the landscape of genomic alterations in all of these cancer types supports the potential of a gene expression signature to predict the response to EGFR inhibition in both colorectal and bladder cancer.
After generating the EGFRi67 gene signature, we evaluated it in public and novel experimental datasets using bladder cancer cell lines. Our analysis spans 6 different EGFR TKIs and 1 antibody across 4 independent pharmacologic datasets. Collectively, our results demonstrate the predictive power of the EGFRi67 in bladder cancer.
We also identified potential alternative therapies in both EGFR-sensitive and EGFR-resistant bladder cancer cell lines (Fig. 3). Using the GDSC, we were able to show that EGFRi67 sensitive cell lines were more sensitive to drugs related to chromatin acetylation. Histone deacetylases (HDACs) have previously been shown to reduce the expression of EGFR [59]. These results suggest that HDAC inhibitors may synergize with EGFR inhibitors as a way to reduce EGFR activity through both direct inhibition of EGFR by the TKI and indirect down regulation of EGFR by the HDAC inhibitor. We also found that EGFRi67 predicted resistant cell lines were more sensitive to PI3K and mTOR inhibitors. Dual PI3K/mTOR inhibitors have previously been shown to enhance sensitivity to cetuximab resistant in head and neck cancer cells [60]. Our study further highlights the role of the PI3K and mTOR pathways in the resistance to EGFR inhibition.
A previous study demonstrated that basal bladder cancer cell lines have enhanced sensitivity to the EGFR inhibitors erlotinib and cetuximab [26]. We have extended this study to include more bladder cancer cell lines and several additional EGFR inhibitors. While we fail to find strong support of enhanced EGFR sensitivity in the basal-like subtype, further studies are needed to confirm these findings. One potential explanation for the difference in results is that we evaluated only cell lines that showed consistent predictions over two independent gene signatures, rather than relying on a single gene expression signature [26, 54]. A fundamental difference between our studies is how our gene signature was derived. In Rebouissou, et al., the gene expression signature was derived from unsupervised clustering of bladder tumors, with the later observation that cell lines of the basal-like subtype were more sensitive to EGFR inhibition [26]. In our approach, we built a supervised model based on the response to cetuximab in colorectal cancer. Future studies may be used to determine which approach is more useful to expand currently used therapies to additional cancer types. More specifically, to determine if gene signatures predicting response in colorectal cancer explain bladder tumor response equally as well or more effectively than an unsupervised transcriptional signature derived from bladder cancer samples.
An interesting note of this study is not only that a single expression signature derived in colorectal cancer was effective in bladder cancer, but also that a signature derived from cetuximab was able to predict the response to TKIs. As a monoclonal antibody to EGFR, cetuximab inhibits activation and phosphorylation of EGFR similarly to gefitinib, a TKI [61]. However, cetuximab also has the ability to activate antibody-dependent cellular cytotoxicity and some have argued that this may play a significant role in the in vivo cytotoxicity of this treatment [62]. However, our study argues that the cytotoxic ability of cetuximab is particularly tied to its ability to inhibit EGFR, because the signature of response generated from cetuximab data is effective at predicting the response to an EGFR TKI in vitro, without a role from the immune system.
Clinical trials evaluating the effectiveness of EGFR inhibition in bladder cancer have largely been disappointing because of the few patients that respond to the treatment. One way to increase the effectiveness of EGFR inhibitors for bladder cancer treatment is to better identify the patients that are likely to respond. In this study, we identify a preclinical biomarker that identifies bladder cancer cell lines more likely to respond to EGFR inhibition. Future studies are needed to determine its clinical validity in enhancing the selection of bladder cancer patients for alternative therapy.
FINANCIAL SUPPORT
This work is supported by the Boettcher Foundation (J.C.C.), T32GM007635 (A.G.), the Front Range Cancer Challenge (A.G.) and CA075115 (D.T.).
CONFLICT OF INTEREST
The authors have no conflict of interest to report.
AUTHOR CONTRIBUTIONS
Conception and design, A.G., D.T. and J.C.C.; Development of methodology, A.G. and J.C.C.; Acquisition of data, A.G. and A.J.; Analysis and interpretation of data, A.G. and J.C.C.; Writing, review and/or revision of the manuscript, A.G., D.T. and J.C.C.; Funding Acquisition, A.G. and J.C.C.
SUPPLEMENTARY MATERIAL
[1] The supplementary material is available in the electronic version of this article: http://dx.doi.org/10.3233/BLC-170161.
REFERENCES
[1] | Siegel RL , Miller KD , Jemal A . Cancer Statistics, 2017 CA Cancer J Clin. (2017) ;67: :7–30. |
[2] | Loehrer PJ , Einhorn LH , Elson PJ , Crawford ED , Kuebler P , Tannock I , . A randomized comparison of cisplatin alone or in combination with methotrexate, vinblastine, and doxorubicin in patients with metastatic urothelial carcinoma: A cooperative group study. J Clin Oncol. (1992) ;10: :1066–73. |
[3] | Logothetis CJ , Dexeus FH , Finn L , Sella A , Amato RJ , Ayala AG , . A prospective randomized trial comparing MVAC and CISCA chemotherapy for patients with metastatic urothelial tumors. J Clin Oncol. (1990) ;8: :1050–5. |
[4] | Siefker-Radtke AO , Millikan RE , Tu S-M , Moore DF , Smith TL , Williams D , . Phase III trial of fluorouracil, interferon alfa-2b, and cisplatin versus methotrexate, vinblastine, doxorubicin, and cisplatin in metastatic or unresectable urothelial cancer. J Clin Oncol. (2002) ;20: :1361–7. doi: 10.1200/JCO.20.5.1361. |
[5] | Sternberg CN , de Mulder PH , Schornagel JH , Théodore C , Fossa SD , van Oosterom AT , . Randomized phase III trial of high-dose-intensity methotrexate, vinblastine, doxorubicin, and cisplatin (MVAC) chemotherapy and recombinant human granulocyte colony-stimulating factor versus classic MVAC in advanced urothelial tract tumors: European Organization for Research and Treatment of Cancer Protocol no 30924. J Clin Oncol. (2001) ;19: :2638–46. |
[6] | von der Maase H , Hansen SW , Roberts JT , Dogliotti L , Oliver T , Moore MJ , . Gemcitabine and cisplatin versus methotrexate, vinblastine, doxorubicin, and cisplatin in advanced or metastatic bladder cancer: Results of a large, randomized, multinational, multicenter, phase III study. J Clin Oncol. (2000) ;18: :3068–77. |
[7] | Powles T , Eder JP , Fine GD , Braiteh FS , Loriot Y , Cruz C , . MPDL3280A (anti-PD-L1) treatment leads to clinical activity in metastatic bladder cancer. Nature. (2014) ;515: :558–62 doi: 10.1038/nature13904. |
[8] | Dutta PR , Maity A . Cellular responses to EGFR inhibitors and their relevance to cancer therapy. Cancer Lett. (2007) ;254: :165–77 doi: 10.1016/j.canlet.2007.02.006. |
[9] | Sequist LV , Martins RG , Spigel D , Grunberg SM , Spira A , Jänne PA , . First-line gefitinib in patients with advanced non—small-cell lung cancer harboring somatic EGFR mutations. J Clin Oncol. (2008) ;26: :2442–9. doi: 10.1200/JCO.2007.14.8494. |
[10] | Barber TD , Vogelstein B , Kinzler KW , Velculescu VE . Somatic mutations of EGFR in colorectal cancers and glioblastomas. N Engl J Med. (2004) ;351: :2883. doi: 10.1056/NEJM200412303512724. |
[11] | Chaux A , Cohen JS , Schultz L , Albadine R , Jadallah S , Murphy KM , . High epidermal growth factor receptor immunohistochemical expression in urothelial carcinoma of the bladder is not associated with EGFR mutations in exons 19 and 21: A study using formalin-fixed, paraffin-embedded archival tissues. Hum Pathol. (2012) ;43: :1590–5. doi: 10.1016/j.humpath.2011.11.016. |
[12] | Blehm KN , Spiess PE , Bondaruk JE , Dujka ME , Villares GJ , Zhao Y , . Mutations within the kinase domain and truncations of the epidermal growth factor receptor are rare events in bladder cancer: Implications for therapy. Clin Cancer Res. (2006) ;12: :4671–7. doi: 10.1158/1078-0432.CCR-06-0407. |
[13] | The Cancer Genome Atlas Research Network Comprehensive molecular characterization of urothelial bladder carcinoma. Nature. (2014) ;507: :315–22 doi: 10.1038/nature12965. |
[14] | Loeffler-Ragg J , Witsch-Baumgartner M , Tzankov A , Hilbe W , Schwentner I , Sprinzl GM , . Low incidence of mutations in EGFR kinase domain in Caucasian patients with head and neck squamous cell carcinoma. Eur J Cancer. (2006) ;42: :109–11 doi: 10.1016/j.ejca.2005.08.034. |
[15] | Al-Kuraya K , Novotny H , Bavi P , Siraj AK , Uddin S , Ezzat A , . HER2, TOP2A, CCND1, EGFR and C-MYC oncogene amplification in colorectal cancer. J Clin Pathol. (2007) ;60: :768–72 doi: 10.1136/jc2006.038281. |
[16] | Ooi A , Takehana T , Li X , Suzuki S , Kunitomo K , Iino H , . Protein overexpression and gene amplification of HER-2 and EGFR in colorectal cancers: An immunohistochemical and fluorescent in situ hybridization study. Mod Pathol. (2004) ;17: :895 doi: 10.1038/modpathol.3800137. |
[17] | Italiano A , Follana P , Caroli F-X , Badetti J-L , Benchimol D , Garnier G , . Cetuximab shows activity in colorectal cancer patients with tumors for which FISH analysis does not detect an increase in EGFR gene copy number. Ann Surg Oncol. (2008) ;15: :649–54 doi: 10.1245/s10434007-9667-2. |
[18] | Temam S , Kawaguchi H , El-Naggar AK , Jelinek J , Tang H , Liu DD , . Epidermal growth factor receptor copy number alterations correlate with poor clinical outcome in patients with head and neck squamous cancer. J Clin Oncol. (2007) ;25: :2164–70. doi: 10.1200/JCO.2006.06.6605. |
[19] | Sheu JJ-C , Hua C-H , Wan L , Lin Y-J , Lai M-T , Tseng H-C , . Functional genomic analysis identified epidermal growth factor receptor activation as the most common genetic event in oral squamous cell carcinoma. Cancer Res. (2009) ;69: :2568–76. doi: 10.1158/0008-5472.CAN-08-3199. |
[20] | Powles T , Huddart RA , Elliott T , Sarker S-J , Ackerman C , Jones R , . Phase III, double-blind, randomized trial that compared maintenance lapatinib versus placebo after first-line chemotherapy in patients with human epidermal growth factor receptor 1/2-positive metastatic bladder cancer. J Clin Oncol. (2017) ;35: :48–55 doi: 10.1200/JCO.2015.66.3468. |
[21] | Hussain M , Daignault S , Agarwal N , Grivas PD , Siefker-Radtke AO , Puzanov I , . A randomized phase 2 trial of gemcitabine/cisplatin with or without cetuximab in patients with advanced urothelial carcinoma. Cancer. (2014) ;120: :2684–93. doi: 10.1002/cncr.28767. |
[22] | Stephenson JJ , Gregory C , Burris H , Larson T , Verma U , Cohn A , . An open-label clinical trial evaluating safety and pharmacokinetics of two dosing schedules of panitumumab in patients with solid tumors. Clin Colorectal Cancer. (2009) ;8: :29–37 doi: 10.3816/CCC.2009.n.005. |
[23] | Wong Y-N , Litwin S , Vaughn D , Cohen S , Plimack ER , Lee J , . Phase II trial of cetuximab with or without paclitaxel in patients with advanced urothelial tract carcinoma. J Clin Oncol. (2012) ;30: :3545–51. doi: 10.1200/JCO.2012.41.9572. |
[24] | Pruthi RS , Nielsen M , Heathcote S , Wallen EM , Rathmell WK , Godley P , . A phase II trial of neoadjuvant erlotinib in patients with muscle-invasive bladder cancer undergoing radical cystectomy: Clinical and pathological results. BJU Int. (2010) ;106: :349–54 doi: 10.1111/j.1464-716410X.2009.09101.x. |
[25] | Petrylak DP , Tangen CM , Van Veldhuizen PJ , Goodwin JW , Twardowski PW , Atkins JN , . Results of the Southwest Oncology Group phase II evaluation (study S0031) of ZD1839 for advanced transitional cell carcinoma of the urothelium. BJU Int. (2010) ;105: :317–21 doi: 10.1111/j.1464-410X.2009.08799.x. |
[26] | Rebouissou S , Bernard-Pierrot I , de Reyniès A , Lepage M-L , Krucker C , Chapeaublanc E , . EGFR as a potential therapeutic target for a subset of muscle-invasive bladder cancers presenting a basal-like phenotype. Sci Transl Med. (2014) ;6: :244ra91–244ra91 doi: 10.1126/scitranslmed.3008970. |
[27] | Garnett MJ , Edelman EJ , Heidorn SJ , Greenman CD , Dastur A , Lau KW , . Systematic identification of genomic markers of drug sensitivity in cancer cells. Nature. (2012) ;483: :570–5 doi: 10.1038/nature11005. |
[28] | Barretina J , Caponigro G , Stransky N , Venkatesan K , Margolin AA , Kim S , . The Cancer Cell Line Encyclopedia enables predictive modelling of anticancer drug sensitivity. Nature. (2012) ;483: :603–7 doi: 10.1038/nature11003. |
[29] | Goodspeed A , Heiser LM , Gray JW , Costello JC . Tumor-derived cell lines as molecular models of cancer pharmacogenomics. Mol Cancer Res. (2016) ;14: :3–13 doi: 10.1158/1541-7786.MCR-15-0189. |
[30] | NCI-MATCH: Targeted Therapy Directed by Genetic Testing in Treating Patients With Advanced Refractory Solid Tumors or Lymphomas (2015) . |
[31] | Balko JM , Black EP . A gene expression predictor of response to EGFR-targeted therapy stratifies progression-free survival to cetuximab in KRAS wild-type metastatic colorectal cancer. BMC Cancer. (2009) ;9: :145. doi: 10.1186/1471-2407-9-145. |
[32] | Khambata-Ford S , Garrett CR , Meropol NJ , Basik M , Harbison CT , Wu S , . Expression of epiregulin and amphiregulin and K-ras mutation status predict disease control in metastatic colorectal cancer patients treated with cetuximab. J Clin Oncol. (2007) ;25: :3230–7. doi: 10.1200/JCO.2006.10.5437. |
[33] | Yang W , Soares J , Greninger P , Edelman EJ , Lightfoot H , Forbes S , . Genomics of Drug Sensitivity in Cancer (GDSC): A resource for therapeutic biomarker discovery in cancer cells. Nucleic Acids Res. (2013) ;41: :D955–61 doi: 10.1093/nar/gks1111. |
[34] | Lee JK , Havaleshko DM , Cho H , Weinstein JN , Kaldjian EP , Karpovich J , . A strategy for predicting the chemosensitivity of human cancers and its application to drug discovery. Proc Natl Acad Sci. (2007) ;104: :13086–91 doi: 10.1073/pnas.0610292104. |
[35] | Havaleshko DM , Cho H , Conaway M , Owens CR , Hampton G , Lee JK , . Prediction of drug combination chemosensitivity in human bladder cancer. Mol Cancer Ther. (2007) ;6: :578–86 doi: 10.1158/1535-7163.MCT-06-0497. |
[36] | McCall MN , Bolstad BM , Irizarry RA . Frozen robust multiarray analysis (fRMA). Biostatistics. (2010) ;11: :242–53 doi: 10.1093/biostatistics/kxp059. |
[37] | McCall MN , Murakami PN , Lukk M , Huber W , Irizarry RA . Assessing affymetrix GeneChip microarray quality. BMC Bioinformatics. (2011) ;12: :137. doi: 10.1186/1471-2105-12-137. |
[38] | McCall MN , Uppal K , Jaffee HA , Zilliox MJ , Irizarry RA . The Gene Expression Barcode: Leveraging public data repositories to begin cataloging the human and murine transcriptomes. Nucleic Acids Res. (2011) ;39: :D1011–5. doi: 10.1093/nar/gkq1259. |
[39] | McCall MN , Jaffee HA , Irizarry RA . fRMA ST: Frozen robust multiarray analysis for Affymetrix Exon and Gene ST arrays. Bioinformatics. (2012) ;28: :3153–4. doi: 10.1093/bioinformatics/bts588. |
[40] | McCall M , Irizarry R . hgu133afrmavecs: Vectors used by frma for microarrays of type hgu133a. R package version 150 n.d. |
[41] | McCall M , Irizarry R . hgu133a2frmavecs: Vectors used by frma for microarrays of type hgu133a2. R package version 120 n.d. |
[42] | Ritchie ME , Phipson B , Wu D , Hu Y , Law CW , Shi W , . limma powers differential expression analyses for RNA-sequencing and microarray studies. Nucleic Acids Res. (2015) ;43: :e47 doi: 10.1093/nar/gkv007. |
[43] | Hastie T , Tibshirani R , Narasimhan B , Chu G . Package “pamr”(2015) . |
[44] | Tibshirani R , Hastie T , Narasimhan B , Chu G . Diagnosis of multiple cancer types by shrunken centroids of gene expression. Proc Natl Acad Sci. (2005) ;99: :6567–72. doi: 10.1073/pnas.082099299. |
[45] | Subramanian A , Tamayo P , Mootha VK , Mukherjee S , Ebert BL , Gillette MA , . Gene set enrichment analysis: A knowledge-based approach for interpreting genome-wide expression profiles. Proc Natl Acad Sci. (2005) ;102: :5–50 doi: 10.1073/pnas.0506580102. |
[46] | Mootha VK , Lindgren CM , Eriksson K-F , Subramanian A , Sihag S , Lehar J , . PGC-1α-responsive genes involved in oxidative phosphorylation are coordinately downregulated in human diabetes. Nat Genet. (2003) ;34: :267–73 doi: 10.1038/ng1180. |
[47] | Ritz C , Baty F , Streibig JC , Gerhard D . Dose-Response Analysis Using R. PLoS One. (2015) ;10: :e0146021. doi: 10.1371/journal.pone.0146021. |
[48] | Saeed AI , Sharov V , White J , Li J , Liang W , Bhagabati N , . TM A free, open-source system for microarray data management and analysis. BioTechniques. (2003) ;34: :374–8. |
[49] | Sadanandam A , Lyssiotis CA , Homicsko K , Collisson EA , Gibb WJ , Wullschleger S , . A colorectal cancer classification system that associates cellular phenotype and responses to therapy. Nat Med. (2013) ;19: :619–25 doi: 10.1038/nm.3175. |
[50] | Choi W , Porten S , Kim S , Willis D , Plimack ER , Hoffman-Censits J , . Identification of distinct basal and luminal subtypes of muscle-invasive bladder cancer with different sensitivities to frontline chemotherapy. Cancer Cell. (2014) ;25: :152–65 doi: 10.1016/j.ccr.2014.01.009. |
[51] | Prat A , Bianchini G , Thomas M , Belousov A , Cheang MCU , Koehler A , . Research-based PAM50 subtype predictor identifies higher responses and improved survival outcomes in HER2-positive breast cancer in the NOAH study. Clin Cancer Res. (2014) ;20: :511–21 doi: 10.1158/1078-0432.CCR-13-0239. |
[52] | Sørlie T , Perou CM , Tibshirani R , Aas T , Geisler S , Johnsen H , . Gene expression patterns of breast carcinomas distinguish tumor subclasses with clinical implications. Proc Natl Acad Sci. (2001) ;98: :10869–74. |
[53] | Damrauer JS , Hoadley KA , Chism DD , Fan C , Tiganelli CJ , Wobker SE , . Intrinsic subtypes of high-grade bladder cancer reflect the hallmarks of breast cancer biology. Proc Natl Acad Sci. (2014) ;111: :3110–5.doi: 10.1073/pnas.1318376111. |
[54] | Lynch TJ , Bell DW , Sordella R , Gurubhagavatula S , Okimoto RA , Brannigan BW , . Activating mutations in the epidermal growth factor receptor underlying responsiveness of non-small-cell lung cancer to gefitinib. N Engl J Med. (2004) ;350: :2129–39. doi: 10.1056/NEJMoa040938. |
[55] | Paez JG , Jänne PA , Lee JC , Tracy S , Greulich H , Gabriel S , . EGFR mutations in lung cancer: Correlation with clinical response to gefitinib therapy. Science. (2004) ;304: :1497–500. doi: 10.1126/science.1099314. |
[56] | Pao W , Miller V , Zakowski M , Doherty J , Politi K , Sarkaria I , . EGF receptor gene mutations are common in lung cancers from “never smokers” and are associated with sensitivity of tumors to gefitinib and erlotinib. Proc Natl Acad Sci U S A. (2004) ;101: :6–11 doi: 10.1073/pnas.0405220101. |
[57] | De Reyniès A , Boige V , Milano G , Faivre J , Laurent-Puig P . KRAS mutation signature in colorectal tumors significantly overlaps with the cetuximab response signature. J Clin Oncol. (2008) ;26: :2228–30. doi: 10.1200/JCO.2007.15.9186. |
[58] | Chou C-W , Wu M-S , Huang W-C , Chen C-C . HDAC inhibition decreases the expression of EGFR in colorectal cancer cells. PLoS One. (2011) ;6: :e18087. doi: 10.1371/journal.pone.0018087. |
[59] | D’Amato V , Rosa R , D’Amato C , Formisano L , Marciano R , Nappi L , . The dual PI3K/mTOR inhibitor PKI-587 enhances sensitivity to cetuximab in EGFR-resistant human head and neck cancer models. Br J Cancer. (2014) ;110: :2887–95. doi: 10.1038/bjc.2014.241. |
[60] | Mukohara T , Engelman JA , Hanna NH , Yeap BY , Kobayashi S , Lindeman N , . Differential effects of gefitinib and cetuximab on non—small-cell lung cancers bearing epidermal growth factor receptor mutations. J Natl Cancer Inst. (2005) ; 97: : 1185–94. doi: 10.1093/jnci/dji238. |
[61] | Kurai J , Chikumi H , Hashimoto K , Yamaguchi K , Yamasaki A , Sako T , . Antibody-dependent cellular cytotoxicity mediated by cetuximab against lung cancer cell lines. Clin Cancer Res. (2007) ;13: :1552–61. doi: 10.1158/1078-0432.CCR-06-1726. |


