
Prognostication in Patients Treated with Radical Cystectomy for Urothelial Bladder Carcinoma: A New Simplified Model Incorporating Histological Variants
Abstract
Purpose:
The aim of this study was to evaluate the clinical significance of histological variants (HV) and to develop a new and simple prediction model incorporating variant forms in patients who underwent radical cystectomy for urothelial carcinoma (UC).
Materials and methods:
We analyzed the data of 365 patients. We evaluated whether HV were independent predictors of survival. A new scoring model was developed using the regression coefficients from the multivariate Cox proportional hazard model. The patients were divided into three groups on the basis of the score: low-, intermediate- and high-risk. To evaluate the performance of the model, we assessed models in terms of discrimination and calibration.
Results:
Patients(median age; 68.5 years) with pure form and squamous differentiation did not differ significantly but statistical analysis of the survival curves of patients with pure form and other variants revealed a statistically significant difference in terms of cancer-specific survival (CSS) (p = 0.005) and overall survival (OS) (p = 0.010). According to the new scoring model HV, the 5-yr CSS rate in each group was 93.3%, 82.9% and 50.5%, respectively. The 5-yr OS rate in each group was 90.0%, 66.3% and 33.2%, respectively. Model discrimination was good for all year models. Calibration was also adequate for the model in all year models.
Conclusions:
HV were found to be important independent prognostic factors in urothelial bladder cancer. This paper presents a new prognostic model incorporating variant forms for predicting CSS and OS in these patients.
INTRODUCTION
Bladder cancer is the 9th most common cancer and ranks 13th as a cause of death from cancer in worldwide [1]. It is estimated that bladder cancer accounts for 70,530 new cases of cancer and 14,680 cancer-related deaths in the United States during 2010 [1]. In the United States, 90% to 95% of bladder cancers are composed of pure urothelial carcinoma (UC) and UC with variant, and the rest consists of non- UC. HV are based primarily on morphologic features. And the frequency of UC with variants ranges from 10% to 40–53% [2]. Histological variants(HV) of UC include squamous differentiation, glandular differentiation, micropapillary, sarcomatoid, lymphoepithelioma-like, and plasmacytoid components [3]. Pure forms of non- UC present with a high stage and grade at presentation and are associated with more aggressive behavior and diminished patient survival [3]. It is unclear whether this result extends to UC with HV. Because each differentiation pattern is characterized by its distinct biological behavior, the overall significance of UC with HV remains unclear [4].
Predicting the prognosis for patients with bladder cancer remains a challenge. To date, five prediction models have recently been published to predict cancer-specific (CSS) [5–8] or overall survival (OS) [5, 9] after radical cystectomy. These models accounts for patient age [5, 7], pT stage [5–9], lymphovascular invasion [5, 7, 9], resection margin status [8], pN stage [5–7], the number of removed lymph node [7], the number of positive lymph node [7], lymph node density [8], neoadjuvant chemotherapy [5], adjuvant chemotherapy [5], adjuvant radiotherapy [5], serum c-reactive protein [8], and molecular biomarkers [7, 9].
However, there is still a need to improve the predictive accuracy for the individual patient. Because there is little evidence in the literature concerning the prognostic value of variant forms in cystectomy patients, we aimed to determine its clinical significance as a potential predictor for poor oncological outcome. We confirmed the significance of variant forms as a prognostic factor, and developed a new and simple prediction model incorporating variant forms in patients who underwent radical cystectomy.
MATERIALS AND METHODS
We retrospectively reviewed the data of 402 patients who underwent radical cystectomy with pelvic lymphadenectomy at our institution between 1998 and 2011. Exclusion criteria were non- UC (squamous cell carcinoma, n = 7; adenocarcinoma, n = 6; small cell carcinoma, n = 7; and others, n = 5), cystectomy for other cancers (prostate cancer, n = 2), nononcologic reasons (radiation cystitis, n = 1), and perioperative mortality (n = 9). And patients who underwent neoadjuvant chemotherapy were excluded. Thus, this study was comprised of 365 patients (305 men and 60 women). The tumor stage and grade were examined according to the TNM classification [10] and World Health Organization system [11]. The subtypes of UC were defined as the 2004 World Health Organization publication Tumours of the urinary system and male genital organs [12], with some modifications. Pathological reviews were performed in all cases. There was no cut off value for HV, and the variant was applied as it was.
Follow-up was done according to institutional protocol. Patients were generally seen postoperatively at least every 3 to 4 months for the first year, semiannually for the second year, and annually thereafter. Follow-up examinations consisted of physical examination, lab tests, urine cytology, chest x-rays, and renal ultrasound. A CT scan of the abdomen and pelvis was carried out on a yearly basis. Clinical outcomes were measured from the date of cystectomy to the date of death or the date of last follow-up. When patients died, the cause of death was determined by the treating physicians by chart review corroborated by death certificates, or by death certificates alone. Patients who were identified as having died from bladder cancer had progressive and often highly symptomatic metastases at the time of death. The median duration of follow-up was 29.6 months (Interquartile range (IQR), 0.3 to 148.0 months).
We evaluated whether or not HV were independent predictors of CSS and OS. The CSS and OS rates based on HV were calculated using the Kaplan-Meier method, and differences among groups were compared using the log-rank test. HV were divided as squamous differentiation and other variants.
Ten variables were evaluated in univariate analysis. The factors consisted of patient age (<65 vs. ≥65), gender (male vs. female), previous intravesical therapy (no vs. yes), pT stage (≤pT1 vs. pT2 vs. ≥pT3), pN stage (pN0 vs. ≥pN1), tumor grade (≤G2 vs. G3), lymphovascular invasion (no vs. yes), co-existing carcinoma in situ (no vs. yes), margin status (negative vs. positive), and histology (pure carcinoma vs. squamous differentiation vs. other variants). As a second step, significant parameters of univariate analysis were investigated in multivariate Cox proportional hazard model. Reduced model selection was done using a backward step-down selection process, which used as stopping rule the Akaike’s information criterion [13]. A new scoring model to predict CSS and OS after radical cystectomy was developed using the regression coefficients from the final multivariate Cox proportional hazard model. The coefficient for each factor was divided by the highest coefficient, multiplied by 4 and rounded to the nearest integer [14]. Precision of the reported coefficients was assessed by creating 1,000 bootstrap samples from the entire data set and replicating the estimation process. 95% confidence intervals were formed using this bootstrap estimate of the corresponding samplingdistributions. To calculate a prognostic score, we assigned each of independent prognostic variables a number of points. A score was calculated for each patient by adding together the points corresponding to his or her factors, and the patients were divided into three groups on the basis of the score: low-, intermediate- and high-risk for death.
To evaluate the performance of the model, we assessed models in terms of discrimination (resolution) and calibration (reliability). The discriminative ability of the model was measured internally using the Harrell’s c statistic (area under the receiver operating characteristics curve) [15, 16]. Interpretation of the c statistic is similar to the interpretation of the area under a receiver operating characteristics curve. A value of 1.0 indicates that the score assigned by the model perfectly discriminates patients with different outcomes, while a value of 0.5 indicates that the scoring model contains no predictive information. Calibration was assessed by group patients and then comparing the mean of the group with the observed Kaplan-Meier estimated of CSS and OS. Kaplan-Meier curves for patients in the three groups were generated to illustrate the partitioning of the risk of death. We also assessed the calibration of our model by calculating the Hosmer-Lemeshow goodness-of-fit statistic [17]. The Hosmer-Lemeshow statistic compares the observed and predicted risk within risk categories. A lower Hosmer-Lemeshow statistic and a higher p value (p > 0.05) indicate better calibration.
Overall model performance was evaluated with the R2 statistic (Nagelkerke’s peudo-R2). Nagelkerke’s peudo-R2 represents the proportion of variation explained by covariates in regression models. Nagelkerke’s peudo-R2 is a modification of the Cox and Snell coefficient to assure that it can vary from 0 to 1. A larger R2 indicates better predictive performance. The likelihood ratio chi-square test was used to measure homogeneity [15, 16]. The Akaike information criteria within a Cox proportional hazard regression model were used to evaluate the discriminatory ability and complexity of model [16, 18]; the smaller the Akaike information criteria value, the more informative and simpler the model. The Akaike information criteria statistic was defined by Akaike information criteria = –2 log maximum likelihood + 2 x the number of parameters in the model. Finally, values for the prognostic separation index were provided. We determined the difference between the prognostic groups in the probability of death, calculated as (Phigh-Plow)/100, where Phigh is the predicted probability of death for a patient in the group with the worst prognosis, and Plow is the corresponding value for a patient in the group with the best prognosis [16]. The greater the difference or separation between these two values, the better the prognostic separation index and the more useful the test or score for discriminating between individuals with good and poor prognoses [19].
RESULTS
The median age at the time of radical cystectomy was 68.5 years (IQR, 33.2 to 88.4 years).
Table 1 lists the characteristics of the 365 patients based on the histological type. HV were noted in 47 patients. After squamous differentiation (n = 28), micropapillary (n = 9), sarcomatoid (n = 4), and small cell variants (n = 4) were the most common HV. Others consisted of lymphoepithelioma-like (n = 1) and plasmacytoid variants (n = 1). The variant forms were found more frequently in female than in male patients (p = 0.026). Patients with variant forms had higher pT stage (p = 0.005) and higher tumor grade (p < 0.005) than those with pure form.
Table 1
Patient characteristics
| Pure carcinoma | Carcinoma with variants | P value† | |
| No. | 318 | 47 | |
| Age (years)* | 68.7 (33.2 to 87.1) | 68.0 (42.2 to 88.4) | 0.420 |
| Sex | 0.026 | ||
| Male | 271 (85.2%) | 34 (72.3%) | |
| Female | 47 (14.8%) | 13 (27.7%) | |
| Previous intravesical therapy | 0.267 | ||
| No | 233 (73.3%) | 38 (80.9%) | |
| Yes | 85 (26.7%) | 9 (19.1%) | |
| pT stage | 0.005 | ||
| pT0/pTa/pTis/pT1 | 151 (47.5%) | 11 (23.4%) | |
| pT2 | 55 (17.3%) | 9 (19.1%) | |
| pT3-4 | 112 (35.2%) | 27 (57.4%) | |
| pN stage | 0.284 | ||
| pN0 | 249 (78.3%) | 40 (85.1%) | |
| pN1-3 | 69 (21.7%) | 7 (14.9%) | |
| Tumor grade | 0.005 | ||
| ≤G2 | 79 (24.8%) | 3 (6.4%) | |
| G3 | 239 (75.2%) | 44 (93.6%) | |
| Lymphovascular invasion | 0.351 | ||
| No | 205 (64.5%) | 27 (57.4%) | |
| Yes | 113 (35.5%) | 20 (42.6%) | |
| Co-existing carcinoma in situ | 0.236 | ||
| No | 158 (49.7%) | 19 (40.4%) | |
| Yes | 160 (50.3%) | 28 (59.6%) | |
| Margin status | 0.253 | ||
| Negative | 298 (93.7%) | 46 (97.9%) | |
| Positive | 20 (6.3%) | 1 (2.1%) | |
| Variants | |||
| Squamous differentiation | 28 (59.6%) | ||
| Micropapillary | 9 (19.1%) | ||
| Sarcomatoid | 4 (8.4%) | ||
| Small cell | 4 (8.4%) | ||
| Lymphoepithelioma-like | 1 (2.1%) | ||
| Plasmacytoid | 1 (2.1%) |
*Values are medians (IQR). †P values are for the comparison between the groups and were calculated by the Mann-Whitney U test for median age and by the Pearson’s chi-square test for the other variables.
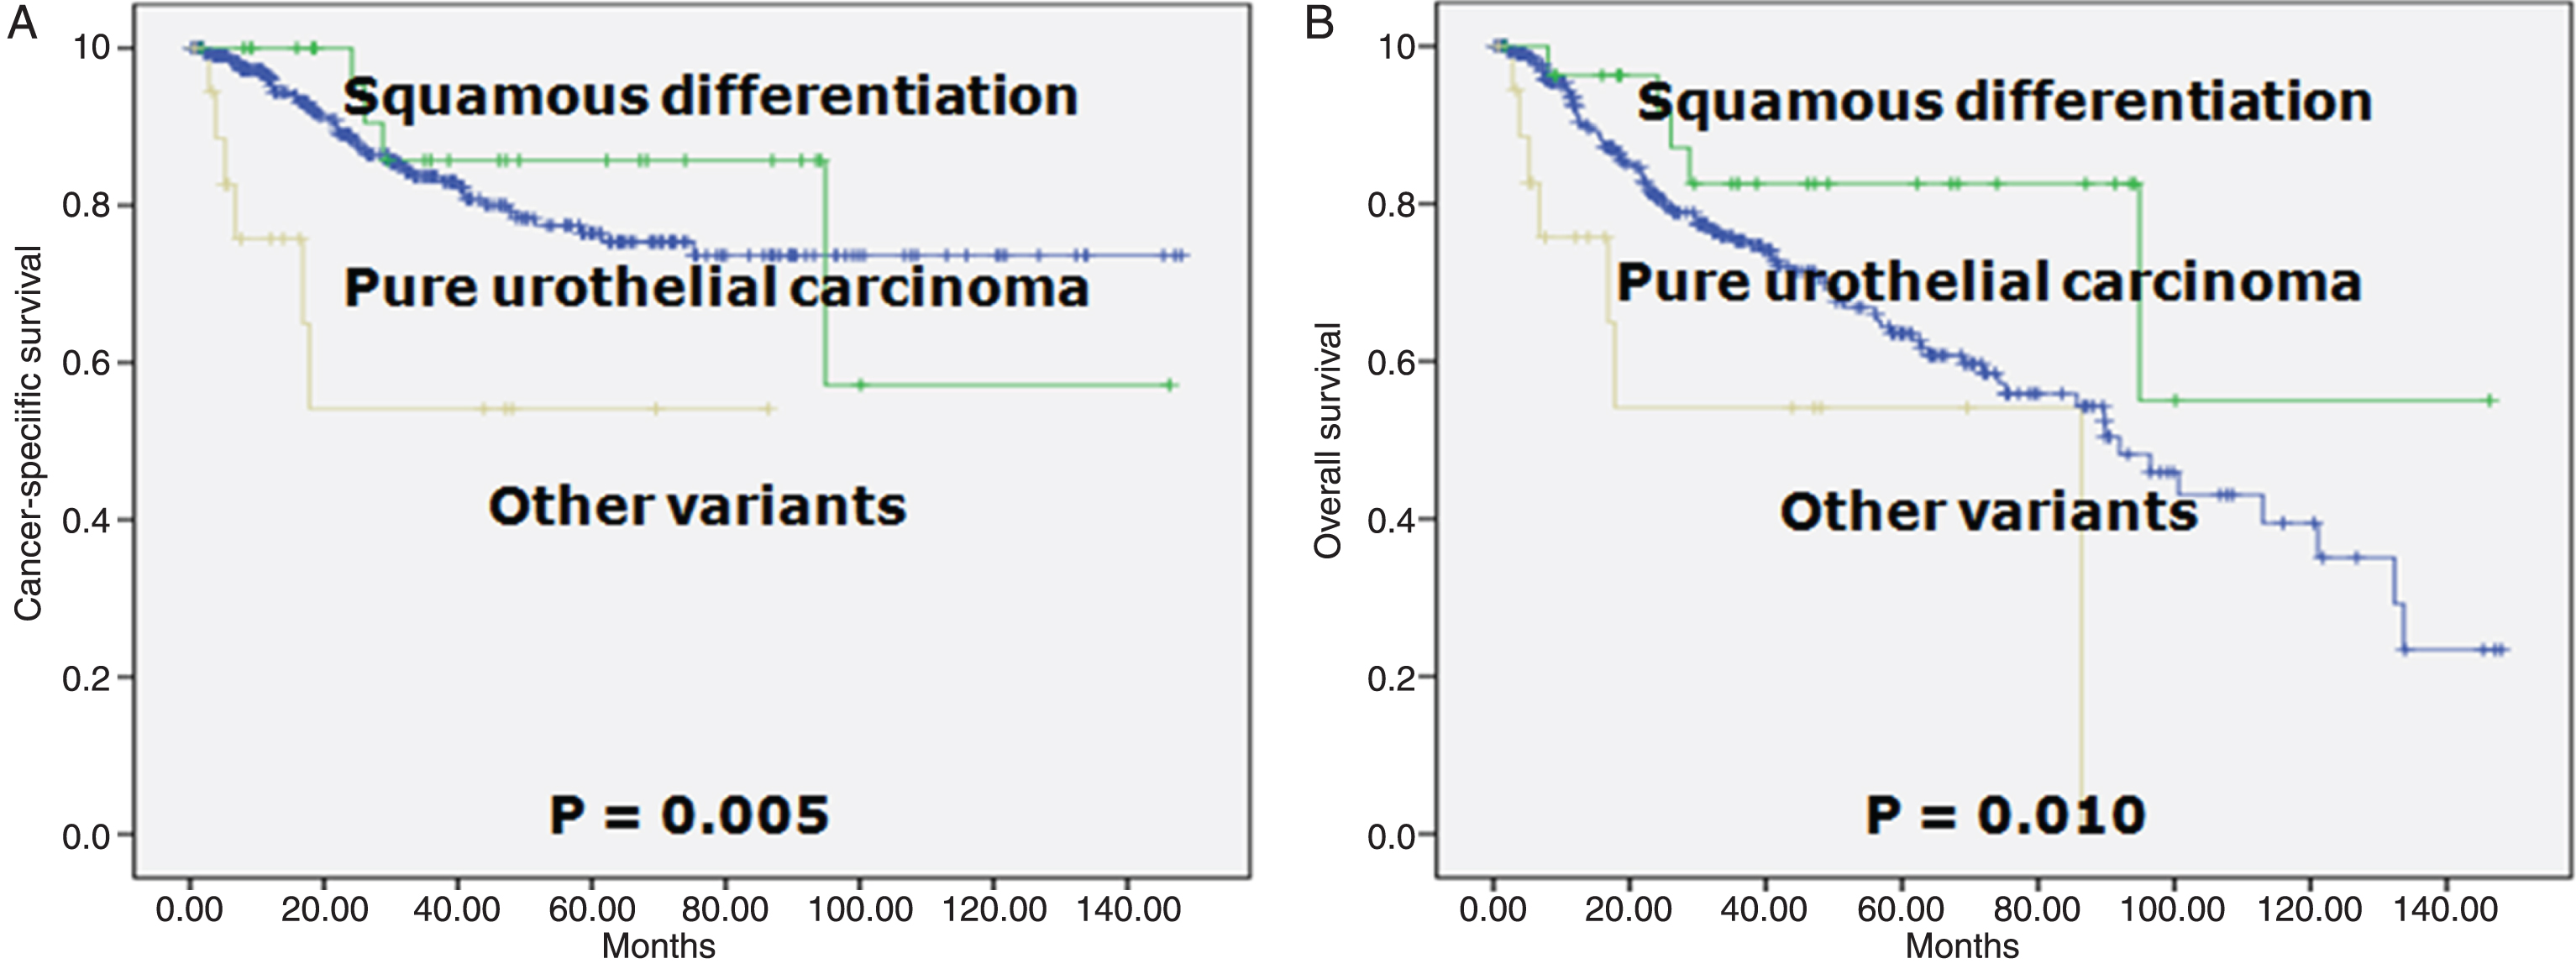
Patients with pure form and squamous differentiation did not differ significantly in terms of CSS and OS. However, statistical analysis of the survival curves of patients with pure form and other variants revealed a statistically significant difference (p = 0.005 for CSS survival and p = 0.010 for OS; Fig. 1).
Fig.1
Survival curves according to the histology. A. Cancer-specific survival (log-rank test for trend, p = 0.005). B. Overall survival (log-rank test for trend, p = 0.010).
In the univariate analyses, patient age, pT stage (≤pT1 vs. ≥pT3), pN stage, tumor grade, lymphovascular invasion, margin status and histology (pure carcinoma vs. other variants) represented statistically significant predictors of both CSS and OS (data not shown). Table 2 lists the multivariable Cox survival models and bootstrap confidence intervals for all the estimates fitted in the cohort. In the multivariate model, age, pT stage, pN stage, margin status and histology achieved independent predictor status of CSS. The score for CSS was calculated as 2 (if≥65 years) + 4 (if≥pT3) + 3 (if≥pN1) + 2 (if positive margin) + 4 (if variant form except squamous differentiation) and 0 (otherwise). The c statistic of this model was 0.756 (95% confidence interval, 0.689 to 0.822; p < 0.001) (data not shown). Another multivariable analysis revealed that age, pT stage, pN stage, and histology were independent predictors of OS. The score for OS was calculated as 4 (if≥65 years) + 4 (if≥pT3) + 3 (if≥pN1) + 3 (if variant form except squamous differentiation) and0 (otherwise). The c statistic of this model was 0.705 (95% confidence interval, 0.647 to 0.763; p < 0.001) (data not shown).
Table 2
Multivariable Cox proportional hazard regression analysis and scoring system
| HR (95% CI) | P value | Coefficient (95% CI)* | Prognostic score† | |
| CSS | ||||
| Age (years): <65 vs. ≥65 | 2.107 (1.170 to 3.797) | 0.013 | 0.745 (0.189 to 1.580) | 2 |
| pT stage: ≤pT1 vs. ≥pT3 | 3.791 (1.525 to 9.421) | 0.004 | 1.333 (0.519 to 2.425) | 4 |
| pN stage: pN0 vs. ≥pN1 | 2.937 (1.575 to 5.476) | 0.001 | 1.077 (0.377 to 1.818) | 3 |
| Margin status: negative vs. positive | 2.509 (1.101 to 5.716) | 0.029 | 0.920 (–0.670 to 1.755) | 2 |
| Histology: pure vs. variants except squamous differentiation | 4.577 (1.835 to 11.413) | 0.001 | 1.521 (0.118 to 2.832) | 4 |
| OS | ||||
| Age (years): <65 vs. ≥65 | 2.856 (1.819 to 4.485) | <0.001 | 1.050 (0.611 to 1.620) | 4 |
| pT stage: ≤pT1 vs. ≥pT3 | 3.310 (1.738 to 6.301) | <0.001 | 1.197 (0.615 to 1.930) | 4 |
| pN stage: pN0 vs. ≥pN1 | 2.660 (1.645 to 4.303) | <0.001 | 0.978 (0.419 to 1.524) | 3 |
| Histology: pure vs. variants except squamous differentiation | 2.717 (1.209 to 6.109) | 1.000 | 1.000 (0.048 to 2.046) | 3 |
HR: hazard ratio, CI: confidence interval, CSS: cancer-specific survival, OS: overall survival. *Bootstrap results are based on 1,000 bootstrap samples. †Assignment of points to risk factors was based on a linear transformation of the corresponding ß regression coefficient. The coefficient of each variable was divided by the highest coefficient, multiplied by 4, and rounded to the nearest integer.
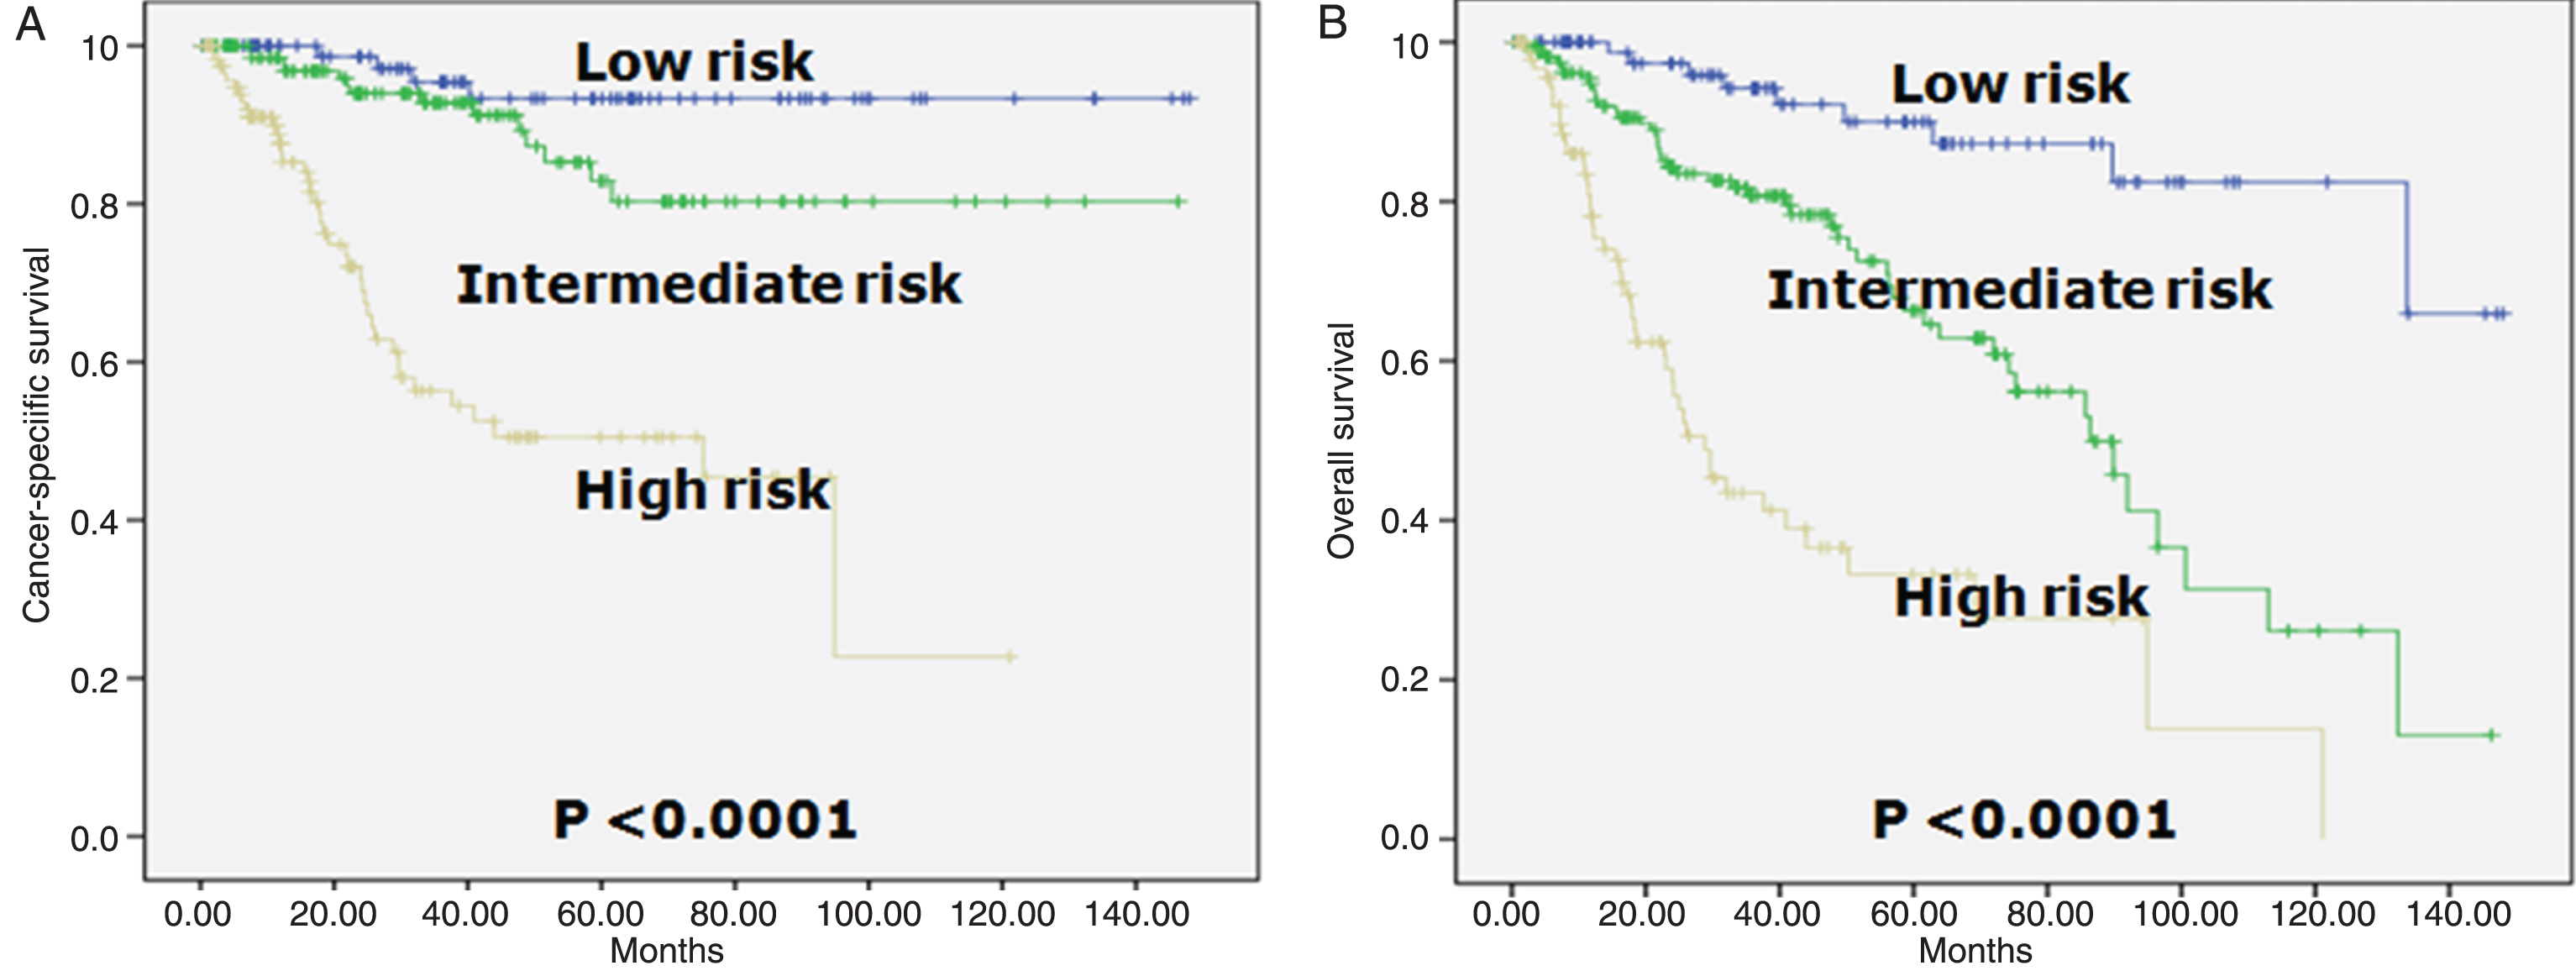
The prognostic index was categorized in three groups: low- (0 to 1 point), intermediate- (2 to 5 points), and high-risk (6 or higher points) for CSS and low- (0 to 2 points), intermediate- (3 to 7 points), and high-risk (8 or higher points) for OS, respectively. We selected a 1, 3, 5, and 7 yr time point for the test. Table 3 shows a look-up table defined using the regression coefficients of the variables included in the final model. CSS and OS rates were clearly discriminated by the scoring model. According to the new scoring model, the 5-year CSS rate in each group was 93.3%, 82.9% and 50.5%, respectively (Table 3, Fig. 2A). The 5-year OS rate in each group was 90.0%, 66.3% and 33.2%, respectively (Table 3, Fig. 2B).
Table 3
Estimated cancer-specific and overall survival at 1, 3, 5 and 7 years according to risk category
| No. patients (%) | Mean ± SE % survival (No. at risk/No. events) | ||||
| 1 yr | 3 yr | 5 yr | 7 yr | ||
| CSS | |||||
| Entire cohort | 365 | 95.3 ± 1.2 (267/15) | 82.5 ± 2.4 (152/46) | 76.3 ± 3.0 (85/55) | 74.0 ± 3.3 (43/57) |
| Low-risk | 93 (25.5) | – | 95.4 ± 2.6 (53/3) | 93.3 ± 3.3 (35/4) | 93.3 ± 3.3 (21/4) |
| Intermediate-risk | 149 (40.8) | 98.4 ± 1.1 (119/2) | 92.8 ± 2.5 (68/8) | 82.9 ± 4.8 (33/13) | 80.3 ± 5.3 (14/14) |
| High-risk | 123 (33.7) | 87.6 ± 3.2 (74/13) | 56.3 ± 5.8 (30/35) | 50.5 ± 6.1 (16/38) | 45.4 ± 7.3 (8/39) |
| OS | |||||
| Entire cohort | 365 | 91.8 ± 1.5 (267/26) | 75.0 ± 2.6 (152/70) | 64.8 ± 3.3 (85/86) | 58.1 ± 3.8 (43/93) |
| Low-risk | 94 (25.8) | – | 94.2 ± 2.8 (54/4) | 90.0 ± 4.0 (36/6) | 87.3 ± 4.7 (21/7) |
| Intermediate-risk | 173 (47.4) | 94.8 ± 1.8 (135/8) | 80.7 ± 3.5 (78/26) | 66.3 ± 5.0 (40/36) | 56.1 ± 6.0 (18/41) |
| High-risk | 98 (26.8) | 78.1 ± 4.6 (57/18) | 43.4 ± 6.2 (20/40) | 33.2 ± 6.6 (9/44) | 27.7 ± 7.5 (4/45) |
CSS: cancer-specific survival, OS: overall survival. *Risk categories for cancer-specific survival were determined by adding up the points for each of the following risk factors: ≥65 years (2 points), ≥pT3 (4 points), ≥pN1 (3 points), positive margin (2 pints), and variant form except squamous differentiation (4 points). The prognostic index was categorized in three groups: low- (0 to 1 point), intermediate- (2 to 5 points), and high-risk (6 or higher points). †Risk categories for OS were determined by adding up the points for each of the following risk factors: ≥65 years (4 points), ≥pT3 (4 points), ≥pN1 (3 points), and variant form except squamous differentiation (3 points). The prognostic index was categorized in three groups: low- (0 to 2 points), intermediate- (3 to 7 points), and high-risk (8 or higher points).
Fig.2
Kaplan-Meier survival curves in three risk group in patients who underwent radical cystectomy according to the prognostic classification. A. Cancer-specific survival (log-rank test for trend, p = 0.0010). Risk categories were determined by adding up the points for each of the following risk factors: ≥65 years (2 points), ≥pT3 (4 points), ≥pN1 (3 points), positive margin (2 pints), and variant forms except squamous differentiation (4 points). The prognostic index was categorized in three groups: low- (0 to 1 point), intermediate- (2 to 5 points), and high-risk (6 or higher points). B. Overall survival (log-rank test for trend, p = 0.0100). Risk categories were determined by adding up the points for each of the following risk factors: ≥65 years (4 points), ≥pT3 (4 points), ≥pN1 (3 points), and variant forms except squamous differentiation (3 points). The prognostic index was categorized in three groups: low- (0 to 2 points), intermediate- (3 to 7 points), and high-risk (8 or higher points).
Model discrimination of CSS and OS was good for all year models. The c statistic CSS was 0.794 at 1 yr, 0.753 at 3 yr, 0.726 at 5 yr, and 0.729 at 7 yr. The c statistic for OS was 0.771 at 1yr, 0.730 at 3 yr, 0.708 at 5yr, and 0.682 at 7 yr. Calibration was also adequate for the model in all year models. In terms of calibration, results of the Hosmer-Lemeshow goodness-of-fit test were favorable, all p values (at least p > 0.333) suggesting no evidence for rejecting the null hypothesis that the model is of adequate fit. Nagelkerke’s peudo-R2 demonstrated good predictive efficacy. However, these models for all years were able to explain less than 20% of the “variance” in outcomes. In CSS models, maximum estimate of Nagelkerke’s peudo-R2 was 0.199 and the minimum was 0.165. In OS models, maximum estimate was 0.185 and the minimum was 0.148. All models had high chi-square score. As the year increased, chi-square score increased in the multivariate likelihood ratio chi square test, which represented better homogeneity. The models for all years had low Akaike information criteria. Compared with the higher year model, lower year model had a smaller Akaike information criteria value, which represented the optimum prognostic stratification. Although prognostic separation indexes were low at 1 yr (0.124 in CSS model and 0.219 in OS model), as the year increased, index increased. The prognostic separation index values show that the greatest separations are provided at 7 yr (0.479 in CSS model and 0.596 in OS model) (Table 4).
Table 4
Performance of survival prognostic model
| Survival | ||||
| 1 yr | 3 yr | 5 yr | 7 yr | |
| CSS | ||||
| C statistic (95% CI) | 0.794 (0.709 to 0.879) | 0.753 (0.680 to 0.825) | 0.726 (0.656 to 0.797) | 0.726 (0.657 to 0.795) |
| Hosmer-Lemeshow statistic (p value) | 0.000 (1.000) | 0.000 (1.000) | 0.000 (1.000) | 0.000 (1.000) |
| Nagelkerke’s peudo-R2 | 0.192 | 0.199 | 0.165 | 0.165 |
| Likelihood-ratio χ2 (p value) | 21.444 (<0.001) | 59.877 (<0.001) | 57.686 (<0.001) | 59.137 (<0.001) |
| Akaike information criteria* | 156.734 | 460.983 | 548.448 | 563.643 |
| Prognostic separation index† | 0.124 | 0.391 | 0.428 | 0.479 |
| OS | ||||
| C statistic (95% CI) | 0.771 (0.691 to 0.850) | 0.730 (0.666 to 0.793) | 0.708 (0.647 to 0.769) | 0.694 (0.634 to 0.753) |
| Hosmer-Lemeshow statistic (p value) | 0.938 (0.333) | 0.001 (0.977) | 0.132 (0.717) | 0.698 (0.403) |
| Nagelkerke’s peudo-R2 | 0.181 | 0.185 | 0.164 | 0.148 |
| Likelihood-ratio χ2 (p value) | 26.153 (<0.001) | 53.067 (<0.001) | 57.891 (<0.001) | 60.125 (<0.001) |
| Akaike information criteria* | 273.330 | 723.621 | 870.362 | 941.464 |
| Prognostic separation index† | 0.219 | 0.508 | 0.568 | 0.596 |
CI: confidence interval, CSS: cancer-specific survival, OS: overall survival. *The Akaike information criteria were calculated by the formula: –2 log maximum likelihood + 2 x the number of parameters. †The difference in probability of death between the high- and the low-risk groups was calculated by the formula: (Phigh –Plow)/100.
DISCUSSION
Data regarding the incidence or frequency of the different HV are not available in large series reported in the urinary bladder [2]. The current evidence suggests that UC with variant forms has a worse prognosis when compared with pure UC. For example, micropapillary variant has been shown to have worse disease-specific survival compared with patients with pure UC [20]. The 5-year and 10-year survival in the largest study was 51% and 24%, respectively [21]. Sarcomatoid carcinomas present at high stage and grade, frequently with lymph node metastases and have a very poor prognosis, with 70% of death at 2 years [22]. The mean survival of small cell carcinoma is 6 to 34.9 months and the reported 5-year survival rate ranges from 8 to 40% [2]. The prognosis of plasmacytoid variant is uniformly poor, with most patients having advanced stage at presentation and metastatic disease progression [2]. On the contrary, one recent series of 30 lymphoepithelioma-like carcinomas of urinary tract found that cases treated with cystectomy had a similar prognosis to pure UC a [23]. However, when admixed with pure UC, their outcome depends on the stage of the associated pure UC [2]. The prognostic value of squamous differentiation in patients with UC is also controversial. Recent series of 113 cases treated by cystectomy found that squamous differentiation was an adverse predictor of CSS [24]. This difference in prognosis may not be apparent when corrected for stage of the disease [2]. In summary, owing to the limited number of cases reported, it is difficult to infer if the poor prognosis is related to this particular histological pattern or because of the frequently present concurrent high grade and high stage UC. In this study, we divided variant forms into squamous differentiation and other variant forms because survival differences were statistically distinct in multivariate as well as univariate model.
An important goal of a prognostic model is to classify patients into risk groups. The main reasons of prognostic models are to inform individuals about the future course of their illness, to guide doctors and patients in joints decisions on further treatment, and to select relevant patients for therapeutic research [25]. Although treatment outcomes after radical cystectomy have been based on TNM staging, for a biologically heterogeneous disease like bladder cancer, purely anatomical staging systems have limited ability to predict patient survival due to the heterogeneity of the tumor biology and patient characteristics. To circumvent these limitations, several mathematically based prognostic models were developed which appear to outperform clinical judgement in estimating outcome probabilities. However, the major pitfall in the development of these tools including nomograms and artificial neural networks is the potential lack of generalizability of the model in clinical practice. In addition, although theoretically, an artificial neural network and other machine learning techniques should have considerable advantages, these techniques do not often provide an improvement in predictive accuracy over a traditional statistical technique such as logistic or Cox regression [26, 27].
Recently, prognostic models for CSS and OS after radical cystectomy have been shown to be valuable tools [4–8]. To better assess an individual patient’s outcome following radical cystectomy for bladder, investigators have developed highly accurate tools including nomograms [5, 7, 9], an artificial neural network [6], and a model based on regression coefficient [8]. However, all these models had study limitations including retrospective data collection and/or analysis, and relatively short-term or variations in follow-up. In addition, some models had additional limitations such as a small sample size [6–9], lack of central pathology [5], use of non-specific biomarker [8], unreliability of immunohistochemical techniques [7, 9], and no external validation [6–9]. In fact, few prognostic models are routinely used in clinical practice, probably because most have not been externally validated. To date, only one model [5] of five models has been validated externally [28, 29]. The level of complexicity of a predictive or prognostic model represents another important practical consideration. Excessively complex models are clearly impracticable in clinical practice. Similarly, models that rely on variables that are not routinely available are impractical. These include models that rely on novel biomarkers, which in turn require non-commercially available and/or non-standardized assays, making the instrument unsuitable for the great majority of the clinicians.
The development of an accurate scoring system for the prediction of outcome after surgery is a major challenge. Simplicity of models and reliability of measurements are important criteria in developing clinically useful prognostic models [25]. It is straightforward to scale the weights of a logistic model to whole numbers to make the arithmetic in calculating the risk score easy [30]. An ideal system would be simple to construct, rely on readily availableobjective data, and perform consistently across low- and high-risk patient subgroups [31]. Recent work by others to develop simple rules for estimating typical, best-case and worse-case scenarios in cancers provide an important advance in personalizing discussion between patients and physicians regarding prognosis [32]. This paper reports on the development of a new prognostic model for predicting CSS and OS after radical cystectomy in patients with bladder cancer. This study demonstrates that prognostic stratification may be achieved by reconsidering HV. It is clear that adding more variables would improve the accuracy of any prognostic model. Our model fulfils many of these criteria and may have several important clinical applications. To identify the least informative variables, we applied backward variable selection, with the intent of maximizing accuracy and promoting parsimony [13, 15, 16]. This method yielded highly accurate and informative tools, which included only the key predictors without sacrificing accuracy or performance. A simple table can provide data to convert the risk score into a probability of dying. Furthermore, the cohort in this study underwent radical cystectomy by a single surgeon (SPL).
We acknowledge our study’s limitations. First, it is retrospective and is subject to inherent biases in patient and treatment selection. Second, data were obtained from a single institution and the number of patients was relatively small. Especially, small number of patients with other HV rather than squamous differentiation was included in the analysis. And because of the small sample size, HVs such as glandular differentiation and nested were not included in the study. This limitation is probably inherent to rarely occurring variant form. Further studies, incorporating larger number of the rare variant forms are still warranted to evaluate the role of these forms. Third, in the present study, although any amount of small cell histology warrants the classification of primary small cell bladder cancer, small cell carcinoma with predominantly urothelial elements was included in variant forms, since component of small cell carcinoma might determine the aggressive biological behavior of the tumor [33]. Fourth, it remains to be seen whether the characteristics of the tested cohort are representative of those of other cohorts. Although the model was validated among patients from the United States, its applicability requires further external validation at institutions different from those where this model was developed since the external validation of a prognostic model on a new series of patients is crucial [34]. Fifth, we used dichotomized variables for patient age. Although this strategy simplified the creation of a risk score, the use of continuous variables has the potential to provide more refined information [3]. Sixth, our model is only for use in patients with UC of the bladder and not suitable for other subtypes like squamous cell carcinoma or adenocarcinoma. Seventh, this model did not include molecular or genetic biomarkers that have been reported to have independent prognostic value [7, 9]. The incremental value of these biomarkers, in addition to the factors used in our model, in predicting outcome remains unknown and warrants further research. Eighth, the proportion of non-muscle invasive bladder cancer is high in the cohort. Finally, the accuracy of our model is not perfect, a shortcoming shared with all prognostic models.
CONCLUSIONS
UC with variant forms presents a higher stage and grade, compared with pure UC. In the present study, HV were found to be important independent prognostic factors in bladder cancer. Prognosis is variable; when compared to pure UC, it does not seem worse in squamous differentiation after radical cystectomy while it seems worse in other variants. This paper presents a new prognostic model incorporating variant forms for predicting CSS and OS in these patients. The model has been shown to perform well and may be useful for predicting individual survival probabilities and directing therapy. We hope that this scoring model may help stratify the risk of prognosis in patients treated with radical cystectomy.
REFERENCES
[1] | Ferlay J , Soerjomataram I , Dikshit R , Eser S , Mathers C , Rebelo M , et al. Cancer incidence and mortality worldwide: Sources, methods and major patterns in GLOBOCAN 2012. Int J Cancer. (2015) ;136: (5):E359–86. |
[2] | Amin MB . Histological variants of urothelial carcinoma: Diagnostic, therapeutic and prognostic implications. Mod Pathol. (2009) ;22: (Suppl 2):S96–S118. |
[3] | Rogers CG , Palapattu GS , Shariat SF , Karakiewicz PI , Bastian PJ , Lotan Y , Gupta A , Vazina A , Gilad A , Sagalowsky AI , Lerner SP , Schoenberg MP . Clinical outcomes following radical cystectomy for primary nontransitional cell carcinoma of the bladder compared to transitional cell carcinoma of the bladder. J Urol. (2006) ;175: :2048–53. |
[4] | Moschini M , D’Andrea D , Korn S , Irmak Y , Soria F , Comperat E , et al. Characteristics and clinical significance of histological variants of bladder cancer. Nat Rev Urol. (2017) ;14: (11):651–68. |
[5] | Shariat SF , Karakiewicz PI , Palapattu GS , Amiel GE , Lotan Y , Rogers CG , Vazina A , Bastian PJ , Gupta A , Sagalowsky AI , Schoenberg M , Lerner SP . Nomograms provide improved accuracy for predicting survival after radical cystectomy. Clin Cancer Res. (2006) ;12: :6663–76. |
[6] | Bassi P , Sacco E , De Marco V , Aragona M , Volpe A . Prognostic accuracy of an artificial neural network in patients undergoing radical cystectomy for bladder cancer: A comparison with logistic regression analysis. BJU Int. (2007) ;99: :1007–12. |
[7] | Shariat SF , Chade DC , Karakiewicz PI , Ashfaq R , Isbarn H , Fradet Y , Bastian PJ , Nielsen ME , Capitanio U , Jeldres C , Montorsi F , Lerner SP , Sagalowsky AI , Cote RJ , Lotan Y . Combination of multiple molecular markers can improve prognostication in patients with locally advanced and lymph node positive bladder cancer. J Urol. (2010) ;183: :68–75. |
[8] | Gakis G , Todenhöfer T , Renninger M , Schilling D , Sievert KD , Schwentner C , Stenzl A . Development of a new outcome prediction model in carcinoma invading the bladder based on preoperative serum C-reactive protein and standard pathological risk factors: The TNR-C score. BJU Int. (2011) ;108: :1800–5. |
[9] | Shariat SF , Karakiewicz PI , Ashfaq R , Lerner SP , Palapattu GS , Cote RJ , Sagalowsky AI , Lotan Y . Multiple biomarkers improve prediction of bladder cancer recurrence and mortality in patients undergoing cystectomy. Cancer. (2008) ;112: :315–25. |
[10] | Sobin LH , Wittekind C . TNM Classification of Malignant Tumors, 5th ed. International Union Against Cancer (UICC). New York. John Wiley & Sons, (1997) . |
[11] | Mostofi FK , Davis CJ , Sesterhenn IA . Histological Typing of Urinary Bladder Tumors. Springer Verlag, Berlin, (1999) . |
[12] | Eble JN , Sauter G , Epstein JI , Sesterhenn IA . eds. World health Organisation classification of tumours. Tumours of the urinary system and male genital organs. Lyon: IARC Press, (2004) ;90–109. |
[13] | Van Houwelingen JC , Le Cessie S . Predictive value of statistical models. Stat Med. (1990) ;9: :1303–25. |
[14] | Iimura Y , Saito K , Fujii Y , Kumagai J , Kawakami S , Komai Y , Yonese J , Fukui I , Kihara K . Development and external validation of a new outcome prediction model for patients with clear cell renal cell carcinoma treated with nephrectomy based on preoperative serum C-reactive protein and TNM classification: The TNM-C score. J Urol. (2009) ;181: :1004–12. |
[15] | Harrell FE Jr , Califf RM , Pryor DB , Lee KL , Rosati RA . Evaluating the yield of medical tests. JAMA. (1982) ;247: :2543–6. |
[16] | Harrell FEJr , Lee KL , Mark DB . Multivariable prognostic models: Issues in developing models, evaluating assumptions and adequacy, and measuring and reducing errors. Stat Med. (1996) ;15: :361–87. |
[17] | Hosmer DW , Lemeshow S . Applied logistic regression. 2nd ed. New York: John Willey & Sons; (2000) . |
[18] | Akaike H . A new look at the statistical model identification. IEEE Trans Automatic Control. (1974) ;AC19: :716–23. |
[19] | Altman DG , Royston P . What do we mean by validating a prognostic model? Stat Med. (2000) ;19: :453–73. |
[20] | Compérat E , Roupret M , Yaxley J , Reynolds J , Varinot J , Ouzaïd I , Cussenot O , Samaratunga H . Micropapillary urothelial carcinoma of the urinary bladder: A clinicopathological analysis of 72 cases. Pathology. (2010) ;42: :650–4. |
[21] | Kamat AM , Dinney CP , Gee JR , Grossman HB , Siefker-Radtke AO , Tamboli P , Detry MA , Robinson TL , Pisters LL . Micropapillary bladder cancer: A review of the University of Texas M. D. Anderson Cancer Center experience with 100 consecutive patients. Cancer. (2007) ;110: :62–7. |
[22] | Wright JL , Black PC , Brown GA , Porter MP , Kamat AM , Dinney CP , Lin DW . Differences in survival among patients with sarcomatoid carcinoma, carcinosarcoma and urothelial carcinoma of the bladder. J Urol. (2007) ;178: :2302–6. |
[23] | Tamas EF , Nielsen ME , Schoenberg MP , Epstein JI . Lymphoepithelioma-like carcinoma of the urinary tract: A clinicopathological study of 30 pure and mixed cases. Mod Pathol. (2007) ;20: :828–34. |
[24] | Antunes AA , Nesrallah LJ , Dall’Oglio MF , Maluf CE , Camara C , Leite KR , Srougi M . The role of squamous differentiation in patients with transitional cell carcinoma of the bladder treated with radical cystectomy. Int Braz J Urol. (2007) ;33: :339–45. |
[25] | Moons KG , Royston P , Vergouwe Y , Grobbee DE , Altman DG . Prognosis and prognostic research: What, why, and how? BMJ. (2009) ;338: :b375. |
[26] | Sargent DJ . Comparison of artificial neural networks with other statistical approaches: Results from medical data sets. Cancer. (2001) ;91: (8 Suppl):1636–42. |
[27] | Kattan MW . Comparison of Cox regression with other methods for determining prediction models and nomograms. J Urol.S. (2003) ;170: (6 Pt 2):6–9. |
[28] | Zaak D , Burger M , Otto W , Bastian PJ , Denzinger S , Stief CG , Buchner H , Hartmann A , Wieland WF , Shariat SF , Fritsche HM . Predicting individual outcomes after radical cystectomy: An external validation of current nomograms. BJU Int. (2010) ;106: :342–8. |
[29] | Nuhn P , May M , Sun M , Fritsche HM , Brookman-May S , Buchner A , Bolenz C , Moritz R , Herrmann E , Burger M , Tilki D , Trojan L , Perrotte P , Haferkamp A , Hohenfellner M , Wieland WF , Müller SC , Karakiewicz PI , Bastian PJ . External validation of postoperative nomograms for prediction of all-cause mortality, cancer-specific mortality, and recurrence in patients with urothelial carcinoma of the bladder. Eur Urol. (2011) , doi: 10.1016/j.eururo.2011.07.066 |
[30] | Royston P , Altman DG . Risk stratification for in-hospital mortality in acutely decompensated heart failure. JAMA. (2005) ;293: :2467–8. |
[31] | Richards CH , Leitch EF , Anderson JH , McKee RF , McMillan DC , Horgan PG . The Revised ACPGBI Model is a Simple and Accurate Predictor of Operative Mortality After Potentially Curative Resection of Colorectal Cancer. Ann Surg Oncol. (2011) DOI: 10.1245/s10434-011-1805-1 |
[32] | Kiely BE , Soon YY , Tattersall MH , Stockler MR . How long have I got? Estimating typical, best-case, and worst-case scenarios for patients starting first-line chemotherapy for metastatic breast cancer: A systematic review of recent randomized trials. J Clin Oncol. (2011) ;29: :456–63. |
[33] | Black PC , Brown GA , Dinney CP . The impact of variant histology on the outcome of bladder cancer treated with curative intent. Urol Oncol. (2009) ;27: :3–7. |
[34] | Moons KG , Altman DG , Vergouwe Y , Royston P . Prognosis and prognostic research: Application and impact of prognostic models in clinical practice. BMJ. (2009) ;338: :b606. |


