
Quantitative Assessment of Heterogeneity in Bladder Tumor MRI Diffusivity: Can Response be Predicted Prior to Neoadjuvant Chemotherapy?
Abstract
Background:
It is a critical unmet need to predict chemosensitivity in muscle-invasive bladder cancer patients who receive neoadjuvant chemotherapy (NAC). Quantification of tumor heterogeneity has been shown to be useful in the assessment of therapeutic response. Apparent diffusion coefficient (ADC) is derived from diffusion weighted MRI (DWI) to quantify the water diffusivity which characterizes micro-cellularity in tumor tissues.
Objective:
The aim of this study is to assess if a quantitative measurement of ADC heterogeneity in bladder tumors can be a predictor of therapeutic response to NAC.
Materials and Methods:
Twenty patients with pT2 bladder cancer have been included in this study. Patient MRI was performed on a 3T system with DWI prior to NAC. Regions of interest (ROIs) were placed over the whole tumor volume on ADC maps to acquire a data matrix of voxel-wise ADC values for each patient. We performed histogram analysis on each ADC data matrix to calculate uniformity (U) and entropy (E). These quantities were subsequently correlated with the patient’s response to chemotherapy. Statistical significance was found with P < 0.05.
Results:
Fifteen patients were categorized as responders, and five as non-responders. The data showed that tumors of responders were significantly higher in U (P = 0.01) and lower in E (P < 0.01) than non-responders. This finding indicates that resistant tumors were more heterogeneous in their spatial distribution of ADC values. While this difference in ADC heterogeneity was not always visually recognizable, it could be quantified by the data analytics.
Conclusions:
This study demonstrates that the quantitative readout of tumor heterogeneity in micro-cellularity is associated with the patient’s defined response to chemotherapy. Quantification of tumor ADC heterogeneity may provide useful information to enable the prediction of chemotherapeutic response prior to the treatment to improve patient outcomes.
INTRODUCTION
Recent randomized clinical trials have provided evidence that neoadjuvant chemotherapy (NAC) improves the overall survival of patients with muscle invasive bladder cancer (MIBC) [1–4]. However, not all patients benefit from NAC and for those who do not respond, NAC may result in potential disease progression, unnecessary delay of definitive treatment, and drug toxicity [5, 6].
Recently, pT0N0 has been accepted as the primary surrogate endpoint for the patient’s overall survival after NAC [1, 7, 8]. However, it has been reported that there is no statistically significant difference between pT0N0 and pTa/Tis/T1N0 in the patient’s overall survival [8]. Hence, it is critical to establish a biomarker that characterizes chemotherapy effect in terms of overall survival. A number of studies in gene expression and bladder imaging, which use different response criteria including pT0N0, pT1N0, or survival, have been conducted to resolve this unmet need [7, 9–17]. However, there are still no biomarkers available in clinical practice to date.
Quantification of tumor heterogeneity has been shown to be valuable in the diagnosis, characterization, or therapeutic response assessment in the management of different cancers [10, 18–22]. Thus, it is of high clinical interest to evaluate the correlation of tumor heterogeneity with the patient’s response to therapeutic treatment.
Tumor imaging combined with data analytics can provide insightful information on the spatial heterogeneity of tumor characteristics to aid in the tumor staging and response monitoring [18, 19, 23, 24]. Magnetic resonance imaging (MRI) has shown the most potential in this approach as it is versatile to quantify a variety of pathophysiological features using different quantitative techniques, including diffusion weighted imaging (DWI) and dynamic contrast enhanced MRI (DCE-MRI) [10, 19, 22, 24, 25]. Histogram analysis has been one of the most widely applied tools for texture analysis of tumor characteristics [19, 21, 22, 25]. The analytical tool can be reproducibly applied and provide the quantitative measurement of heterogeneity [18, 19, 25].
This study was part of our prospective clinical research that has been conducted to assess the clinical utility of 3T multi-parametric MRI to improve the clinical management of patients with bladder cancer. In this part of the research, we focus on the application of histogram analysis to quantify the tumor heterogeneity in Apparent Diffusion Coefficient (ADC) - a parameter derived from DWI to characterize tissue micro-cellularity - in bladder tumors to investigate the feasibility of predicting chemosensitivity before the start of NAC.
MATERIALS AND METHODS
Subjects
Our 3T MRI study was approved by the institutional review board in 2009. Enrollment criteria included: (1) Pathological diagnosis of muscle-invasive bladder cancer (MIBC); (2) Planned neoadjuvant chemotherapy (NAC); (3) Planned radical cystectomy following NAC; (4) No MRI contradictions. From August 2010 to March 2016, twenty patients (18 males, 2 females; Age: range, 51–75 years; median: 61 years) who had diagnostic transurethral resection of bladder tumor (TURBT) were included in the DWI study. All patients provided written informed consent before their enrollment. Each patient had a pre-chemotherapy (baseline) MRI and radical cystectomy after NAC. Pathological findings of cystectomy specimens were used as reference standard. The oncologic response criteria for NAC were defined as having the post-surgical pathological stage of≤ypT1 or ypT2 accompanied with RECIST response [26].
The neoadjuvant chemotherapy regimen included 4 cycles of cisplatin-based combination. The patients either received GC (gemcitabine, cisplatin; 3-weeks per cycle) or dd-MVAC (dose dense methotrexate, vinblastine, doxorubicin, cisplatin; 2 weeks per cycle).
MRI Protocol
Patient MRIs were performed on a 3T multi-transmit system (Ingenia CX, Philips Healthcare) with digital 32-channel phased array surface coils. Anatomical high-resolution T2W MRI was performed with turbo spin echo (TSE) sequence (TR/TE = 4264/80 ms; matrix = 468×380; in-plane FOV = 300×340; slice thickness = 3 mm; slice gap = 0.3 mm; number of slices = 40; number of signal average = 2; echo train length = 19). Diffusion weighted MRI (DWI) was implemented with a single-shot echo-planar imaging (ssh-EPI) sequence (TR/TE = 2017/59 ms; matrix = 100/140; in-plane FOV = 220/317; slice thickness = 3.0 mm; slice gap = 0.3 mm; number of slices = 25; number of signal average = 6; b-values = 0, 333, 667, 1000 s/mm2) after T2W MRI and before the administration of Gd-based contrast agent. All sequences were acquired in the transverse orientation.
Data Analysis
DWI data was post-processed after the data acquisition using the Philips system software to obtain ADC maps. A radiologist who was blinded to the pathological findings reviewed the ADC maps for the placement of region of interest (ROI). Freehand ROIs were positioned on the whole tumor volume on grey-scaled ADC maps (Fig. 1) to obtain a data matrix of voxel-wise ADC values for each patient.
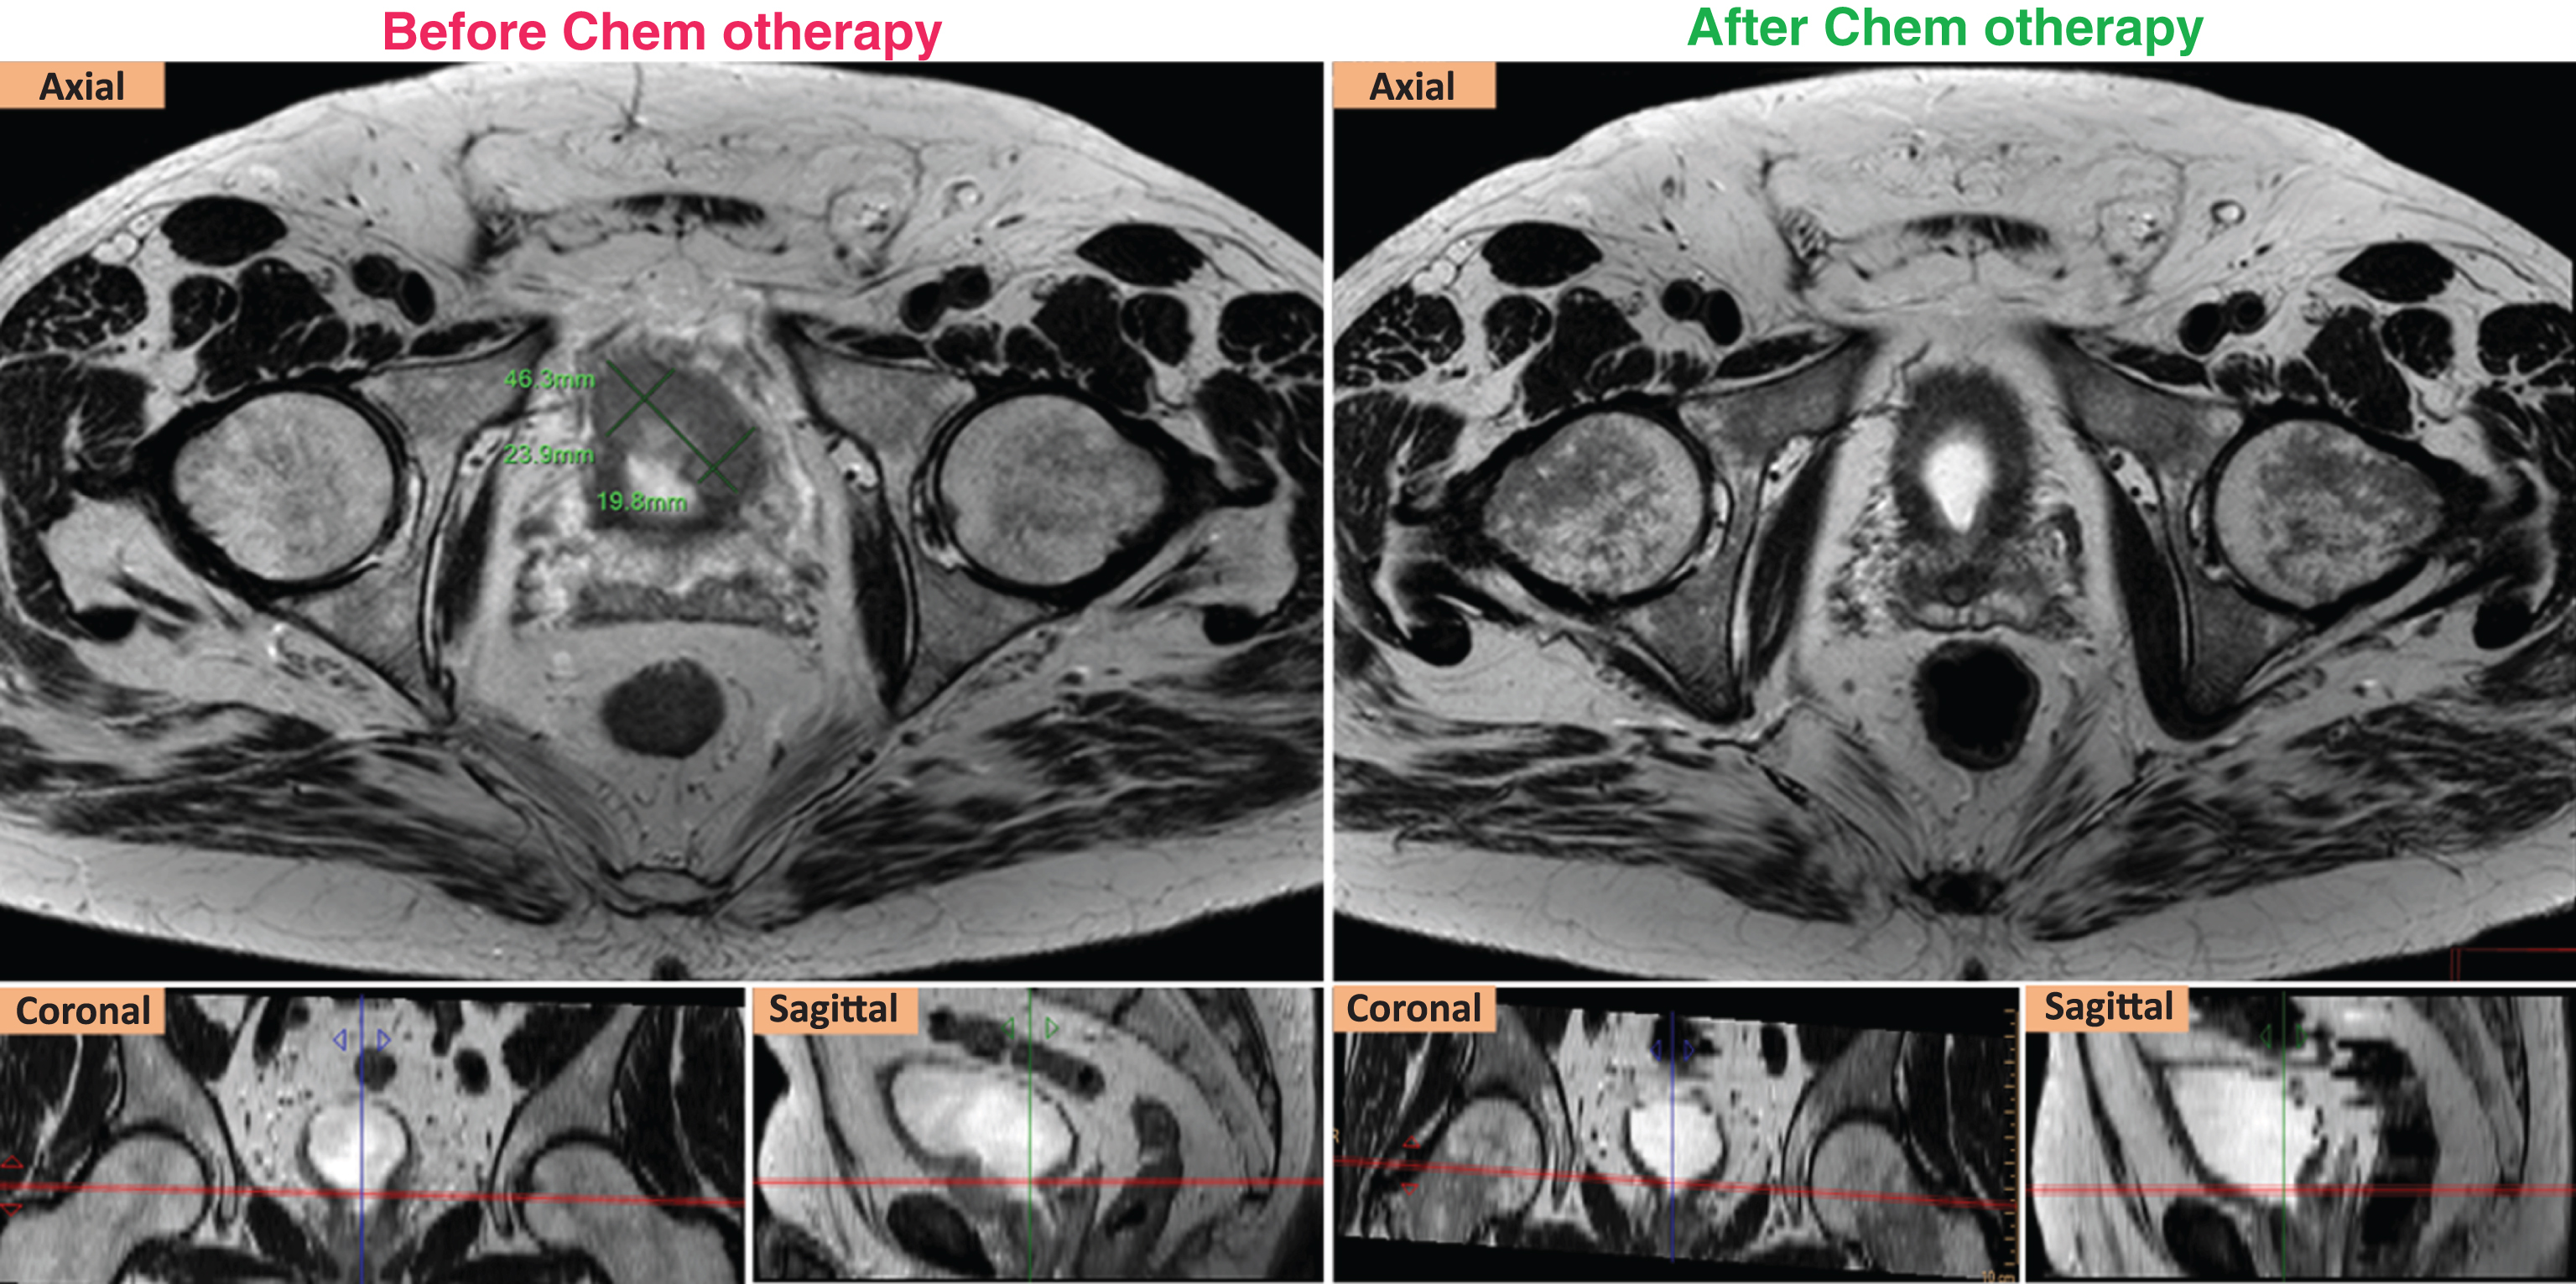
Fig.1
RECIST response of a ypT2aN0 case. Left (axial, coronal, sagittal) T2W images show that the targeted tumor was measured at 4.36 cm in the longest diameter before chemotherapy. Right (axial, coronal, sagittal) T2W images show that the targeted tumor was not seen after chemotherapy.
Histogram analysis was performed on each patient’s ADC data matrix using Microsoft Excel (Version 2016) to calculate two quantities, uniformity (U) and entropy (E) at baseline (pre-chemotherapy). The same bin size was used for the histogram of all cases. The formulas U and E are below [18]:
U and E were subsequently correlated with the patient’s chemotherapeutic response (as defined above) to evaluate the statistical significance of their correlation with the response.
Statistical analysis
The statistical analysis was performed on a commercial statistical package (SAS for Windows ® Version 9.4; SAS Institute Inc., Cary, NC, USA). U and E were summarized using descriptive statistics (mean and standard deviation) for responders and non-responders. The Kolmogorov-Smirnov test was used to assess the normality of distribution of U and E. The values were compared between the two groups (response and non-response) using two sample t-test.
Overall survival (OS) was calculated from the date of diagnosis to death from any cause or the date of last follow-up. Patients who were still alive were censored at the last follow-up. Survival curves were estimated using the method of Kaplan-Meier. OS are compared between responders and non-responders using log-rank test. P < 0.05 was considered statistically significant.
RESULTS
Response Categorization and Tumor Characteristics
After NAC, the pathological examination of cystectomy specimens found thirteen patients with≤ypT1N0, and two with ypT2a N0. The targeted lesions of the two ypT2a cases met the RECIST response criteria (Fig. 1). Thus, these fifteen patients were defined as responders. Of the other five patients, four were staged≥ypT3a N0, and one had the stage of ypT2b with a large residual tumor volume. These five cases were considered as non-responders. The details of ypTN stage of all cases are summarized in Table 1.
Table 1
The distribution of pTN stages among 20 cases after neoadjuvant chemotherapy
| ypTN stage | ypT0N0 | ypTisN0 | ypT1N0 | ypT2aN0 | ypT2bN0 | ypT3aN0 | ypT3bN0 | ypT3bN1 |
| # of cases | 8 | 4 | 1 | 2 | 1 | 1 | 2 | 1 |
Seven patients with a residual tumor had the histologic type of urothelial carcinoma. Other tumors were found with mixed histology variants including urothelial with squamous differentiation or urothelial with focal micropapillary. Tumor size ranged from 0.8 cm to 10 cm. The largest tumor (10 cm in size) had the stage of ypT3b.
Spatial heterogeneity of tumor ADC before chemotherapy
There was a variety of spatial heterogeneity observed in bladder tumors prior to the reactive changes induced by chemotherapy. The heterogeneity was shown on both anatomical (T2W) images and ADC maps (Fig. 2). The tumors of both responders and non-responders contained tissues with a range of ADC values as seen on grey-scaled ADC maps where the tumors had a mixture of dark and light signal intensity. The color-coded ADC maps could better reflect the ADC spatial distribution with a spectrum of colors on tumor areas (Fig. 1).
Fig.2
ADC heterogeneity in the bladder tumor of a responder (upper) vs. a non-responder (lower). Red contours illustrate the ROIs placed on the tumors. The color scale column is given on the right. ADC values are scaled with the color spectrum from the lowest ADC at the bottom to the highest ADC at the top of the column. Please note that higher micro-cellularity underlies lower ADC in tumor tissues. Responder (stage pT1N0): U = 0.08; E = 3.81; Non-responder (stage pT3bN0): U = 0.06; E = 4.12.
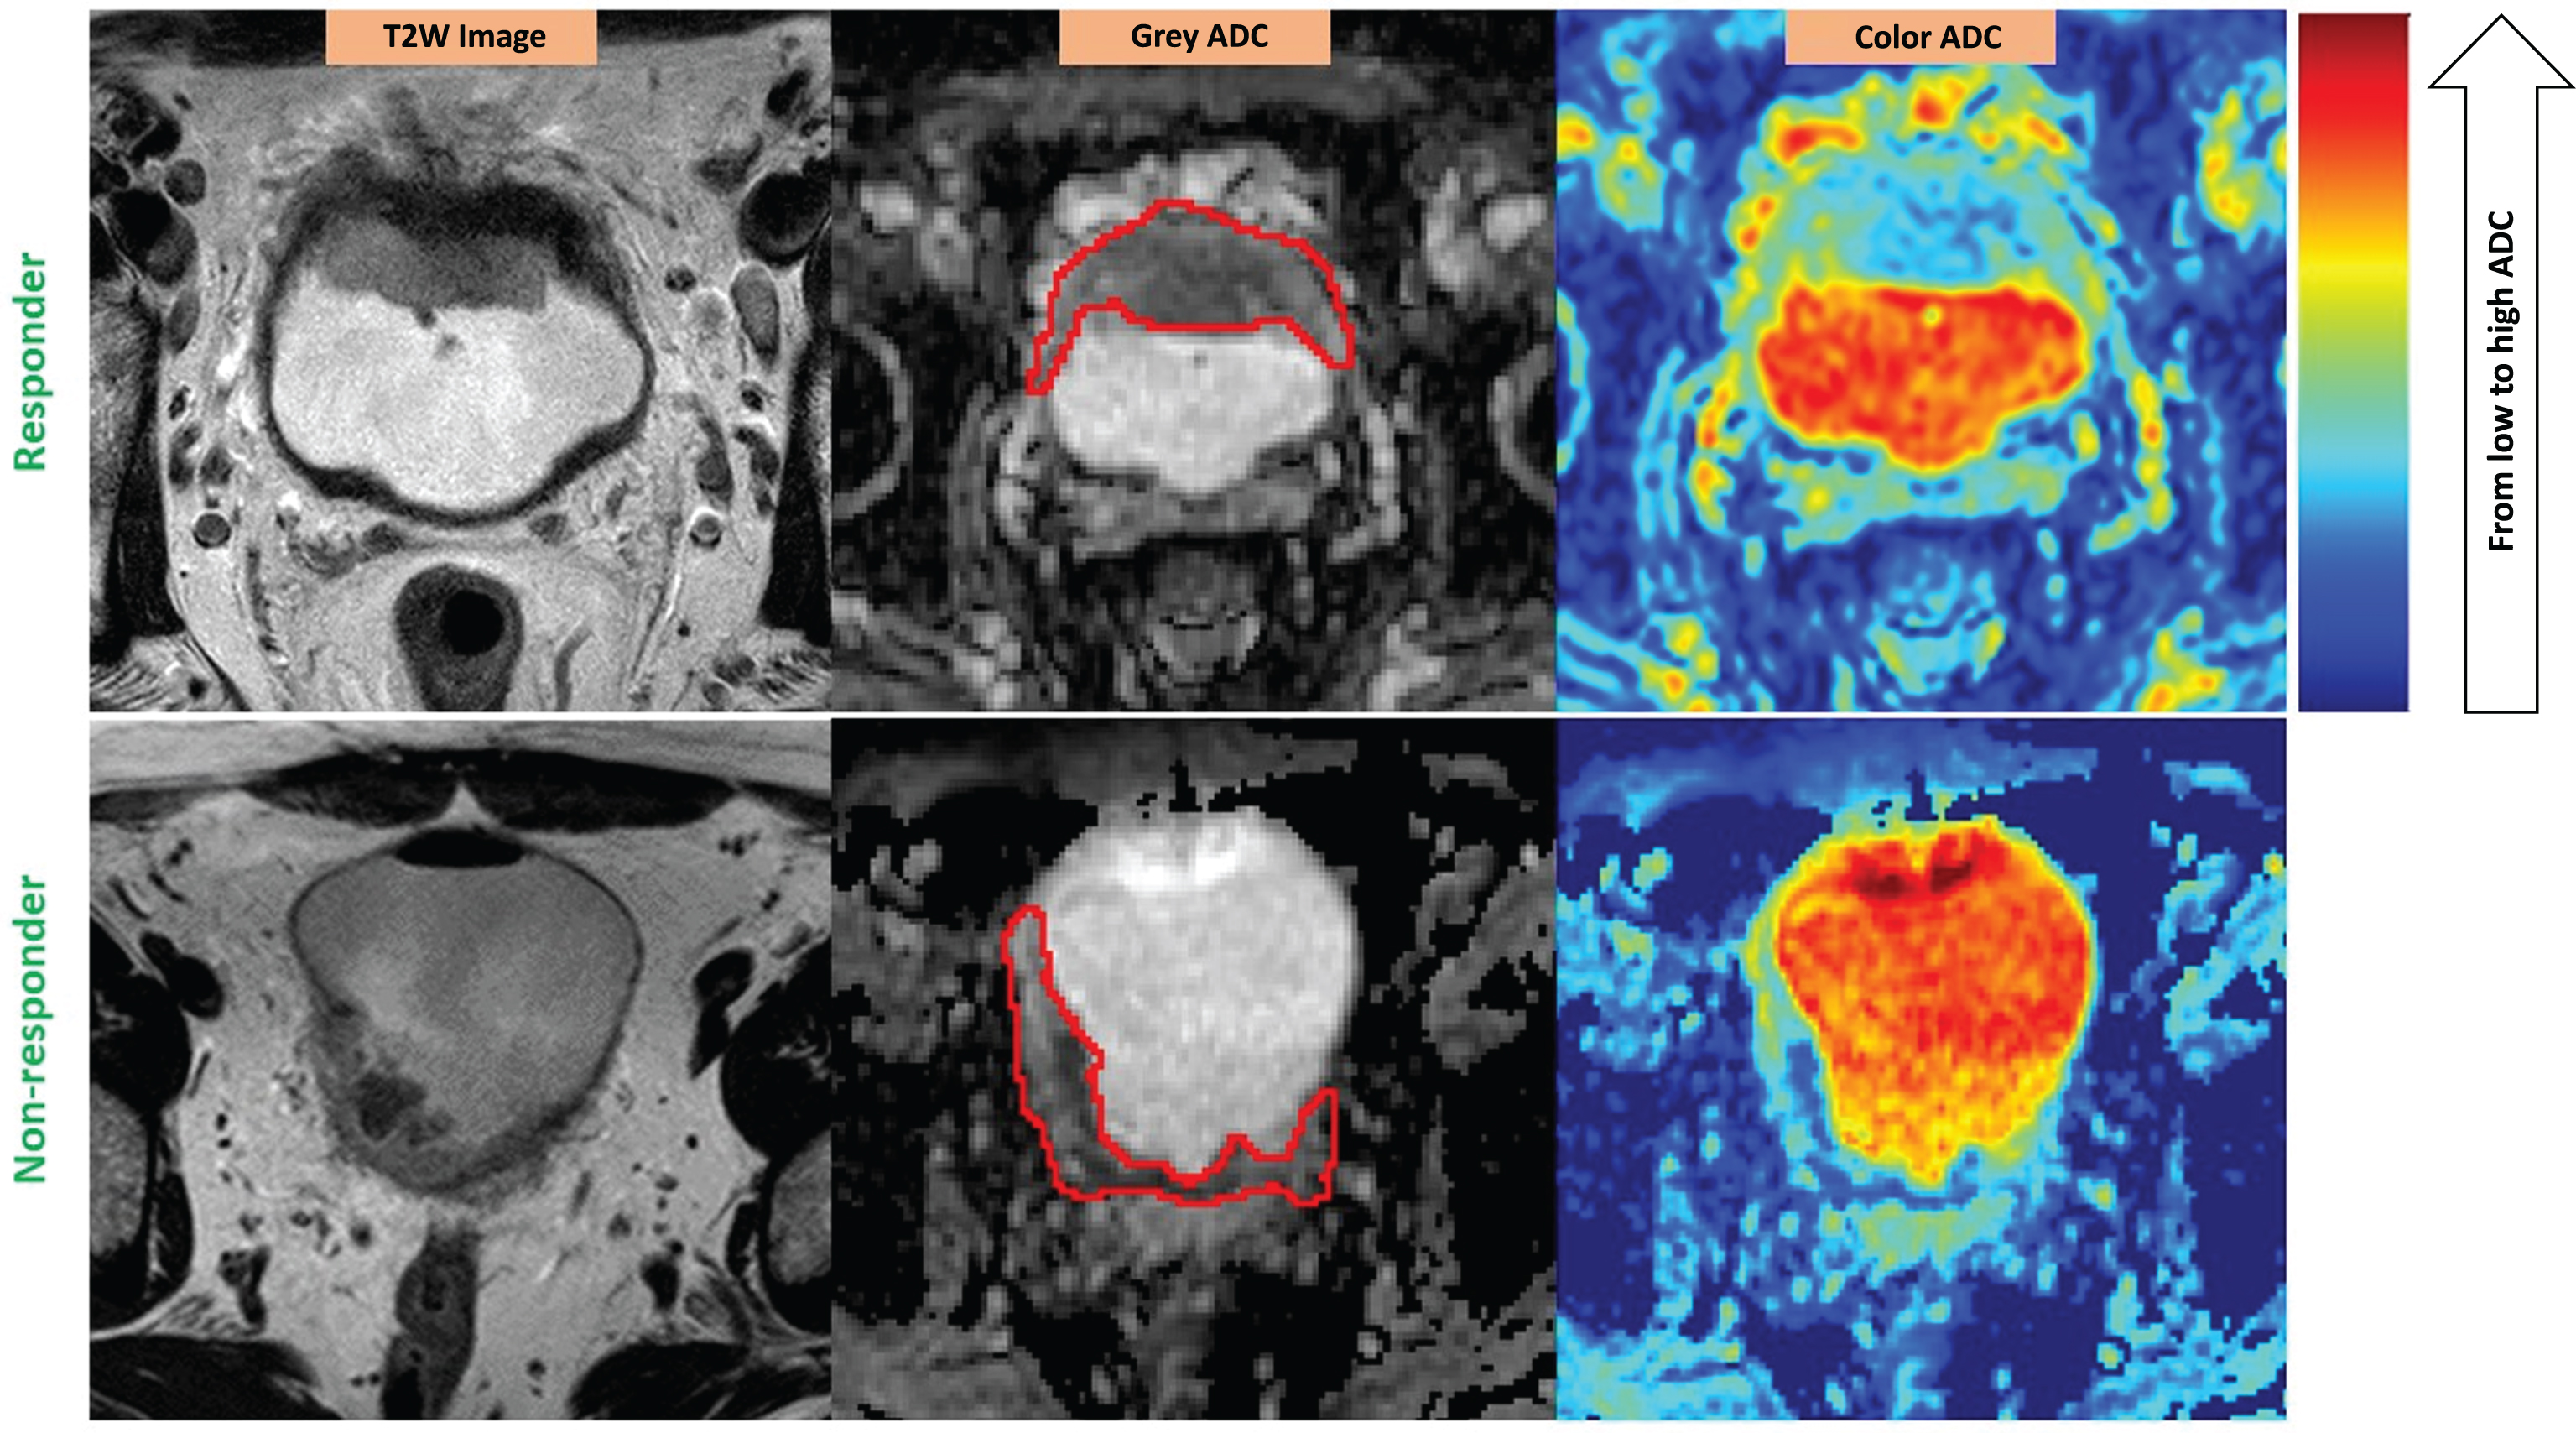
The heterogeneity could be seen on ADC maps. However, the level of heterogeneity could not be visually assessed or compared from case to case without applying the data analysis tool – histogram analysis.
High level of ADC heterogeneity is associated with tumor resistance
Table 2 gives the values of E and U in responders compared to non-responders. The Kolmogorov-Smirnov test indicated that both E and U were normally distributed (p > 0.15).
Table 2
E and U in the groups of responders vs. non-responders
| Responders | Non-responders | P value | |
| (n = 15) | (N = 5) | ||
| U (Average±STD) | 0.09±0.02 | 0.07±0.01 | 0.01 |
| E (Average±STD) | 3.71±0.27 | 4.15±0.30 | <0.01 |
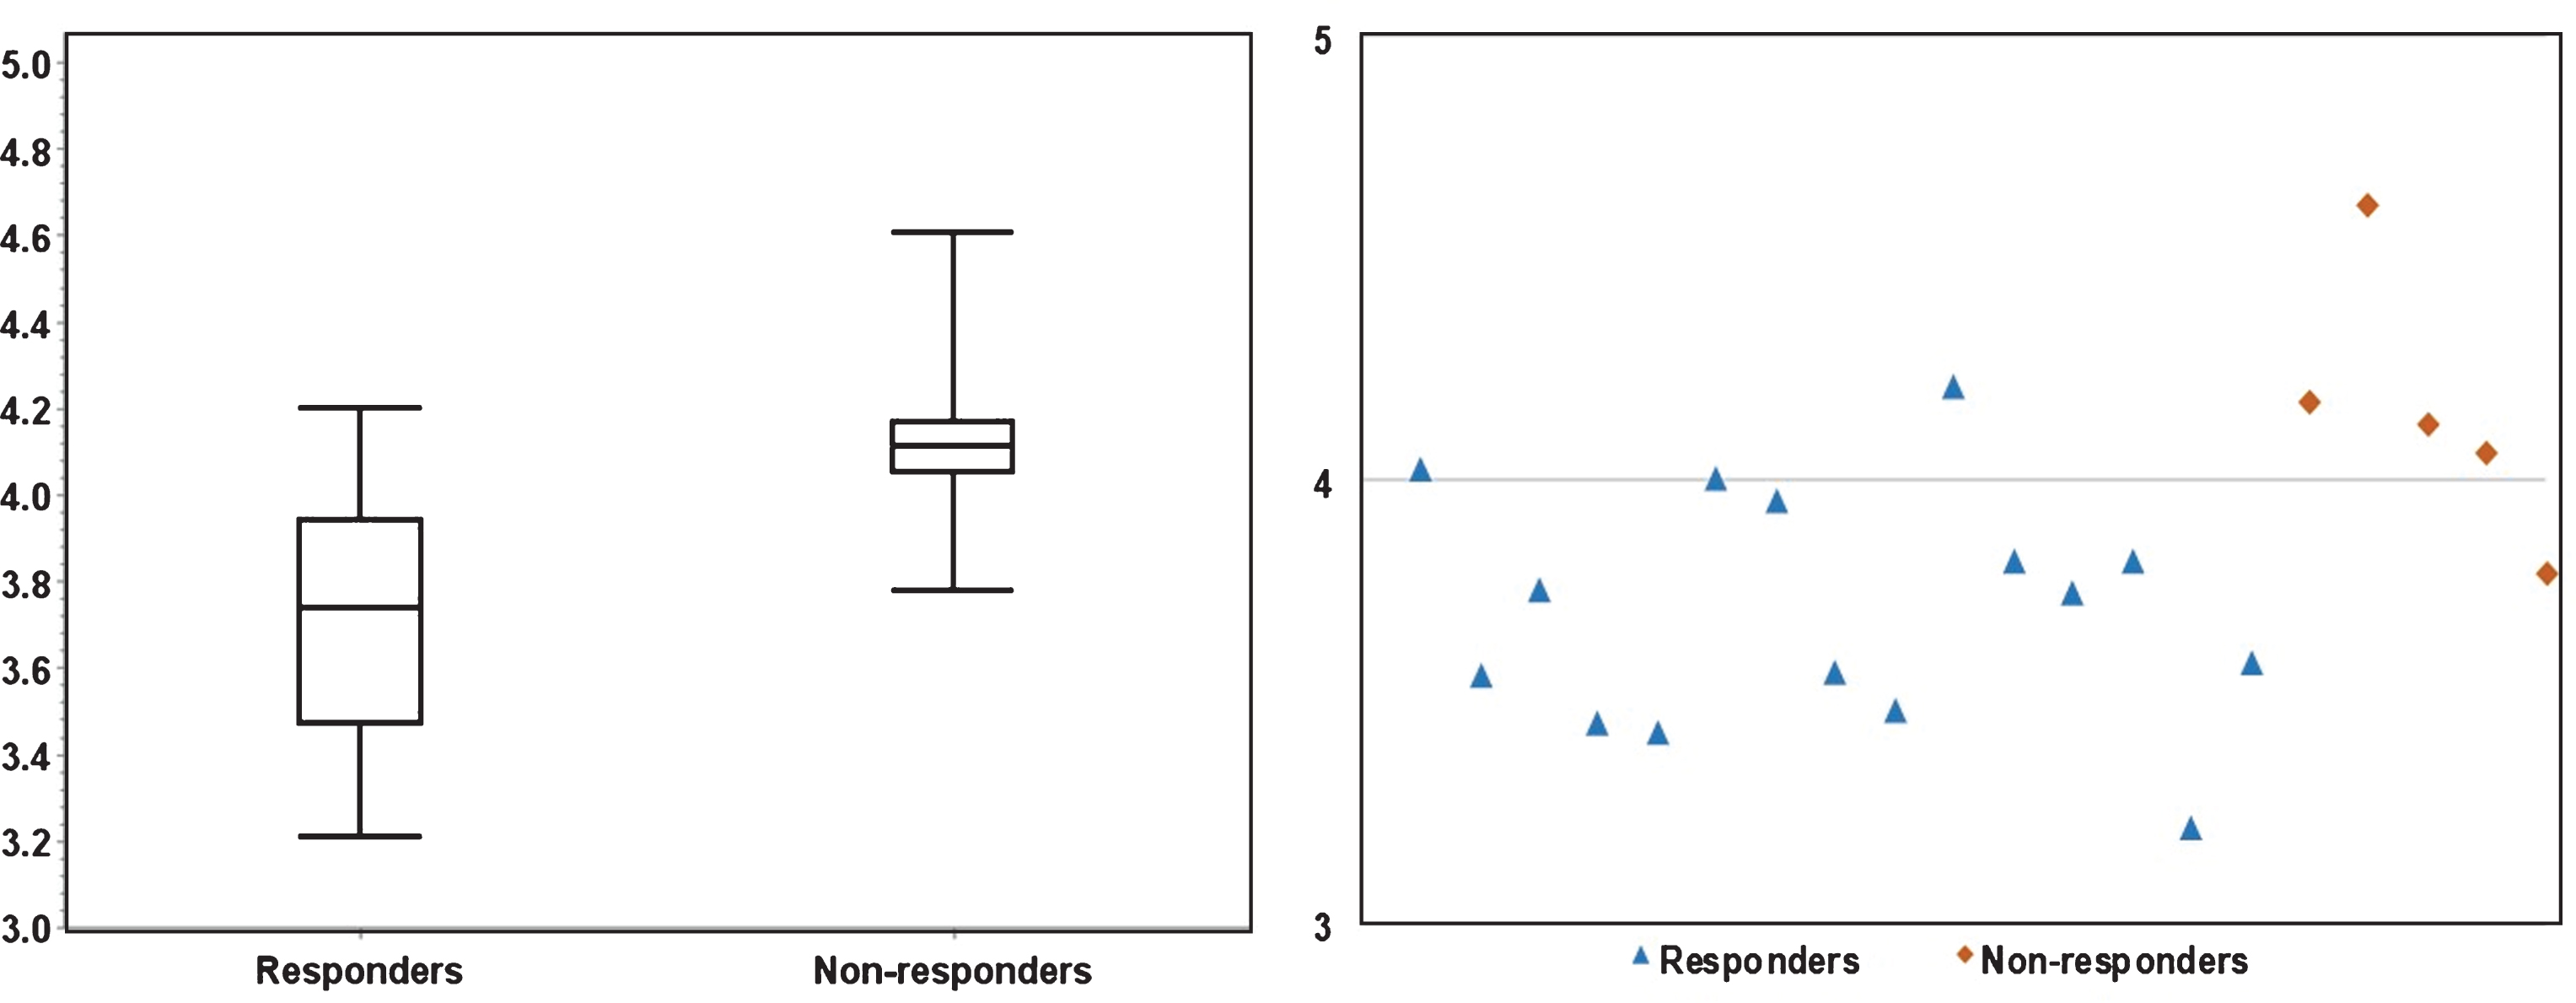
Figures 3 and 4 depicts the box plots of U and E in responders vs. non-responders. Compared to responders, resistant cases had significantly higher E (P < 0.01) and lower U (P = 0.01). The scatter plots (Figs. 3 and 4) presents the calculated U and E for each individual case. It can be seen that the U and E values were well separated between responders and non-responders. This statistical significance demonstrates that the spatial distribution of voxel-wise ADC values was significantly more heterogeneous within non-responsive tumors. As ADC characterizes micro-cellularity, the results indicate that there was higher level of micro-cellular inhomogeneity in the resistant tumors.
Fig.3
The significant (P = 0.01) difference in Uniformity between responders and non-responders is illustrated in a boxplot (left) and a scatter plot (right). As shown on the scatter plot, fourteen out of fifteen responders had U > 0.07, four out of five non-responders had U < 0.07.
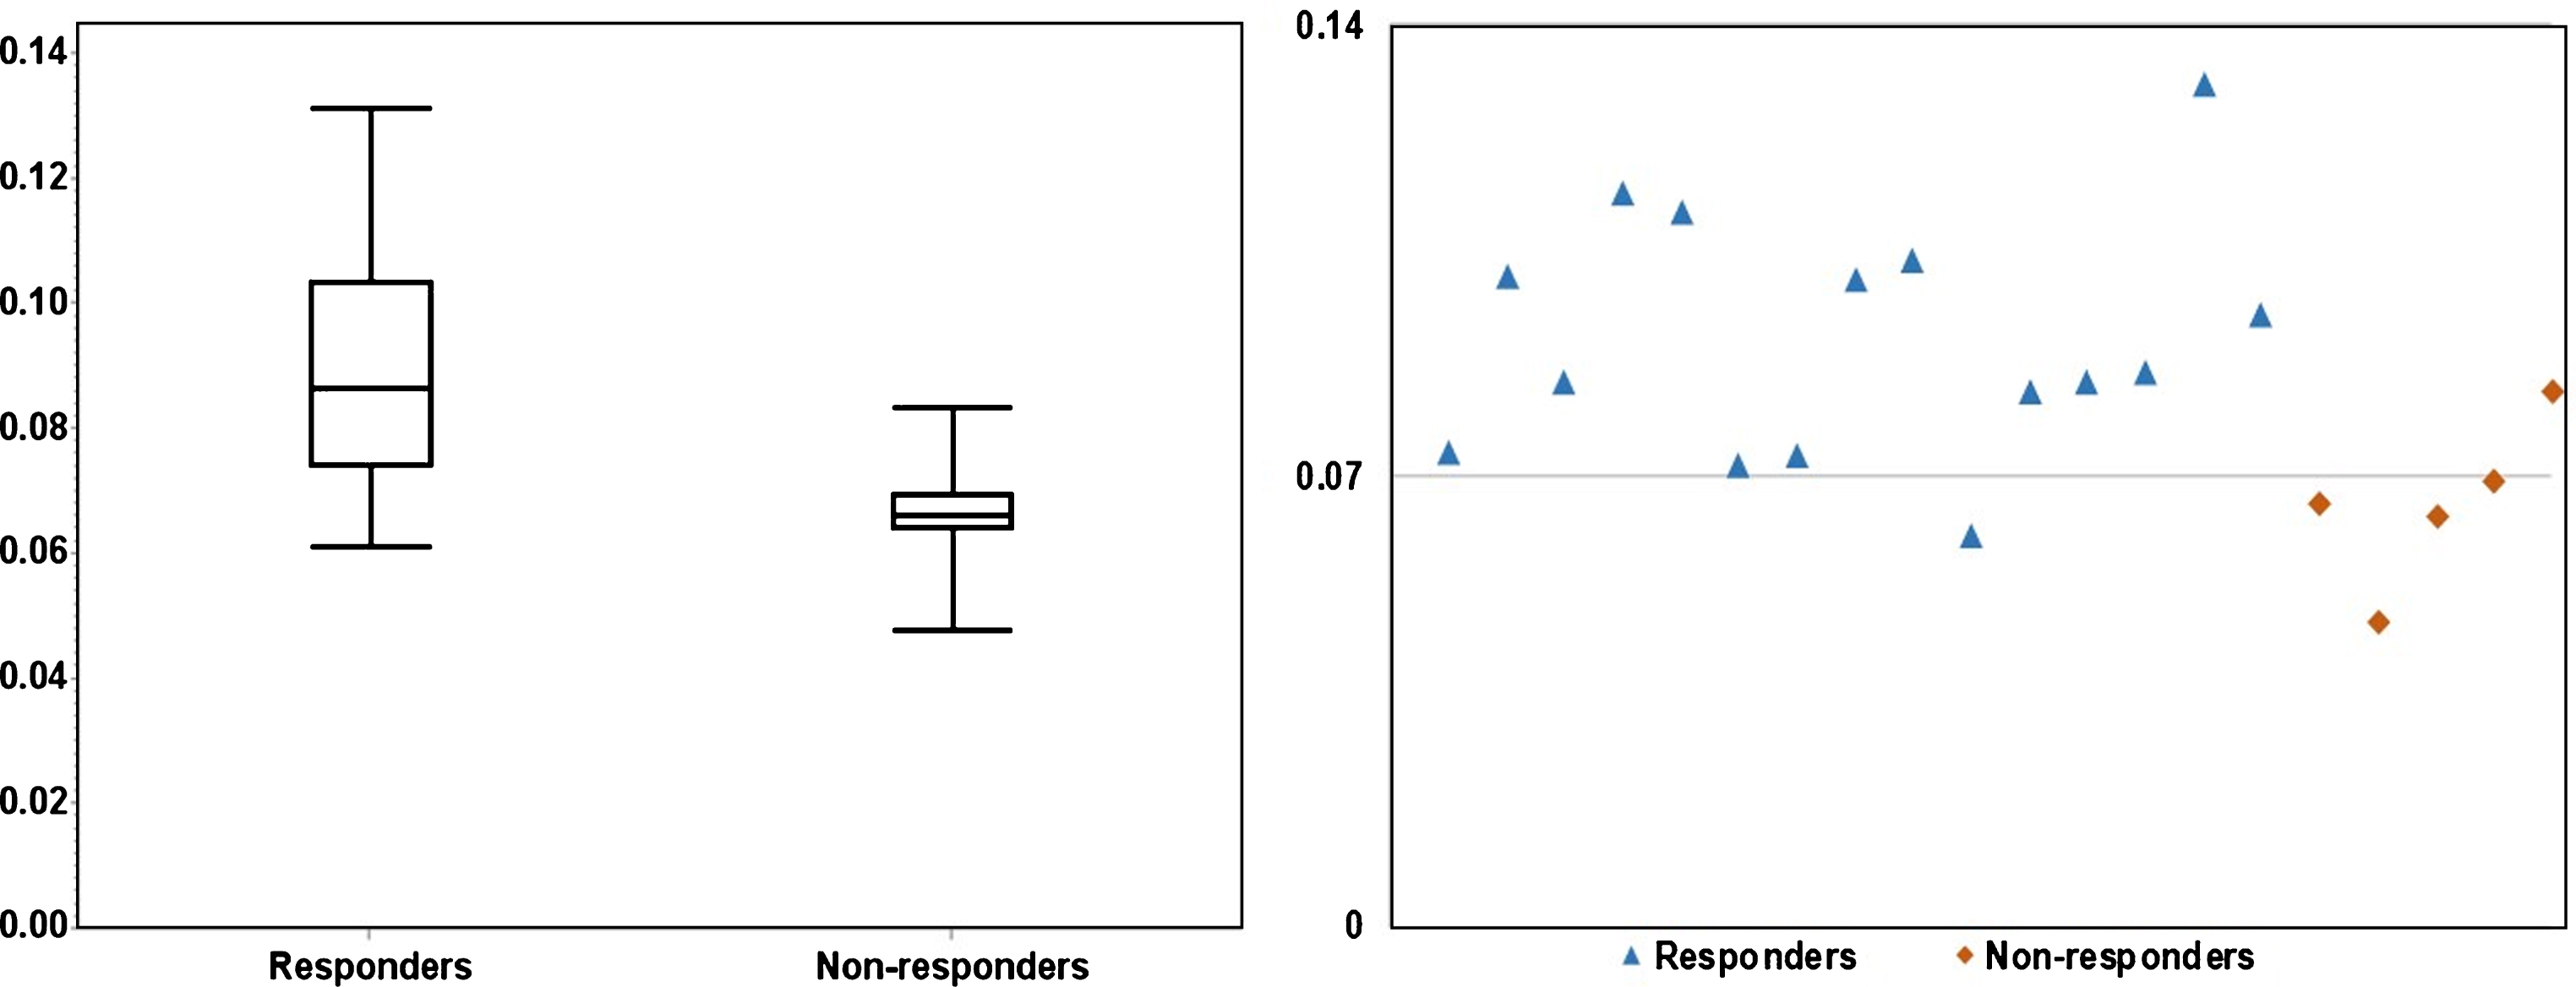
Fig.4
The significant (P < 0.01) difference in Entropy between responders and non-responders is illustrated in a boxplot (left) and a scatter plot (right). The scatter plot demonstrates that fourteen responders had E≤4.0, four non-responders had E > 4.0.
Response categorization and preliminary survival data
The preliminary survival data included three deceased patients and seventeen survivors, of which seven patients had their bladder cancer diagnosis less than 3 years ago.
The correlation with the initial survival data showed that responders (median is not reached, 95% CI: 2.9 – not reached) had significantly (P = 0.03) better survival outcome than non-responders (median is 2.3 years, 95% CI: 1.4 – not reached). The patient whose tumor was the most heterogeneous (lowest U, highest E) had the least years of survival (1.5 years from the time of diagnosis to death). A ypT2a patient, whose ADC uniformity was among the highest values, had the most favorable outcome (6.5 years, a survivor).
DISCUSSION
Previous studies have shown heterogeneity in chemotherapeutic response of bladder tumors [7, 10]. Pokuri pointed out that tumors with variant histologic features are more likely to be resistant to NAC [7]. At the cellular level, it has been reported that the tumor micro-environment heterogeneity may strongly influence therapeutic response and be associated with tumor resistance [27]. As higher micro-cellularity is associated with lower ADC, vice versa, we have also shown a strong correlation of tumor heterogeneity in micro-cellularity with its response to NAC. The more heterogeneous the cellular distribution is, the more likely the tumor is to be resistant to the treatment.
NAC has been considered to be a pre-operative standard treatment for MIBC. However, a significant portion of patients do not respond to NAC and are unnecessarily at risk of toxicity, disease progression, and avoidable surgical complications. It is a critical need to early identify chemotherapeutic resistant patients to ensure the optimal treatment stratification [1, 5, 8]. The earlier this can be done, the more favorable the patient outcomes are. Many studies using gene expression and imaging have been done to find a biomarker to predict NAC response in bladder cancer. Most of the studies showed the potential to assess the response at the mid-point of treatment. Our study is the first one that demonstrates the feasibility of predicting NAC response in MIBC prior to the start of the treatment by applying the proposed methodology to indirectly quantify the level of microcellular heterogeneity in tumor tissue. Once the methodology is further validated, this can help substantially in treatment strategy to improve the quality of life in MIBC patients.
Minimizing invasiveness in the diagnostics is always highly desired in cancer management. Our methodology is non-invasive and uses a non-ionizing radiation imaging technique - DWI combined with histogram analysis - to quantitatively correlate the level of microcellular heterogeneity with chemotherapeutic response. Given that patients have no MRI contraindications; neither does our proposed diagnostic approach impose any additional risks on the patients nor use any exogenous agents.
Previous studies used pT0N0 or pT1N0 as a surrogate endpoint of NAC response in terms of overall survival [7, 9]. The data in our study have indicated that pT2a patients may have as good survival as that of lower stages. Using a surrogate endpoint may miss out patients who potentially benefit from NAC. With our preliminary data, we have also shown that tumor heterogeneity may be strongly correlated with the patient survival and its quantitative assessment can be a potential prognostic biomarker prior to NAC.
Histogram analysis has been widely used in a large scale of data analysis for information extraction [25, 28–30]. Previous studies have reported that histogram analysis of ADC derived from DWI can improve the detection and characterization of cervical, breast, tonsil, and bladder cancers [21, 22, 29, 31]. Choi et al. [32] demonstrated the application of histogram analysis of ADC values to correlate the minimum, percentiles, and mean of ADC with chemoradiotherapeutic response in rectal cancer. Our study is the first one that applied the method to bladder cancer assessment and employs the measurements (U and E) of tumor heterogeneity in spatial ADC distribution.
A limitation in this study is the small number of cases (15 responders and 5 non-responders). This does not allow us to perform ROC curve analysis to further evaluate the accuracy of this methodological approach to predict response. However, the statistical differences show the potential of the method and encourage us to expand the study population for further validation. The survival data in our study is still preliminary and not enough yet for a comprehensive survival analysis. However, the results initially indicated that the measurements of tumor heterogeneity can be directly associated with the patient survival. This finding needs to be more evaluated when the data of overall five-year survival is available.
In conclusion, our study has demonstrated that histogram analysis of voxel-wise ADC values can quantify and characterize the microcellular heterogeneity in bladder tumors that may be useful in the prediction of bladder cancer response to NAC prior to treatment to ensure the optimal outcomes and improve the patient’s quality of life.
CONFLICT OF INTEREST
The authors have no conflict of interest to report.
ACKNOWLEDGMENTS
This study is supported by Wright Center of Innovation in Biomedical Imaging development fund and ODSA TECH 11-044.
REFERENCES
[1] | Grossman HB , Natale RB , Tangen CM , Speights VO , Vogelzang NJ , Trump DL , et al. Neoadjuvant chemotherapy plus cystectomy compared with cystectomy alone for locally advanced bladder cancer. N Engl J Med (2003) ;349: (9):859–66. |
[2] | International Collaboration of T, Medical Research Council Advanced Bladder Cancer Working P, European Organisation for R, Treatment of Cancer Genito-Urinary Tract Cancer G, Australian Bladder Cancer Study G, National Cancer Institute of Canada Clinical Trials G, et al. International phase III trial assessing neoadjuvant cisplatin, methotrexate, and vinblastine chemotherapy for muscle-invasive bladder cancer: Long-term results of the BA06 4 trial. J Clin Oncol (2011) ;29: (16):2171–7. |
[3] | Sonpavde G , Lerner SP . Neoadjuvant chemotherapy for bladder cancer. Oncology (Williston Park) (2007) ;21: (14):1673–81; discussion 86-8, 91, 94. |
[4] | Sonpavde G , Sternberg CN . Neoadjuvant chemotherapy for invasive bladder cancer. Current Urology Reports (2012) ;13: (2):136–46. |
[5] | Chang JS , Lara PN Jr , Pan CX . Progress in personalizing chemotherapy for bladder cancer. Adv Urol (2012) ;2012: :364919. |
[6] | Dogliotti L , Carteni G , Siena S , Bertetto O , Martoni A , Bono A , et al. Gemcitabine plus cisplatin versus gemcitabine plus carboplatin as first-line chemotherapy in advanced transitional cell carcinoma of the urothelium: Results of a randomized phase 2 trial. European Urology (2007) ;52: (1):134–41. |
[7] | Pokuri VK , Syed JR , Yang Z , Field EP , Cyriac S , Pili R , et al. Predictors of Complete Pathologic Response (pT0) to Neoadjuvant Chemotherapy in Muscle-invasive Bladder Carcinoma. Clin Genitourin Cancer (2016) ;14: (1):e59–65. |
[8] | Zargar H , Zargar-Shoshtari K , Lotan Y , Shah JB , van Rhijn BW , Daneshmand S , et al. Final Pathological Stage after Neoadjuvant Chemotherapy and Radical Cystectomy for Bladder Cancer-Does pT0 Predict Better Survival than pTa/Tis/T1? J Urol (2016) ;195: (4 Pt 1):886–93. |
[9] | Baras AS , Gandhi N , Munari E , Faraj S , Shultz L , Marchionni L , et al. Identification and Validation of Protein Biomarkers of Response to Neoadjuvant Platinum Chemotherapy in Muscle Invasive Urothelial Carcinoma. PLoS One (2015) ;10: (7):e0131245. |
[10] | Nguyen HT , Jia G , Shah ZK , Pohar K , Mortazavi A , Zynger DL , et al. Prediction of chemotherapeutic response in bladder cancer using K-means clustering of dynamic contrast-enhanced (DCE)-MRI pharmacokinetic parameters. Journal of Magnetic Resonance Imaging: JMRI (2015) ;41: (5):1374–82. |
[11] | Yoshida S , Koga F , Kobayashi S , Ishii C , Tanaka H , Tanaka H , et al. Role of diffusion-weighted magnetic resonance imaging in predicting sensitivity to chemoradiotherapy in muscle-invasive bladder cancer. Int J Radiat Oncol Biol Phys (2012) ;83: (1):e21–7. |
[12] | Smith SC , Baras AS , Lee JK , Theodorescu D . The COXEN principle: Translating signatures of in vitro chemosensitivity into tools for clinical outcome prediction and drug discovery in cancer. Cancer Res (2010) ;70: (5):1753–8. |
[13] | Groenendijk FH , de Jong J , Fransen van de Putte EE , Michaut M , Schlicker A , Peters D , et al. ERBB2 Mutations Characterize a Subgroup of Muscle-invasive Bladder Cancers with Excellent Response to Neoadjuvant Chemotherapy. European Urology (2016) ;69: (3):384–8. |
[14] | Kato Y , Zembutsu H , Takata R , Miya F , Tsunoda T , Obara W , et al. Predicting response of bladder cancers to gemcitabine and carboplatin neoadjuvant chemotherapy through genome-wide gene expression profiling. Exp Ther Med (2011) ;2: (1):47–56. |
[15] | Takata R , Katagiri T , Kanehira M , Tsunoda T , Shuin T , Miki T , et al. Predicting response to methotrexate, vinblastine, doxorubicin, and cisplatin neoadjuvant chemotherapy for bladder cancers through genome-wide gene expression profiling. Clin Cancer Res (2005) ;11: (7):2625–36. |
[16] | Liu D , Plimack ER , Hoffman-Censits J , Garraway LA , Bellmunt J , Van Allen E , et al. Clinical Validation of Chemotherapy Response Biomarker ERCC2 in Muscle-Invasive Urothelial Bladder Carcinoma. JAMA Oncol (2016) ;2: (8):1094–6. |
[17] | Van Allen EM , Mouw KW , Kim P , Iyer G , Wagle N , Al-Ahmadie H , et al. Somatic ERCC2 mutations correlate with cisplatin sensitivity in muscle-invasive urothelial carcinoma. Cancer Discov (2014) ;4: (10):1140–53. |
[18] | Davnall F , Yip CS , Ljungqvist G , Selmi M , Ng F , Sanghera B , et al. Assessment of tumor heterogeneity: An emerging imaging tool for clinical practice? Insights Imaging (2012) ;3: (6):573–89. |
[19] | Nguyen HT , Shah ZK , Mortazavi A , Pohar KS , Wei L , Jia G , et al. Non-invasive quantification of tumour heterogeneity in water diffusivity to differentiate malignant from benign tissues of urinary bladder: A phase I study. Eur Radiol (2016) . |
[20] | Srinivasan A , Galban CJ , Johnson TD , Chenevert TL , Ross BD , Mukherji SK . Utility of the k-means clustering algorithm in differentiating apparent diffusion coefficient values of benign and malignant neck pathologies. AJNR Am J Neuroradiol (2010) ;31: (4):736–40. |
[21] | Suo S , Zhang K , Cao M , Suo X , Hua J , Geng X , et al. Characterization of breast masses as benign or malignant at 3.0 T MRI with whole-lesion histogram analysis of the apparent diffusion coefficient. Journal of Magnetic Resonance Imaging: JMRI (2015) . |
[22] | Suo ST , Chen XX , Fan Y , Wu LM , Yao QY , Cao MQ , et al. Histogram analysis of apparent diffusion coefficient at 3.0 T in urinary bladder lesions: Correlation with pathologic findings. Academic Radiology (2014) ;21: (8):1027–34. |
[23] | Alic L , Niessen WJ , Veenland JF . Quantification of Heterogeneity as a Biomarker in Tumor Imaging: A Systematic Review. PLoS One (2014) ;9: (10). |
[24] | Rose CJ , Mills SJ , O’Connor JP , Buonaccorsi GA , Roberts C , Watson Y , et al. Quantifying spatial heterogeneity in dynamic contrast-enhanced MRI parameter maps. Magn Reson Med (2009) ;62: (2):488–99. |
[25] | Just N . Improving tumour heterogeneity MRI assessment with histograms. Br J Cancer (2014) ;111: (12):2205–13. |
[26] | Eisenhauer EA , Therasse P , Bogaerts J , Schwartz LH , Sargent D , Ford R , et al. New response evaluation criteria in solid tumours: Revised RECIST guideline (version 1.1). Eur J Cancer (2009) ;45: (2):228–47. |
[27] | Junttila MR , de Sauvage FJ . Influence of tumour micro-environment heterogeneity on therapeutic response. Nature 501 (2013) ;501: (7467):346–54. |
[28] | Bagwell CB . DNA histogram analysis for node-negative breast cancer. Cytometry A (2004) ;58: (1):76–8. |
[29] | Rosenkrantz AB . Histogram-based apparent diffusion coefficient analysis: An emerging tool for cervical cancer characterization? AJR American Journal of Roentgenology (2013) ;200: (2):311–3. |
[30] | Rosenkrantz AB , Obele C , Rusinek H , Balar AV , Huang WC , Deng FM , et al. Whole-lesion diffusion metrics for assessment of bladder cancer aggressiveness. Abdominal Imaging (2015) ;40: (2):327–32. |
[31] | Choi YJ , Lee JH , Kim HO , Kim DY , Yoon RG , Cho SH , et al. Histogram Analysis of Apparent Diffusion Coefficients for Occult Tonsil Cancer in Patients with Cervical Nodal Metastasis from an Unknown Primary Site at Presentation. Radiology (2016) ;278: (1):146–55. |
[32] | Choi MH , Oh SN , Rha SE , Choi JI , Lee SH , Jang HS , et al. Diffusion-weighted imaging: Apparent diffusion coefficient histogram analysis for detecting pathologic complete response to chemoradiotherapy in locally advanced rectal cancer. Journal of Magnetic Resonance Imaging: JMRI (2016) ;44: (1):212–20. |


