
Elevated Derived Neutrophil-to-Lymphocyte Ratio Corresponds With Poor Outcome in Patients Undergoing Pre-Operative Chemotherapy in Muscle-Invasive Bladder Cancer
Abstract
Background: Platinum-based pre-operative chemotherapy (POC) for muscle-invasive bladder cancer (MIBC) increases the complete pathological response rate at cystectomy and improves overall survival. However, 60% of MIBC patients still has muscle-invasive disease at cystectomy despite POC. Therefore, accurate prediction of response to POC is an important clinical need. We hypothesized that an elevated neutrophil-to-lymphocyte ratio (NLR) corresponds with adverse outcome in patients undergoing POC and radical cystectomy.
Objective: To explore the correlation between the NLR and outcome in MIBC patients treated by POC and radical cystectomy.
Methods: In 123 MIBC patients (urothelial carcinoma) who were treated by platinum-based POC and radical cystectomy, the derived NLR (dNLR) was retrospectively calculated by dividing the neutrophil count by the difference between leukocytes and neutrophil counts, prior to the start of chemotherapy. The correlation of the dNLR with pathological response at cystectomy and survival was analyzed by logistic regression analysis or the Kaplan-Meier method.
Results: The complete pathological response (ypT0N0Mx) rate was 28.5%, 8.9% obtained a partial response (ypTa/T1/TisN0Mx), and 62.6% were non-responders (stage ≥ ypT2 and/or N+). An elevated dNLR (>2.21) correlated with non-response to POC (OR 2.70, 95% confidence interval: 1.15–6.38, p = 0.02) but this effect was nullified when corrected for clinically node-positive disease and clinical T stage. Patients with an elevated dNLR had shorter progression-free and overall survival albeit non-significant (p = 0.42, and p = 0.45, respectively).
Conclusions: An elevated dNLR corresponded with poor outcome in terms of survival and non-response to POC in MIBC patients undergoing radical surgery. However, after correction for well-known prognostic factors, such as positive lymph node status at diagnostic imaging and clinical T stage, the correlation for the dNLR was nullified. Therefore, we conclude that the dNLR is insufficient to predict response to POC in this heterogeneous patient population.
INTRODUCTION
The standard curative treatment for patients with non-metastatic MIBC is radical cystectomy, which can be preceded by pre-operative chemotherapy (POC): neoadjuvant chemotherapy (NAC) for clinical stage T2-T4aN0 or induction chemotherapy in case of N+disease [1]. The prognosis of MIBC is poor; the 5-year survival rate for stage pT2 UC is around 62% but it drops to a mere 5.5% for stage pT4 [2].
Cisplatin-based chemotherapy is the current standard neoadjuvant regimen for MIBC [3]. A large multicenter randomized trial showed that a neoadjuvant regimen of cisplatin, methotrexate and vinblastine (CMV) gave a reduction in the risk of death (HR: 0.84) and an absolute increase in 10-year survival from 30% to 36% in MIBC patients [4]. In addition, another randomized trial showed that patients who received NAC of methotrexate, vinblastine, doxorubicin and cisplatin (MVAC) prior to radical cystectomy had a longer median overall survival than patients who underwent radical cystectomy alone (77 and 46 months respectively, p = 0.06) [5]. Despite level I evidence, controversies on the use of NAC in MIBC remain because the survival benefit is small, patients who do not respond to NAC are exposed to treatment-related toxicity [5–7]. On the contrary, the 25% of patients who do have a complete pathological response (no residual tumor) at radical cystectomy after NAC, have excellent outcomes (5-year survival rate of 80%) [8, 9]. Therefore, an accurate marker that can predict response to POC in MIBC is clearly needed. Recently, genetic aberrations, such as oncogenic mutations and gene expression profiling have been reported to correspond with response to NAC [10–13]. Additionally, evidence is emerging on the causal relationship between inflammation and cancer. As part of the tumor microenvironment, neutrophils and lymphocytes both play prominent regulatory roles in tumor progression. The neutrophil-to-lymphocyte ratio (NLR) is a marker of systemic inflammatory response that reflects the balance of the inflammatory system and immune system. Several studies reported that the presence of neutrophils in tumor stroma is associated with a poor prognosis, while lymphocyte infiltration surrounding a tumor is associated with an improved prognosis [14]. Therefore, the NLR could be of prognostic value and an elevated NLR in the peripheral blood has proven to be an independent predictor of adverse outcome in several malignancies including colon, prostate and genito-urinary tract cancers [14–17]. Because of the important clinical need to accurately predict who will benefit from POC and who will not, the aim of this study was to assess the correlation between the NLR and the outcome of MIBC patients undergoing POC and radical cystectomy.
MATERIALS AND METHODS
Patient selection
The medical records from patients diagnosed with histologically proven non-metastatic MIBC (pure or predominant urothelial carcinoma) undergoing POC and radical cystectomy between 1990 and 2014 were retrospectively reviewed. A total of 283 patients were eligible for the study. Patients (n = 148) without documented neutrophil or leukocyte count at start of POC were excluded, as were patients who did not receive cisplatin- or carboplatin-based chemotherapy (n = 4), and patients who had completed insufficient cycles of POC (<3 cycles) (n = 8). Finally, 123 patients were eligible for analysis. These patients originated from three different hospitals in the Netherlands (Erasmus Medical Center, Antoni van Leeuwenhoek Hospital, Sint Franciscus Gasthuis).
Data collection and definitions
Clinicopathological parameters were collected retrospectively (Tables 1 and 2). The pathological response at cystectomy was classified as: i) complete response (CR, ypT0N0Mx); ii) partial response (PR, ypTa/T1/TisN0Mx); iii) non-response (NR, stage ≥ ypT2 and/or N+). In the Netherlands, white blood cell and neutrophil counts are routinely measured in clinical practice, but this is less frequent for the lymphocyte count. Therefore, instead of the NLR, the derived NLR (dNLR) was calculated. Since peripheral white blood cells count consists almost exclusively of neutrophils and lymphocytes, the dNLR can be calculated by dividing the absolute neutrophil count by the difference between leukocytes and neutrophil counts [16]. The dNLR has been demonstrated to provide similar prognostic value as the NLR [18]. Baseline hemoglobin (HB), creatinine, Glomerular Filtration Rate (GFR) and dNLR before start of POC treatment were collected. Progression-free survival (PFS) was defined as time from POC initiation to date of cancer progression. Overall survival (OS) was defined as time from POC initiation to death from any cause. Patients were examined every three months and underwent a CT-scan of the thorax and abdomen every six months for the first two years after radical cystectomy. Lymphadenopathy at diagnostic imaging was defined as a lymph node with a short axis diameter of >10 mm in dimension on CT scan. Patients who were alive with or without disease and patients who were lost to follow up at the last follow-up date were censored.
Statistical analysis
Statistical analyses were performed using SPSS version 21 for Windows (IBM Corp. Released 2012. IBM SPSS Statistics for Windows, Version 21.0. Armonk, NY: IBM Corp) and R statistical software (R Foundation for Statistical Computing, Vienna, Austria). Clinicopathological characteristics were compared between patients having a CR and the NR group, using the Mann Whitney-U-test and the Fisher’s exact test. The dNLR was dichotomized by choosing a cutoff based on the optimal sensitivity-specificity trade-off as visualized by the receiver operating characteristic (ROC), being the point on the curve which is situated closest to the upper left corner. The association of the dNLR and other predictor variables with POC response was evaluated by univariable and multivariable logistic regression analysis. The multivariable models were formed using backward elimination at the 5% level. To determine if there was a difference between the pathological response outcomes at cystectomy, uni- and multivariable analyses were performed with CR versus NR as an endpoint and CR plus PR versus NR as an endpoint. Input variables were selected based on their performance in the univariable analysis or their potential confounding effect. The predictive accuracy of the model was determined by the area under the curve (AUC) and c-statistic. Internal validation was done using the bootstrapping method with 1000 bootstrap samples. Based on the multivariable models, a POC treatment decision-making model was formed. A cut off was determined based on the optimal sensitivity-specificity trade off of whether a positive advice concerning POC treatment should be given to patients or a negative advice. Survival curves were estimated using the Kaplan–Meier method and the difference between these curves was assessed by the log rank test. P-values<0.05 were considered statistically significant.
RESULTS
Baseline characteristics
The baseline characteristics of the individual response groups are depicted in Table 1. The mean age of the 123 patients was 61 years of whom 91 (74%) patients were male. Of all patients, 87 (70.7%) had received 3 or 4 cycles of a cisplatin-based POC regimen (Gemcitabine/Cisplatin, Methotrexate/Vinblastine/Adriamycin/Cisplatin (MVAC), dose dense MVAC, Cisplatin/Methotrexate/Vinblastine (CMV) or Cisplatin/Paclitaxel), whereas 36 (29.3%) had received a carboplatin-based POC regimen (Gemcitabine/Carboplatin). Median time from diagnostic TUR (dTUR) to surgery was five months and median time from start of POC to surgery was three months, which both did not significantly differ between complete or non-responders (p = 0.30 and p = 0.67), respectively (Table 1).
Complete pathological response was seen in 35 (28.5%) patients, 11 (8.9%) showed a partial response and 77 (62.6%) were classified as non-responders. In the NR group, positive lymphadenopathy prior to cystectomy was more frequent (p = 0.01), recurrence after cystectomy occurred more frequently (p < 0.01) and the median PFS and the OS were significantly shorter than in the CR group (33 vs 12 months, p < 0.01 and 33 vs 17 months, p < 0.01). The other clinicopathological parameters did not significantly differ between the two groups.
The median dNLR of all patients was 2.10 at baseline. Based on the ROC curve, the optimal cut off value for the dNLR was determined at 2.21 (51.1% sensitivity and 71.4% specificity for predicting NR).
Pre-operative chemotherapeutic response at cystectomy
In the univariable analysis, an elevated dNLR corresponded with NR to POC in the CR vs NR analysis (OR 2.70, 95% -CI: 1.15–6.38, p = 0.02), but not in the CR+PR vs NR analysis (OR 1.98, 95% -CI: 0.92–4.26, p = 0.08) (Table 2). Extravesical extension and lymphadenopathy on diagnostic imaging before cystectomy significantly correlated with a higher non-response rate to POC in CR+PR vs NR analysis (OR 2.37, 95% -CI: 0.99–5.66, p = 0.05 and OR 3.30, 95% -CI: 1.38–7.87, p = 0.01, respectively) (Table 2). To analyze the correlation between the dNLR and response to NAC and not POC, clinically node-positive patients were excluded from the analysis. In this NAC-only cohort (n = 49), none of the proposed predictor variables significantly correlated with NR. Also, the correspondence between dNLR and non-response was no longer statistically significant (OR 1.70 p = 0.31 in CR vs NR and OR 1.62 p = 0.33 in CR+PR vs NR).
In the multivariable analysis for both CR vs NR as for CR+PR vs NR, dNLR was removed from the model by backward elimination (Table 3). The optimal multivariable model A for CR vs NR included lymphadenopathy and clinical T stage. The optimal multivariable model B for CR+PR vs NR included lymphadenopathy and extravesical extension at diagnostic imaging (Table 3). The predictive capacity, represented by the AUC of the optimal model A for CR vs NR was 0.75 (96% CI 0.64–0.86, c-statistic 0.75) with an optimism-corrected AUC of 0.72 and 0.71 (95% CI 0.60–0.82, c-statistic 0.70) with an optimism-corrected AUC of 0.68 for CR+PR vs NR; model B. The type of POC was also removed by backward selection. However, because carboplatin-based POC is not the regimen of choice in MIBC the analyses were repeated excluding all patients who received carboplatin-based chemotherapy, leading to similar results (AUC model A: 0.79 (95% CI 0.67–0.90) and AUC model B: 0.73 (95% CI 0.60–0.86)).
Progression-free and overall survival
An elevated dNLR (>2.21) corresponded with an absolute shorter PFS and OS, although not significantly (median 15 vs 21 months, p = 0.42 and median 21 vs 24 months, p = 0.45, respectively) (Fig. 1a and 1b). In the NAC-only cohort, the same trend was observed (median 26 vs 35 months, p = 0.28 and median 29 vs 35 months, p = 0.29, respectively) (Fig. 2a and 2b). The corresponding Kaplan-Meier curves indicated that in the first 12 months after start of POC, both the PFS and OS rates of patients with low dNLR and high dNLR barely differed. However, after 12 months the survival rate lines diverged. To investigate if there were any significant differences, we compared all patients with a PFS and OS shorter than 12 months with patients with a PFS and OS of 12 months and longer. The group with a PFS <12 months had significantly higher clinical T stage, more frequent extravesical extension and lymphadenopathy on diagnostic imaging before cystectomy, less frequent cisplatin-based POC, and more often recurrence after cystectomy. There were also significantly more non-responders in both the shorter PFS and OS group (Supplementary Table S1 and S2). In the group with OS <12 months there was, besides more non-responders, also significantly more frequent lymphadenopathy at diagnostic imaging before cystectomy and a lower baseline hemoglobin count. The distribution of the type of POC regimen and clinical T stage was not significantly different between OS groups (Supplementary Table S2).
DISCUSSION
There is an important clinical need for a marker that correlates with the response and eventual benefit by to the use of POC in patients with MIBC. Here, we show that an elevated NLR corresponded with non-response to POC at radical cystectomy. However, this correlation was nullified when corrected for positive lymph node status at diagnostic imaging and clinical T stage. Further, patients who had an elevated dNLR had a trend towards a shorter PFS and OS. This did not reach statistical significance, possibly due to the limited sample size. An elevated dNLR, did not show a statistically significant association with non-response, nor with prognosis, in a NAC-only cohort, possibly due to the limited sample size of this subgroup analysis. Our findings suggest that pre-chemotherapy dNLR, which is an easily available clinical marker, is insufficient to guide treatment decisions on POC in MIBC.
Although several studies have shown a relationship between NLR and adverse outcome in solid malignancies including MIBC [15–17], the literature on the association with response to NAC is scarce. Seah et al. could not find an association between pre-treatment NLR and the pathological response to NAC in MIBC patients (OR = 0.69, 95% -CI: 0.36–1.32, p = 0.26) [7]. Their definition of pathological response to NAC, however, differed from the definition we used; these authors defined a pathological response as T0/Tis, N0 disease together with down staging from T2/T4 to T1 and in N status (from N-positive to N0), whereas in our study a complete response to POC was defined as ypT0N0M0. More importantly, the sample size (26 patients) in the study by Seah et al. was too small to allow meaningful conclusions.
In esophageal cancer, the pre-treatment NLR was previously reported to be a significant predictive marker of pathologic response to NAC (p < 0.01) [19]. In metastatic advanced gastric cancer, as well, a low pre-treatment NLR was associated with a significantly higher chemotherapeutic disease control rate (90.0% vs. 80.4%; p = 0.03) and longer PFS and OS (186 vs. 146 days, p < 0.01 and 414 vs. 280 days, p < 0.01) [20].
Research of the tumor microenvironment has been intensive in recent years. The inflammatory microenvironment has been found to be an essential component of tumors [21]. The NLR is a marker of systemic inflammatory response that indicates the balance of the inflammatory system and immune system respectively [14]. The exact mechanisms underlying the prognostic implications of the NLR are unknown. However, it is known that cancer cells can induce neutrophils to form a microenvironment that is beneficial to the malignant cells [22]. An elevated NLR is usually caused by neutrophilia together with lymphopenia and indicates a tumor-promoting environment [15]. This could explain why an elevated NLR is associated with an unfavorable outcome.
Our study has some limitations. First, this study has a retrospective design and a relatively small sample size. Data about factors that could influence the neutrophil and lymphocyte blood counts (e.g. medication) was not available for the majority of patients. Further, our cohort is a mixture of patients receiving neoadjuvant chemotherapy and induction chemotherapy. The presence of positive lymph nodes at time of start of chemotherapy and the clinical T stage had a major influence on non-response prediction. Our NAC-only cohort was probably too small to draw any significant conclusions on the predictive capability of the dNLR on therapy response. We believe this study again proves the difficulty of doing retrospective studies in such heterogeneous patient cohorts. Lastly, although the NLR might have potential as a prognostic biomarker, the use of the NLR as such a biomarker may be difficult to examine. Patients with a higher NLR had a worse outcome after cystectomy, but would perhaps have done even worse without POC. The results of this study should be re-examined in a large prospective cohort of patients with MIBC receiving POC before radical cystectomy. In addition, other molecular predictive markers like ERBB2 and ERCC2 mutation status may be combined with the dNLR and could potentially enhance the overall predictive capacity [10, 11].
POC bears substantial short- and long-term toxicity, and hospital admission is necessary to administer cisplatin, making it a costly treatment as well. Therefore, an accurate prediction of the response to POC may improve patient selection and thus reduce patient burden by avoiding unnecessary treatment and reducing costs. The dNLR is an easily available biomarker at virtually no extra expense. However, the predictive and prognostic value of the dNLR seem insufficient in MIBC patients undergoing POC and radical cystectomy and should therefore not be used to guide treatment decisions.
CONCLUSIONS
Accurate prediction of the response to POC in MIBC may improve patient selection and thus reduce patient burden by avoiding unnecessary treatment and reduce cost. In the present study, we found that an elevated dNLR (>2.21) corresponded with poor outcome in terms of non-response to POC and shorter PFS and OS. However, this correlation was nullified when corrected for positive lymph node status and clinical T stage. Therefore, we conclude that the dNLR is insufficient to predict the response to POC in patients with MIBC undergoing radical cystectomy.
CONFLICT OF INTEREST
The authors have no conflict of interest to report.
Appendices
The supplementary information is available in the electronic version of this article: http://dx.doi.org/10.3233/BLC-160055.
REFERENCES
[1] | Malkowicz B , van Poppel H , Mickisch G , et al. Muscle-Invasive Urothelial Carcinoma of the Bladder. Urology (2007) ;69: :316. |
[2] | National Cancer Institute NCI:SEER Stat Fact Sheets: Bladder Cancer. |
[3] | Kurtova A , Xiao J , Mo Q , et al . Blocking PGE2-induced tumour repopulation abrogates bladder cancer chemoresistance. Nature (2015) ;517: :209–13. |
[4] | Of Trialists I, the Group) M, for and of Group E, et al . International Phase III Trial Assessing Neoadjuvant Cisplatin, Methotrexate, and Vinblastine Chemotherapy for Muscle-Invasive Bladder Cancer: Long-Term Results of the BA06 30894 Trial. Journal of Clinical Oncology (2011) ;29: :2171–7. |
[5] | Grossman B , Natale R , Tangen C , et al . Neoadjuvant chemotherapy plus cystectomy compared with cystectomy alone for locally advanced bladder cancer. The New England Journal of Medicine (2003) ;349: :859–66. |
[6] | Advanced Bladder Cancer (ABC Meta-analysis Collaboration: Neoadjuvant Chemotherapy in Invasive Bladder Cancer: Update of a Systematic Review and Meta-Analysis of Individual Patient Data. European Urology (2005) ;48: :202–6. |
[7] | Seah J-A , Leibowitz-Amit R , Atenafu E , et al . Neutrophil-lymphocyte ratio and pathological response to neoadjuvant chemotherapy in patients with muscle-invasive bladder cancer. Clinical Genitourinary Cancer (2015) ;13: :e229e233. |
[8] | Zargar H , Espiritu PN , Fairey AS , et al . Multicenter assessment of neoadjuvant chemotherapy for muscle-invasive bladder cancer. European Urology (2015) ;67: (2):241–9. |
[9] | Rosenblatt R , Sherif A , Rintala E , et al . Pathologic downstaging is a surrogate marker for efficacy and increased survival following neoadjuvant chemotherapy and radical cystectomy for muscle-invasive urothelial bladder cancer. European Urology (2011) ;61: :1229–38. |
[10] | Groenendijk F , de Jong J , van de Putte E , et al . ERBB2 Mutations Characterize a Subgroup of Muscle-invasive Bladder Cancers with Excellent Response to Neoadjuvant Chemotherapy. European Urology (2016) ;69: (3):384–8. |
[11] | Allen E , Mouw K , Kim P , et al . Somatic ERCC2 mutations correlate with cisplatin sensitivity in muscle-invasive urothelial carcinoma. Cancer Discovery (2014) :CD–14–0623. |
[12] | Plimack E , Dunbrack R , Brennan T , et al . Defects in DNA Repair Genes Predict Response to Neoadjuvant Cisplatin-based Chemotherapy in Muscle-invasive Bladder Cancer. European Urology (2015) ;68: (6):959–67. |
[13] | Choi W , Porten S , Kim S , Willis D , et al . Identification of distinct basal and luminal subtypes of muscle-invasive bladder cancer with different sensitivities to frontline chemotherapy. Cancer Cell (2014) ;25: :152–65. |
[14] | Xue T-C , Zhang L , Xie X-Y , et al . Prognostic significance of the neutrophil-to-lymphocyte ratio in primary liver cancer: A meta-analysis. PLoS One (2014) :9. |
[15] | Li M , Liu X , Zhang X , et al . Prognostic role of neutrophil-to-lymphocyte ratio in colorectal cancer: A systematic review and meta-analysis. International Journal of Cancer (2014) ;134: :2403–13. |
[16] | van Soest Templeton , Vera-Badillo , et al . Neutrophil-to-lymphocyte ratio as a prognostic biomarker for men with metastatic castration-resistant prostate cancer receiving first-line chemotherapy: Data from two randomized phase III trials. Annals of Oncology (2014) ;26: :743–9. |
[17] | Wei Y , Jiang Y-Z , Qian W-H . Prognostic role of NLR in urinary cancers: A meta-analysis. PLoS One (2014) :9. |
[18] | Proctor , McMillan , Morrison , et al . A derived neutrophil to lymphocyte ratio predicts survival in patients with cancer. British Journal of Cancer (2012) ;107: :695–9. |
[19] | Sato H , Tsubosa Y , Kawano T . Correlation between the pretherapeutic neutrophil to lymphocyte ratio and the pathologic response to neoadjuvant chemotherapy in patients with advanced esophageal cancer. World Journal of Surgery (2012) ;36: :617–22. |
[20] | Cho I , Park J , Park C , et al . Pre-treatment neutrophil to lymphocyte ratio as a prognostic marker to predict chemotherapeutic response and survival outcomes in metastatic advanced gastric cancer. Gastric Cancer (2014) ;17: :703–10. |
[21] | Mantovani A , Allavena P , Sica A , et al . Cancer-related inflammation. Nature (2008) ;454: :436–44. |
[22] | Brandau S , Dumitru C , Lang S . Protumor and antitumor functions of neutrophil granulocytes. Seminars in Immunopathology (2012) ;35: :163–76. |
Figures and Tables
Fig.1
The progression-free survival (a) and overall survival (b) according to the dNLR. An elevated dNLR corresponded with an absolute shorter PFS (median 21 versus 15 months, p = 0.42) or OS (median 24 versus 21 months, p = 0.45), albeit not significantly.
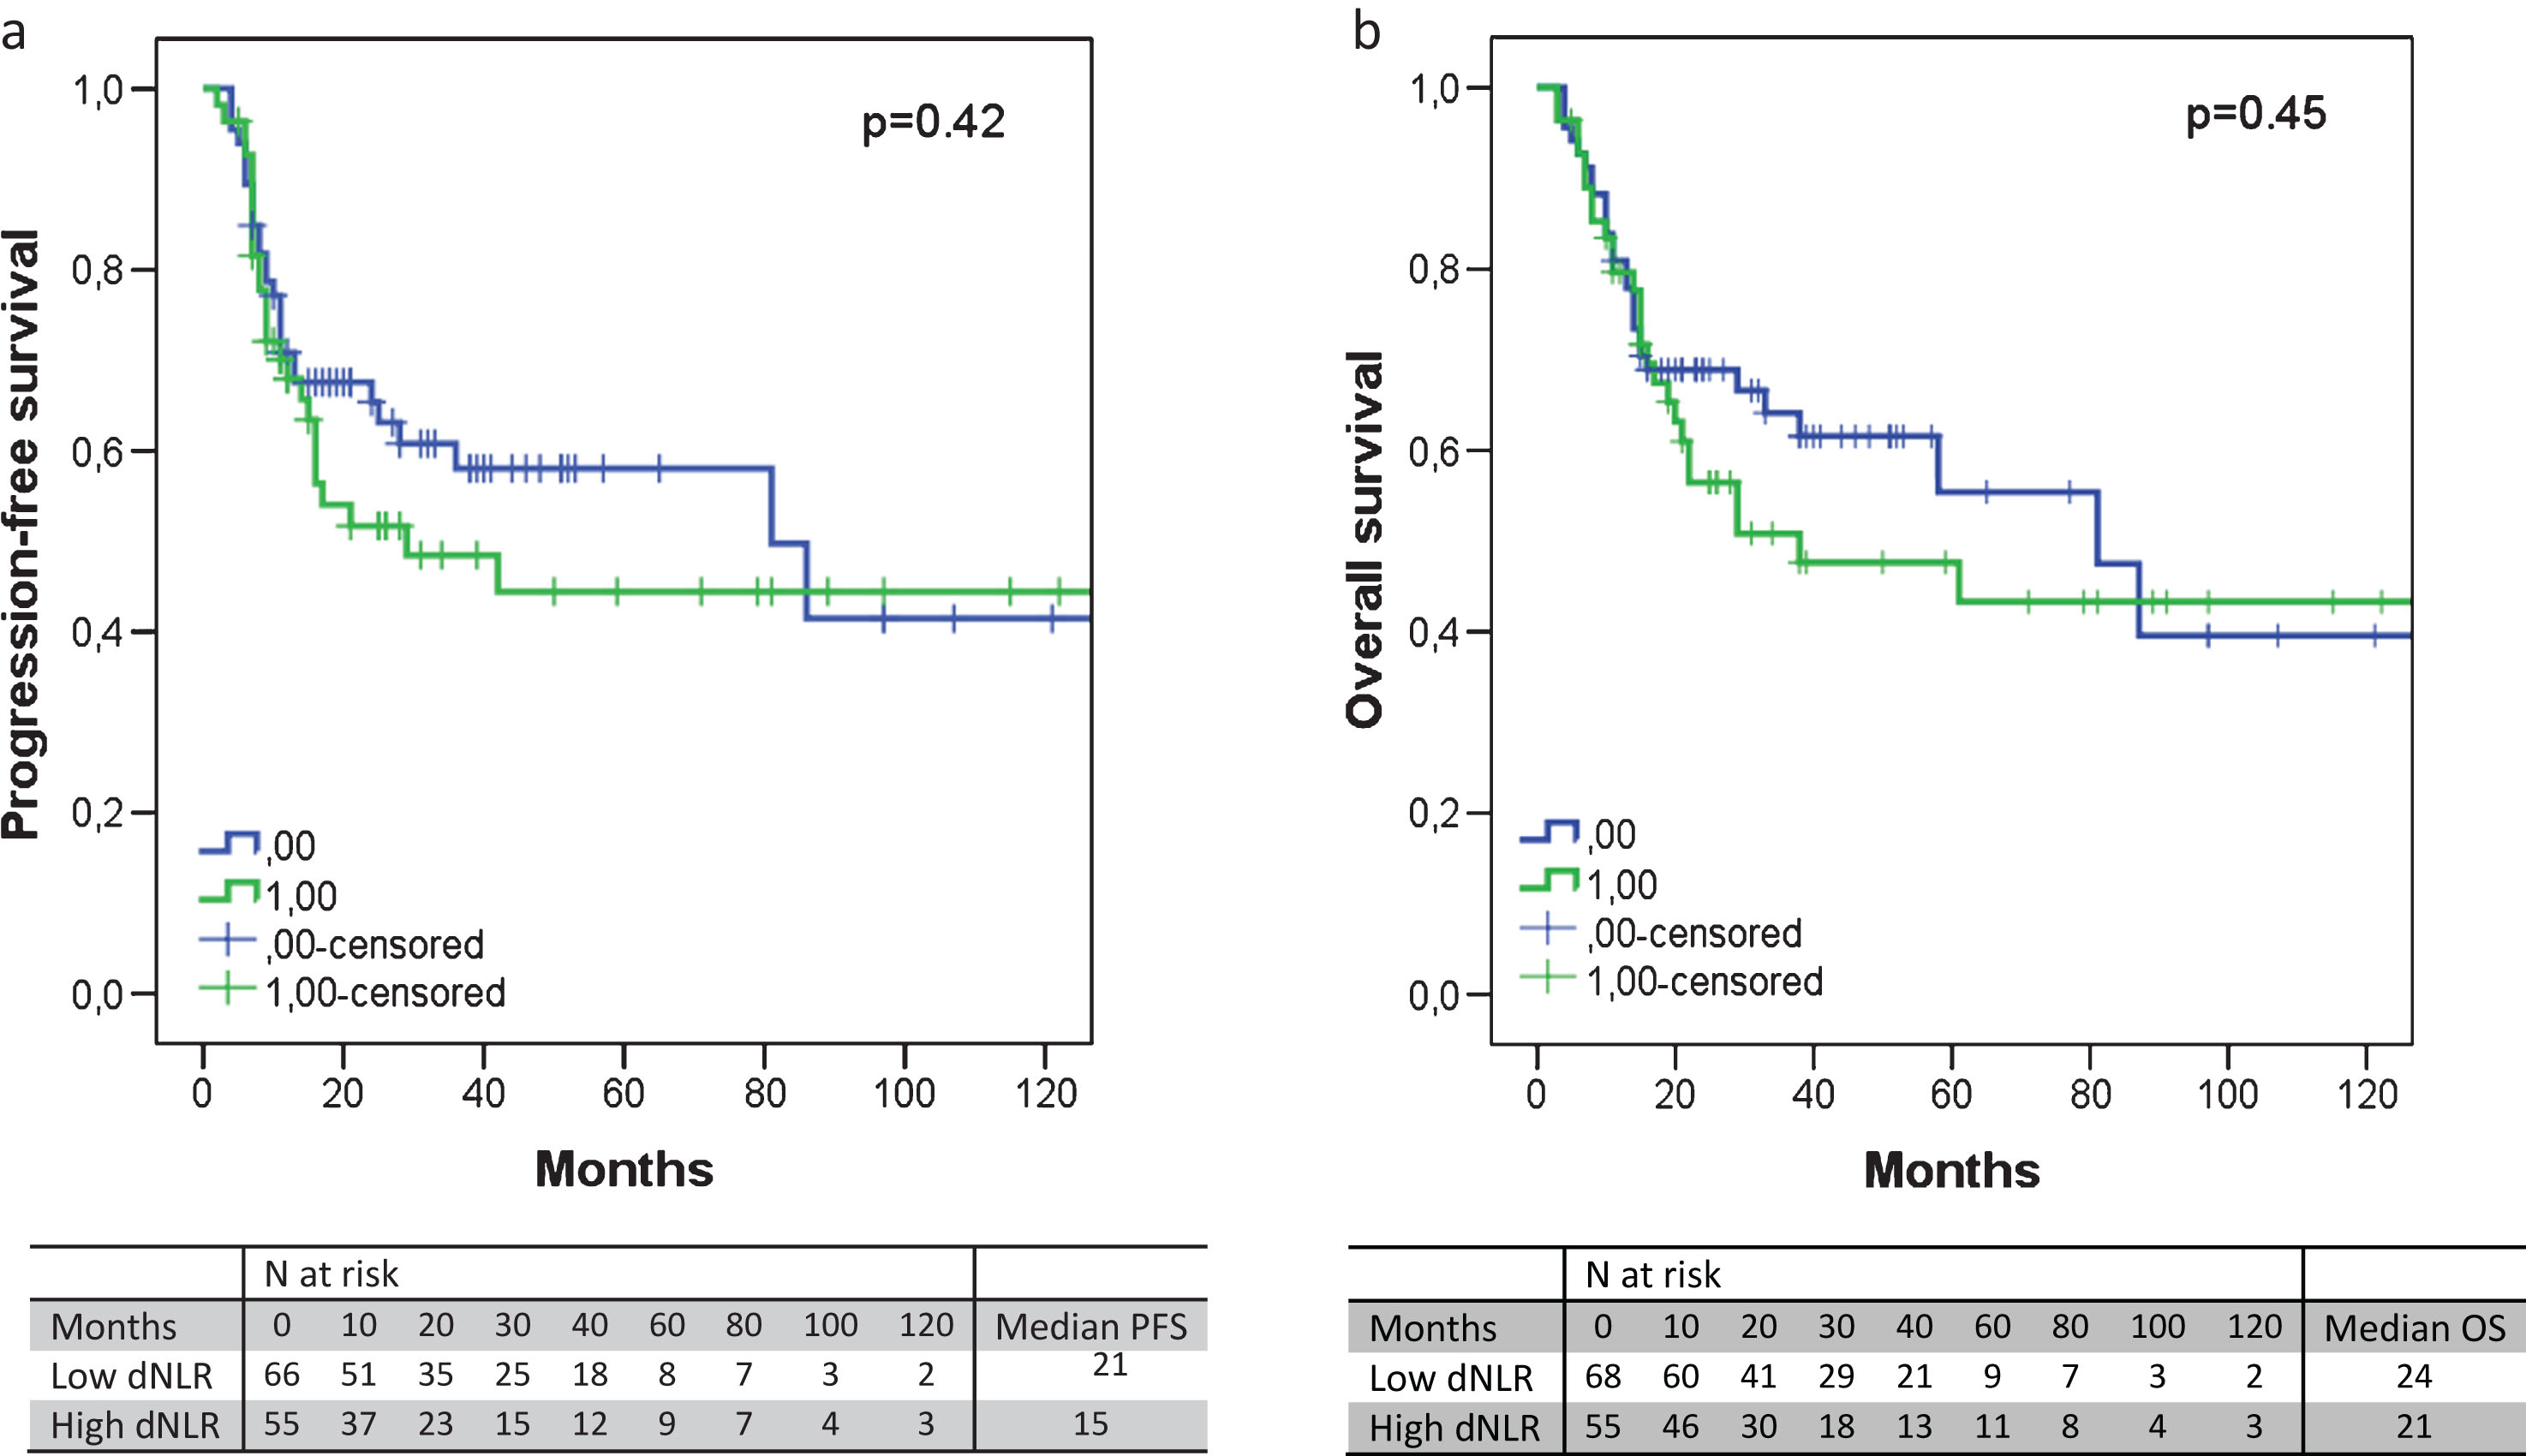
Fig.2
The progression-free survival (a) and overall survival (b) according to the dNLR, excluding node-positive patients. An elevated dNLR corresponded with an absolute shorter PFS (median 35 versus 26 months, p = 0.28) or OS (median 35 versus 29 months, p = 0.29), albeit not significantly.
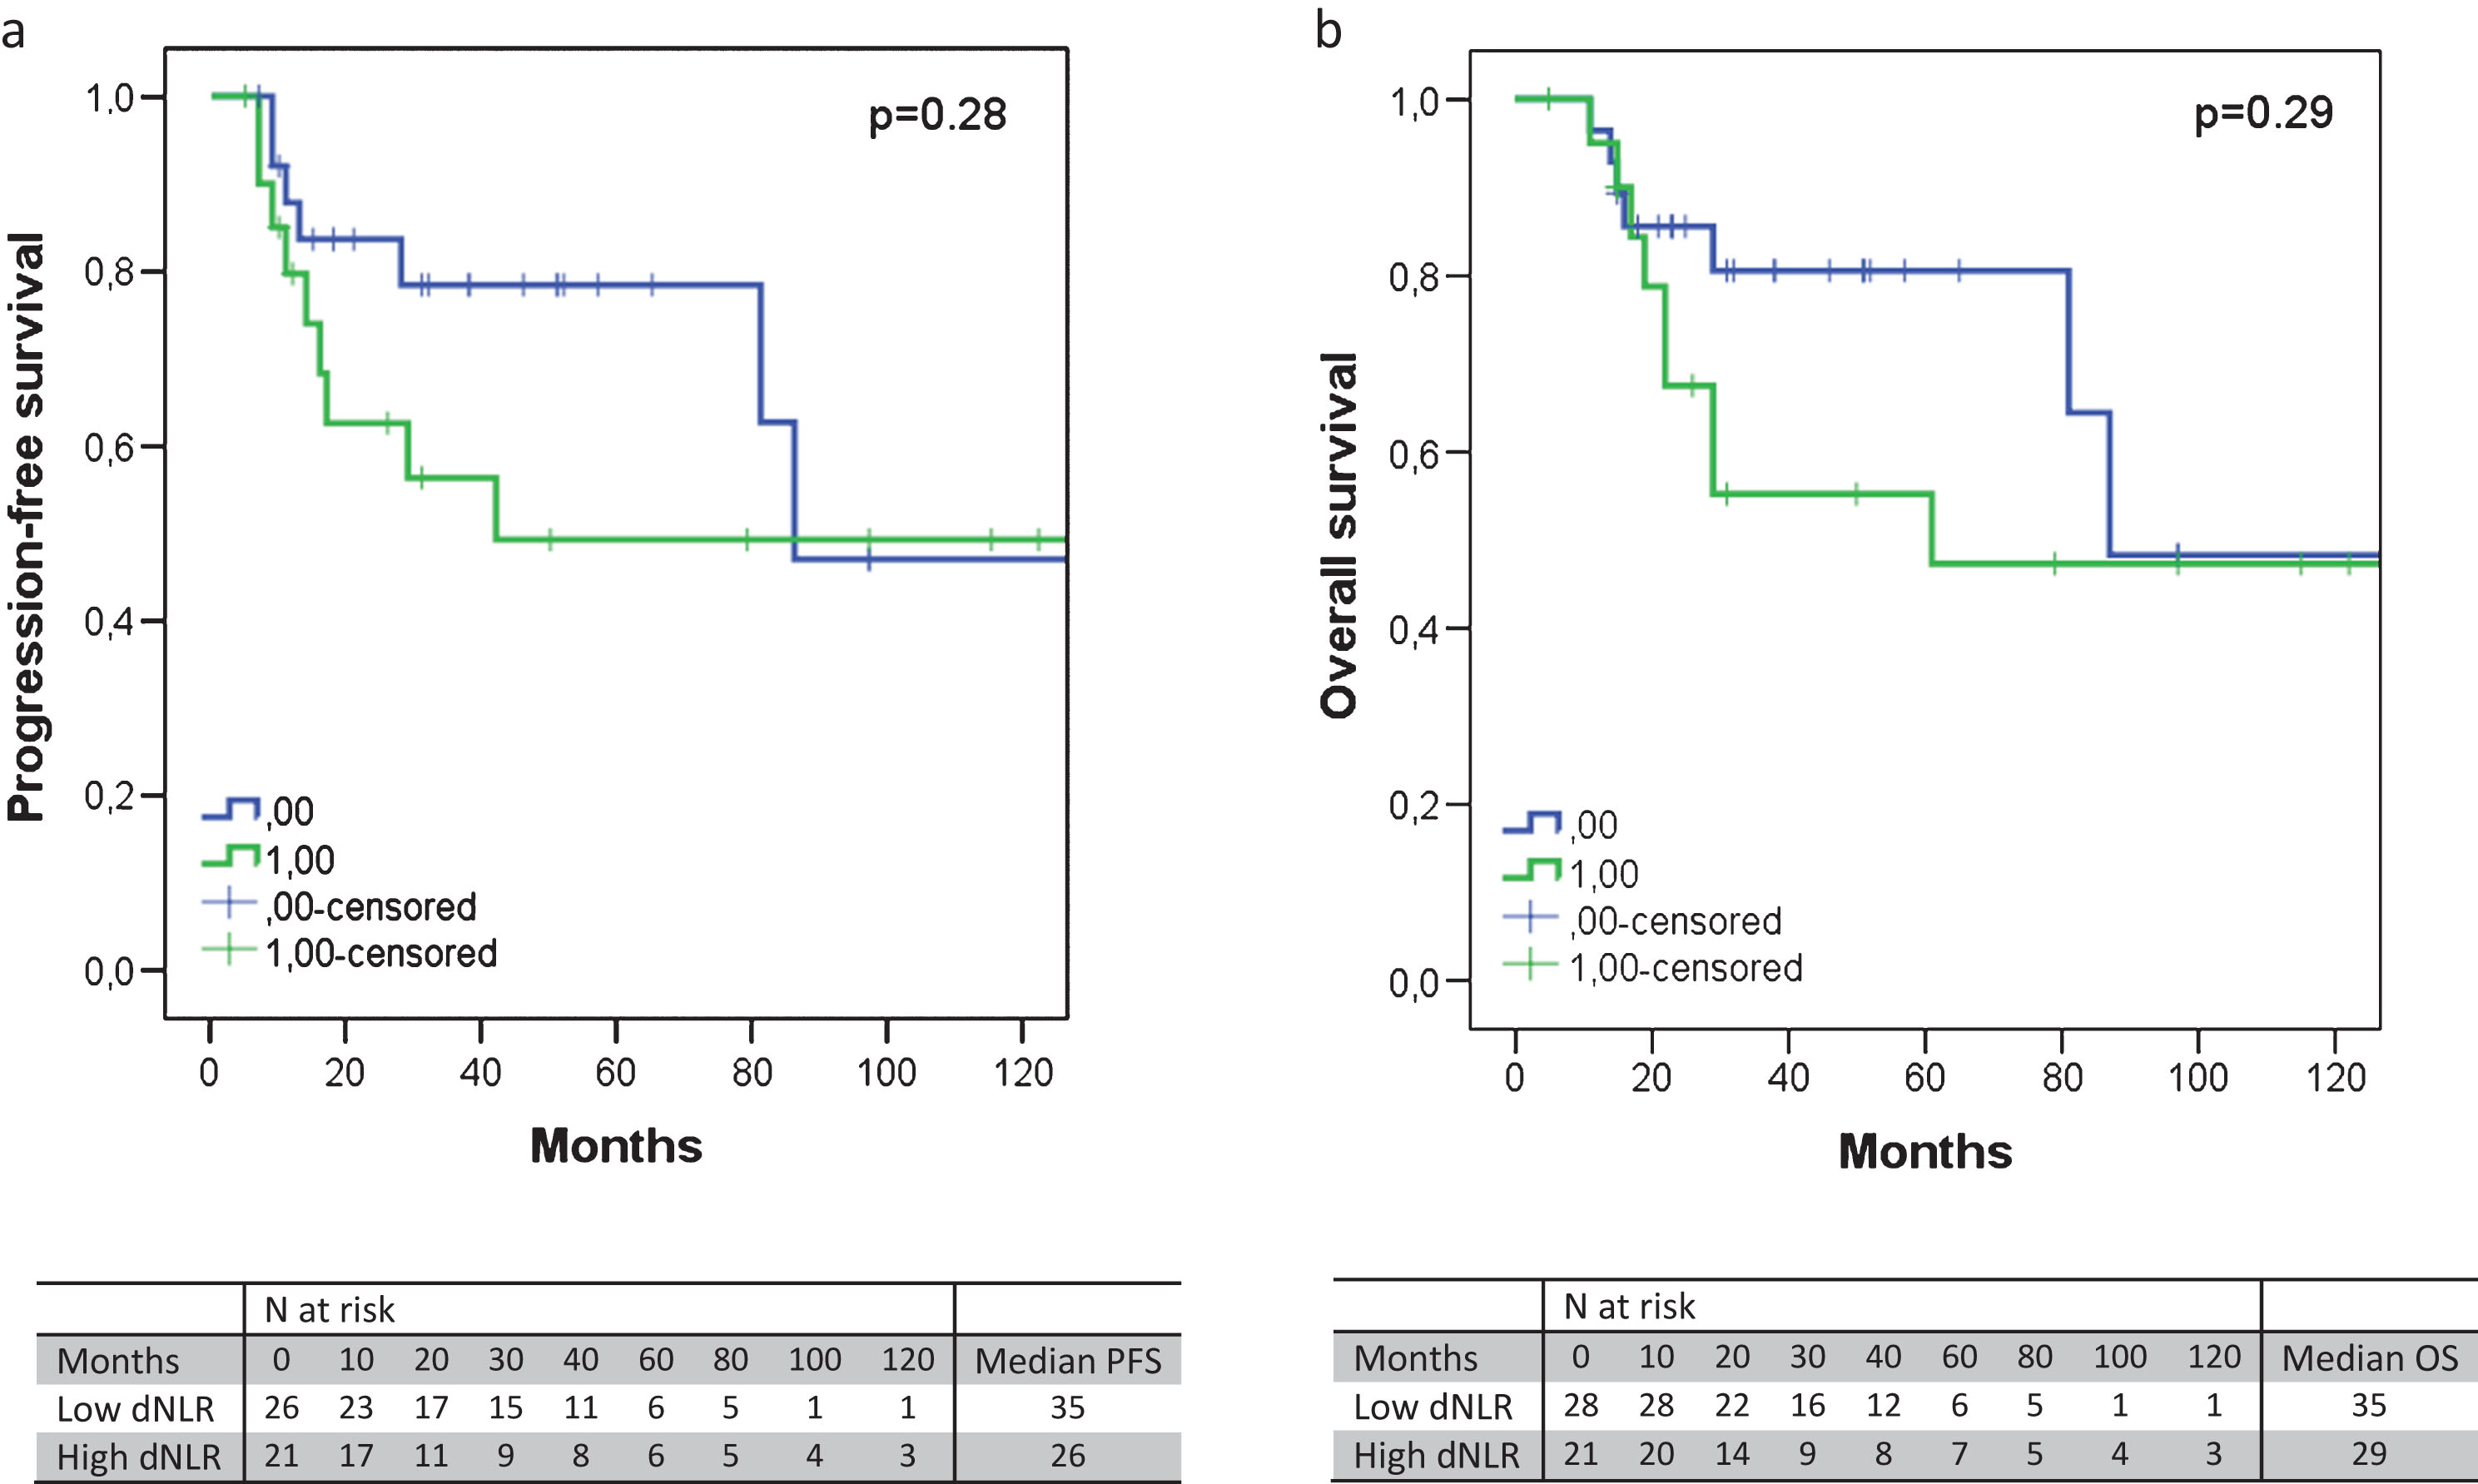
Table 1
Baseline characteristics of patients originating from three different Dutch hospitals (Erasmus Medical Center, Antoni van Leeuwenhoek Hospital, Sint Franciscus Gasthuis) who underwent POC and radical cystectomy for MIBC (N = 123). Patients are categorized by response to POC
| Variables | CR (n = 35) | PR (n = 11) | NR (n = 77) | P-value CR vs NR |
| Age, years (median, range) | 58 (45–77) | 57 (34–75) | 63 (35–76) | 0.76 |
| Gender | 0.82 | |||
| Male | 27 (77.1%) | 7 (63.6%) | 57 (74%) | |
| Female | 8 (22.9%) | 4 (36.4%) | 20 (26%) | |
| Smoking status | 0.74 | |||
| Never | 5 (14.3%) | – | 10 (13.0%) | |
| Former | 9 (25.7%) | 1 (9.1%) | 18 (23.4%) | |
| Current | 9 (25.7%) | 3 (27.3%) | 12 (15.6%) | |
| Unknown | 12 (34.4%) | 7 (63.6%) | 37 (48.1%) | |
| Charlson Comorbidity Index | 0.72 | |||
| 3 | 1 (2.9%) | 1 (9.1%) | – | |
| 4 | 4 (11.4%) | 2 (18.2%) | 7 (9.1%) | |
| 5 | 4 (11.4%) | – | 6 (7.8%) | |
| 6 | 2 (5.7%) | 2 (18.2%) | 4 (5.2%) | |
| 7 | – | – | 2 (2.6%) | |
| Unknown | 24 (68.6%) | 6 (54.5%) | 58 (75.3%) | |
| Karnofsky Performance Score | 0.20 | |||
| 70 | – | 1 (9.1%) | 1 (1.3%) | |
| 80 | – | – | 5 (6.5%) | |
| 90 | 8 (22.9%) | 2 (18.2%) | 8 (10.4%) | |
| 100 | 3 (8.6%) | 2 (18.2%) | 5 (6.5%) | |
| Unknown | 24 (68.6%) | 6 (54.5%) | 58 (75.3%) | |
| Tumor presentation | 0.30 | |||
| Primary | 23 (65.7%) | 10 (90.9%) | 58 (75.3%) | |
| Recurrence | 9 (25.7%) | 1 (9.1%) | 13 (16.9%) | |
| Unknown | 3 (8.6%) | – | 6 (7.8%) | |
| Clinical tumor stage | 0.11 | |||
| T1 | 3 (8.6%) | – | 1 (1.3%) | |
| T2 | 8 (22.9%) | 3 (27.3%) | 16 (20.8%) | |
| T3 | 17 (48.6%) | 6 (54.5%) | 31 (40.3%) | |
| T4 | 7 (20%) | 2 (18.2%) | 28 (36.4%) | |
| Unknown | – | – | 1 (1.3%) | |
| Extravesical extension at diagnostic imaging | 0.18 | |||
| Positive | 10 (28.6%) | 2 (18.2%) | 33 (42.9%) | |
| Negative | 17 (48.6%) | 7 (63.6%) | 29 (37.7%) | |
| Unknown | 8 (22.9%) | 2 (18.2%) | 15 (19.5%) | |
| Lymphadenopathy at diagnostic imaging | <0.01 | |||
| Positive | 8 (22.9%) | 4 (36.4%) | 40 (51.9%) | |
| Negative | 19 (54.3%) | 5 (45.5%) | 25 (32.5%) | |
| Unknown | 8 (22.9%) | 2 (18.2%) | 12 (15.6%) | |
| Hydronephrosis at diagnostic imaging | 0.17 | |||
| Positive | 9 (25.7%) | 5 (45.5%) | 32 (41.6%) | |
| Negative | 18 (51.4%) | 4 (36.4%) | 32 (41.6%) | |
| Unknown | 8 (22.9%) | 2 (18.2%) | 12 (16.9%) | |
| Hemoglobin level, mmol/L (median, range) | 8.3 (5.5–10.3) | 8.6 (7.3–9.5) | 8.0 (5.5–10.0) | 0.12 |
| Creatinine level, μmol/L (median, range) | 75 (56–209) | 76 (65–122) | 92 (46–186) | 0.28 |
| Glomerular Filtration Rate (GFR), ml/min (median, range) | 87 (35–115) | 80 (53–90) | 72 (44–124) | 0.56 |
| POC regimen | 0.51 | |||
| Cisplatin based | 26 (74.3%) | 10 (90.9%) | 51 (66.2%) | |
| Carboplatin based | 9 (25.7%) | 1 (9.1%) | 26 (33.8%) | |
| Recurrence after cystectomy | <0.01 | |||
| Yes | 7 (20%) | 2 (18.2%) | 48 (62.3%) | |
| No | 28 (80%) | 9 (81.8%) | 29 (37.7%) | |
| Last follow up status | <0.01 | |||
| Alive, no evidence of disease | 25 (71.4%) | 8 (72.7%) | 22 (28.6%) | |
| Alive, with recurrent disease | 3 (8.6%) | – | 6 (7.8%) | |
| Dead of non-disease | 3 (8.6%) | 1 (9.1%) | 5 (6.5%) | |
| Dead of disease | 3 (8.6%) | 2 (18.2%) | 39 (50.6%) | |
| Lost to follow up | 1 (2.9%) | – | 5 (6.5%) | |
| Time from dTUR to surgery, months (median, range) | 5.0 (3–8) | 5.0 (4–6) | 5.0 (2–19) | 0.30 |
| Time from POC to surgery, months (median, range) | 3.0 (2–4) | 3.0 (2–5) | 3.0 (1–9) | 0.67 |
CR, complete response; NR, non-response; PR, partial response; POC, pre-operative chemotherapy.
Table 2a
Univariable logistic regression analyses assessing the association between potential predictive variables and response to POC at cystectomy
| CR (n = 35) vs. NR (n = 77) | CR (n = 35)+PR (n = 11) vs. NR (n = 77) | |||||
| OR (95% CI) | P value | AUC (95% CI) | OR (95% CI) | P value | AUC (95% CI) | |
| Age | 1.00 (0.95–1.05) | 0.93 | 0.52 (0.39–0.65) | 1.02 (0.98–1.07) | 0.28 | 0.58 (0.46–0.69) |
| Gender | 1.18 (0.36–2.69) | 0.72 | 0.52 (0.40–0.63) | 1.09 (0.47–2.53) | 0.85 | 0.51 (0.40–0.62) |
| Diagnostic imaging | ||||||
| Extravesical extension | 1.93 (0.77–4.89) | 0.16 | 0.58 (0.45–0.71) | 2.37 (0.99–5.66) | 0.05 | 0.60 (0.49–0.72) |
| Lymphadenopathy | 3.80 (1.45–9.98) | 0.01 | 0.66 (0.54–0.78) | 3.30 (1.38–7.87) | 0.01 | 0.64 (0.53–0.76) |
| Hydronephrosis | 2.00 (0.78–5.11) | 0.15 | 0.58 (0.46–0.71) | 1.35 (0.58–3.10) | 0.49 | 0.54 (0.42–0.66) |
| Concomitant (<50%) non-urothelial cell type at dTUR | 0.66 (0.24–1.84) | 0.43 | 0.47 (0.35–0.59) | 0.74 (0.2–1.84) | 0.54 | 0.48 (0.37–0.59) |
| Concomitant CIS at dTUR | 1.04 (0.35–3.13) | 0.94 | 0.50 (0.38–0.63) | 1.48 (0.51–4.29) | 0.48 | 0.53 (0.41–0.65) |
| Hemoglobin at baseline | 0.70 (0.45–1.08) | 0.11 | 0.40 (0.28–0.53) | 0.66 (0.44–1.00) | 0.05 | 0.39 (0.27–0.50) |
| Creatinine at baseline | 1.00 (0.99–1.02) | 0.66 | 0.57 (0.45–0.69) | 1.01 (0.99–1.02) | 0.39 | 0.58 (0.48–0.69) |
| GFR at baseline | 0.99 (0.97–1.02) | 0.59 | 0.46 (0.31–0.60) | 0.99 (0.97–1.02) | 0.44 | 0.45 (0.32–0.58) |
| Neutrophil count at baseline | 1.10 (0.93–1.29) | 0.28 | 0.56 (0.45–0.68) | 0.97 (0.89–1.07) | 0.59 | 0.51 (0.41–0.62) |
| Leukocyte count at baseline | 1.11 (0.96–1.28) | 0.18 | 0.57 (0.46–0.68) | 0.99 (0.91–1.07) | 0.72 | 0.52 (0.41–0.62) |
| Neutrophil percentage of WBC at baseline | 1.01 (0.67–1.05) | 0.77 | 0.55 (0.44–0.67) | 1.00 (0.96–1.04) | 0.90 | 0.52 (0.42–0.63) |
| dNLR at baseline, continuous | 1.00 (0.67–1.49) | 0.99 | 0.55 (0.44–0.67) | 0.92 (0.65–1.31) | 0.66 | 0.52 (0.42–0.63) |
| dNLR at baseline, dichotomized | 2.70 (1.15–6.38) | 0.02 | 0.62 (0.51–0.73) | 1.98 (0.92–4.26) | 0.08 | 0.58 (0.48–0.69) |
CR, complete response; NR, non-response; PR, partial response; OR, odds ratio; AUC, area under the Receiver Operating Characteristic curve; dTUR, diagnostic transurethral resection; GFR, glomerular filtration rate; WBC, white blood cell count; dNLR, derived neutrophil-to-lymphocyte ratio.
Table 2b
Univariable logistic regression analyses assessing the association between potential predictive variables and response to POC at cystectomy excluding N+ patients
| CR (n = 27) vs. NR (n = 37) | CR (n = 27) + PR (n = 7) vs. NR (n = 37) | |||||
| OR (95% CI) | P value | AUC (95% CI) | OR (95% CI) | P value | AUC (95% CI) | |
| Age | 1.02 (0.96–1.08) | 0.50 | 0.58 (0.42–0.74) | 1.04 (0.99–1.10) | 0.15 | 0.63 (0.49–0.76) |
| Gender | 1.21 (0.40–3.68) | 0.74 | 0.52 (0.38–0.66) | 1.23 (0.44–3.44) | 0.69 | 0.52 (0.39–0.66) |
| Diagnostic imaging | ||||||
| Extravesical extension | 1.56 (0.46–5.23) | 0.48 | 0.56 (0.38–0.73) | 2.33 (0.73–7.43) | 0.15 | 0.60 (0.44–0.77) |
| Hydronephrosis | 1.59 (0.46–5.50) | 0.47 | 0.55 (0.38–0.73) | 1.07 (0.34–3.33) | 0.91 | 0.51 (0.35–0.67) |
| Concomitant (<50%) non-urothelial cell type at dTUR | 0.98 (0.29–3.37) | 0.97 | 0.50 (0.35–0.65) | 1.21 (0.36–4.09) | 0.76 | 0.52 (0.38–0.66) |
| Concomitant CIS at dTUR | 3.17 (0.74–13.60) | 0.12 | 0.60 (0.44–0.76) | 2.72 (0.72–10.25) | 0.14 | 0.59 (0.44–0.74) |
| Hemoglobin at baseline | 0.89 (0.51–1.55) | 0.67 | 0.47 (0.31–0.63) | 0.89 (0.52–1.51) | 0.66 | 0.47 (0.32–0.61) |
| Creatinine at baseline | 1.00 (0.99–1.02) | 0.76 | 0.54 (0.38–0.69) | 1.01 (0.99–1.03) | 0.26 | 0.59 (0.45–0.73) |
| GFR at baseline | 1.01 (0.98–1.04) | 0.67 | 0.54 (0.34–0.73) | 1.00 (0.97–1.03) | 0.77 | 0.47 (0.29–0.66) |
| Neutrophil count at baseline | 1.10 (0.93–1.29) | 0.28 | 0.56 (0.45–0.68) | 0.96 (0.86–1.08) | 0.50 | 0.50 (0.36–0.63) |
| Leukocyte count at baseline | 1.08 (0.91–1.29) | 0.38 | 0.55 (0.40–0.69) | 0.99 (0.91–1.07) | 0.72 | 0.52 (0.41–0.62) |
| Neutrophil percentage of WBC at baseline | 1.03 (0.85–1.25) | 0.75 | 0.52 (0.37–0.66) | 0.98 (0.89–1.08) | 0.62 | 0.51 (0.37–0.65) |
| dNLR at baseline, continuous | 0.79 (0.50–1.25) | 0.31 | 0.47 (0.33–0.62) | 0.82 (0.54–1.24) | 0.35 | 0.50 (0.36–0.63) |
| dNLR at baseline, dichotomized | 1.70 (0.61–4.76) | 0.31 | 0.56 (0.42–0.71) | 1.62 (0.62–4.25) | 0.33 | 0.56 (0.42–0.69) |
CR, complete response; NR, non-response; PR, partial response; OR, odds ratio; AUC, area under the Receiver Operating Characteristic curve; dTUR, diagnostic transurethral resection; GFR, glomerular filtration rate; WBC, white blood cell count; dNLR, derived neutrophil-to-lymphocyte ratio.
Table 3
Multivariable logistic regression analyses assessing the association between predictive variables and the response to POC at cystectomy
| Multivariable model A | CR (n = 35) vs. NR (n = 77) | |||
| Step 1 | OR (95% CI) | P-value | AUC (95% CI) | Optimism-corrected AUC |
| dNLR, dichotomized | 2.08 (0.69–6.33) | 0.20 | 0.78 (0.68–0.88) | |
| Hemoglobin at baseline | 0.91 (0.54–1.56) | 0.74 | ||
| Lymphadenopathy | 5.21 (1.69–16.11) | <0.01 | ||
| Hydronephrosis | 0.97 (0.29–3.24) | 0.96 | ||
| Clinical T stage (T1 reference) | – | – | ||
| T2 | 7.17 (0.47–109.83) | 0.16 | ||
| T3 | 9.39 (0.63–139.95) | 0.10 | ||
| T4 | 23.24 (1.34–404.12) | 0.03 | ||
| POC regimen | 0.75 (0.23–2.40) | 0.63 | ||
| Final step | ||||
| Lymphadenopathy | 5.49 (1.85–16.33) | <0.01 | 0.75 (0.64–0.86) | 0.72 |
| Clinical T stage (T1 reference) | – | – | ||
| T2 | 7.97 (0.56–114.00) | 0.13 | ||
| T3 | 11.11 (0.82–150.25) | 0.07 | ||
| T4 | 30.30 (1.94–473.87) | 0.02 | ||
| Multivariable model B | CR (n = 35) + PR (n = 11) vs. NR (n = 77) | |||
| Step 1 | OR (95% CI) | P-value | AUC (95% CI) | Optimism-corrected AUC |
| dNLR, dichotomized | 1.17 (0.43–3.17) | 0.76 | 0.75 (0.65–0.85) | |
| Hemoglobin at baseline | 0.81 (0.49–1.34) | 0.41 | ||
| Lymphadenopathy | 4.09 (1.53–10.93) | <0.01 | ||
| Extravesical extension | 2.21 (0.71–6.87) | 0.17 | ||
| Clinical T stage (T1 reference) | – | – | ||
| T2 | 5.93 (0.41–86.07) | 0.19 | ||
| T3 | 4.12 (0.30–56.27) | 0.29 | ||
| T4 | 6.08 (0.39–95.83) | 0.20 | ||
| POC regimen | 0.65 (0.23–1.88) | 0.43 | ||
| Final step | ||||
| Lymphadenopathy | 3.81 (1.52–9.57) | <0.01 | 0.71 (0.60–0.82) | 0.68 |
| Extravesical extension | 2.89 (1.14–7.31) | 0.03 | ||
CR, complete response; NR, non-response; OR, odds ratio; AUC, area under the Receiver Operating Characteristic curve; dNLR, derived neutrophil-to-lymphocyte ratio.


