
Obesity and Outcomes in Patients with Metastatic Urothelial Carcinoma1
Abstract
Background: Obesity has been associated with worse outcomes in patients with clinically localized urothelial cancer. However, this impact has not been evaluated in metastatic disease.
Objective: To assess the impact of obesity on outcomes of patients with metastatic urothelial cancer.
Methods: Data from 537 patients were aggregated from eight phase II and phase III clinical trials investigating first-line cisplatin-based combination therapy in metastatic urothelial cancer. Chemotherapy regimen, adverse events, treatment response, and survival outcomes were compared across body mass index (BMI) and body surface area (BSA) categories.
Results: BMI was classified according to WHO criteria (<18.5 underweight, 18.5–24.99 normal weight, 25–29.99 overweight, >30 obese). BSA was classified as either below or greater than or equal to (average for this cohort (1.87 m2 for males and 1.66 m2 for females). There was no significant difference in number of chemotherapy cycles, adverse events, and response rate or survival outcomes (overall and progression-free) across BMI and BSA categories. There was no significant difference in adverse events across BMI categories, but the incidences of embolic events and renal failure were higher in patients with an average or higher BSA than those with a lower than average BSA (6.6% vs. 3.1% for renal failure p = 0.06; 5.9% vs. 2.7% for renal failure, p = 0.07). There was no significant difference in response rate or survival outcomes (overall and progression-free) amongst BMI and BSA categories.
Conclusions: Obese patients with metastatic urothelial cancer on cisplatin-based therapies have similar response rates, survival outcomes, and tolerability of cisplatin-based therapy to non-obese patients.
INTRODUCTION
Obesity has become a worldwide epidemic, contributing to the global burden of diseases such as diabetes, heart disease, and cancer [1, 2]. From 1980 to 2013, the proportion of overweight and obese adults increased globally (29% to 37% in men and 30% to 38% in women) [2]. By 2030, the prevalence of obesity in the United States is projected to be 50-51% in men and 45–52% for women, with similar upward trends worldwide [1]. Obesity has been associated with urothelial cancer risk and potentially influences behavior of the disease [3–5].
Though obesity has been shown to increase the risk of urothelial cancer, results of studies investigating obesity’s impact on the outcomes of patients with localized urothelial cancer have been inconsistent [6, 7]. Both Chromecki et al. and Kluth et al. showed that obesity was a predictor of bladder cancer recurrence, tumor-specific mortality, and overall mortality [8, 9]. Calle et al.’s study of 900,000 adults with cancer in the United States showed that obesity negatively influenced mortality outcomes in bladder cancer, but the association was not significant [10]. On the contrary, in patients undergoing surgical intervention for bladder cancer, cohort studies have shown that obesity does not influence mortality outcomes [9, 11]. One study even showed that increased body mass index is associated with favorable prognosis in localized bladder cancer [12]. Differences in clinical disease states (i.e., non-muscle-invasive versus invasive) and geographic populations studied, as well as differences in methodology, likely account, at least in part, for this discordance.
While there is an extensive body of literature on the influence of obesity on localized urothelial disease, the impact of obesity on the outcomes of patients with metastatic urothelial disease has not previously been investigated. Assessing obesity’s effect on metastatic disease is important for elucidating prognostic and predictive factors in the advanced disease setting and generating insights regarding disease pathogenesis, and even potentially for providing the basis for “bedside to bench” research on novel therapeutic targets in metastatic bladder disease, such as IGF-1 and adipokines [13]. Therefore, we evaluated the impact of body mass index (BMI) and body surface area (BSA) on outcomes in a cohort of patients receiving cisplatin-based combination therapy for metastatic urothelial cancer.
MATERIALS AND METHODS
Inclusion criteria
Data from 585 patients were aggregated from eight phase II and phase III clinical trials investigating first-line cisplatin-based combination therapy in metastatic urothelial cancer from 1998-2011. This dataset has previously been described in detail [14]. Treatment regimens in the included trials have been described in detail in past publications or presentations (Table 1). In all trials, a histologic or pathologic diagnosis of urothelial carcinoma was required; pretreatment evaluation included complete blood cell count, creatinine, and hepatic function tests, and baseline imaging studies were obtained with repeat imaging after every 2 or 3 treatment cycles. In included trials, tumor response and treatment toxicity were assessed with either World Health Organization (WHO) criteria or Response Evaluation Criteria in Solid Tumors (RECIST). Of note, the listed trials did not have any weight-based inclusion or exclusion criteria and treatment was dosed based upon actual body surface area. Informed consent was obtained for treatment from all participants and the Institutional Review Boards at the participating institutions approved each study.
Statistical analysis
Patients were divided into groups according to both body mass index (BMI) and body surface area (BSA) categories. Weight and height were measured at the time of receiving first-line therapy. BMI was classified according to WHO criteria (<18.5 underweight, 18.5–24.99 normal weight, 25–29.99 overweight, >30 obese) [15]. BSA was classified as either below or greater than or equal to the average for this cohort (1.87 m2 for males and 1.66 m2 for females). Unlike BMI, there are no standard methods of categorizing BSA. As bladder cancer therapy is dosed according to BSA, distinguishing outcomes between patients with different BSAs is important.
Baseline patient characteristics, chemotherapy regimen, adverse events, and treatment response rates were compared across BMI and BSA categories using the Kruskal-Wallis test for continuous variables and the Fisher’s exact test for categorical variables. To estimate survival curves for overall survival (OS) and progression-free survival (PFS), the product limit method of Kaplan-Meier was used. The log-rank test was utilized to compare both OS and PFS across BMI and BSA categories. A Cox proportional hazards regression was used to model PFS and OS comparing weight strata while adjusting for baseline covariates (ECOG-PS≥1, visceral metastasis). Logistic regression was used to determine if weight category was a predictor of certain bladder cancer characteristics (disease sites, primary tumor site, prior perioperative chemotherapy, and surgical intervention), with and without adjustment for country and chemotherapy regimen to account for different populations amongst the different included clinical trials. All statistical analyses were conducted with Stata v13. P-values < 0.05 were considered statistically significant.
RESULTS
Baseline characteristics
585 patients were pooled from eight phase II and III clinical trials, of which 537 were included for analysis; 31 patients were excluded for lack of metastatic disease, 10 for absent height and weight metrics, and 7 for lack of follow up data. Of the 537 patients, 4.1% had a BMI <18.5, 42.8% a BMI of 18.5–24.99, 41.0% with a BMI of 25–29.99, and 12.1% were obese (BMI >30). 51.2% of patients were below average for BSA.
Baseline characteristics of the included patient population are described in Table 2. Male patients were more likely to be in obese or overweight BMI categories than female patients (p = 0.01). However, when categorized by BSA, the difference between male and female patients was not significant (p = 0.24). The highest proportion of overweight/obese patients and patients with BSA greater than or equal to average came from Greece, while Taiwan had the lowest. These differences in BMI (p < 0.01) and BSA (p < 0.01) were statistically significant. BMI and BSA categories were significantly associated with baseline tumor characteristics, including site of primary tumor and site of metastases. However, these associations were no longer statistically significant when in an analysis for country of origin, except for BSA≥average being less likely to get bone metastases (Odds Ratio = 0.63, 95% Confidence Interval 0.41–0.96) (Supplemental Table 2).
Chemotherapy administration and adverse events
Details regarding the chemotherapy regimens, number of cycles administered, and adverse events across BMI and BSA strata are detailed in Table 3. Patients’ treatment regimens significantly differed across BMI (p < 0.01) and BSA (p < 0.01) categories, with patients with higher BMI category and BSA greater than or equal to average were more likely to receive gemcitabine-cisplatin-based therapy rather than MVAC (methotrexate, vinblastine, doxorubicin, and cisplatin)-based or other therapy regimens. Patients receiving regimens with VEGF-targeting agents were also more likely to be in higher BMI (p < 0.01) and BSA (p < 0.01) categories. There were no significant differences in number of chemotherapy cycles across BMI (p = 0.27) and BSA (p = 0.28) categories, with median number of cycles ranging from 12–14. Of note, several of the included trials permitted maintenance treatment with a single agent (e.g., bevacizumab), which explains the higher range of delivered cycles in this dataset. There were no significant differences across BMI and BSA categories in the proportion of grade 3-4 renal failure, grade 3-4 neutropenia, febrile neutropenia, grade 3-4 thrombocytopenia, and thromboembolic events. Of note, the incidence of thromboembolic events was higher in patients with a BSA greater than or equal to average (5.9%) than those with a BSA below average (2.7%) (p = 0.07). Additionally, the incidence of grade 3-4 renal failure was also higher in those with a BSA greater than average (6.6%) than those with a BSA lower than average (3.1%) (p = 0.06). When stratified according to treatment regimen (MVAC- vs. GC-based and with a VEGF-targeting drug vs. without), the associations of BMI and BSA with adverse events were also not statistically significant (Supplemental Table 1).
Response rate and survival
Across BMI and BSA categories, there was no significant difference in complete response, partial response, and the combined outcome of both complete and partial response (Table 4). There was also no significant difference in overall survival (OS) or progression free survival (PFS) across BMI (log rank p = 0.56 (OS), p = 0.77 (PFS)) and BSA categories (log rank p = 0.60 (OS), p = 0.40 (PFS)). (Fig. 1) Median survival in months was 9.1 for BMI < 18.5, 14.2 for BMI between 18 and 24.99, 12.1 for BMI between 25 and 29.99, and 11.6 for BMI > 30 (Table 4). For patients with BSA below and greater than or equal to average, median survivals were 12.5 months and 12.4 months, respectively (Table 4). After adjusting for poor prognostic factors (visceral metastases and ECOG≥1), there remained no significant difference in overall survival and progression-free survival across BMI and BSA categories (Table 5).
We excluded the Bamias et al. 2003 trial, as cisplatin-docetaxel was inferior to MVAC in this trial, which showed no significant difference in OS or PFS across BSA categories (log rank p = 0.17 (OS), p = 0.54 (PFS)). Differences across BMI categories were not analyzed at subgroups were too small.
Outcomes based on chemotherapy regimen
Because patients in this cohort received a variety of cisplatin-based chemotherapy regimens, and a significant association between BMI and BSA and the chemotherapy regimen administered was observed, we further analyzed outcomes stratified by chemotherapy regimens (Supplemental Table 3). There were no significant differences in survival across BSA categories when stratified by GC-based or MVAC regimens. However, this result must be interpreted with caution as sample sizes are small in the therapy substrata. We did not stratify across BMI categories since sample sizes across categories were too small.
DISCUSSION
While obesity has been shown to be a risk factor for urothelial cancer, numerous studies investigating the role of obesity on localized urothelial cancer outcomes have shown inconsistent results. This report, to our knowledge, is the first to explore the influence on obesity in the metastatic urothelial disease. Our data show that response rates and survival outcomes in patients with metastatic urothelial cancer receiving first-line cisplatin-based chemotherapy are similar across BMI and BSA categories.
In many types of localized cancer, obesity has been established as a risk factor for poor prognosis. Obesity’s negative impact is hypothesized to be due to the release of factors that promote tumor growth, such as adiponectin and IGF-I [13]. The effect of obesity on metastatic cancer is much less established in the literature than in localized disease. In fact, several studies have shown that obesity might confer a survival benefit in metastatic cancer. Halabi et al. showed an inverse relationship of obesity and prostate cancer mortality and hypothesized that low BMI might reflect cancer cachexia and be an indicator of aggressive cancer [16]. Two reports investigating metastatic renal cell carcinoma showed no relationship between BMI and survival outcomes, but demonstrated that higher than average visceral fat and subcutaneous fat were associated with better survival outcomes [17, 18].
Supporting that low BMI might be indicative of cachexia in metastatic urothelial cancer patients is that our data show that patients with a BMI <18.5 were more likely to have worse ECOG functional status scores, a marker of poor prognosis. While results were not statistically significant, patients with a BMI <18.5 had the lowest median survival time compared to other BMI categories. In addition, in our model that adjusted for known poor prognostic factors in patients with metastatic urothelial cancer, including ECOG functional status, BMI and BSA categories were not independently associated with survival outcomes.
Our data overall demonstrate that adverse event rates are similar across BMI and BSA categories. However, while results were not statistically significant, the incidence of thromboembolic events was higher in those with a greater than or equal to average BSA (5.9%) than those with BSA below average (2.7%) (p = 0.07). Of note, the overall prevalence of thromboembolic events in this cohort was 4.3%, which is lower than what has been reported in the literature for metastatic bladder cancer patients (8.2%) [20]. 15.4% of this cohort was from Taiwan, and none of these patients had an embolic event, contributing to the overall low embolic event incidence. The low proportion of embolic events in the Taiwan cohort might be explained by evidence that patients of Asian race have lower rates of thromboembolic events than patients of other races, both in the general hospital setting and in the context of bladder cancer [19–21]. Interestingly, the incidence of renal failure was higher in those with a BSA greater than or equal to average (6.6%) than those with a BSA lower than average (3.1%) (p = 0.06). Obesity is a risk factor for underlying chronic kidney disease, potentially explaining this trend. The incidences of thromboembolic events and renal failure were low, so these results must be interpreted with caution.
Our analysis has several limitations. First, we used BMI and BSA as measures of obesity. BMI has been shown to be a poor predictor of visceral or subcutaneous fat and thus may not be an optimal surrogate for obesity [22]. Unfortunately, this dataset did not have imaging data to assess visceral fat or subcutaneous fat. Additionally, this is a retrospective study with pooled data from multiple clinical trials, including several different countries, and employing several different chemotherapy regimens. Our analysis included upper urinary tract tumors, in addition to primary bladder tumors. Patients with a BMI <25 had a higher proportion of upper tract disease than patients in higher BMI categories.
There are several potential strengths to our study. While heterogeneity in treatment regimens and countries of origin might introduce bias, it also potentially increases the generalizability of our results. Some trials employed regimens not considered standard, although all regimens were cisplatin-based. We did control for trial and these trials reported similar survival outcomes except the cisplatin plus docetaxel arm of the Bamias 2004 trial, which was inferior to MVAC in this phase III trial. Although this was a retrospective analysis, clinical trial data was utilized which was prospectively collected and involved uniform follow-up procedures and pre-specified toxicity and response assessments. Notably, data were missing for only 3% of our cohort.
CONCLUSIONS
In summary, our analysis shows that obese patients with metastatic urothelial disease treated with first-line cisplatin-based therapies have similar response rates and survival outcomes to non-obese patients. Tolerability of cisplatin-based therapy is similar across BMI and BSA categories. To our knowledge, this is the first investigation of the impact of obesity in metastatic urothelial cancer.
CONFLICT OF INTEREST
The authors have no conflicts of interest to report.
ACKNOWLEDGMENTS
Amanda Leiter was supported by a research stipend from the Icahn School of Medicine at Mount Sinai.
Appendices
The supplementary information is available in the electronic version of this article: http://dx.doi.org/10.3233/BLC-160047
REFERENCES
[1] | Wang YC , McPherson K , Marsh T , Gortmaker SL , Brown M . Health and economic burden of the projected obesity trends in the USA and the UK. Lancet (2011) ;378: 9793:815–25. |
[2] | Ng M , Fleming T , Robinson M , Thomson B , Graetz N , Margono C , et al. Global, regional, and national prevalence of overweight and obesity in children and adults during 1980-2013: A systematic analysis for the Global Burden of Disease Study 2013. Lancet (2014) ;384: (9945):766–81. |
[3] | Qin Q , Xu X , Wang X , Zheng XY . Obesity and risk of bladder cancer: A meta-analysis of cohort studies. Asian Pacific Journal of Cancer Prevention: APJCP (2013) ;14: (5):3117–21. |
[4] | Sun JW , Zhao LG , Yang Y , Ma X , Wang YY , Xiang YB . Obesity and risk of bladder cancer: A dose-response meta-analysis of 15 cohort studies. PloS One (2015) ;10: (3):e0119313. |
[5] | Koebnick C , Michaud D , Moore SC , Park Y , Hollenbeck A , Ballard-Barbash R , et al. Body mass index, physical activity, and bladder cancer in a large prospective study. Cancer epidemiology, biomarkers & prevention: A publication of the American Association for Cancer Research, cosponsored by the American Society of Preventive Oncology (2008) ;17: (5):1214–21. |
[6] | Cantiello F , Cicione A , Autorino R , De Nunzio C , Salonia A , Briganti A , et al. Metabolic syndrome, obesity, and radical cystectomy complications: A clavien classification system-based analysis. Clinical Genitourinary Cancer (2014) ;12: (5):384–93. |
[7] | Stewart SB , Freedland SJ . Influence of obesity on the incidence and treatment of genitourinary malignancies. Urologic Oncology (2011) ;29: (5):476–86. |
[8] | Chromecki TF , Cha EK , Fajkovic H , Rink M , Ehdaie B , Svatek RS , et al. Obesity is associated with worse oncological outcomes in patients treated with radical cystectomy. BJU International (2013) ;111: (2):249–55. |
[9] | Kluth LA , Xylinas E , Crivelli JJ , Passoni N , Comploj E , Pycha A , et al. Obesity is associated with worse outcomes in patients with T1 high grade urothelial carcinoma of the bladder. The Journal of Urology (2013) ;190: (2):480–6. |
[10] | Calle EE , Rodriguez C , Walker-Thurmond K , Thun MJ . Overweight, obesity, and mortality from cancer in a prospectively studied cohort of U.S. adults. The New England Journal of Medicine (2003) ;348: (17):1625–38. |
[11] | Maurer T , Maurer J , Retz M , Paul R , Zantl N , Gschwend JE , et al. Influence of body mass index on operability, morbidity and disease outcome following radical cystectomy. Urologia Internationalis (2009) ;82: (4):432–9. |
[12] | Kwon T , Jeong IG , You D , Han KS , Hong S , Hong B , et al. Obesity and prognosis in muscle-invasive bladder cancer: The continuing controversy. International Journal of Urology: Official Journal of the Japanese Urological Association (2014) ;21: (11):1106–12. |
[13] | Roberts DL , Dive C , Renehan AG . Biological mechanisms linking obesity and cancer risk: New perspectives. Annual Review of Medicine (2010) ;61: , 301–16. |
[14] | Haines L , Bamias A , Krege S , Lin CC , Hahn N , Ecke TH , et al. The impact of gender on outcomes in patients with metastatic urothelial carcinoma. Clinical Genitourinary Cancer (2013) ;11: (3):346–52. |
[15] | BMI Classification: World Health Organization; (2015) [cited 2015 August 11] Available from: http://apps.who.int/bmi/index.jsp?introPage=intro_3.html. |
[16] | Halabi S , Ou SS , Vogelzang NJ , Small EJ . Inverse correlation between body mass index and clinical outcomes in men with advanced castration-recurrent prostate cancer. Cancer (2007) ;110: (7):1478–84. |
[17] | Steffens S , Grunwald V , Ringe KI , Seidel C , Eggers H , Schrader M , et al. Does obesity influence the prognosis of metastatic renal cell carcinoma in patients treated with vascular endothelial growth factor-targeted therapy? Oncologist (2011) ;16: (11):1565–71. |
[18] | Ladoire S, Bonnetain F, Gauthier M, Zanetta S, Petit JM, Guiu S, et al. Visceral fat area as a new independent predictive factor of survival in patients with metastatic renal cell carcinoma treated with antiangiogenic agents. Oncologist (2011) ;16: (1):71–(81) . |
[19] | Stein PD , Kayali F , Olson RE , Milford CE . Pulmonary thromboembolism in Asians/Pacific Islanders in the United States: Analysis of data from the national hospital discharge survey and the united states bureau of the census. The American Journal of Medicine (2004) ;116: (7):435–42. |
[20] | Khorana AA , Francis CW , Culakova E , Kuderer NM , Lyman GH . Frequency, risk factors, and trends for venous thromboembolism among hospitalized cancer patients. Cancer (2007) ;110: (10):2339–46. |
[21] | Sandhu R , Pan CX , Wun T , Harvey D , Zhou H , White RH , et al. The incidence of venous thromboembolism and its effect on survival among patients with primary bladder cancer. Cancer (2010) ;116: (11):2596–603. |
[22] | Kuk JL , Lee S , Heymsfield SB , Ross R . Waist circumference and abdominal adipose tissue distribution: Influence of age and sex. The American Journal of Clinical Nutrition (2005) ;81: (6):1330–4. |
[23] | Hahn NM , Stadler WM , Zon RT , Waterhouse D , Picus J , Nattam S , et al. Phase II trial of cisplatin, gemcitabine, and bevacizumab as first-line therapy for metastatic urothelial carcinoma: Hoosier Oncology Group GU 04-75. Journal of Clinical Oncology: Official Journal of the American Society of Clinical Oncology (2011) ;29: (12):1525–30. |
[24] | Galsky MD , Hellerstedt BA , O’Rourke MA , Vogelzang NJ , Kocs DM , McKenney SA , Melnyk AM , Hutson TE , Rauch MA , Wang Y , Asmar L , Sonpavde G . Phase II study of gemcitabine, cisplatin, and sunitinib (S) in patients with advanced urothelial carcinoma (UC). Journal of Clinical Oncology: Official Journal of the American Society of Clinical Oncology (2012) ;30: (suppl 5), abstr282. |
[25] | Ecke TH , Bartel P , Koch S , Ruttloff J , Theissig F . Chemotherapy with gemcitabine, paclitaxel, and cisplatin in the treatment of patients with advanced transitional cell carcinoma of the urothelium. Oncology Reports (2006) ;16: (6):1381–8. |
[26] | Krege SRF , vom Dorp P , Albers P , De Geeter P , Klotz T . Gemcitabine and cisplatin with or without sorafenib in urothelial carcinoma (AUO-AB 31/05). Journal of Clinical Oncology: Journal of the American Society of Clinical Oncology. (2010) ;15s: , 2010 (suppl; abstr 4574). |
[27] | Lin CC , Hsu CH , Huang CY , Cheng AL , Chen J , Vogelzang NJ , et al. Weekly cisplatin plus infusional high-dose 5-fluorouracil and leucovorin (P-HDFL) for metastatic urothelial carcinoma: An effective regimen with low toxicity. Cancer (2006) ;106: (6):1269–75. |
[28] | Lin CC , Hsu CH , Huang CY , Cheng AL , Vogelzang NJ , Pu YS . Phase II trial of weekly paclitaxel, cisplatin plus infusional high dose 5-fluorouracil and leucovorin for metastatic urothelial carcinoma. The Journal of Urology (2007) ;177: (1):84–9; discussion 9. |
[29] | Bamias A , Aravantinos G , Deliveliotis C , Bafaloukos D , Kalofonos C , Xiros N , et al. Docetaxel and cisplatin with granulocyte colony-stimulating factor (G-CSF) versus MVAC with G-CSF in advanced urothelial carcinoma: A multicenter, randomized, phase III study from the Hellenic Cooperative Oncology Group. Journal of Clinical Oncology: Official Journal of the American Society of Clinical Oncology (2004) ;22: (2):220–8. |
[30] | Bamias AKA , Lampaki S , Aravantinos G , Xanthakis I , Papandreou C , Lainakis G , Zagouri F , Soupos N , Kostouros E , Samantas E , Hatzimouratidis C , Konstantinidis C , Deliveliotis C , Pectasides DG , Fountzilas G , Dimopoulos MA . Prospective, randomized phase III study comparing two intensified regimens (methotrexate/vinblastine/doxorubicin hydrochloride/cisplatin [MVAC] versus gemcitabine/cisplatin) in patients with inoperable or recurrent urothelial cancer. Journal of Clinical Oncology: Official Journal of the American Society of Clinical Oncology. (2011) ;29: :2011 (suppl; abstr 4510). |
Figures and Tables
Fig.1
Kaplan-Meier curves: Overall Survival and Progression-Free Survival across BMI and BSA Categories.
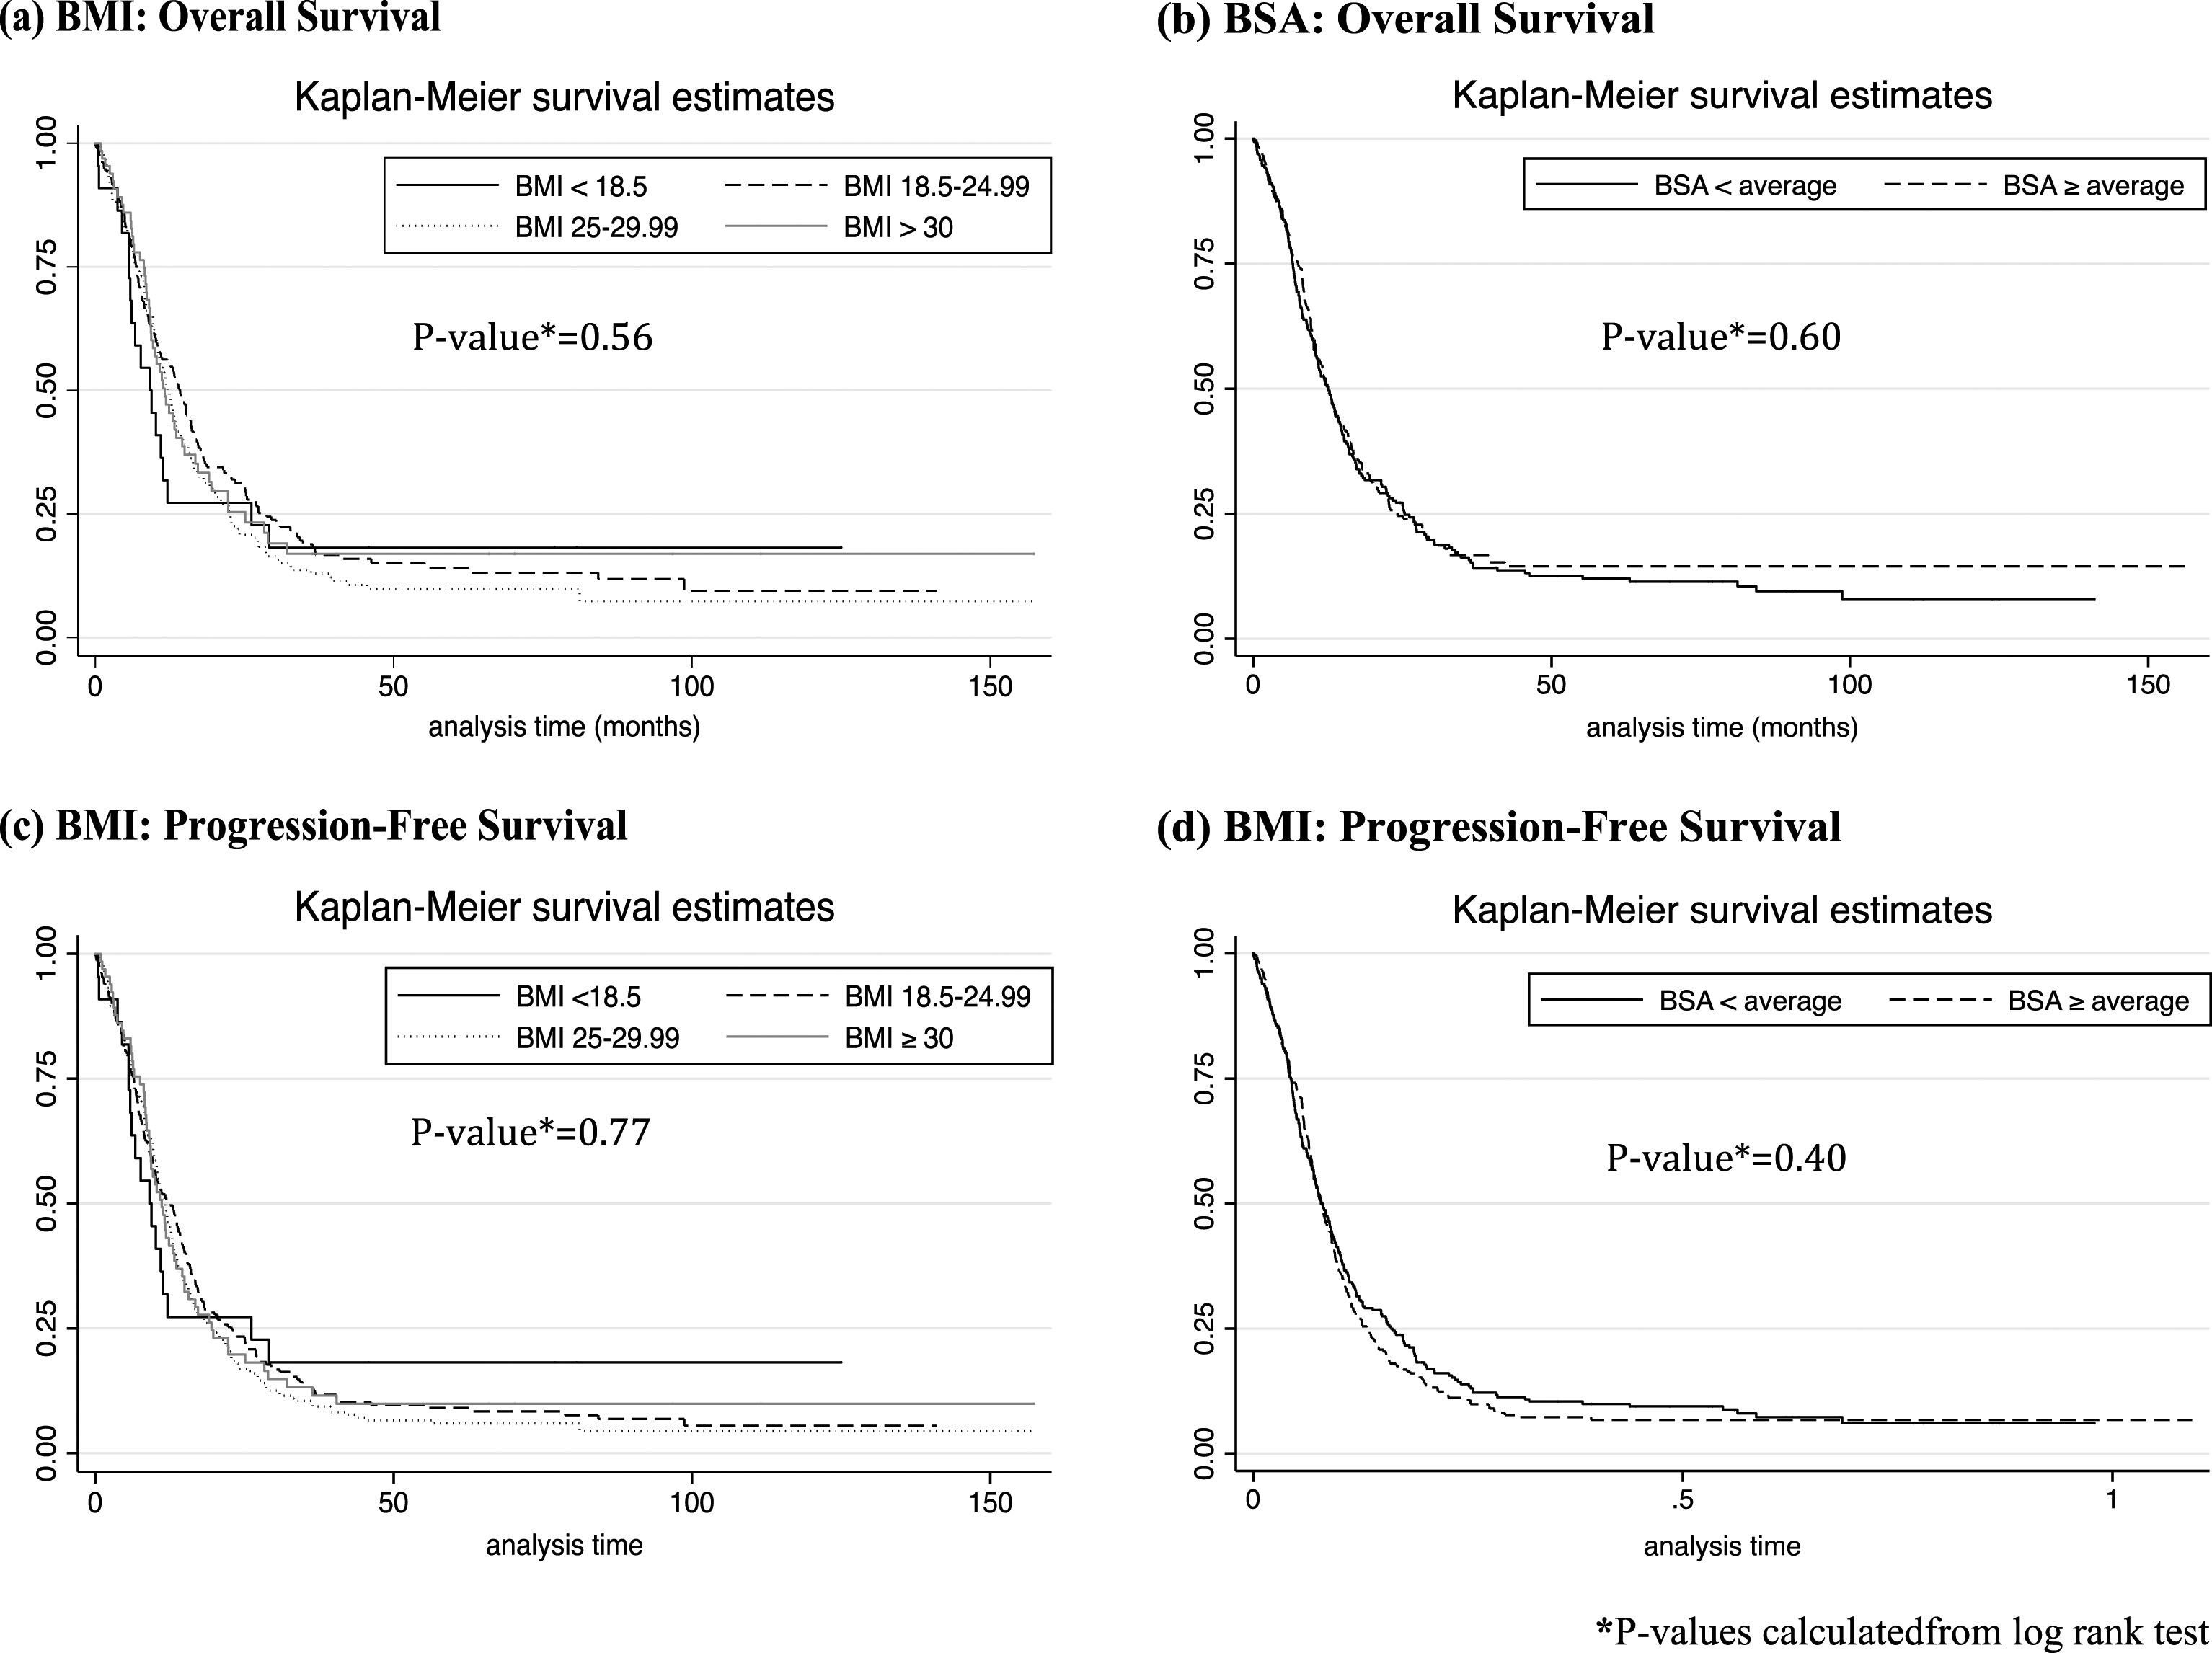
Table 1
Metastatic Urothelial Cancer Trials Included in Analysis*
| Reference | Year | Phase | Country | Regimen | Prior Perioperative Chemotherapy | Toxicity Assessment Criteria | Response Assessment Criteria |
| Hahn et al. [23] | 2011 | II | United States | GC+Bevacizumab | Yes | NCI CTC v3 | RECIST v1 |
| Galsky et al. [24] | 2012 | II | United States | GC+Sunitinib | Yes | NCI CTC v3 | RECIST v1 |
| Ecke et al. [25] | 2006 | II | Germany | GC+Paclitaxel | No | WHO | WHO |
| Krege et al. [26] | 2010 | II | Germany | GC+/- Sorafenib | No | NCI CTC v3 | RECIST v1 |
| Lin et al. [27] | 2006 | II | Taiwan | Cisplatin+5FU | No | WHO | WHO |
| Lin et al. [28] | 2007 | II | Taiwan | Cisplatin+5FU+Paclitaxel | No | NCI CTC v3 | WHO |
| Bamias et al. [29] | 2004 | III | Greece | MVAC vs. Docetaxel+Cisplatin | Yes | NCI CTC | WHO |
| Bamias et al. [30] | 2011 | III | Greece | ddMVAC vs. ddGC | Yes | NCI CTC v3 | RECIST v1 |
*Table adapted from Haines et al., a publication using the same dataset [13]. GC, gemcitabine+cisplatin; 5FU, 5-Florouracil; MVAC, methotrexate, vinblastine, doxorubicin, cisplatin; dd, dose-dense; NCI CTC, National Cancer Institute Common Toxicity Criteria; RECIST, Response Evaluation in Solid Tumors; WHO, World Health Organization.
Table 2
Baseline Patient Characteristics
| BMI | BSA | |||||||
| <18.5 | 18.5–24.99 | 25–29.99 | >30 | P-value* | <average | ≥average | P-value* | |
| Total (n, %) | 22 (4.1%) | 230 (42.8%) | 220 (41.0%) | 65 (12.1%) | 262 (48.9%) | 275 (51.2%) | ||
| Age, median (range) | 70.4 (46–88.9) | 66.0 (34–83.4) | 66 (32–90.3) | 65 (35–81.7) | 0.30 | 67 (34–89) | 65 (32–90) | <0.01 |
| Gender | 0.24 | |||||||
| Male | 13 (59.1%) | 181 (78.7%) | 191 (86.8%) | 52 (80%) | 0.01 | 208 (79.4%) | 229 (83.3%) | |
| Female | 9 (40.9%) | 49 (21.3%) | 29 (13.2%) | 13 (20%) | 54 (20.6%) | 46 (16.7%) | ||
| ECOG, PS (n, %) | <0.01 | <0.01 | ||||||
| 0 | 1 (4.6%) | 89 (39.2%) | 99 (45%) | 25 (38.5%) | 82 (31.5%) | 132 (48.8%) | ||
| 1 | 10 (45.4%) | 99 (43.6%) | 99 (45%) | 36 (55.4%) | 125 (48.1%) | 119 (43.4%) | ||
| 2 | 11 (50%) | 39 (17.2%) | 22 (10%) | 4 (6.2%) | 53 (20.4%) | 23 (8.4%) | ||
| Unknown | 0 | 3 | 0 | 0 | 2 | 1 | ||
| Disease sites | ||||||||
| Lymph nodes | 13 (59.1%) | 171 (74.4%) | 173 (79%) | 56 (87.5%) | 0.02 | 198 (75.6%) | 215 (78.6%) | 0.38 |
| Bone | 7 (31.8%) | 56 (24.4%) | 40 (18.3%) | 7 (10.96%) | 0.04 | 64 (23.3%) | 39 (17.0%) | 0.03 |
| Lung | 8 (36.4%) | 60 (26.1%) | 61 (27.9%) | 12 (18.8%) | 0.34 | 70 (26.7%) | 71 (26.0%) | 0.85 |
| Liver | 6 (27.3%) | 38 (16.5%) | 50 (22.8%) | 8 (12.5%) | 0.12 | 53 (20.2%) | 49 (18.0%) | 0.50 |
| Visceral | 13 (59.1%) | 123 (53.5%) | 116 (53.0%) | 26 (40.6%) | 0.26 | 142 (54.2%) | 136 (49.8%) | 0.31 |
| Unknown | 0 | 0 | 1 | 1 | 0 | 2 | ||
| CrCl, Median (range) | 43 (21–132) | 61 (22–123) | 73(38–198) | 80(39–243) | <0.01 | 59 (21–199) | 76 (27–243) | <0.01 |
| Primary tumor site (n, %) | 0.03 | 0.30 | ||||||
| Bladder and urethra | 13 (59.1%) | 172 (74.8%) | 183(83.2 %) | 51 (78.5%) | 199 (76.0%) | 220 (80.0%) | ||
| Upper tract | 9 (40.9%) | 58 (25.2%) | 37 (16.8%) | 14 (21.6%) | 63 (24.1%) | 55 (20.0%) | ||
| Unknown | 0 | 0 | 0 | 1 | 0 | 1 | ||
| Prior Perioperative Chemo | 1 (4.6%) | 12 (5.22%) | 12 (5.45%) | 13 (20.3%) | <0.01 | 12 (4.6%) | 26 (9.5%) | 0.03 |
| Unknown | 0 | 0 | 0 | 1 | 0 | 1 | ||
| Surgical Interventiona | 11 (50%) | 116 (54.0%) | 112 (53.3%) | 32 (62.8%) | 0.63 | 131 (52.4%) | 140 (56.5%) | 0.36 |
| Unknown | 0 | 15 | 10 | 14 | 15 | 24 | ||
| Country | <0.01 | 262 (48.9%) | 275 (51.2%) | |||||
| Germany | 3 (13.6%) | 50 (21.7%) | 39 (17.7%) | 10 (15.4%) | 67 (34-89) | 65 (32-90) | <0.01 | |
| Greece | 4 (18.2%) | 104 (36.2%) | 140 (63.6%) | 39 (60%) | 162 (53.1%) | 125 (53.9%) | ||
| United States | 0 (0%) | 20 (8.7%) | 34 (15.5%) | 15 (23.1%) | 23 (7.5%) | 46 (19.8%) | ||
| Taiwan | 15 (68.2%) | 56 (24.4%) | 7 (3.2%) | 1 (1.5%) | 74 (24.3%) | 5 (2.2%) | ||
CrCl, Creatinine Clearance; *Kruskal-Wallace for continuous variables; Fisher’s exact test for categorical variables; aPrimary tumor surgical intervention.
Table 3
Chemotherapy Regimen, Cycles, and Adverse Events across BMI and BSA categories
| BMI | BSA | |||||||
| <18.5 | 18.5–24.99 | 25–29.99 | >30 | P-value* | <average | ≥average | P-value* | |
| Total (n, %) | 22 (4.1%) | 230 (42.8%) | 220 (41.0%) | 65 (12.1%) | 262 (48.9%) | 275 (51.2%) | ||
| Chemotherapy Regimen | <0.01 | <0.01 | ||||||
| MVAC-based | 7 (31.8%) | 58 (25.2%) | 44 (20%) | 12 (18.5%) | 72 (27.5%) | 49 (17.8%) | ||
| GC-based | 5 (22.7%) | 112 (48.7%) | 133 (60.5%) | 44 (67.7%) | 115 (43.9%) | 179 (65.1%) | ||
| Other | 10 (45.5%) | 60 (26.1%) | 43 (19.6%) | 9 (13.9%) | 75 (28.6%) | 47 (17.1%) | ||
| VEGF-Targeting Drugb | ||||||||
| Included in Regimen (GC) | 0 (0%) | 20 (8.7%) | 34 (15.5%) | 15 (23%) | <0.01 | 16 (6.1%) | 53 (19.3%) | <0.01 |
| Chemotherapy cycles | ||||||||
| Cycle # (median, range) | 12 (1–16) | 13 (1–17) | 14 (1–17) | 13 (1–17) | 0.28 | 14 (1–17) | 13 (1–17) | 0.28 |
| Adverse Events | ||||||||
| Grade 3-4 Renal Failure | 2 (9.1%) | 9 (3.9%) | 10 (4.6%) | 5 (7.7%) | 0.34 | 8 (3.1%) | 18 (6.6%) | 0.06 |
| Grade 3-4 Neutropenia | 5 (22.7%) | 49 (21.3%) | 65 (29.6%) | 15 (23.1%) | 0.23 | 67 (25.6%) | 67 (24.4%) | 0.75 |
| Febrile Neutropenia | 2 (9.1%) | 10 (4.4%) | 15 (6.4%) | 7 (10.8%) | 0.18 | 16 (6.1%) | 17 (6.2%) | 0.97 |
| Grade 3-4 Thrombocytopenia | 4 (18.2%) | 22 (9.6%) | 30 (13.6%) | 6 (9.2%) | 0.35 | 34 (11.5%) | 28 (11.6%) | 0.95 |
| Embolic Events | 0 | 8 (3.5%) | 10 (4.6%) | 5 (7.9%) | 0.38 | 7 (2.7%) | 16 (5.9%) | 0.07 |
*Kruskal-Wallace for continuous variables; Fisher’s exact test for categorical variables, aMVAC- methotrexate, vinblastine, doxorubicin, and cisplatin; GC- Gemcitabine-cisplatin.
Table 4
Response Rate and Survival Across BMI and BSA Categories
| BMI | BSA | |||||||
| <18.5 | 18.5–24.99 | 25–29.99 | >30 | P-value* | <average | ≥average | P-value* | |
| Objective Response | ||||||||
| Complete Response (CR) | 2 (9.1%) | 38 (16.6%) | 31 (39.7%) | 7 (10.9%) | 0.67 | 41 (15.7%) | 37 (13.6%) | 0.48 |
| Partial Response (PR) | 8 (36.4%) | 77 (33.6%) | 78 (35.6%) | 14.2 (42.2%) | 0.65 | 92 (35.3%) | 98 (35.9%) | 0.88 |
| CR+PR | 10 (45.5%) | 115 (50.2%) | 109 (50.0%) | 34 (53.1%) | 0.93 | 133 (51.0%) | 135 (49.5%) | 0.73 |
| Survival | ||||||||
| Median survival, months (95% CI) | 9.1 (6.8–12.1) | 14.2 (11,0–16.0) | 12,1 (10.8–13.4) | 11.6 (9.4–15.0) | 12.5 (10.7–14.2) | 12.4 (10.8–14.3) | ||
| 1-year survival (%) (95% CI) | 31.8 (14.2–51.1) | 49.6 (43.0–55.8) | 47.3 (40.6–53.7) | 43.1 (30.9–54.6) | 48.1 (41.9–53.4) | 46.2 (40.2–52.0) | ||
| 2-year survival (%) (95% CI) | 27.3 (11.1–46.4) | 20.9 (15.9–26.3) | 16.4 (11.8–21.6) | 19 (10.2–28.7) | 22.1 (17.3–27.3) | 16.0 (12.0–20.6) | ||
*Fisher’s exact test; CI, confidence interval.
Table 5
Hazard Ratios for Mortality according to BMI and BSA and Poor Prognostic Factors
| Overall Survival | Progression-Free Surviva | |||||
| Variable | Hazard Ratio* | 95% CI | P-value | Hazard Ratio* | 95% CI | P-value |
| BMI | ||||||
| <18.5R | ||||||
| 18.5–24.99 | 0.97 | 0.59–1.59 | 0.90 | 1.14 | 0.70–1.85 | 0.60 |
| 25–29.99 | 1.19 | 0.73–1.95 | 0.49 | 1.31 | 0.80–2.13 | 0.28 |
| ≥30 | 1.08 | 0.63–1.87 | 0.78 | 1.23 | 0.72–2.11 | 0.44 |
| Visceral metastases | 1.54 | 1.26–1.88 | <0.01 | 1.44 | 1.20–1.73 | <0.01 |
| ECOG ≥1 | 1.35 | 1.10–1.65 | <0.01 | 1.22 | 1.01–1.47 | 0.04 |
| BSA | ||||||
| ≥Average | 0.97 | 0.80–1.19 | 0.80 | 1.04 | 0.87–1.26 | 0.72 |
| Visceral metastases | 1.52 | 1.25–1.86 | <0.01 | 1.33 | 1.09–1.64 | <0.01 |
| ECOG ≥1 | 1.31 | 1.08–1.62 | <0.01 | 1.20 | 1.26–1.86 | <0.01 |
*Approximated from Cox proportional hazard regression model; RReference category; CI, confidence interval.


