
The Prognostic Value of Cell Cycle Gene Expression Signatures in Muscle Invasive, High-Grade Bladder Cancer
Abstract
Background:
Approximately half of patients with muscle invasive bladder cancer succumb to their disease. Previous work identified cell cycle related genes as a prognostic class of gene expression biomarkers in bladder cancer and found a specific 31-gene cell cycle proliferation (CCP) signature predicted outcome across multiple bladder cancer cohorts. However, the prognostic value of the CCP signature specifically in muscle invasive tumors was not evaluated.
Objective:
To determine the prognostic value of cycle related genes in patients with muscle invasive bladder cancers.
Method:
We collected all publicly available gene expression data for patients with high-grade, muscle invasive bladder cancer (8 cohorts, N = 458). We evaluated the CCP signature and two larger cell cycle gene sets: 1826 genes with a Gene Ontology (GO) annotation of “cell cycle” (GO-CCS) and 124 genes belonging to the “cell cycle” pathway in the KEGG pathway database (KEGG-CCS). An independently derived a sex identification gene signature (SIS) was developed as a positive control.
Results:
While SIS distinguished males from females in all cohorts with information about patient sex, the CCP signature was not prognostic in any of the cohorts we analyzed, and the GO-CCS and KEGG-CCS were never prognostic in more than 2 independent cohorts. Furthermore, neither the CCP, GO-CCS, nor KEGG-CCS signatures were consistently enriched in prognostic genes while SIS was enriched with genes associated with sex in all cohorts.
Conclusions:
Our findings suggest that cell cycle related genes have limited prognostic value in patients with high-grade, muscle invasive tumors. Their usefulness in predicting progression of noninvasive disease and patient response to chemotherapy remains to be determined.
INTRODUCTION
Bladder cancer is the ninth most common cancer in the world [1] and the fourth most common cancer in males in the United States [2]. For the 20–30% of patients that present with muscle invasive (T2–T4) tumors, approximately 57% experience recurrence within five years and the majority of these patients succumb to their disease [3]. The ability to predict which patients will succumb to their disease would allow clinicians to select patients most likely to benefit from adjuvant therapy while the identification of prognostic biomarkers could suggest possible targets for personalized treatment. For example, targeting overexpressed genes may lead to more efficacious treatment, as is the case for breast cancer patients who overexpress Her-2/Neu and who are treated by the monoclonal antibody trastuzamab [4]. Currently there are no prognostic biomarkers for bladder cancer in routine clinical use.
Several studies have identified bladder cancer subtypes in patients with muscle invasive tumors. Using unsupervised clustering, Choi and colleagues identified basal and luminal subtypes that were associated with poor and good outcomes, respectively, and a p53-like subtype that was associated with increased resistance to chemotherapy [5]. Concurrently, Damrauer and colleagues also identified basal and luminal subtypes from high-grade, muscle invasive tumors and these subtypes were associated with outcome [6]. A separate analysis identified subtypes of high-grade, muscle invasive tumors, based on an integrated analysis of mRNA, miRNA, and protein data. These subtypes included papillary and basal/squamous subtypes. These authors carried out an integrated analysis of the mutation and copy-number data from 131 high-grade, muscle invasive bladder tumors found that cell cycle genes were altered in 93% of patients [7].
Cell cycle gene expression biomarkers are associated with outcome in a variety of cancers, including breast, prostate, and melanoma [8–10]. We have previously analyzed gene expression profiles from five bladder cancer patient cohorts (N = 840) and found that cell cycle genes were the only class of genes that consistently predicted outcome across multiple patient cohorts. Furthermore, we evaluated a specific cell cycle proliferation (CCP) signature and found that high CCP scores were associated with poor outcome in all five bladder cancer patient cohorts we analyzed. However, these cohorts all included patients with both muscle invasive and non-muscle invasive (Ta-T1) tumors [11].
The purpose of this study is to evaluate the prognostic value of the CCP signature and cell cycle related genes more broadly in patients with high-grade, muscle invasive tumors. We first demonstrate that the CCP signature is prognostic in cohorts containing low-grade, non-muscle invasive and high-grade muscle invasive tumors, before focusing specifically on patients with high-grade, muscle invasive tumors. As a putative “positive control”, we apply the same methodology to the classification of males and females in the same independent cohorts where sex information is available.
MATERIALS AND METHODS
Patient cohorts and selection criteria
We have collected all published publicly available bladder cancer gene expression data for patients with high-grade, muscle invasive tumors having clinical outcome information (OS, DSS, or RFS). High-grade tumors were either classified as “high grade” according to the low vs. high grade classification system or classified as grade 3. With the exception of our power analysis (see below), patients were included only if they had high-grade, muscle invasive tumors, did not receive chemotherapy, and had radical cystectomy as definitive treatment. We identified eight patient cohorts (Table 1, N = 458), consisting of 44 patients profiled by Blaveri and colleagues (Blaveri cohort) [12], 28 patients from Chungbuk National University Hospital (CNUH cohort) [13], 78 patients analyzed by Reister and colleagues (Reister cohort) [14], 32 patients profiled by Lindgren and colleagues [15], 22 patients profiled by Choi and colleages (Choi cohort) [5], 60 patients from the Memorial Sloan Kettering Cancer Center (MSKCC cohort) [16], 47 additional patients from the Memorial Sloan Kettering Cancer Center with profiles available on the cBioPortal (MSKCC-CBIO cohort) [17], and 147 patients profiled as part of The Cancer Genome Atlas project (TCGA cohort), a subset of whom were described previously [7]. Because there was no single endpoint common to all cohorts, we selected the endpoint as follows: DSS was always used if available (3 cohorts); otherwise, OS was used if available (3 cohorts); if neither DSS nor OS were available, we used RFS as the endpoint (2 cohorts). These endpoints are listed in Table 1.
Gene expression datasets
The sex identification signature was identified from a cohort of 80 patients profiled at l’Hôpital de l’Hôtel-Dieu at Laval University [18]. All other gene expression data used in this analysis are publicly available from the Gene Expression Omnibus [19], the Cancer Genome Atlas, the cBioPortal [20], or as supplementary material to publication (Table 1). Gene expression profiles were measured at the mRNA level using either Affymetrix microarrays (MSKCC and Reister), Illumina expression beadchip arrays (Choi, CNUH, and MSKCC-CBIO), non-commercial or customized arrays (Blaveri and Lindgren), or RNA-seq (TCGA). The specific platforms are listed in Supplementary Table S1. For all cohorts, processed data was downloaded and analyzed. In the Blaveri cohort, genes with missing values in >20% of samples were removed and expression values imputed using the impute package (impute.knn function) in R with default parameters. In the TCGA and Choi cohorts, low quality genes with an interquartile range of 0 were removed prior to analysis. Microarray probes were matched to genes based on current Affymetrix or Illumina annotation. When multiple probes were present for a gene, the probe with the highest mean expression was used [21].
Signature score calculation
CCP and additional signature scores were calculated by first normalizing each gene to have a mean of 0 and standard deviation of 1 across all samples within each cohort. Unweighted scores were calculated by taking the average normalized expression of all signature genes. Weighted scores were calculated by assigning a weight to each gene: a weight of +1 is assigned if the expression of the gene is either negatively associated with outcome (HR >1) or up-regulated in males (AUC >0.5); otherwise a weight of −1 is assigned. The weighted score is the weighted average expression of signature genes. For all analyses, continuous signature score is evaluated.
Power analysis
The selection criteria described above expanded to also include patients with low-grade, non-muscle invasive tumors. For this analysis, a cohort was analyzed if it had at least 10 patients with low-grade, non-muscle invasive tumors and at least 10 patients with high-grade, muscle invasive tumors. This expanded the Blaveri, CNUH, and MSKCC cohorts, yielding new control cohorts with 57, 114, and 72 patients, respectively. For a given cohort, let n1 = the number of patients in a cohort with low-grade, non-muscle invasive tumors and n2 = the number of patients in a cohort with high-grade, muscle invasive tumors. Let n = the number of patients to randomly select, s1 = min(n1, n/2) and s2 = min(n2, n/2). Then randomly select patients s1 with low-grade, non-muscle invasive tumors and s2 patients with high-grade, muscle invasive tumors. Then if s1 + s2 < n, randomly select n– (s1 + s2) additional patients. This approach maintains a balance between patients with low-grade, non muscle invasive tumors and high-grade, muscle invasive tumors. For each cohort n patients are randomly selected and the prognostic value of CCP score analyzed. This process is repeated 1000 times and the power for a sample of size n is estimated as the proportion of times CCP score was negatively and significantly (HR >1, P < 0.05) associated with outcome in the given cohort.
Statistical analyses
For sex identification, accuracy was quantified by the area under the receiver operating characteristic curve (AUC) with males coded as 1 and females coded as 0, and P-values calculated by the Wilcoxon Rank Sum Test. The AUC is equivalent to classification accuracy (number of patients correctly classified/total number of patients) when the number of male and number of female patients are the same.
For survival analyses, cox proportional hazard models were used to calculate hazard ratios (HR) for a clinical variable or based on the continuous expression of a gene. Significance of clinical variables was assessed by logrank P-value or Wald P-value. Statistical significance for genes and gene signatures was assessed by logrank P-value or 95% confidence interval of the HR.
We evaluated whether a list of genes was enriched with predictive genes by calculating an enrichment score, given by
We evaluated whether a list of genes was enriched with genes associated with biological processes by using the Database for Visualization and Annotated Discovery (DAVID) [22], which identifies Gene Ontology (GO) [23] terms and KEGG pathways [24] overrepresented in lists of genes. Enrichment was evaluated at the probe level.
RESULTS
Patient cohorts and common clinical predictors of survival
We analyzed all publicly available cohorts that had patients with high-grade, muscle invasive tumors and patient outcome information (8 cohorts, N = 458). Patient cohorts have similar age and gender distributions, but differ with respect to stage (T2, T3, T4), nodal status (pN0, pN1-N3), and metastases status (M0, M1) (Table 1). However, stage, nodal status and metastases status were consistently associated with outcome, consistent with previous studies [3]. Specifically, stage was significantly associated with outcome in 6 out of 8 cohorts with stage information, while nodal status was predictive of outcome in 4 out of 8 cohorts. Metastases status was predictive in all cohorts where this information was available (Table 2 and Supplementary Figures S1–S3). These results suggest that performance of prognostic signatures can be fairly compared across these cohorts using the specified endpoints, since patients share common clinicopathological predictors of outcome. We expect that gene signatures or processes that capture this common tumor pathology will be predictive across multiple cohorts, though not necessarily all of them. We note that grade was not considered in this analysis because either all patients had the same grade within each cohort, or the specific high-grade designation (grade 3-4) was not available.
The prognostic value of a cell cycle proliferation signature in bladder cancer patients with high-grade, muscle invasive tumors
We have previously found that a continuous cell cycle proliferation (CCP) score, calculated as the average unweighted, normalized expression of 31 genes (see Methods), was significantly predictive of outcome in five bladder cancer patient cohorts [11]. However, these cohorts included patients with both low- and high-grade tumors, and non-muscle and muscle invasive tumors. Our first objective is to evaluate the prognostic value of CCP score in bladder cancer patients with high-grade, muscle invasive tumors.
A power analysis was performed in order to estimate whether or not each of our eight cohorts had sufficient sample size for prognostic gene expression signature evaluation, under the assumption that CCP score is independent of stage and grade. The Blaveri, CNUH, and MSKCC cohorts were expanded to include patients with low-grade, non-muscle invasive tumors. For each cohort 20 patients were randomly selected as described in Methods. The prognostic value of CCP score was then evaluated and this process repeated 1000 times each for sample sizes ranging from 20 to 147 in order to estimate the power that the CCP signature would significantly (P < 0.05) and negatively (HR > 1) associate with outcome, which was plotted as a function of sample size (Fig. 1A). We were able to obtain power estimates for Blaveri, CNUH, and MSKCC, and these ranged from approximately 80% for CNUH (N = 28) to 90% for MSKCC (N = 60) (Fig. 1A). It is clear that the study is sufficiently powered for Reister and TCGA (100% power), while we estimate the power to be at least 75% for MSKCC-BIO. Our study is likely underpowered, however, for the Choi cohort (N = 22). This analysis is an important positive control and suggests that for the majority of cohorts in Table 1, CCP score will be negatively associated (P < 0.05) with outcome if its prognostic value was independent of stage and grade.
An additional positive control was also used. We identified a new “sex identification signature” (SIS) from a cohort of 80 bladder cancer patients with high-grade, muscle invasive tumors [18]. This cohort is not analyzed further because all patients were treated with adjuvant chemotherapy. The signature consists of nine genes that are up-regulated in males (Supplementary Table S2, FDR <10% ).
The rest of the manuscript considers only patients with high-grade, muscle invasive tumors. We calculated SIS and CCP scores by finding the mean expression of all normalized signature genes. SIS scores accurately separated males from females in all six cohorts that had demographic information on patient sex (AUC >0.87, P < 0.05 in each cohort, Fig 1B). This “positive control” shows that the score from an independently derived signature, calculated as the average expression value of the signature genes, has predictive ability in the patient cohorts analyzed here. However, when we evaluated the prognostic value of CCP score in these patients, there were no cohorts for which CCP score was significantly associated with outcome (Fig. 1C).
The above calculation of CCP score assumes that each CCP gene is negatively associated with outcome. This is a reasonable assumption, since CCP genes are positively correlated with one another and this CCP score is negatively associated with outcome in prostate cancer and in bladder cancer patients when patients with low-grade and non-muscle invasive tumors are included [8, 11, 25]. However, to account for the possibility that a signature gene might be positively associated with outcome, we also analyzed the weighted average expression of all signature genes, using a training cohort to assign weights of+1 or −1 to each gene depending on whether or not the gene was negatively (HR >1) or positively (HR <1) associated with outcome, respectively. We selected one cohort as a training cohort and evaluated the weighted CCP score in the remaining testing cohorts, and this analysis was repeated with each cohort as the training cohort. In this analysis, weighted CCP score was also not significantly (P < 0.05) prognostic in any testing cohort (Fig. 2). These results indicate that the original and weighted CCP scores are not prognostic in patients with high-grade, muscle invasivetumors.
The prognostic value of cell cycle gene sets in bladder cancer patients with high-grade, muscle invasive tumors
We next looked at cell cycle-related genes more broadly, rather than focusing specifically on the 31-gene CCP signature. Two cell cycle gene sets were analyzed. We identified all genes from the Gene Ontology (GO) database annotated with the biological process “cell cycle” (GO:0007049). In this database, “cell cycle” encompasses all biological processes (e.g., mitotic cell cycle, nuclear DNA replication) associated with cell division, and the set includes 1826 unique genes. The second set consists of the 124 genes belonging to the “cell cycle” pathway in the KEGG pathway database (hsa04110). We will refer to these GO and KEGG cell cycle gene signatures as GO-CCS and KEGG-CCS, respectively.
For each cell cycle signature, we calculated a weighted signature score using the method described above. One cohort was selected as the training cohort, and the remaining cohorts were used for testing. This was repeated with each cohort as the training cohort. Only one training cohort (Lindgren) yielded significantly prognostic (P < 0.05) GO-CCS scores in any testing cohorts, while the remaining 6 training cohorts did not produce prognostic GO-CCS scores in any testing cohorts (Fig. 3). For KEGG-CCS, no training cohort yielded significantly prognostic scores in more than one testing cohort (Fig. 4). In contrast, the SIS “positive control” produced weighted scores that significantly (P < 0.05) distinguished males from females in all testing cohorts regardless of which training cohort was used (Supplementary Figure S4). This latter finding demonstrates that a robust predictive signature will not be sensitive to the training cohort used. Overall, these results suggest that the expression of cell cycle associated genes have limited prognostic value in patients with high-grade, muscle invasive tumors.
Cell cycle gene lists are not enriched in genes predictive of outcome in high-grade, muscle invasive bladder cancers
Arguably, a prognostic gene signature should contain genes that are themselves individually prognostic. Enrichment analysis assesses whether or not a gene signature contains more significantly prognostic (P < 0.05) genes than what would be expected by chance. Such an analysis can be thought of as an unbiased way of assessing the prognostic value of a gene signature, since the enrichment (or lack thereof) does not depend on factors such as the specific mathematical model or gene weighting used to produce a signature score, the choice of gene normalization, or the choice of training cohort, which all can effect the performance of a gene signature.
We quantified the enrichment of the CCP, GO-CCS, and KEGG-CCS gene lists for genes that were significantly associated with outcome. For each cohort and each gene list, we calculated an enrichment score, which quantifies how much more likely the signature is to contain a prognostic gene (P < 0.05) than the set of all genes profiled for that cohort (see Methods for details). For example, an enrichment score of 2 indicates that the gene signature contains twice as many significantly prognostic genes than the set of all genes profiled. P-values assess whether an enrichment score is significantly greater than 1 (i.e., whether a signature is significantly enriched). We note that in our analysis of CCP, GO-CCS, and KEGG-CCS, we place no constraints on whether a gene is positively or negatively associated with outcome, so that a gene that is positively associated with outcome in one cohort can be negatively associated with outcome in another (or vice-versa). This is a conservative approach that may overestimate the true enrichment of a gene list, but simplifies the analysis since we do not know a priori whether a signature gene is positively or negatively associated with outcome. Because all SIS signature genes are up-regulated in males, however, we require that a SIS signature gene be up-regulated in males when we calculate its enrichment score.
SIS, the positive control, is significantly enriched with genes that are up-regulated in males in all cohorts (P < 0.05), with a mean enrichment score of 22.3 (range 7.8–63.5, Fig. 5A). However, neither the CCP nor KEGG-CCS lists were significantly enriched with prognostic genes, while GO-CCS was significantly enriched with prognostic genes in only one cohort (Fig. 5B). The highest enrichment score corresponded to the CCP signature in the Lindgren cohort (score = 2.11), but this was not statistically significant (P = 0.385), partially because only 1 out of the 11 CCP genes that were profiled was significantly prognostic. A lack of consistent enrichment in the cell cycle related gene lists for significantly prognostic genes provides strong evidence that, as a class, cell cycle associated genes are not prognostic in bladder cancer patients with high-grade, muscle invasive tumors, based on their gene expression.
Is there a functional class of genes that consistently predict outcome in bladder cancer patients with high grade, muscle invasive tumors?
A previous validation study found that bladder cancer survival signatures identified from gene expression profiling studies performed no better than chance when applied to independent cohorts containing patients with both superficial and invasive tumors [26]. However, a robust prognostic signature was later identified following the observation that cell-cycle related genes were the only class of genes consistently predictive of outcome in bladder cancer patients [11]. We therefore used an identical approach and investigated whether a class of consistently prognostic genes could be found for patients with high grade, muscle invasive tumors. The identification of a common biological process could guide the development of a consistently prognostic signature containing genes related to that process.
In each cohort, we identified all genes that were significantly associated with outcome (P < 0.01). We then identified GO terms and KEGG pathways that were over-represented in each list of prognostic genes, and compared these across the cohorts. We note that this analysis was identical to the enrichment analysis used previously that found that cell cycle related processes such as “cell cycle process", as defined by GO, were the only processes consistently associated with outcome in bladder cancer patient cohorts that included patients with both low-grade, non-muscle invasive and high-grade, muscle invasive tumors [11].
Figure 6 shows the results from the gene set enrichment analysis across the 8 bladder cancer patient cohorts in our study, with all patients having muscle-invasive, high-grade tumors. The top 10 GO terms and KEGG pathways are shown. The most consistently prognostic class of genes were defined by the GO term “programmed cell death”, which was associated with outcome in 3/8 cohorts (FDR <20% ). Several other GO terms (such as “cell adhesion”) were associated with outcome in 2 cohorts. Only one KEGG pathway (“allograft rejection”) was associated with outcome in more than one cohort. For the complete set of results, see Supplementary Table S3. These results indicate that there is no single class of genes whose expression is consistently associated with outcome in bladder cancer patients with muscle-invasive, high-grade tumors.
DISCUSSION
We evaluated several cell cycle related gene signatures in bladder cancer patients with high-grade, muscle invasive tumors and found that these gene signatures had limited prognostic value in these patients. This finding was in contrast to a previous study that found that in patients with both non-muscle invasive and muscle invasive tumors, cell biomarkers robustly predict outcome in bladder cancer patients. Specifically, in a multivariate analysis of patients that included stage (muscle invasive vs. non-muscle invasive) and grade (high-grade vs. low-grade), CCP score outperformed grade and was comparable to stage when evaluated in multiple patient cohorts [11]. Our current work indicates that although cell cycle biomarkers are prognostic across patients with both non-muscle invasive and invasive tumors, these biomarkers are not prognostic in patients with high-grade, muscle invasive tumors. This may be because the prognostic value of cell cycle biomarkers is dependent on their ability to distinguish low-grade, non-muscle invasive tumors from high-grade, muscle-invasive tumors [15]. Furthermore, if nearly all high-grade, muscle invasive tumors have genomic alterations in cell cycle genes [7], then cellular proliferation may be similar across these tumors and would not distinguish between patients with good and poor prognoses.
There are several technical aspects of our study that must be addressed. First, because patient cohorts were profiled on different platforms, probes for cell cycle genes may not be comparable across platforms. Second, five of the eight cohorts we analyzed have modest sample sizes of less than 50. We addressed these potential limitations in our study through a power analysis (Fig. 1A), which shows directly that CCP score is prognostic in three cohorts (Blaveri, CNUH, MSKCC) when patients with low-grade, non-muscle invasive tumors are included, despite the fact that different platforms were used for gene expression profiling (a custom cDNA array, an Illumina bead array, and an Affymetrix microarray; Supplementary Table S1) in these cohorts. For the sample sizes we analyze (Table 1), the power of our study is at least 80% for each of these three cohorts. Despite this, CCP score was not significantly associated with outcome in any of these three cohorts when only patients with high-grade, muscle invasive tumors were analyzed (Fig. 1C). This result strongly suggests that it is the lack of patients with low-grade, non-muscle invasive tumors that diminishes the prognostic value of CCP score, rather than differences between platforms or sample sizes.
Stage, nodal status, and metastasis status are strongly associated with outcome in bladder cancer [3]. In two cohorts (Choi and MSKCC), however, none of these clinical variables were significantly associated with outcome. These cohorts are clearly not representative of typical patients and therefore the lack of prognostic signatures in these cohorts is not surprising. Nevertheless, although the remaining cohorts differed with respect to stage, nodal status, metastasis status, and endpoints, they did share common clinicopathological predictors of survival. If a signature was associated with outcome because of correlation with one of these predictors, we would expect that signature to predict outcome in all cohorts were that clinicopathological factor was predictive. Therefore, for example, we would expect a signature associated with the metastatic nature of a tumor to predict outcome in Lindgren, CNUH, and Reister, since metastasis status was associated with outcome in these three cohorts (Table 1). However, no signature we analyzed was prognostic in these three cohorts. In fact, no signature we analyzed was prognostic in Reister, despite its relatively large sample size (N = 78). In addition, no signature we analyzed was consistently prognostic across cohorts where either nodal status or stage was associated with outcome. For example, the GO-CCS signature, when trained on Lindgren, was prognostic in CNUH, a cohort where stage, nodal status, and metastasis status were all individually associated with outcome. However, GO-CCS was not prognostic in any other cohort where stage, nodal status, or metastasis status were prognostic.
The primary objective of our study was to determine the prognostic value of CCP score using the same weighting scheme previously found to be prognostic in both bladder and prostate cancer [8, 11, 25]. We also considered a simple weighting scheme with weights of +1 or −1 assigned to each gene, for the CCP, GO-CCS, and KEGG-CCS signatures. Arguably, a more flexible weighting scheme could result in more robust classification. However, the CCP, GO-CCS, and KEGG-CCS gene lists do not contain any more prognostic genes than are expected by chance (Fig. 5B). These results strongly suggest that these signatures would not be consistently prognostic, regardless of the weighting scheme or classification method used.
Our analysis of cell cycle biomarkers were based on their transcription profiles, rather than genomic alterations or protein expression. Mitra et al. reviews immunohistochemical cell cycle biomarkers in bladder cancer and concludes that markers of cell growth receptor signaling, the p53 and retinoblastoma pathways, and cell proliferation (i.e., KI-67) have prognostic value, and that multimarker panels have more prognostic value than individual biomarkers [27]. However, none of the studies referenced within this review explicitly evaluated KI-67 in patients with high-grade, muscle invasive tumors. One study found that KI-67 protein expression significantly associated with outcome in patients with muscle invasive tumors (P = 0.045), but the finding was not significant in a multivariate analysis that included stage and grade [28]. Another study found that KI-67/p27 together were prognostic in muscle invasive cancers in a multivariate analysis [29]. These findings do not contradict our conclusions. However, we note that because mRNA levels explain only about 40% of protein levels [30], investigation of both protein and mRNA biomarkers may yield contradictory results.
Finally, our gene set enrichment analysis was unable to identify any process associated with outcome in the majority (>3) of cohorts, based on GO biological processes and KEGG pathway annotations. This was surprising, since prognostic signatures are often consistently enriched in biological processes despite containing different numbers of genes [31]. Additionally, Mitra and colleagues identified a 15 gene signature with prognostic value independent of stage and grade, and this signature was enriched in GO terms related to WNT and MAPK signaling, focal adhesion, and cancer-related pathways [32]. Previous studies have also found that basal and luminal subtypes of muscle invasive tumors were associated with survival [5, 6]. However, these subtypes are not present in the GO or KEGG pathway database. Nevertheless, our findings suggest that high-grade muscle invasive bladder cancer is a heterogenous disease and that there may be a variety of biological pathways that drive outcome, and that these pathways are independent of clinicopathological variables. The activation or repression of such pathways would define genomic subtypes that are associated with outcome. If this is the case, Fig. 6 provides insight into these potentially prognostic pathways and suggests that “programmed cell death” is altered in one subtype. Interestingly, increased apoptosis is associated with poor outcome in patients with invasive breast cancer [33] while down-regulation of caspase-9, which is required for apoptosis, is associated with poor outcome in patients with stage II colorectal cancer [34].
In summary, we find that cell cycle related biomarkers have limited prognostic value in bladder cancer patients with high-grade, muscle invasive tumors. The prognostic value of cell cycle markers in patients with basal or luminal subtypes and the value of these markers in predicting patient response to chemotherapy remains to be determined.
FINANCIAL SUPPORT
Supported by National Institutes of Health grant CA143971 to DT. GD was supported, in part, by a grant from the American Association of University Professors and Connecticut State University Board of Regents (DANR14).
CONFLICT OF INTEREST
The authors declare no conflict of interest.
REFERENCES
1 | Ferlay J, Soerjomataram I, Dikshit R, Eser S, Mathers C, Rebelo M(2015) Cancer incidence and mortality worldwide: sources, methods and major patterns in GLOBOCAN 2012International Journal of Cancer Journal International du Cancer136: 5E359E386Epub 2014/09/16 |
2 | Siegel R, Naishadham D, Jemal A(2012) Cancer statistics, 2012CA Cancer J Clin62: 11029Epub 2012/01/13 |
3 | Stein JP, Lieskovsky G, Cote R, Groshen S, Feng AC, Boyd S(2001) Radical cystectomy in the treatment of invasive bladder cancer: Long-term results in 1,054 patientsJ Clin Oncol19: 3666675Epub 2001/02/07 |
4 | Vogel CL, Cobleigh MA, Tripathy D, Gutheil JC, Harris LN, Fehrenbacher L(2002) Efficacy and safety of trastuzumab as a single agent in first-line treatment of HER2-overexpressing metastatic breast cancerJ Clin Oncol20: 3719726Epub 2002/02/01 |
5 | Choi W, Porten S, Kim S, Willis D, Plimack ER, Hoffman-Censits J(2014) Identification of distinct basal and luminal subtypes of muscle-invasive bladder cancer with different sensitivities to frontline chemotherapyCancer Cell25: 2152165Epub 2014/02/15 |
6 | Damrauer JS, Hoadley KA, Chism DD, Fan C, Tiganelli CJ, Wobker SE(2014) Intrinsic subtypes of high-grade bladder cancer reflect the hallmarks of breast cancer biologyProceedings of the National Academy of Sciences of the United States of America111: 831103115Epub 2014/02/13 |
7 | (2014) Comprehensive molecular characterization of urothelial bladder carcinomaNature507: 7492315322Epub 2014/01/31 |
8 | Cuzick J, Swanson GP, Fisher G, Brothman AR, Berney DM, Reid JE(2011) Prognostic value of an RNA expression signature derived from cell cycle proliferation genes in patients with prostate cancer: A retrospective studyThe Lancet Oncology12: 3245255Epub 2011/02/12 |
9 | Mosley JD, Keri RA(2008) Cell cycle correlated genes dictate the prognostic power of breast cancer gene listsBMC Medical Genomics1: 11Epub 2008/04/29 |
10 | Piras F, Perra MT, Murtas D, Minerba L, Floris C, Maxia C(2008) Combinations of apoptosis and cell-cycle control biomarkers predict the outcome of human melanomaOncology Reports20: 2271277Epub 2008/07/19 |
11 | Dancik GM, Theodorescu D(2014) Robust prognostic gene expression signatures in bladder cancer and lung adenocarcinoma depend on cell cycle related genesPloS One9: 1e85249Epub 2014/01/28 |
12 | Blaveri E, Simko JP, Korkola JE, Brewer JL, Baehner F, Mehta K(2005) Bladder cancer outcome and subtype classification by gene expressionClinical cancer research: An Official Journal of the American Association for Cancer Research11: 1140444055Epub 2005/06/03 |
13 | Kim WJ, Kim EJ, Kim SK, Kim YJ, Ha YS, Jeong P(2010) Predictive value of progression-related gene classifier in primary non-muscle invasive bladder cancerMolecular Cancer9: 3Epub 2010/01/12 |
14 | Riester M, Taylor JM, Feifer A, Koppie T, Rosenberg JE, Downey RJ(2012) Combination of a novel gene expression signature with a clinical nomogram improves the prediction of survival in high-risk bladder cancerClin Cancer Res18: 513231333Epub 2012/01/10 |
15 | Lindgren D, Frigyesi A, Gudjonsson S, Sjodahl G, Hallden C, Chebil G(2010) Combined gene expression and genomic profiling define two intrinsic molecular subtypes of urothelial carcinoma and gene signatures for molecular grading and outcomeCancer Research70: 934633472Epub 2010/04/22 |
16 | Sanchez-Carbayo M, Socci ND, Lozano J, Saint F, Cordon-Cardo C(2006) Defining molecular profiles of poor outcome in patients with invasive bladder cancer using oligonucleotide microarraysJ Clin Oncol24: 5778789Epub 2006/01/25 |
17 | Iyer G, Al-Ahmadie H, Schultz N, Hanrahan AJ, Ostrovnaya I, Balar AV(2013) Prevalence and co-occurrence of actionable genomic alterations in high-grade bladder cancerJ Clin Oncol31: 2531333140Epub 2013/07/31 |
18 | Smith SC, Baras AS, Dancik G, Ru Y, Ding KF, Moskaluk CA(2011) A 20-gene model for molecular nodal staging of bladder cancer: Development and prospective assessmentThe Lancet Oncology12: 2137143Epub 2011/01/25 |
19 | Barrett T, Troup DB, Wilhite SE, Ledoux P, Evangelista C, Kim IF(2011) NCBI GEO: Archive for functional genomics data sets–10 years onNucleic Acids Research39: Database issueD1005D1010Epub 2010/11/26 |
20 | Gao J, Aksoy BA, Dogrusoz U, Dresdner G, Gross B, Sumer SO(2013) Integrative analysis of complex cancer genomics and clinical profiles using the cBioPortalScience Signaling6: 269pl1Epub 2013/04/04 |
21 | Miller JA, Cai C, Langfelder P, Geschwind DH, Kurian SM, Salomon DR(2011) Strategies for aggregating gene expression data: The collapseRows R functionBMC Bioinformatics12: 322Epub 2011/08/06 |
22 | Huang da W, Sherman BT, Lempicki RA(2009) Systematic and integrative analysis of large gene lists using DAVID bioinformatics resourcesNature Protocols4: 14457Epub 2009/01/10 |
23 | Ashburner M, Ball CA, Blake JA, Botstein D, Butler H, Cherry JM(2000) Gene ontology: Tool for the unification of biology. The Gene Ontology ConsortiumNature Genetics25: 12529Epub 2000/05/10 |
24 | Kanehisa M, Goto S(1999) KEGG: Kyoto encyclopedia of genes and genomesNucleic Acids Research28: 12730Epub 1999/12/11 |
25 | Cuzick J, Berney DM, Fisher G, Mesher D, Moller H, Reid JE(2012) Prognostic value of a cell cycle progression signature for prostate cancer death in a conservatively managed needle biopsy cohortBritish Journal of Cancer106: 610951099Epub 2012/03/01 |
26 | Lauss M, Ringner M, Hoglund M(2010) Prediction of stage, grade, and survival in bladder cancer using genome-wide expression data: A validation studyClinical cancer research: An official Journal of the American Association for Cancer Research16: 1744214433Epub 2010/08/26 |
27 | Mitra AP, Hansel DE, Cote RJ(2012) Prognostic value of cell-cycle regulation biomarkers in bladder cancerSeminars in Oncology39: 5524533Epub 2012/10/09 |
28 | Galmozzi F, Rubagotti A, Romagnoli A, Carmignani G, Perdelli L, Gatteschi B(2006) Prognostic value of cell cycle regulatory proteins in muscle-infiltrating bladder cancerJournal of Cancer Research and Clinical Oncology132: 12757764Epub 2006/06/29 |
29 | Korkolopoulou P, Christodoulou P, Konstantinidou AE, Thomas-Tsagli E, Kapralos P, Davaris P(2000) Cell cycle regulators in bladder cancer: A multivariate survival study with emphasis on p27Kip1Human Pathology31: 6751760Epub 2000/06/29 |
30 | Schwanhausser B, Busse D, Li N, Dittmar G, Schuchhardt J, Wolf J(2011) Global quantification of mammalian gene expression controlNature473: 7347337342Epub 2011/05/20 |
31 | Subramanian A, Tamayo P, Mootha VK, Mukherjee S, Ebert BL, Gillette MA(2005) Gene set enrichment analysis: A knowledge-based approach for interpreting genome-wide expression profilesProceedings of the National Academy of Sciences of the United States of America102: 431554515550Epub 2005/10/04 |
32 | Mitra AP, Lam LL, Ghadessi M, Erho N, Vergara IA, Alshalalfa M(2014) Discovery and validation of novel expression signature for postcystectomy recurrence in high-risk bladder cancerJournal of the National Cancer Institute106: 11dju290Epub 2014/10/26 |
33 | de Jong JS, van Diest PJ, Baak JP(2000) Number of apoptotic cells as a prognostic marker in invasive breast cancerBritish Journal of Cancer82: 2368373Epub 2000/01/26 |
34 | Shen XG, Wang C, Li Y, Wang L, Zhou B, Xu B(2009) Downregulation of caspase-9 is a frequent event in patients with stage II colorectal cancer and correlates with poor clinical outcomeColorectal disease: The official Journal of the Association of Coloproctology of Great Britain and Ireland12: 1212131218Epub 2009/07/17 |
Figures and Tables
Fig.1
Association of gene signature scores with outcome and sex. Signature scores were calculated by finding the average expression of all signature genes. A, power analysis for evaluation of CCP score in the Blaveri, CNUH, and MSKCC cohorts when patients with low-grade, non-muscle invasive tumors were included. For each sample size, the power is estimated as the proportion out of 1000 random samples where CCP score is negatively and significantly (HR >1, P < 0.05) associated with outcome. Vertical dashed lines correspond to the sample sizes of each cohort when limited to patients with high-grade, muscle invasive tumors. B, the ability of the Sex Identification Signature (SIS) score to distinguish males from females in cohorts when limited to patients with high-grade, muscle invasive tumors. Performance is measured by AUC, which is equivalent to the probability that a randomly selected male has a higher SIS score than a randomly selected female. The dashed black line corresponds to the AUC value of an association due to random chance (i.e., AUC = 0.50). A * denotes statistical significance (P < 0.05) of an AUC differing from 0.50 based on the Wilcoxon rank-sum test. C, the prognostic value of CCP score in each cohort. Plots show the log10 HR (filled circle) and 95% confidence interval for each cohort and each signature and a vertical dashed line corresponding to a log10 HR of no association between score and outcome (i.e., a log10 HR of 0).
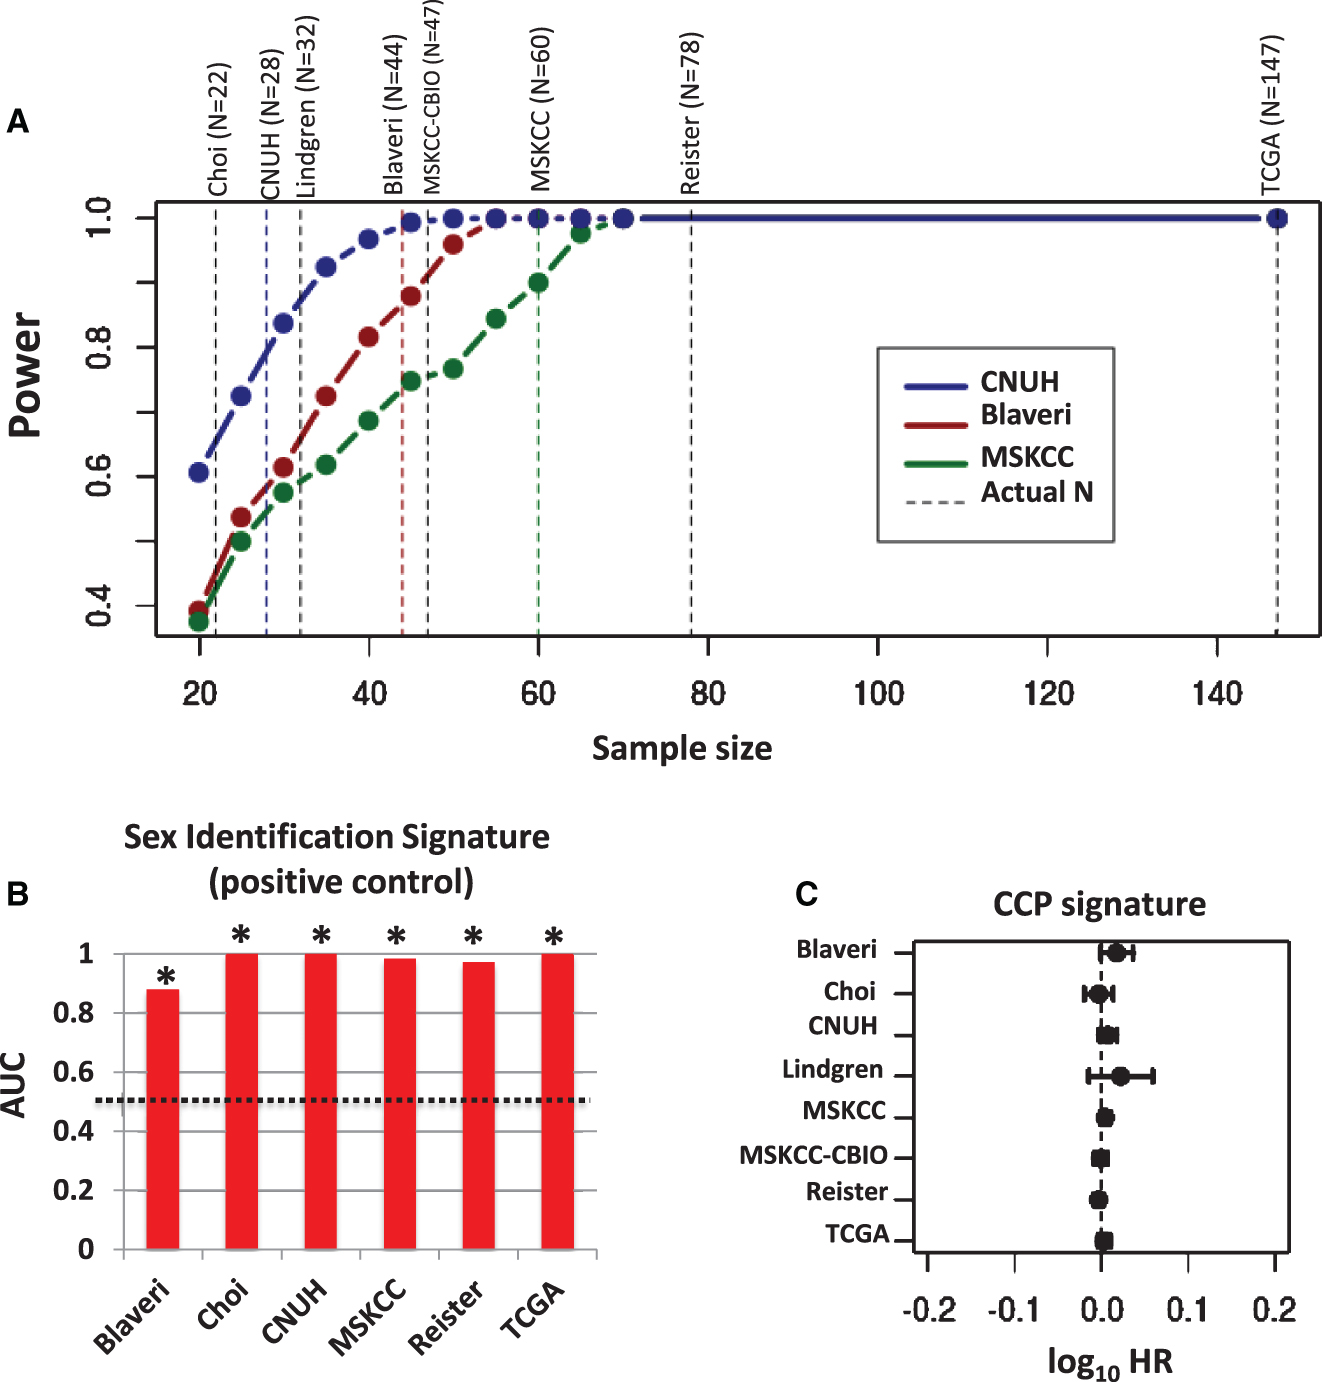
Fig.2
Prognostic value of weighted CCP score. CCP signature genes were weighted by −1 or +1 according to whether the gene was positively or negatively associated with outcome, respectively, in each training cohort (blue lines). A weighted CCP score was then calculated and its prognostic value evaluated in the remaining cohorts (i.e., the testing cohorts). Plots show the log10 HR (filled circle) and 95% confidence interval for each cohort and each signature, with statistically significant results (P < 0.05) colored red, and a vertical dashed line corresponding to a log10 HR of no association between score and outcome (i.e., a log10 HR of 0).
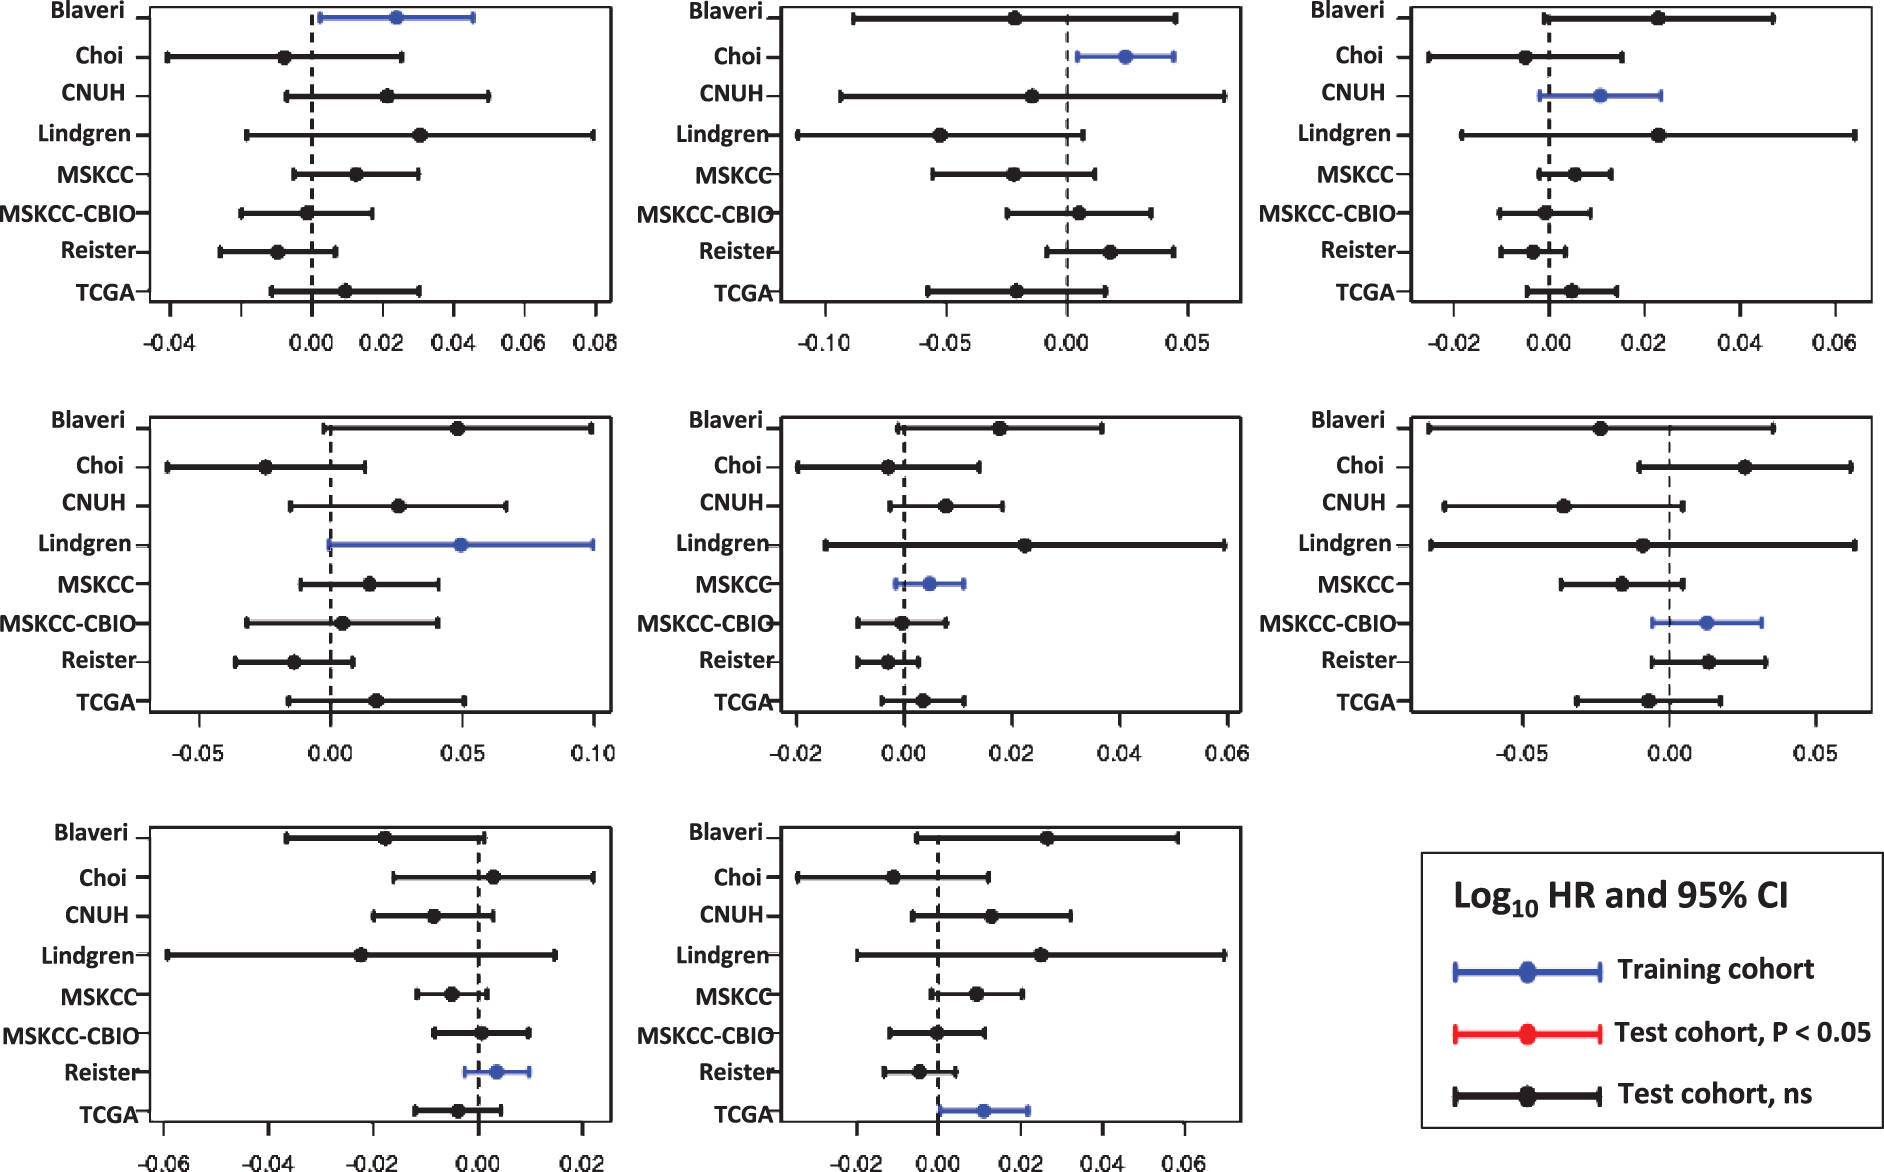
Fig.3
Prognostic value of the Gene Ontology Cell Cycle signature (GO-CCS). Signature genes were weighted by −1 or +1 according to whether the gene was positively or negatively associated with outcome, respectively, in each training cohort (blue lines). A weighted GO-CCS score was then calculated and its prognostic value evaluated in the remaining cohorts (i.e., the testing cohorts). Plots show the log10 HR (filled circle) and 95% confidence interval for each cohort and each signature, with statistically significant results (P < 0.05) colored red, and a vertical dashed line corresponding to a log10 HR of no association between score and outcome (i.e., a log10 HR of 0).
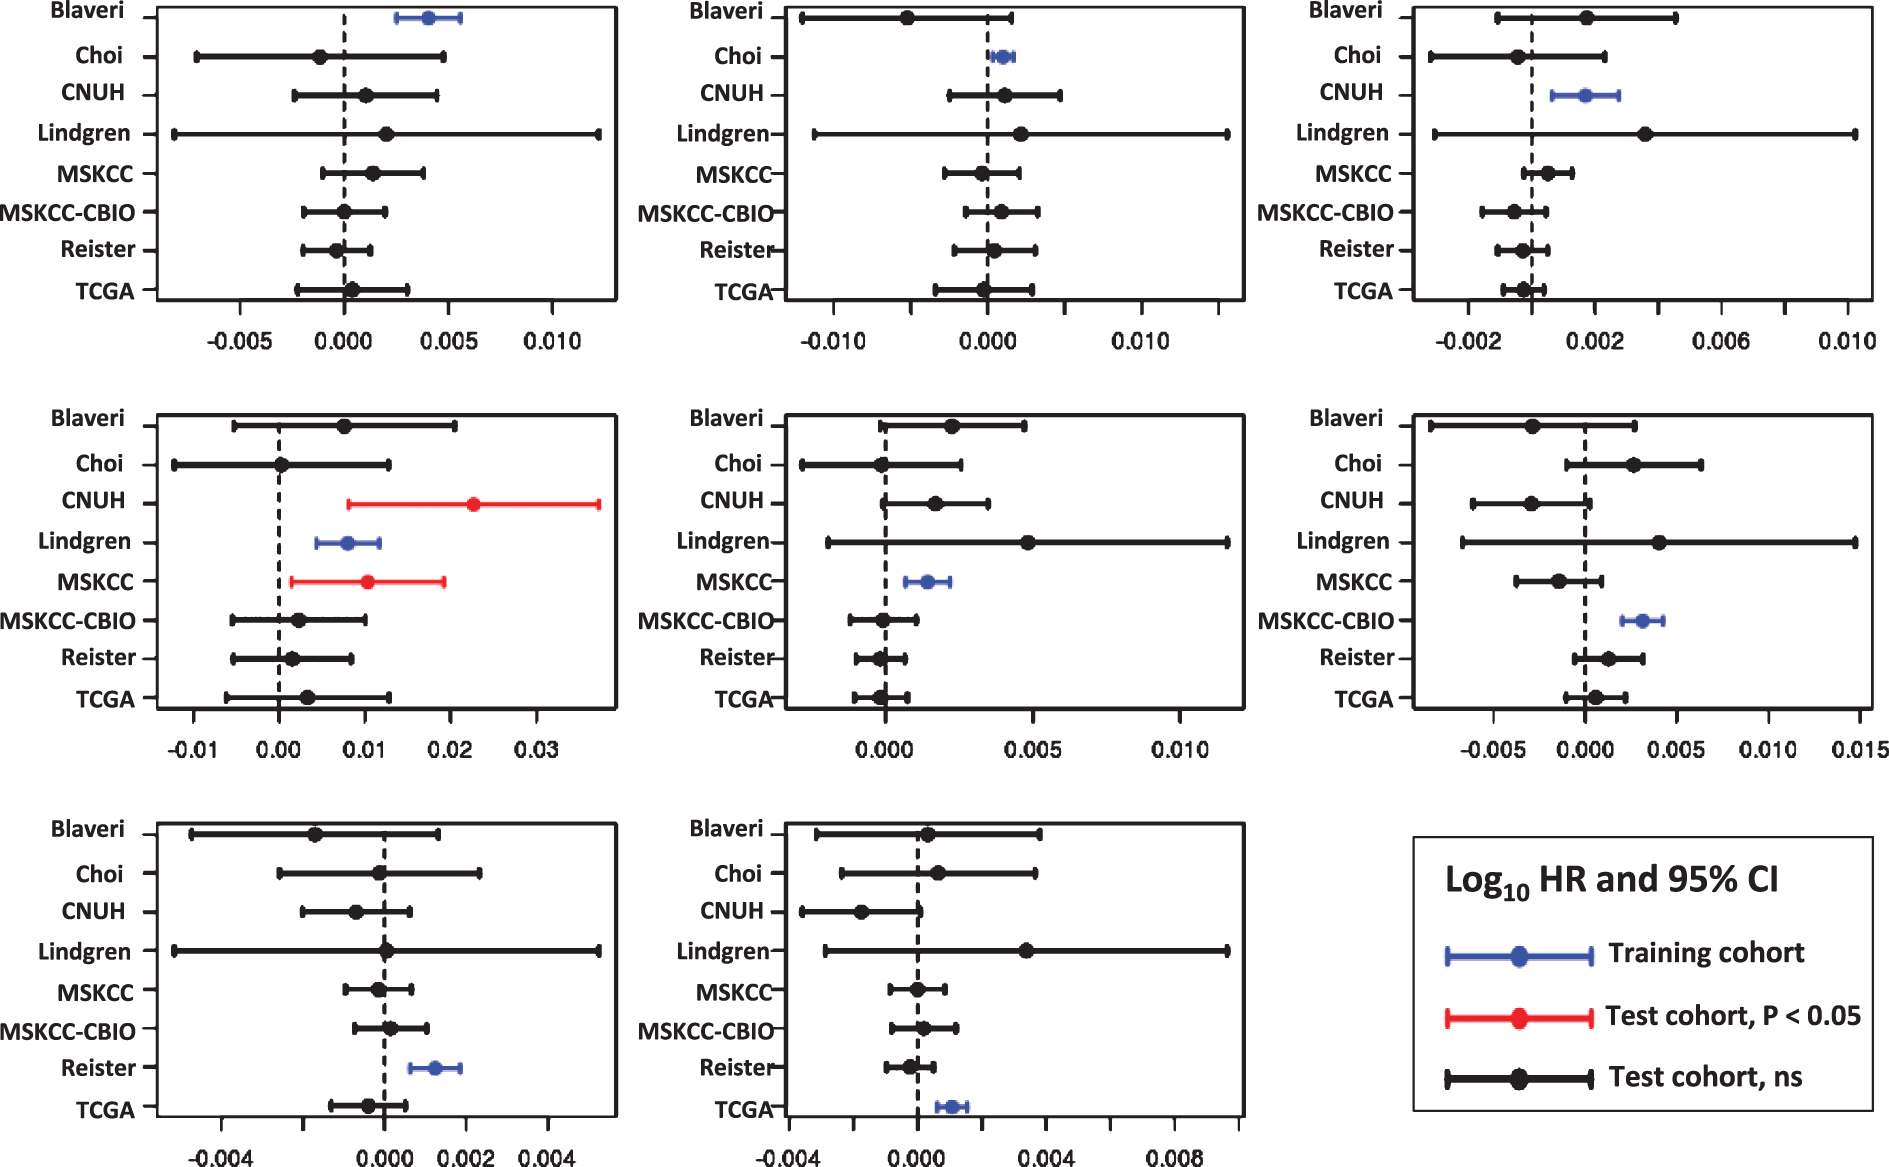
Fig.4
Prognostic value of the KEGG Pathway Cell Cycle signature (KEGG-CCS). Signature genes were weighted by −1 or +1 according to whether the gene was positively or negatively associated with outcome, respectively, in each training cohort (blue lines). A weighted KEGG-CCS score was then calculated and its prognostic value evaluated in the remaining cohorts (i.e., the testing cohorts). Plots show the log10 HR (filled circle) and 95% confidence interval for each cohort and each signature, with statistically significant results (P < 0.05) colored red, and a vertical dashed line corresponding to a log10 HR of no association between score and outcome (i.e., a log10 HR of 0).
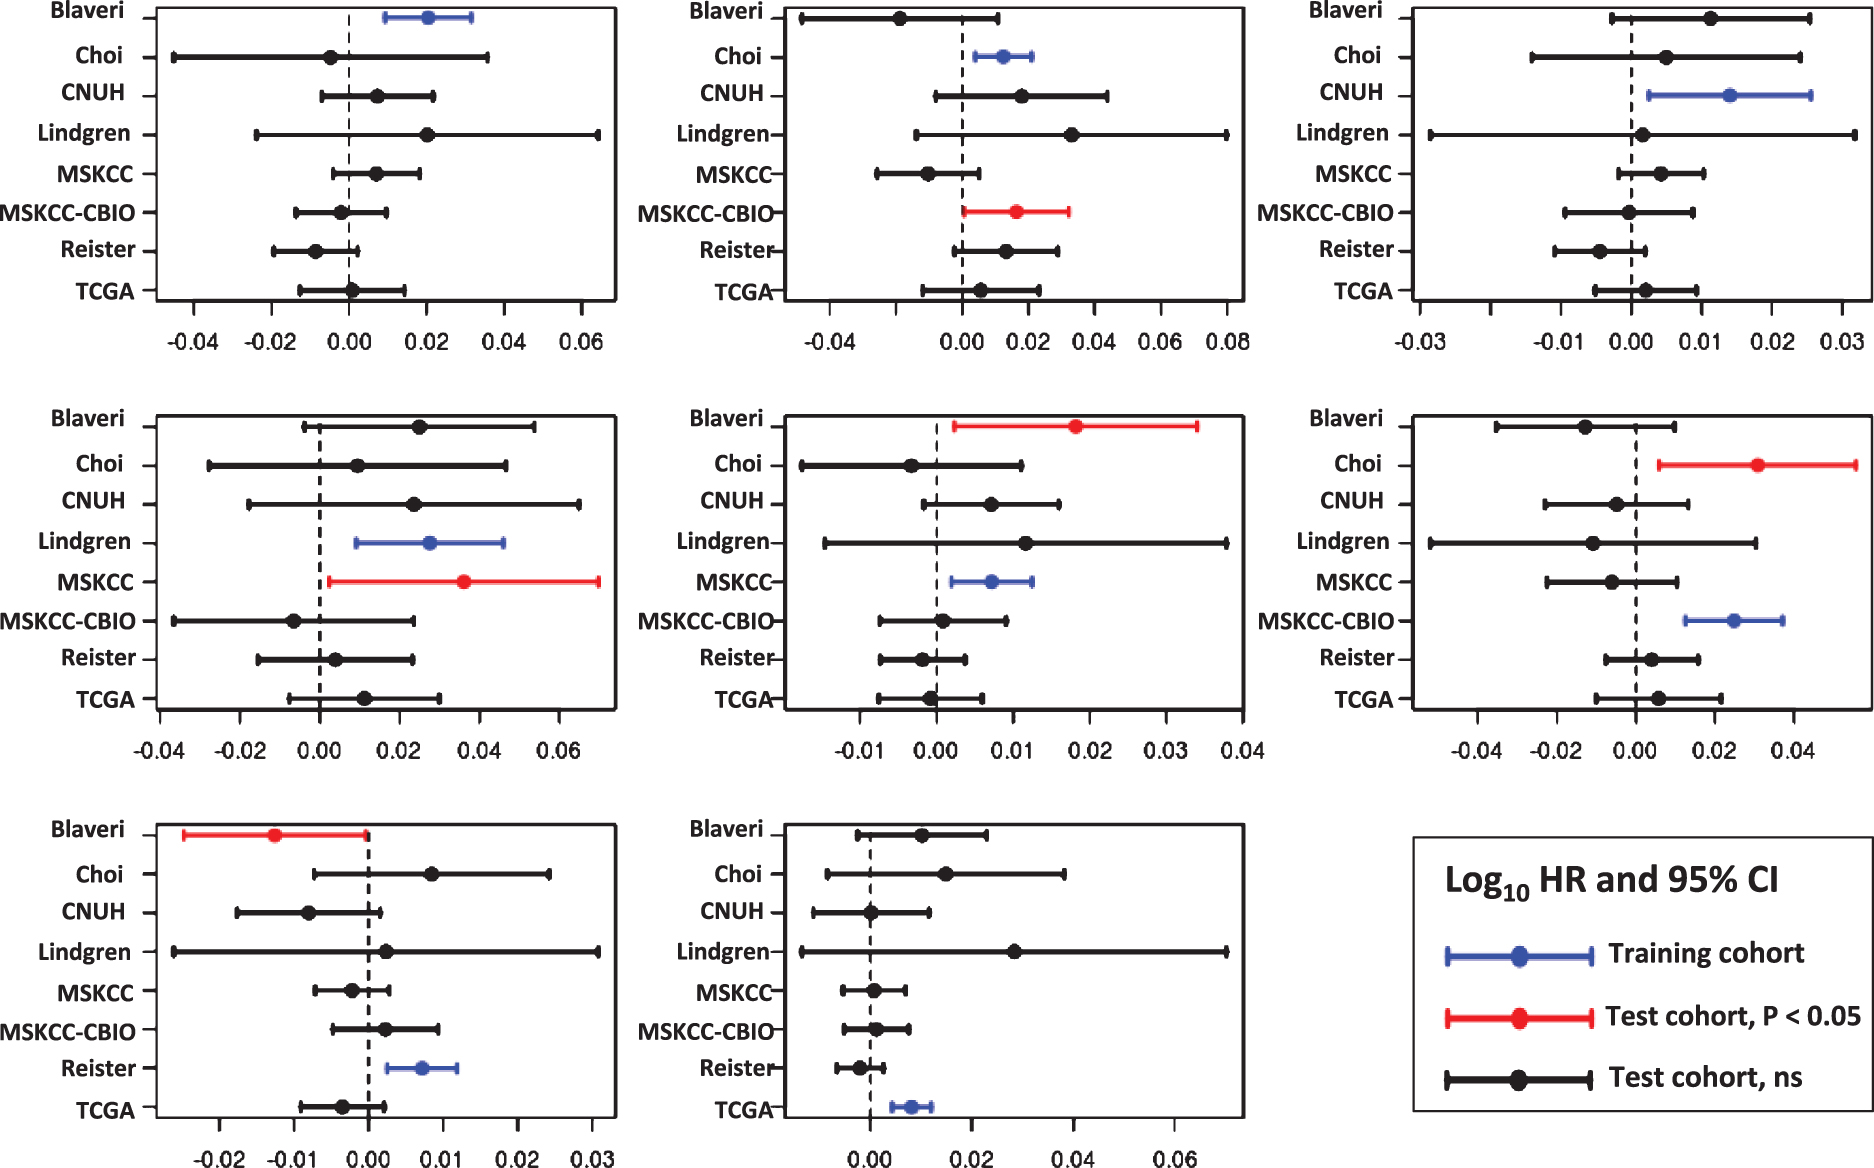
Fig.5
Enrichment analysis of sex identification and cell cycle signatures. An enrichment analysis was carried out to test whether a gene signature was enriched in significantly predictive (P < 0.05) genes for sex or outcome. The enrichment score is the ratio of the number of significantly predictive genes in the signature to the number of significantly predictive genes in the dataset. A, enrichment of Sex Identification Signature (SIS; positive control) for genes that are significantly (P < 0.05) up-regulated in males. B, enrichment of CCP, GO-CCS, and KEGG-CCS cell cycle signatures for genes that are significantly (P < 0.05) prognostic. The dotted line corresponds an enrichment score of 1 (i.e., what would be expectd by chance). A * denotes statistical significance (P < 0.05) that a signature is enriched (i.e, the enrichment score is significantly greater than 1).
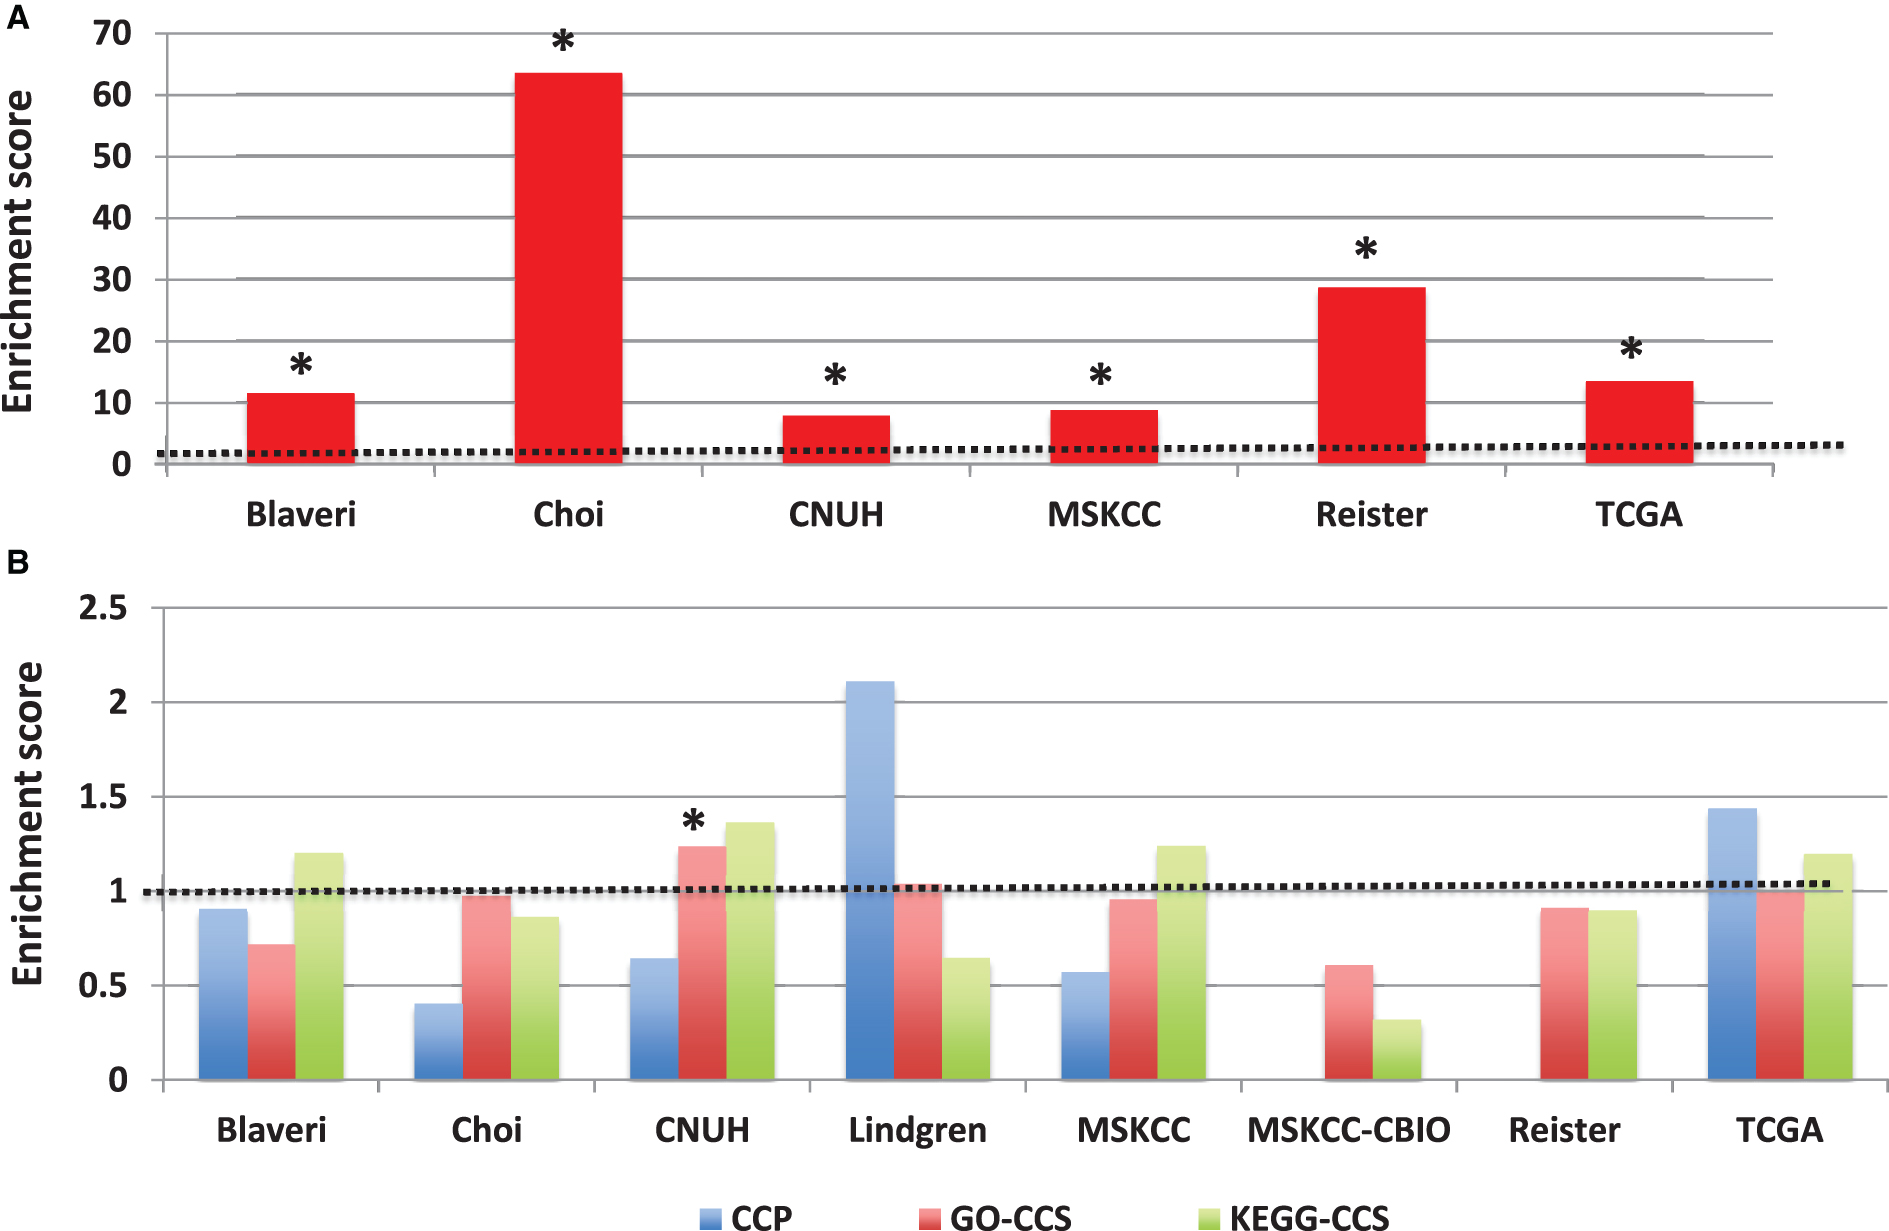
Fig.6
Prognostic modules associated with outcome in bladder cancer patients with high-grade, muscle invasive tumors. In each cohort, (A) over-represented Gene Ontology (GO) terms and (B) KEGG pathways were identified from lists of genes significantly predictive of disease outcome (P < 0.01) using the DAVID gene annotation enrichment analysis toolkit. Consistently prognostic modules were identified by ranking all modules first by the number of cohorts with significant results (FDR < 20% ) and then by average p-value. Each figure includes ten modules: the most consistently prognostic modules and the ‘top hit’ for each cohort, marked by an asterisk (*), which is defined as the module with the lowest FDR in that cohort that has an FDR < 20% in multiple cohorts, or if no such module exists, then the module with the lowest FDR.
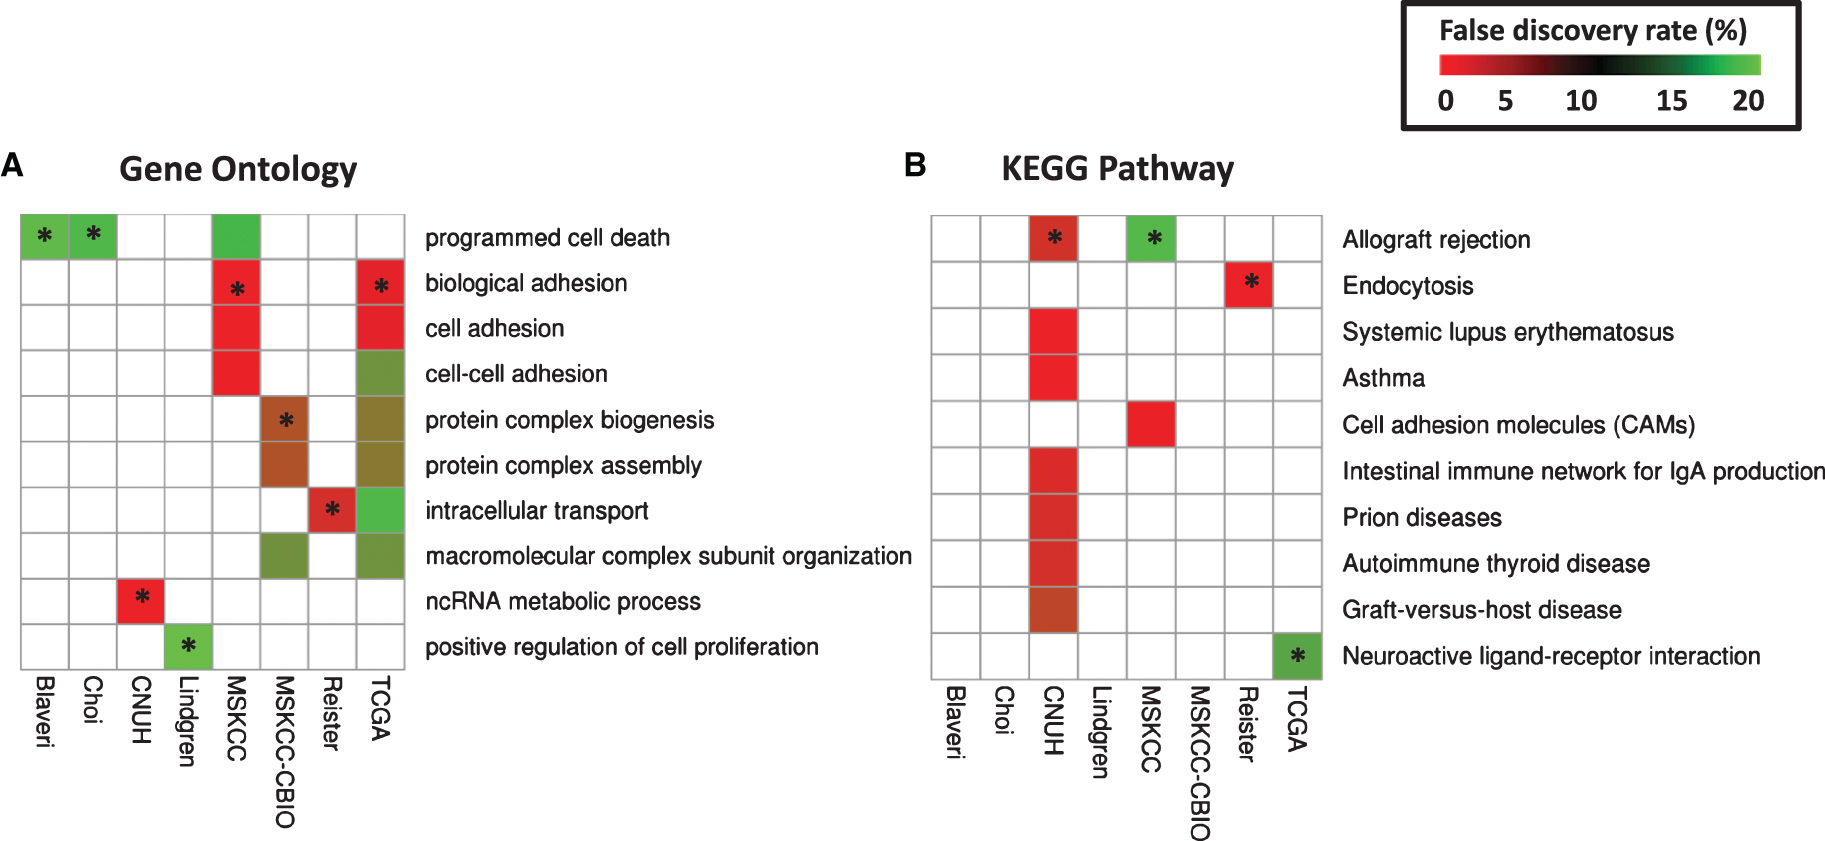
Fig.S1
Survival of patients according to tumor stage. Kaplan-Meier curves were generated for patients with T2 (green), T3 (blue), and T4 (red) tumors in Blaveri (N = 44), Choi (N = 22), CNUH (N = 28), Lindgren (N = 32), MSKCC (N = 60), MSKCC-CBIO (N = 47), Riester (N = 78), and TCGA (N = 147) cohorts. The log-rank P value is reported. Abbreviations: DSS, disease-specific survival; OS, Overall survival; RFS, recurrence-free survival.
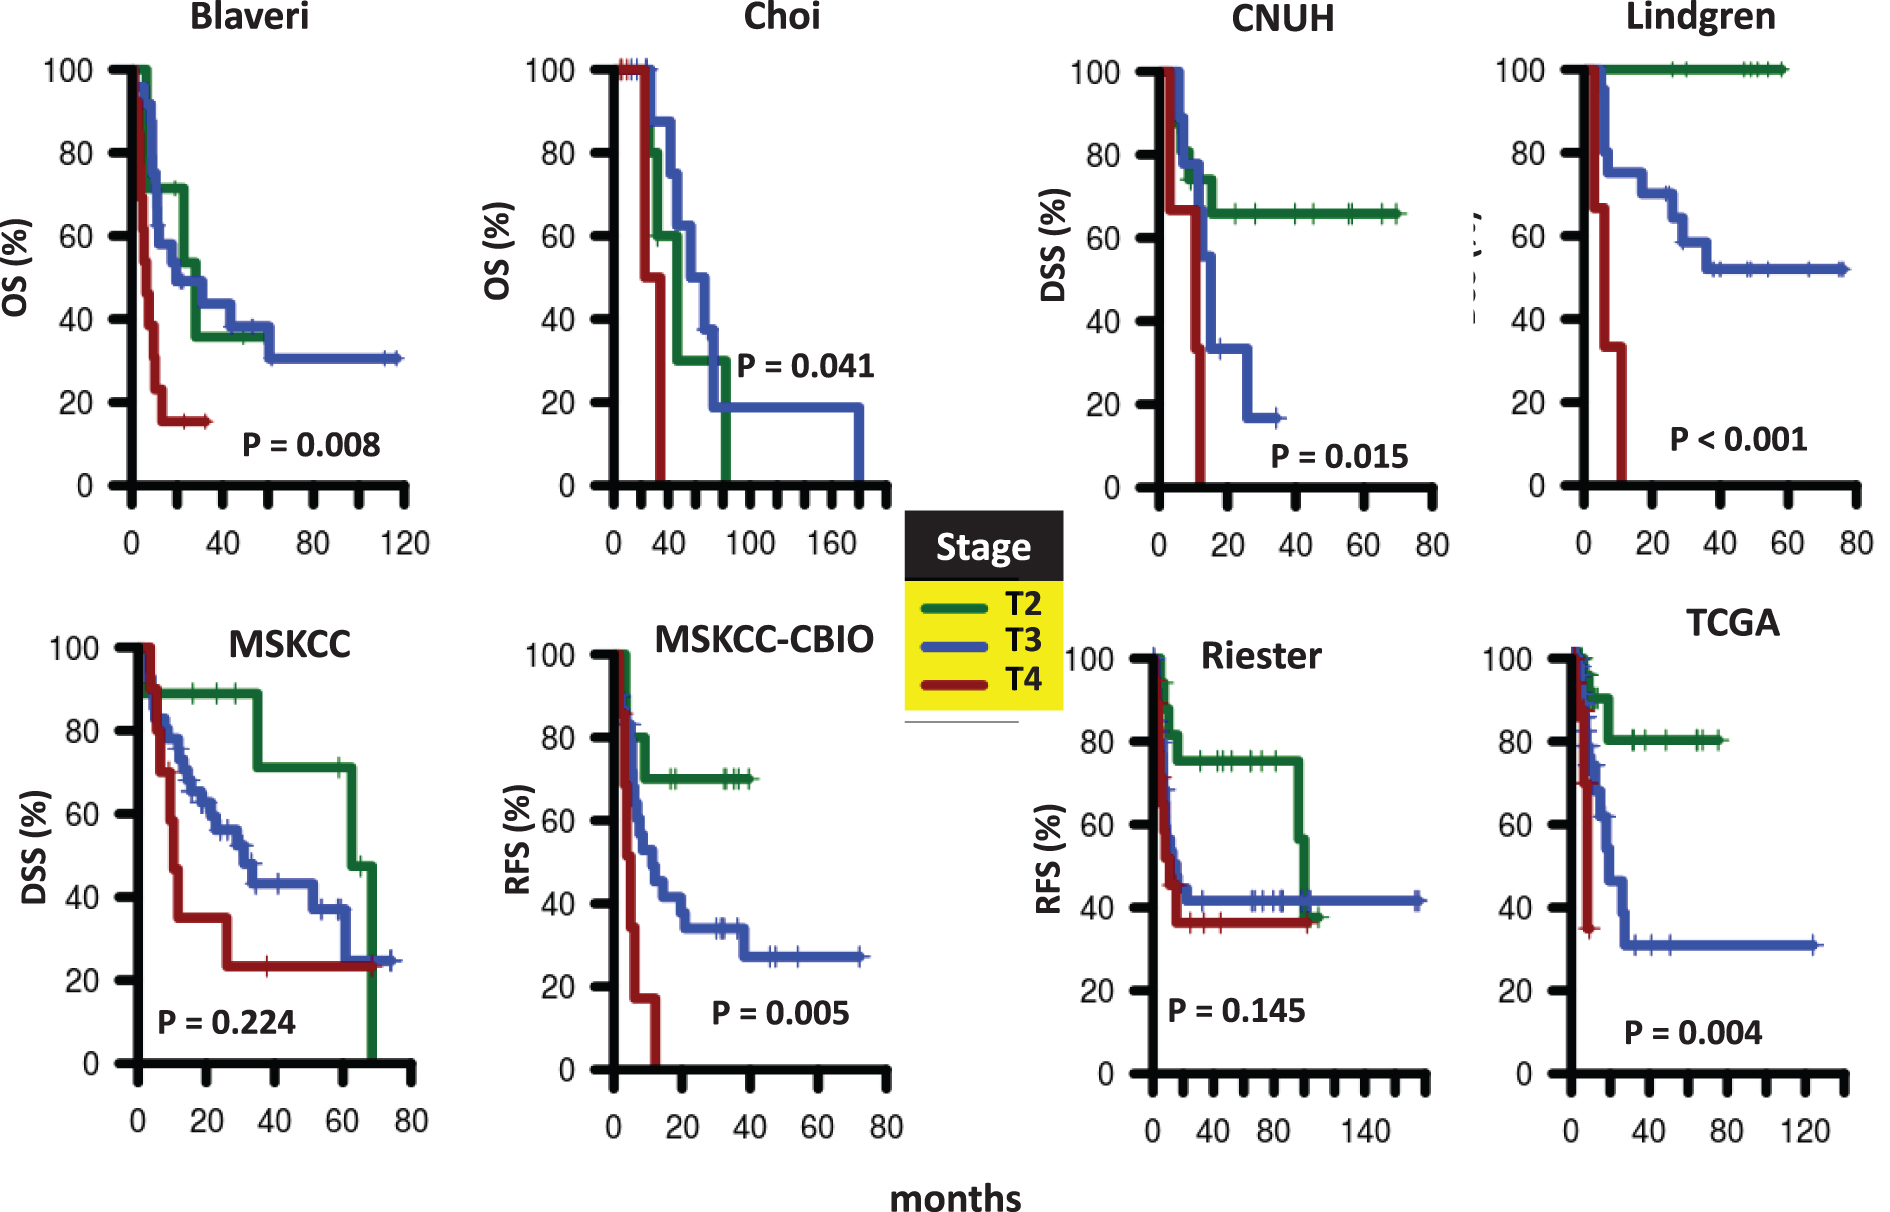
Fig.S2
Survival of patients according to nodal status at cystectomy. Kaplan-Meier curves were generated for patients with pN0 (green) or pN1-N3 (red) tumors in Blaveri (N = 44), Choi (N = 22), CNUH (N = 28), MSKCC (N = 60), MSKCC-CBIO (N = 46), Riester (N = 64), and TCGA (N = 143) cohorts. The hazard ratio (HR) for patients with pN1-N3 tumors compared to patients with pN0 tumors and the corresponding log-rank P value is reported. Abbreviations: DSS, disease-specific survival; OS, Overall survival; RFS, recurrence-free survival.
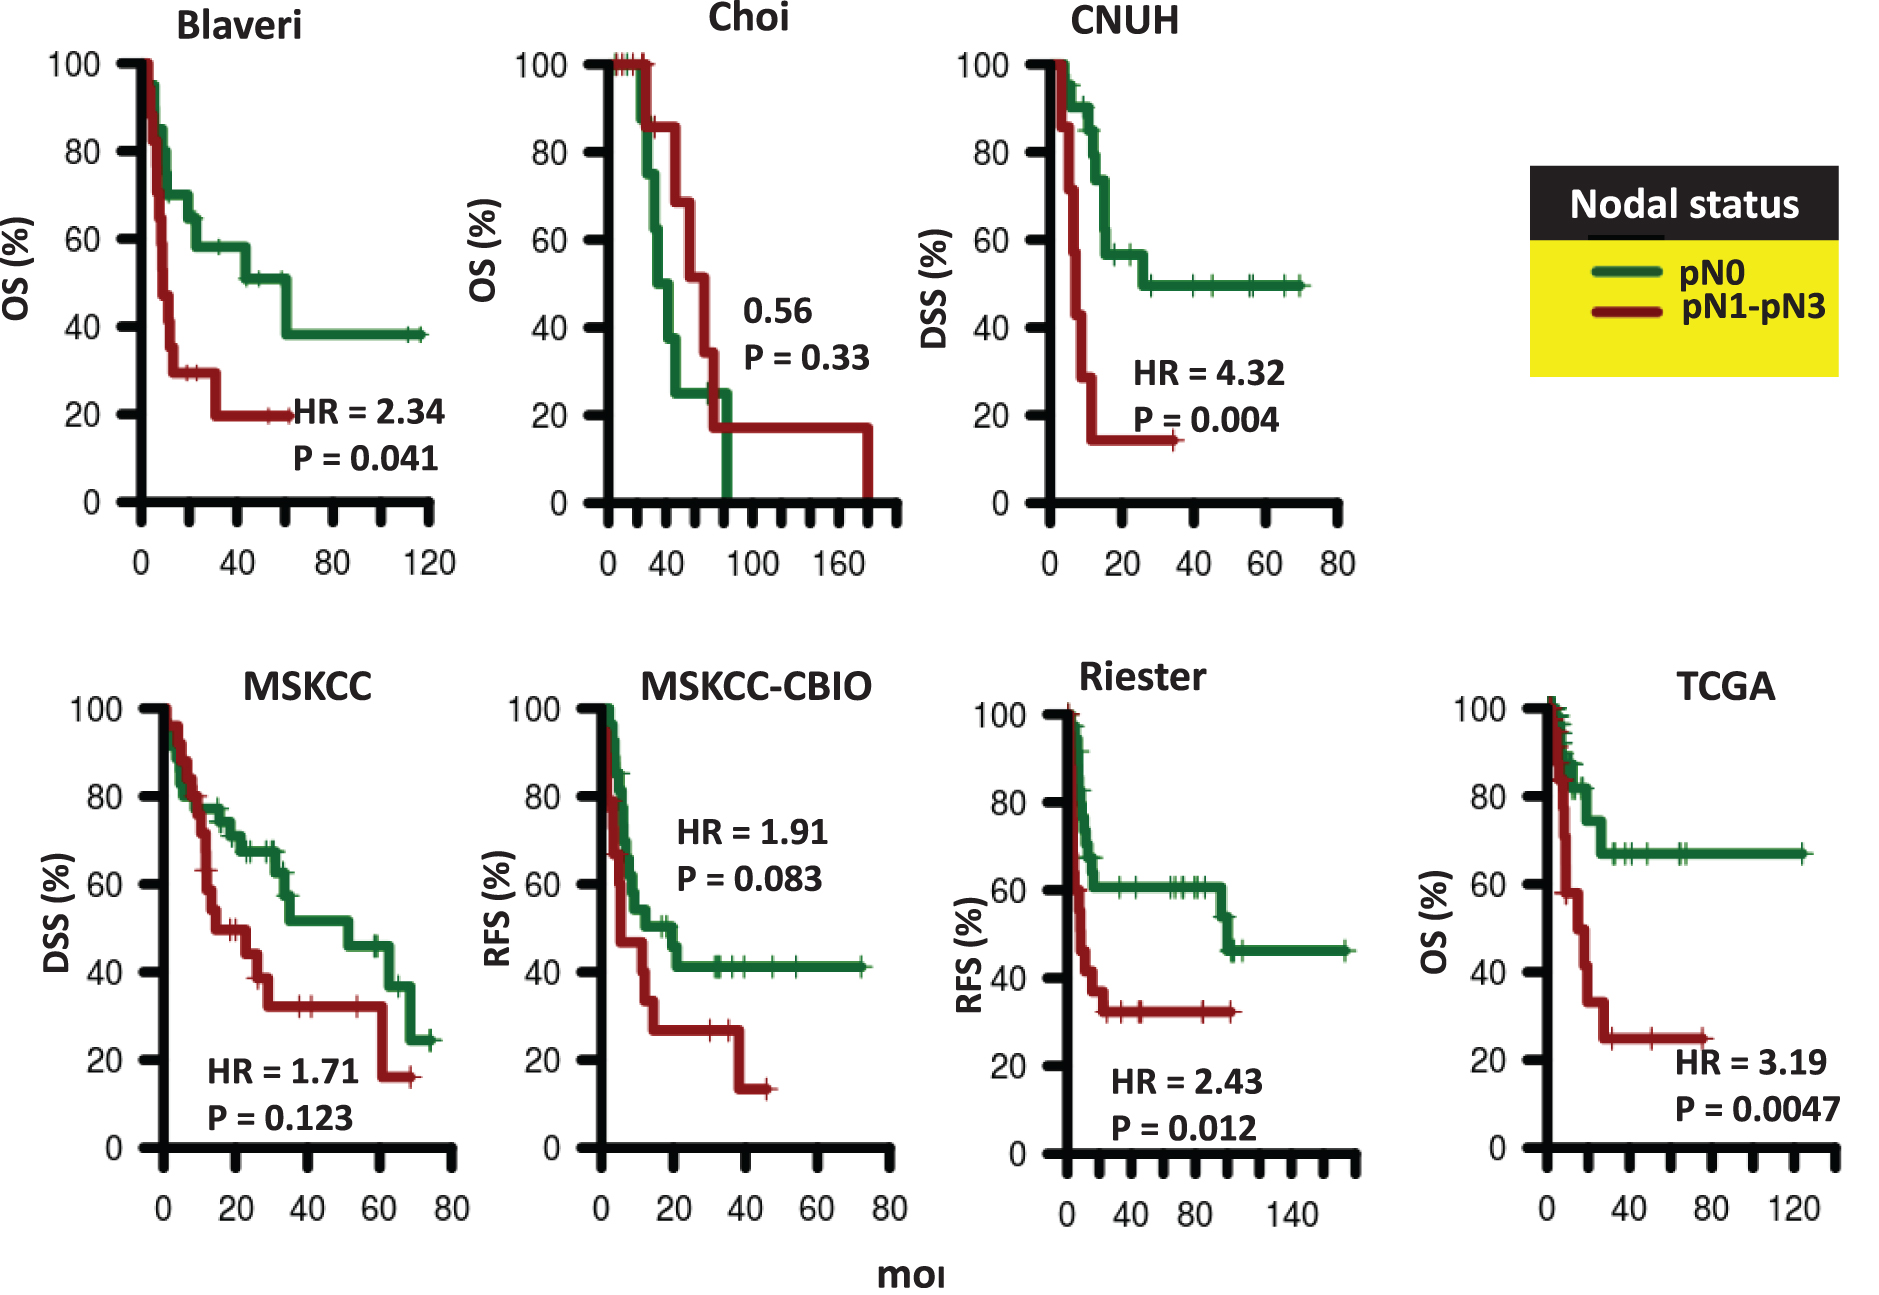
Fig.S3
Survival of patients according to presence of distant metastases. Kaplan-Meier curves were generated for patients with M0 (green) and M1 (red) tumors in CNUH (N = 28), and Lindgren (N = 32), and Riester (N = 78) cohorts. The hazard ratio (HR) for patients with M1 tumors compared to patients with M0 tumors and the corresponding log-rank P value is reported. Abbreviations: DSS, disease-specific survival; RFS, recurrence-free survival.
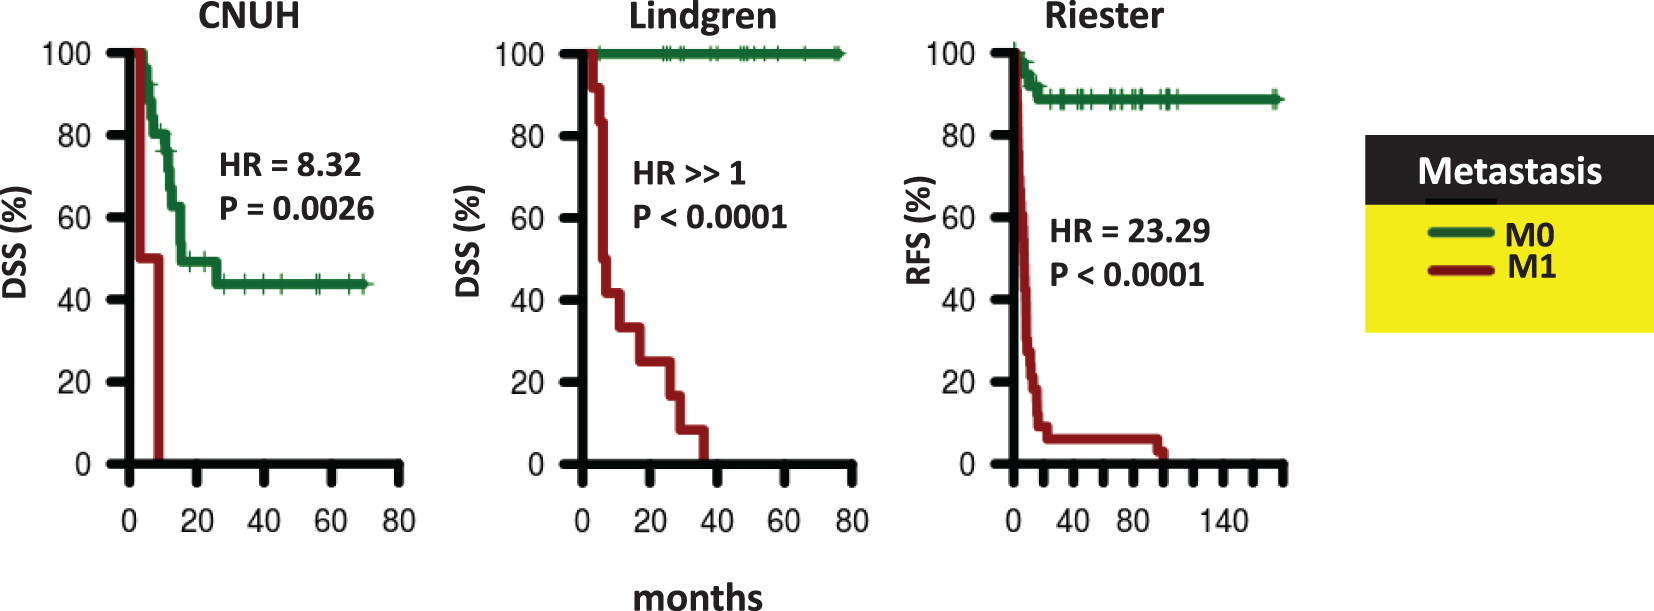
Fig.S4
Ability of the weighted Sex Identification Signature (SIS) to distinguish between males and females. SIS gene were weighted by −1 or +1 according to whether the gene was down- or up-regulated with males, respectively, in each training cohort. A weighted SIS score was then calculated and its ability to distinguish males from females value evaluated in the remaining cohorts (i.e., the testing cohorts). Performance is measured by AUC, which is equivalent to the probability that a randomly selected male has a higher weighted SIS score than a randomly selected female. The dashed black line corresponds to the AUC value of an association due to random chance (i.e., AUC = 0.50, black dotted line). All AUCs are statistically significant (P < 0.05) by the Wilcoxon rank-sum test.
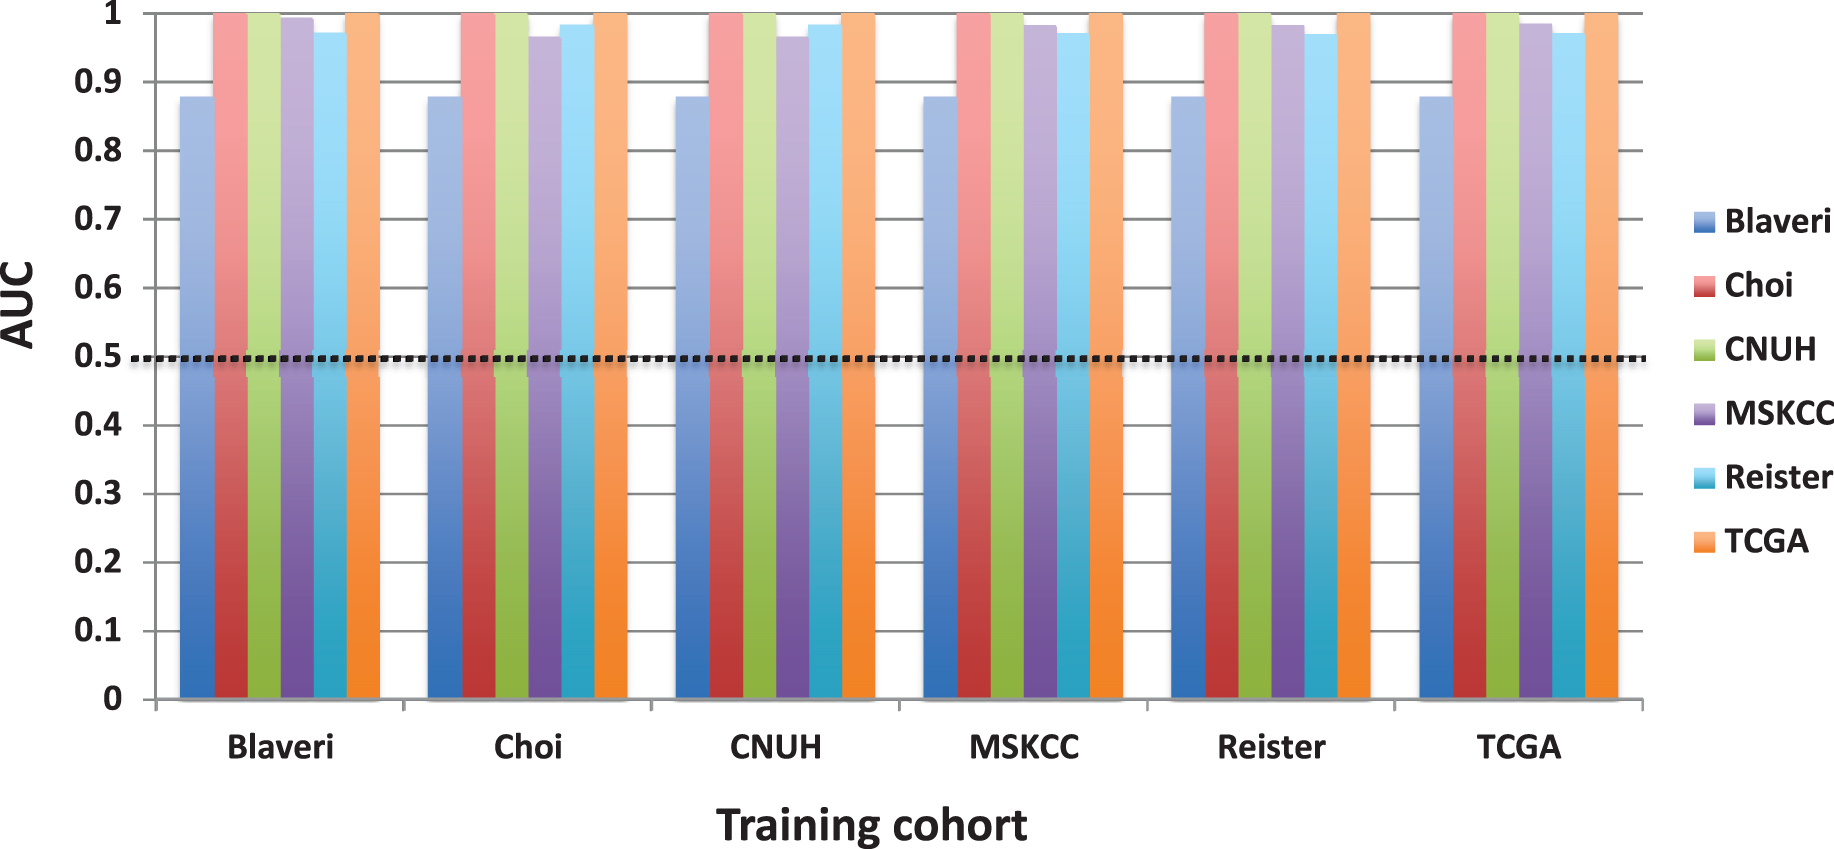
Table 1
The eight patient cohorts (N = 458) used in the analysis and their clinical characteristics. A question mark (?) corresponds to patients where nodal or metastasis status were unknown or not available; a dash (–) indicates that information about the corresponding variable is not known. The P-value tests against the null hypothesis that all group means or proportions are the same using analysis of variance (ANOVA) or the Fisher Exact Test, respectively
|
BLAVERI [12] (N = 44) |
Choi [5] (N = 22) |
CNUH [13] (N = 28) |
Lindgren [15] (N = 32) |
MSKCC [16] (N = 60) |
MSKCC- CBIO [17] (N = 47) |
Riester [14] (N = 78) |
TCGA [7] (N = 147) | P-value | ||
| Availability* | S | GSE48277 | GSE13507 | GSE19915 | S | cBioPortal | GSE31684 | TCGA | ||
| Endpoint | OS | 0S | DSS | DSS | DSS | RFS | RFS | OS | ||
| Age | Mean±SEM | 65.5±1.59 | 65.9±2.71 | 71.9±1.53 | – | 66.5±1.20 | – | 69.0±1.1 | 68.8±0.94 | 0.13 |
| Gender | F | 0.32 | 0.18 | 0.21 | – | 0.28 | – | 0.27 | 0.23 | 0.78 |
| M | 0.68 | 0.82 | 0.79 | – | 0.72 | – | 0.73 | 0.77 | ||
| Stage | T2 | 0.16 | 0.23 | 0.57 | 0.25 | 0.15 | 0.21 | 0.22 | 0.37 | <0.001 |
| T3 | 0.55 | 0.55 | 0.32 | 0.66 | 0.68 | 0.64 | 0.54 | 0.49 | ||
| T4 | 0.30 | 0.23 | 0.11 | 0.09 | 0.17 | 0.15 | 0.24 | 0.14 | ||
| Nodal Status | pN0 | 0.45 | 0.45 | 0.75 | – | 0.58 | 0.57 | 0.49 | 0.68 | <0.001 |
| >pN0 | 0.39 | 0.55 | 0.25 | – | 0.42 | 0.40 | 0.33 | 0.29 | ||
| ? | 0.16 | 0 | 0 | – | 0 | 0.02 | 0.18 | 0.03 | ||
| Distant Metastasis | M0 | 0.07 | 0.95 | 0.93 | 0.62 | – | – | 0.58 | 0.51 | <0.001 |
| M1 | 0 | 0.05 | 0.07 | 0.38 | – | – | 0.42 | 0.01 | ||
| ? | 0.93 | 0 | 0 | 0 | – | – | 0 | 0.48 |
Table 2
Association of clinicopathological variables with outcome using the endpoints given in Table 1. For each cohort (column), the value in the table is the hazard ratio (HR) for the variable in the first column. For each row, the HR corresponds to the first category (e.g., male) with respect to the second category (e.g., female), with the exception of age, where the HR corresponds to a 1-year increase in age, and stage in the Lindgren cohort. In Lindgren, patients with T2 tumors who are pM0 have 100% survival (see Fig. S3). Because the HR corresponding to T4 vs. T2 is not defined in this case, the HR corresponding to T4 vs. T3 is given instead. A dash (’–’) indicates insufficient sample size for analysis. *,P< 0.05 by Wald test. Also see Supplementary Figures S1–S3.
| Blaveri | Choi | CNUH | Lindgren | MSKCC | MSKCC-CBIO | Riester | TCGA | |
| Male vs. Female | 1.34 | 0.66 | 0.39 | – | 1.15 | – | 0.94 | 1.11 |
| Age | 1 | 1.06 | 1.09* | – | 1.02 | – | 0.99 | 1.01 |
| T3 vs. T2 | 1.04 | 0.61 | 2.58 | ⪢1* | 1.86 | 2.74 | 2.13 | 4.44* |
| T4 vs. T2 | 3.29* | 5.06 | 7.60* | 6.75* | 2.92 | 7.95* | 2.63 | 10.91* |
| pN1-3 vs. pN0 | 2.34* | 0.56 | 4.32* | – | 1.71 | 1.91 | 2.43* | 3.19* |
| pM1 vs. pM0 | – | – | 8.32* | ⪢1* | – | 23.29* | – |
Table S1
Gene expression profiling platforms
| Cohort | Platform |
| Blaveri | Custom cDNA microarrays |
| Choi | Illumina HumanHT-12 WG-DASL V4.0 R2 expression beadchip |
| CNUH | Illumina human-6 v2.0 expression beadchip |
| Lindgren | Swegene |
| MSKCC | Affymetrix Human Genome U133A Array |
| MSKCC-CBIO | Illumina Human HT-12 Expression BeadChip |
| Riester | Affymetrix Human Genome U133 Plus 2.0 Array |
| TCGA | Illumina HiSeq RNASeq V2 |
Table S2
Sex Identification Signature (SIS)
| Probe | Gene | FC | P-value | FDR |
| 214131_at | TXLNG2P | 6.987855541 | 6.80E-008 | 0.000350503 |
| 206700_s_at | KDM5D | 10.84569913 | 8.51E-008 | 0.000350941 |
| 204409_s_at | EIF1AY | 3.217134489 | 2.74E-007 | 0.000942252 |
| 205000_at | DDX3Y | 4.56386144 | 2.55E-007 | 0.000942252 |
| 201909_at | RPS4Y1 | 3.077204565 | 4.20E-007 | 0.001333226 |
| 232618_at | TXLNG2P | 2.340764001 | 7.35E-007 | 0.002166596 |
| 236694_at | TXLNG2P | 2.236285184 | 8.44E-007 | 0.002321415 |
| 205001_s_at | DDX3Y | 1.857529079 | 1.04E-006 | 0.00267436 |
| 223646_s_at | TXLNG2P | 1.706286494 | 1.78E-006 | 0.004325388 |
| 204410_at | EIF1AY | 1.497917623 | 6.57E-006 | 0.015057486 |
| 211149_at | UTY | 1.762116434 | 1.02E-005 | 0.022151127 |
| 230760_at | ZFY | 1.695563985 | 1.23E-005 | 0.025342139 |
| 228492_at | USP9Y | 1.794467909 | 1.39E-005 | 0.027300876 |
| 223645_s_at | TXLNG2P | 1.806342642 | 2.19E-005 | 0.041086848 |
| 232684_at | ZNF503-AS1 | 1.276909382 | 5.45E-005 | 0.097688317 |
Table S3
Gene Ontology (GO) terms and KEGG pathways associated with prognostic genes (P < 0.01) in high-grade, muscle invasive bladder cancer
| Blaveri | Choi | CNUH | Lindgren | MSKCC | MSKCC-CBIO | Reister | TCGA | ||
| GO:0012501∼programmed cell death | 18.77 | 16.17 | 14.38 | ||||||
| GO:0022610∼biological adhesion | 0.09 | 2.15 | |||||||
| GO:0007155∼cell adhesion | 0.09 | 2.18 | |||||||
| GO:0016337∼cell-cell adhesion | 1.12 | 11.34 | |||||||
| GO:0070271∼protein complex biogenesis | 6.26 | 9.26 | |||||||
| GO:0006461∼protein complex assembly | 6.26 | 9.26 | |||||||
| GO:0046907∼intracellular transport | 3.57 | 16.19 | |||||||
|
GO:0043933∼macromolecular complex subunit organization | 11.10 | 11.32 | |||||||
| GO:0000059∼protein import into nucleus, docking | 0.00 | ||||||||
| GO:0007156∼homophilic cell adhesion | 0.00 | ||||||||
| GO:0034660∼ncRNA metabolic process | 0.04 | ||||||||
|
GO:0002504∼antigen processing and presentation of peptide or polysaccharide antigen via MHC class II | 0.05 | ||||||||
| GO:0007268∼synaptic transmission | 0.08 | ||||||||
| GO:0019226∼transmission of nerve impulse | 0.16 | ||||||||
| GO:0030182∼neuron differentiation | 0.18 | ||||||||
| GO:0045597∼positive regulation of cell differentiation | 0.23 | ||||||||
| GO:0006396∼RNA processing | 0.24 | ||||||||
| GO:0007267∼cell-cell signaling | 0.31 | ||||||||
| GO:0007398∼ectoderm development | 0.32 | ||||||||
| GO:0043623∼cellular protein complex assembly | 0.34 | ||||||||
| GO:0034470∼ncRNA processing | 0.40 | ||||||||
| GO:0002696∼positive regulation of leukocyte activation | 0.59 | ||||||||
| GO:0042592∼homeostatic process | 0.60 | ||||||||
| GO:0050870∼positive regulation of T cell activation | 0.60 | ||||||||
| GO:0007214∼gamma-aminobutyric acid signaling pathway | 0.61 | ||||||||
| GO:0045580∼regulation of T cell differentiation | 0.69 | ||||||||
| GO:0043065∼positive regulation of apoptosis | 0.74 | ||||||||
| GO:0050867∼positive regulation of cell activation | 0.78 | ||||||||
| GO:0008544∼epidermis development | 0.81 | ||||||||
| GO:0043068∼positive regulation of programmed cell death | 0.85 | ||||||||
| GO:0010942∼positive regulation of cell death | 0.94 | ||||||||
|
GO:0034621∼cellular macromolecular complex subunit organization | 1.04 | ||||||||
| GO:0045582∼positive regulation of T cell differentiation | 1.06 | ||||||||
| GO:0050863∼regulation of T cell activation | 1.07 | ||||||||
| GO:0045165∼cell fate commitment | 1.12 | ||||||||
| GO:0051094∼positive regulation of developmental process | 1.19 | ||||||||
| GO:0009952∼anterior/posterior pattern formation | 1.22 | ||||||||
| GO:0002708∼positive regulation of lymphocyte mediated immunity | 1.34 | ||||||||
| GO:0002705∼positive regulation of leukocyte mediated immunity | 1.34 | ||||||||
| GO:0045621∼positive regulation of lymphocyte differentiation | 1.49 | ||||||||
| GO:0007389∼pattern specification process | 1.82 | ||||||||
| GO:0045619∼regulation of lymphocyte differentiation | 1.83 | ||||||||
| GO:0008104∼protein localization | 2.05 | ||||||||
| GO:0051251∼positive regulation of lymphocyte activation | 2.18 | ||||||||
| GO:0006399∼tRNA metabolic process | 2.84 | ||||||||
| GO:0060284∼regulation of cell development | 2.86 | ||||||||
| GO:0051960∼regulation of nervous system development | 2.99 | ||||||||
| GO:0042127∼regulation of cell proliferation | 3.02 | ||||||||
| GO:0002699∼positive regulation of immune effector process | 3.52 | ||||||||
| GO:0031349∼positive regulation of defense response | 3.52 | ||||||||
| GO:0001912∼positive regulation of leukocyte mediated cytotoxicity | 3.53 | ||||||||
| GO:0048666∼neuron development | 3.55 | ||||||||
| GO:0050778∼positive regulation of immune response | 3.68 | ||||||||
| GO:0045586∼regulation of gamma-delta T cell differentiation | 3.70 | ||||||||
| GO:0046645∼positive regulation of gamma-delta T cell activation | 3.70 | ||||||||
| GO:0045588∼positive regulation of gamma-delta T cell differentiation | 3.70 | ||||||||
| GO:0046643∼regulation of gamma-delta T cell activation | 3.70 | ||||||||
| GO:0010875∼positive regulation of cholesterol efflux | 3.70 | ||||||||
| GO:0003002∼regionalization | 4.04 | ||||||||
| GO:0051249∼regulation of lymphocyte activation | 4.13 | ||||||||
| GO:0015031∼protein transport | 4.23 | ||||||||
| GO:0031175∼neuron projection development | 4.56 | ||||||||
| GO:0045184∼establishment of protein localization | 4.57 | ||||||||
| GO:0002684∼positive regulation of immune system process | 4.82 | ||||||||
| GO:0032373∼positive regulation of sterol transport | 5.10 | ||||||||
| GO:0045059∼positive thymic T cell selection | 5.10 | ||||||||
| GO:0010874∼regulation of cholesterol efflux | 5.10 | ||||||||
| GO:0032376∼positive regulation of cholesterol transport | 5.10 | ||||||||
| GO:0043112∼receptor metabolic process | 5.11 | ||||||||
| GO:0031343∼positive regulation of cell killing | 5.18 | ||||||||
| GO:0034622∼cellular macromolecular complex assembly | 5.25 | ||||||||
|
GO:0051056∼regulation of small GTPase mediated signal transduction | 5.36 | ||||||||
| GO:0001910∼regulation of leukocyte mediated cytotoxicity | 5.82 | ||||||||
| GO:0016064∼immunoglobulin mediated immune response | 6.22 | ||||||||
| GO:0019725∼cellular homeostasis | 6.44 | ||||||||
| GO:0010889∼regulation of sequestering of triglyceride | 6.64 | ||||||||
| GO:0000910∼cytokinesis | 6.85 | ||||||||
| GO:0035023∼regulation of Rho protein signal transduction | 7.10 | ||||||||
| GO:0046578∼regulation of Ras protein signal transduction | 7.13 | ||||||||
| GO:0033077∼T cell differentiation in the thymus | 7.22 | ||||||||
| GO:0002706∼regulation of lymphocyte mediated immunity | 7.31 | ||||||||
| GO:0019724∼B cell mediated immunity | 7.42 | ||||||||
| GO:0050767∼regulation of neurogenesis | 7.48 | ||||||||
| GO:0022613∼ribonucleoprotein complex biogenesis | 7.57 | ||||||||
| GO:0002694∼regulation of leukocyte activation | 7.63 | ||||||||
| GO:0065003∼macromolecular complex assembly | 7.68 | ||||||||
| GO:0031341∼regulation of cell killing | 7.98 | ||||||||
| GO:0043368∼positive T cell selection | 8.45 | ||||||||
| GO:0008033∼tRNA processing | 8.48 | ||||||||
| GO:0008624∼induction of apoptosis by extracellular signals | 8.76 | ||||||||
| GO:0045665∼negative regulation of neuron differentiation | 9.49 | ||||||||
| GO:0032318∼regulation of Ras GTPase activity | 9.54 | ||||||||
| GO:0006820∼anion transport | 9.76 | ||||||||
| GO:0050865∼regulation of cell activation | 10.02 | ||||||||
| GO:0007242∼intracellular signaling cascade | 10.45 | ||||||||
| GO:0002703∼regulation of leukocyte mediated immunity | 11.06 | ||||||||
| GO:0016192∼vesicle-mediated transport | 11.31 | ||||||||
| GO:0042254∼ribosome biogenesis | 11.41 | ||||||||
| GO:0030855∼epithelial cell differentiation | 11.56 | ||||||||
| GO:0048598∼embryonic morphogenesis | 11.64 | ||||||||
| GO:0016197∼endosome transport | 11.91 | ||||||||
| GO:0045664∼regulation of neuron differentiation | 12.17 | ||||||||
| GO:0032870∼cellular response to hormone stimulus | 12.17 | ||||||||
| GO:0032370∼positive regulation of lipid transport | 12.45 | ||||||||
| GO:0002714∼positive regulation of B cell mediated immunity | 12.45 | ||||||||
| GO:0002891∼positive regulation of immunoglobulin mediated immune response | 12.45 | ||||||||
| GO:0060041∼retina development in camera-type eye | 12.56 | ||||||||
| GO:0034504∼protein localization in nucleus | 12.77 | ||||||||
| GO:0034613∼cellular protein localization | 12.90 | ||||||||
| GO:0051223∼regulation of protein transport | 12.90 | ||||||||
| GO:0019882∼antigen processing and presentation | 13.31 | ||||||||
| GO:0070727∼cellular macromolecule localization | 13.41 | ||||||||
| GO:0006917∼induction of apoptosis | 13.54 | ||||||||
| GO:0030217∼T cell differentiation | 13.63 | ||||||||
| GO:0012502∼induction of programmed cell death | 14.11 | ||||||||
| GO:0030098∼lymphocyte differentiation | 14.42 | ||||||||
| GO:0010745∼negative regulation of foam cell differentiation | 14.65 | ||||||||
| GO:0060538∼skeletal muscle organ development | 14.72 | ||||||||
| GO:0007519∼skeletal muscle tissue development | 14.72 | ||||||||
| GO:0048584∼positive regulation of response to stimulus | 14.82 | ||||||||
| GO:0070201∼regulation of establishment of protein localization | 15.59 | ||||||||
| GO:0043087∼regulation of GTPase activity | 16.41 | ||||||||
| GO:0006909∼phagocytosis | 16.45 | ||||||||
| GO:0009451∼RNA modification | 16.45 | ||||||||
| GO:0032321∼positive regulation of Rho GTPase activity | 16.50 | ||||||||
| GO:0008542∼visual learning | 16.91 | ||||||||
| GO:0045061∼thymic T cell selection | 16.95 | ||||||||
| GO:0002700∼regulation of production of molecular mediator of immune response | 17.08 | ||||||||
| GO:0032990∼cell part morphogenesis | 17.15 | ||||||||
| GO:0006790∼sulfur metabolic process | 17.21 | ||||||||
| GO:0045637∼regulation of myeloid cell differentiation | 17.26 | ||||||||
| GO:0006915∼apoptosis | 17.53 | ||||||||
| GO:0006606∼protein import into nucleus | 18.17 | ||||||||
| GO:0030534∼adult behavior | 18.17 | ||||||||
| GO:0007166∼cell surface receptor linked signal transduction | 18.40 | ||||||||
| GO:0045667∼regulation of osteoblast differentiation | 18.56 | ||||||||
| GO:0046649∼lymphocyte activation | 18.66 | ||||||||
| GO:0030030∼cell projection organization | 18.87 | ||||||||
| GO:0042102∼positive regulation of T cell proliferation | 19.01 | ||||||||
| GO:0006357∼regulation of transcription from RNA polymerase II promoter | 19.78 | ||||||||
| GO:0008284∼positive regulation of cell proliferation | 19.88 | ||||||||
| GO:0006913∼nucleocytoplasmic transport | 19.99 | ||||||||
| hsa05330:Allograft rejection | 3.75 | 17.40 | |||||||
| hsa04144:Endocytosis | 0.11 | ||||||||
| hsa05322:Systemic lupus erythematosus | 0.12 | ||||||||
| hsa05310:Asthma | 0.16 | ||||||||
| hsa04514:Cell adhesion molecules (CAMs) | 0.93 | ||||||||
| hsa04672:Intestinal immune network for IgA production | 2.85 | ||||||||
| hsa05020:Prion diseases | 3.31 | ||||||||
| hsa05320:Autoimmune thyroid disease | 3.50 | ||||||||
| hsa05332:Graft-versus-host disease | 5.30 | ||||||||
| hsa04940:Type I diabetes mellitus | 7.25 | ||||||||
| hsa04080:Neuroactive ligand-receptor interaction | 12.66 | ||||||||
| hsa05216:Thyroid cancer | 13.13 | ||||||||
| hsa05416:Viral myocarditis | 16.39 |


