
Protein adsorption on ZnO films studied by ATR-FTIR spectroscopy
Abstract
In many scientific fields there is a high interest to study molecular adsorption processes on surfaces. The adsorbed molecule can have significant impact on the properties of the material under study, for example protein adsorption to inorganic material can enhance its biocompatibility. Attenuated total reflection Fourier-transform infrared (ATR-FTIR) spectroscopy is a suitable method to monitor such adsorption processes close to a surface. In this study, ZnO films were synthesized on silicon ATR substrates via a mild hydrothermal reaction. The films were then characterized by scanning electron microscopy (SEM) and FTIR microscopy. Chemical imaging with FTIR microscopy allowed to analyze the composition of the heterogeneous film samples. ATR-FTIR spectroscopy was then applied to investigate the adsorption properties of the ZnO films. Protein solutions of bovine serum albumine (BSA) were circulated in a closed cycle over the ZnO film and IR spectra were recorded during the adsorption process. A stronger protein adsorption was observed for silicon substrates coated with ZnO than for plain silicon. Furthermore, subsequent flushing with pure water and desorption measurements indicated a stronger protein binding to ZnO than to plain silicon.
1.Introduction
Molecular adsorption plays an important role in many processes. The growth of bacterial cells on teeth for example is assumed to happen after the formation of a film of salivary proteins [11]. Proliferation of human cells on an implant can also be impacted by the adsorption of proteins to its surface [5,16]. Furthermore, adsorption of surfactants is used to control the shape of growing nanoparticles [2] or to remove dyes from industrial wastewater [17]. These examples show that understanding adsorption processes is an important and ambiguous topic for researchers of various research fields. ZnO is a material of high interest for many applications due to its biocompatibility [12] and antibacterial activity [18]. We studied protein adsorption on ZnO films by infrared spectroscopy. Several methods are available for the synthesis of ZnO films, from spray pyrolysis [1] and electrodeposition [8] to chemical bath deposition [15], with the latter being a simple and non-hazardous synthesis route with low cost. As a hydrothermal procedure, the reaction is carried out in an alkaline, aqueous solution of Zn(NO3)2, where a film of ZnO is formed over time [15]. A suitable method for the analysis of proteins is attenuated total reflection Fourier-transform infrared spectroscopy (ATR-FTIR). Structural information can be obtained from the amide I (∼1650
In this work, the chemical bath deposition method was utilized to prepare thin films of ZnO on silicon ATR substrates, which were then characterized using scanning electron microscopy (SEM) and FTIR microscopy. Furthermore, the films were used to investigate the adsorption of bovine serum albumin (BSA) with different concentrations. The binding affinity of the protein to the ZnO film was compared with the uncoated silicon ATR substrate. Time-dependent spectra of the amide I and II bands were analyzed to gain deeper insights into the adsorption process itself.
2.Materials and methods
2.1.Thin film synthesis
The synthesis of ZnO films was done on silicon windows (Korth) for SEM measurements as well as for FTIR microscopy. For the ATR-FTIR spectroscopy measurements, trapezoidal silicon ATR crystals (Specac) were used.
Previous to the synthesis, the silicon substrate was immersed in 5 mM guanidinum hydrochloride (Roth) to remove any existing protein deposits. Afterwards it was treated with 4% acetic acid (Roth) for 15 minutes. It was then polished with a paper cloth and ethyl acetate (technical), immersed in 1 M hydrochloric acid (Sigma-Aldrich) for 30 minutes and sonicated for 15 min in MilliQ water.
The synthesis of the zinc oxide thin film was done by the hydrothermal synthesis route as described by Shinde et al. [15]. A 0.1 M solution of Zn(NO3)2 (Roth) was prepared. The pH of the solution was adjusted to ∼11.8 by addition of ∼25% diluted NH3 (Sigma-Aldrich). The silicon substrate was immersed in the solution, which was stirred for five to seven hours at ∼50°C. Subsequently, the substrate was rinsed with MilliQ water and left to dry at room temperature.
2.2.Scanning electron microscopy
A silicon cuvette was prepared via the described synthesis. Imaging was done with a Hitachi TM 3000 tabletop SEM using the program TEM3000 (Hitachi). A voltage of 15 keV was used. The samples were analyzed as produced, without sputtering. The resolution of the SEM was limited to 1 μm.
2.3.Infrared microscopy
A LUMOS IR microscope (Bruker) was used for imaging and spectral analysis of the thin film. For the spectral measurements, a background of an uncoated silicon cuvette was recorded with a resolution of 4
2.4.ATR-FTIR spectroscopy
Protein solutions were prepared with lyophilized BSA (Serva) and MilliQ water with various concentrations (0.25, 0.5 and 1 mg/mL). The ZnO film was synthesized on the silicon ATR crystal as described above. An ATR flow-cell with vertical geometry (Specac) was used to mount the crystal into the spectrometer. The necessary space between the silicon crystal and the metal mount of the set-up was provided by insertion of teflon spacers on each side of the crystal. ZnO film was carefully removed with a paper cloth in the areas where the teflon spacers were placed, to prevent the set-up from leaking. A peristaltic pump (Ismatec) was connected to the crystal mount via teflon tubing. Previous to the experiments, the teflon tubing was cleaned by flushing it with 150 mL of 2% Hellmanex-II-solution (Hellma) at 35°C and then 150 mL MilliQ water, each at a flow rate of 4.8 mL/min. Experiments were done with a flow rate of 0.48 mL/min. To remove particles adhering loosely to the thin film, the mounted substrate was first flushed with MilliQ water for 120 minutes. A background measurement with water was taken before switching to BSA solutions. Measurements were recorded during 120 minutes of cycling the BSA solution through the ATR cell, afterwards the protein solution was exchanged by pure MilliQ water, which was then pumped through the cell for further 120 minutes. ATR-FTIR measurements were done at room temperature with a spectral resolution of 4
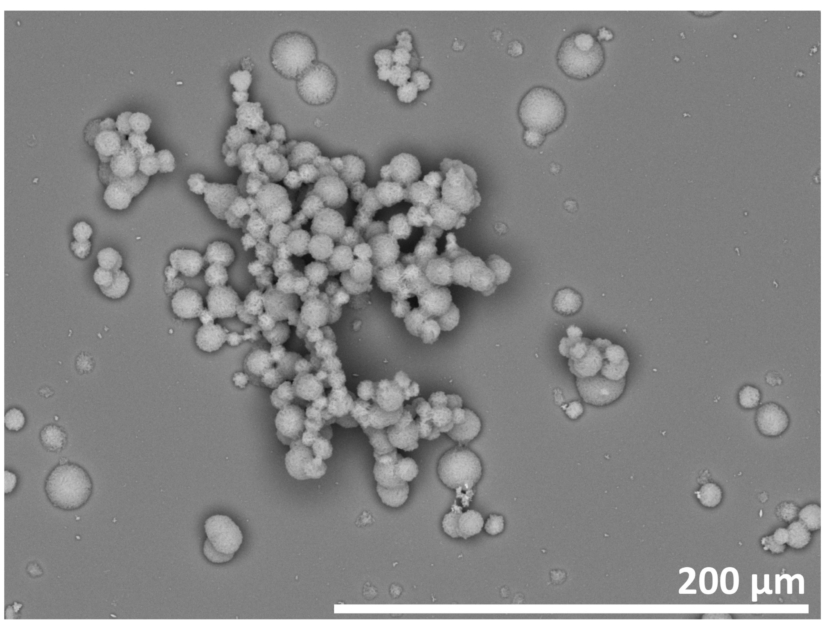
Fig. 1.
SEM image of the ZnO thin film synthesized on the silicon substrate. The ZnO film shows a high heterogeneity with ZnO particles and aggregates of various sizes.
3.Results and discussion
3.1.Characterization of ZnO thin films
Many synthesis routes for the production of ZnO thin films exist, but in this study the chemical bath deposition method was used because of its low cost and mild reaction conditions. The films synthesized via this route showed two different components, already visible by eye: first, a white thin film formed on the surface of the silicon substrate and with longer reaction times, a growth of particles was observed. In Fig. 1, a SEM image of such a sample is given, showing single particles with sizes of 5–20 μm, and aggregates thereof with the size of 100–200 μm. The resolution of the SEM was not high enough to resolve smaller structural components of the thin film. Shinde et al., from whose work this synthesis path is derived, found the thin film to be built of ZnO cones with sizes below 1 μm [15]. However, in their study no formation of particles or aggregates was observed. They used glass substrates and shorter reaction times, which is assumed to be the cause of the differences compared to our study.
Fig. 2.
Chemical imaging of the ZnO thin film with FTIR microscopy. a) Visible light image of a ZnO thin film and selected areas (1–4). b) Corresponding infrared spectra reveal the heterogeneity of the ZnO film with low particle density (1, 2) and areas containing particle-aggregates (3, 4).
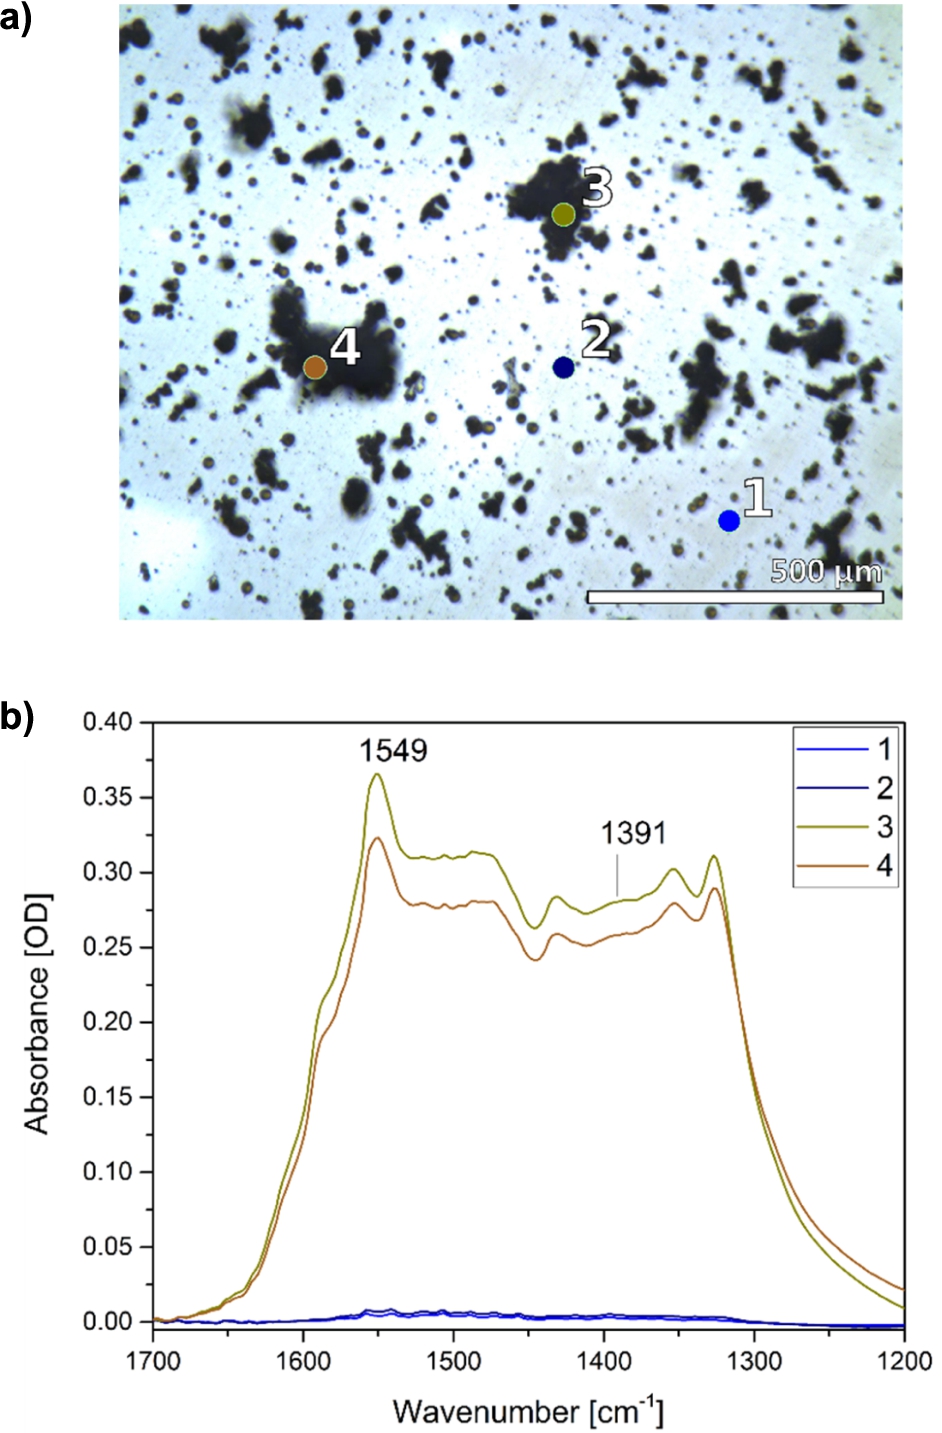
IR microscopy provides a chemical imaging of samples as IR spectra can be recorded from selected sample regions with μm spatial resolution [6]. This method was applied to characterize further the heterogeneity of the film, already observed in the SEM image, and to resolve potential differences in the IR spectra of larger ZnO particle-aggregates versus the thin film with sub-μm particle sizes. Two spectra of particle-aggregates and two spectra of areas with low particle density are compared (Fig. 2). The aggregates show IR absorbance in the region between 1700 and 1200
For the investigation of the protein adsorption on the ZnO film by ATR-FTIR spectroscopy, the particles and aggregates with sizes above several micrometers in diameter will basically not contribute to the spectra since the penetration depth of the IR beam into the sample is only about 1 μm. Thus the major part of those particle and aggregate surfaces interacting with the protein will not be detected. As a result, the small structures of the thin film are most likely recorded in the protein adsorption experiments. The size, surface structure and abundance of the large particles and aggregates are therefore mostly irrelevant for the processes observed in our FTIR-ATR studies.
3.2.Investigation of protein binding properties
To investigate the adsorption process of BSA to the ZnO film, time-dependent ATR-FTIR measurements were performed. Experiments with uncoated silicon substrates were also conducted in order to compare the adsorption behaviour of the protein to the plain silicon surface. Figure 3 shows measurements for a BSA concentration of 0.25 mg/mL. Spectra are shown from 2 to 10 minutes in 2 min steps and from 10 to 110 minutes in 10 min steps. Bands at 1652
Fig. 3.
ATR-FTIR spectroscopy to monitor BSA adsorption on ZnO thin films. Time-dependent spectra of the adsorption process a) to an uncoated and b) to a ZnO coated silicon ATR crystal. The same protein concentrations (c = 0.25 mg/mL) were used for both measurements. Intensity change of the c) amide I band at 1652
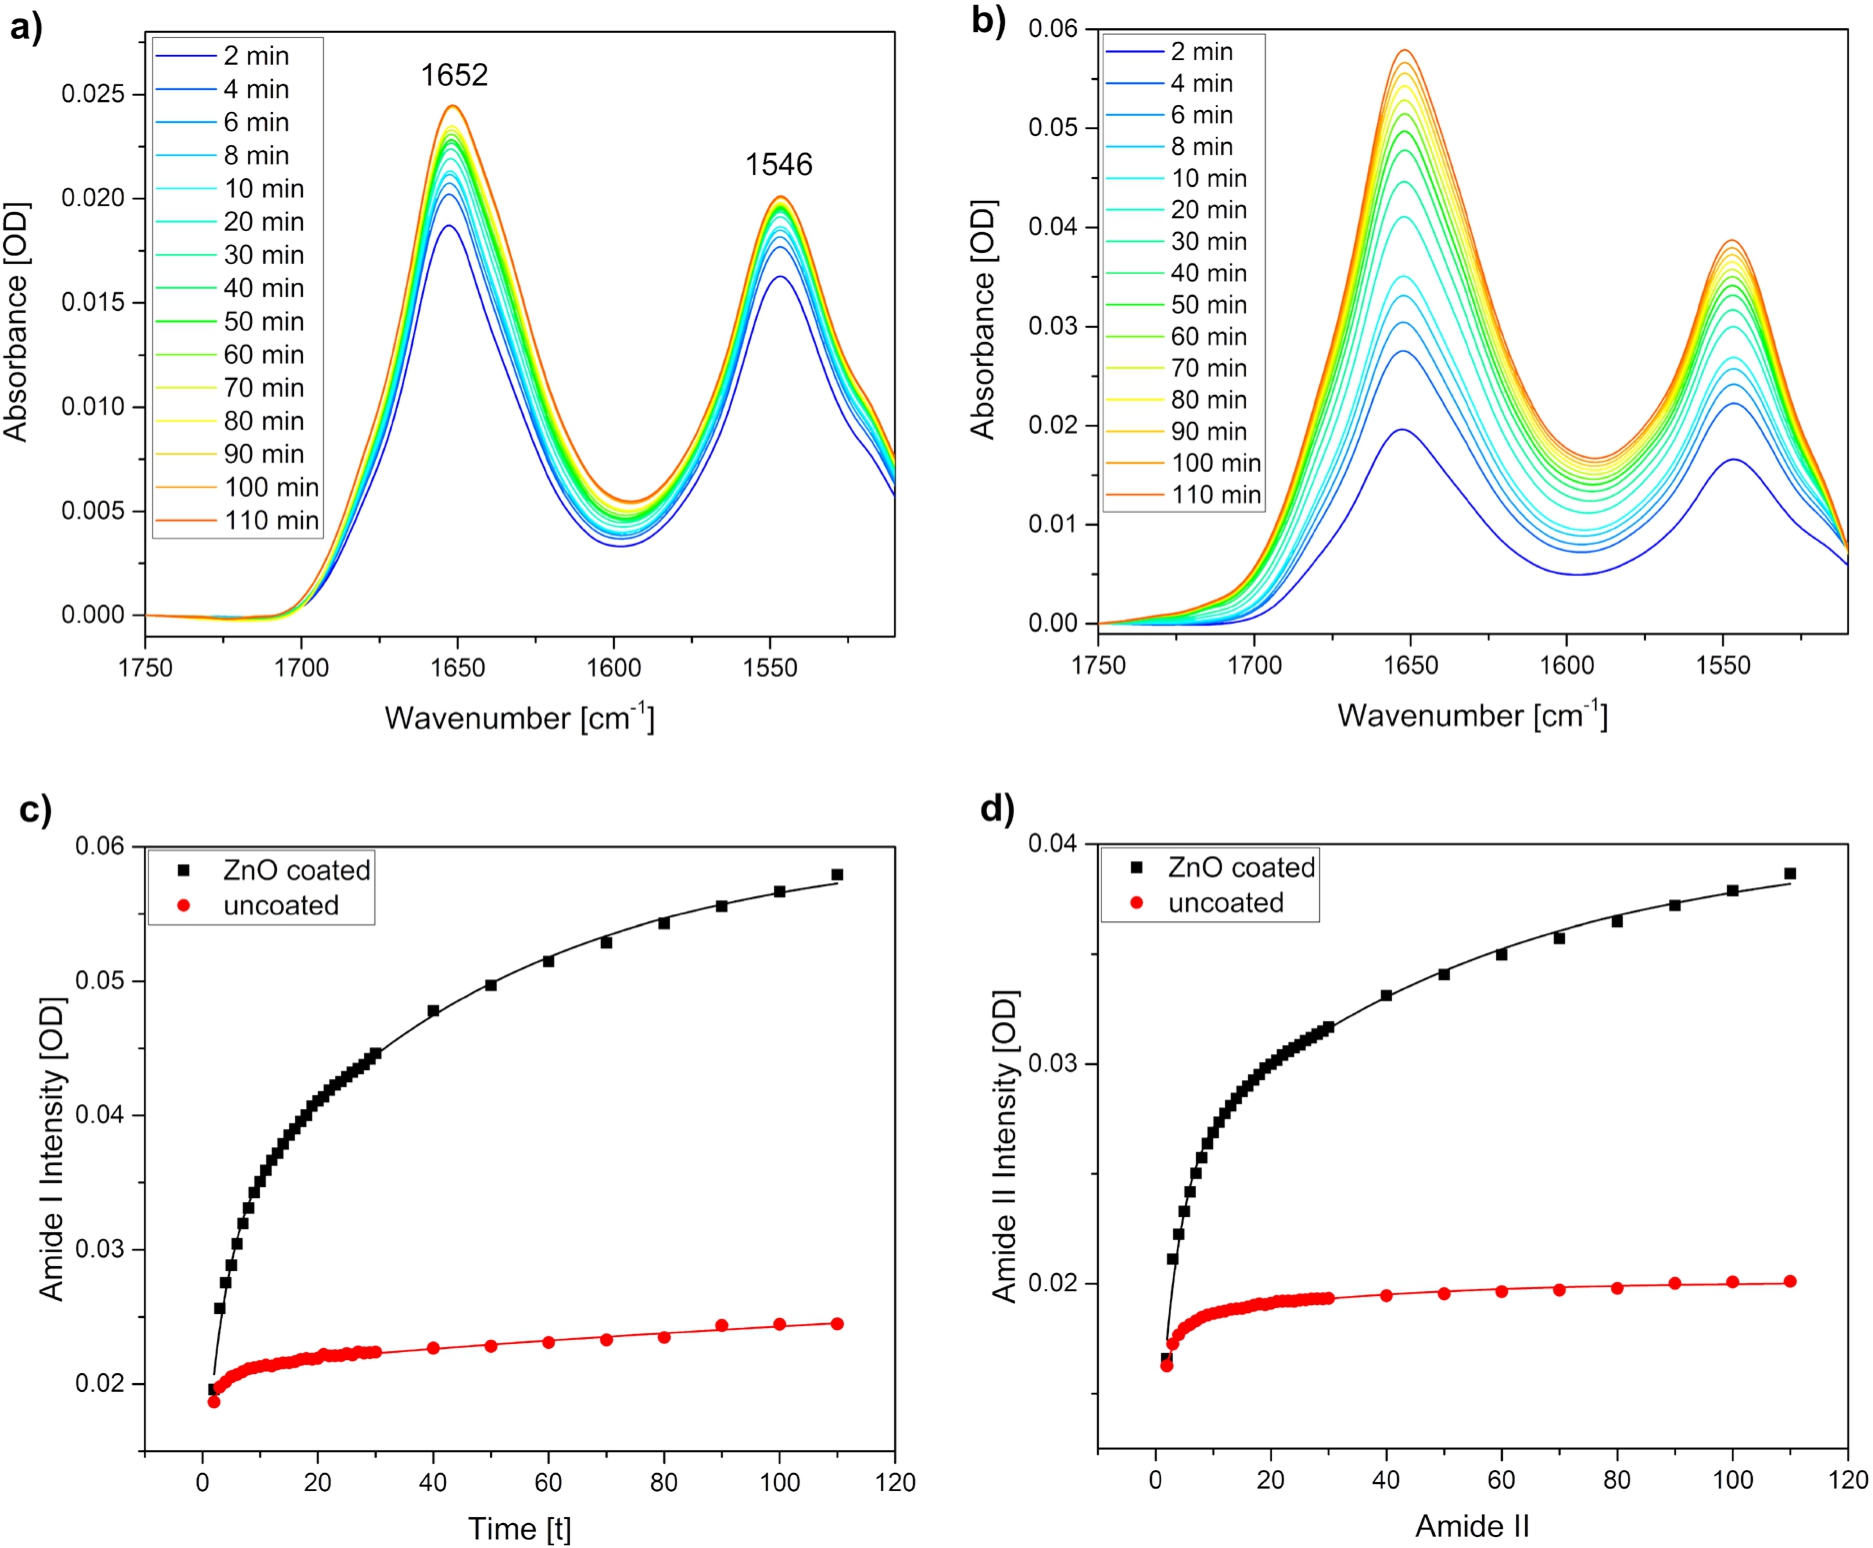
The intensity changes over time were plotted for the amide I (Fig. 3c) and amide II (Fig. 3d) band maxima. The intensity plots show that the adsorption process to the uncoated silicon substrate is completed earlier than to the ZnO film, as the signal reaches earlier a plateau. Moreover, it becomes obvious that the absolute intensities of the amide I and amide II bands are significantly higher for the adsorption of BSA to the ZnO than to the uncoated silicon surface. The same behaviour was also observed for the other studied BSA concentrations (data not shown). Exponential fitting of the signal growth was performed for both amide bands and for both surfaces. While mono-exponential fits did not describe the data well, bi-exponential fitting was more successful what indicates the existence of two processes. We tentatively assign the faster process to the adsorption of BSA to the surface and the slower process to the further assembly of BSA to the previously adsorbed BSA. Other studies have reported spectral changes in CD spectra of BSA during incubation of a BSA solution with ZnO nanoparticles. It was observed that CD bands corresponding to α-helical structure elements decrease during incubation. The changes only affected band intensities and not band shapes, what implies that the overall structure of the protein was preserved [4]. This is in line with our results where no significant changes in the amide I and II band shapes are observed, thus supporting that no larger structural changes are occurring upon adsorption. Another study investigated the differences in adsorption of BSA from phosphate buffered saline to hydrophobic or hydrophilic surfaces and found a stronger adsorption strength on hydrophilic surfaces [9]. This might explain our findings that BSA shows a stronger adsorption to ZnO than to silicon. The abundance of oxygen and OH groups is expected to be higher in ZnO than in silicon, as the latter only contains some native oxide groups [14]. ZnO in contrast shows polar surfaces [13]. It is therefore assumed that ZnO is more capable to bind hydroxide groups in the aqueous surroundings present in this study, thus resulting in a higher surface hydrophilicity.
4.Conclusions
ATR-FTIR spectroscopy is an appropriate method to study adsorption processes of proteins on surfaces. The ATR crystal itself provides a surface, but can furthermore be coated with other materials. We explored a suitable approach to synthesize a ZnO thin film on a silicon ATR crystal. Due to the mild synthesis conditions, this method is less aggressive towards the substrate and easily accessible. We investigated the adsorption process of BSA to ZnO and plain silicon surfaces using a flow-through system. A larger amount of BSA was adsorbed to ZnO than to the plain silicon surface. Furthermore, a stronger binding affinity was observed by desorption experiments. Protein structural changes upon adsorption were monitored by time-dependent amide I and II spectra. No significant structural changes were observed for BSA adsorption to ZnO and silicon surfaces.
Acknowledgements
This work was supported by the Deutsche Forschungsgemeinschaft (SFB 1214, project A3).
Conflict of interest
The authors have no conflict of interest to report.
References
[1] | R. Ayouchi, Preparation and characterization of transparent ZnO thin films obtained by spray pyrolysis, Thin Solid Films. 426: (1–2) ((2003) ), 68–77. doi:10.1016/S0040-6090(02)01331-7. |
[2] | M.S. Bakshi and How, Surfactants control crystal growth of nanomaterials, Crystal Growth & Design. 16: (2) ((2015) ), 1104–1133. |
[3] | A. Barth, Infrared spectroscopy of proteins, Biochim Biophys Acta. 1767: (9) ((2007) ), 1073–1101. doi:10.1016/j.bbabio.2007.06.004. |
[4] | A. Bhogale et al., Systematic investigation on the interaction of bovine serum albumin with ZnO nanoparticles using fluorescence spectroscopy, Colloids Surf B Biointerfaces. 102: ((2013) ), 257–264. doi:10.1016/j.colsurfb.2012.08.023. |
[5] | K. Cai, J. Bossert and K.D. Jandt, Does the nanometre scale topography of titanium influence protein adsorption and cell proliferation?, Colloids Surf B Biointerfaces. 49: (2) ((2006) ), 136–144. doi:10.1016/j.colsurfb.2006.02.016. |
[6] | R.S. Gautam, A. Samuel, S. Sil, D. Chaturvedi, A. Dutta, F. Ariese and S. Umapathy, Raman and mid-infrared spectroscopic imaging: Applications and advancements, Current Science. 108: (3) ((2015) ), 341–356. |
[7] | E. Goormaghtigh, V. Raussens and J.M. Ruysschaert, Attenuated total reflection infrared spectroscopy of proteins and lipids in biological membranes, Biochimica et Biophysica Acta. 1422: ((1999) ), 105–185. |
[8] | M. Izaki and O. Omi, Characterization of transparent zinc oxide films prepared by electrochemical reaction, Journal of the Electrochemical Society. 144: (6) ((1997) ), 1949–1952. doi:10.1149/1.1837727. |
[9] | Y.L. Jeyachandran et al., Quantitative and qualitative evaluation of adsorption/desorption of bovine serum albumin on hydrophilic and hydrophobic surfaces, Langmuir. 25: (19) ((2009) ), 11614–11620. doi:10.1021/la901453a. |
[10] | B.M. Keyes et al., Infrared spectroscopy of polycrystalline ZnO and ZnO: N thin films, Journal of Crystal Growth. 281: (2–4) ((2005) ), 297–302. doi:10.1016/j.jcrysgro.2005.04.053. |
[11] | P.E. Kolebrander and J. London, Adhere today, here tomorrow: Oral bacterial adherence, Journal of Bacteriology. 175: (11) ((1993) ), 3247–3252. doi:10.1128/JB.175.11.3247-3252.1993. |
[12] | Z. Li, R. Yang, M. Yu, F. Bai, C. Li and Z.L. Wang, Cellular level biocompatibility and biosafety of ZnO nanowires, The Journal of Physical Chemistry C Letters. 112: (51) ((2008) ), 20114–20117. doi:10.1021/jp808878p. |
[13] | D. Mora-Fonz et al., Why are polar surfaces of ZnO stable?, Chemistry of Materials 29: (12) ((2017) ), 5306–5320. |
[14] | M. Morita et al., Growth of native oxide on a silicon surface, Journal of Applied Physics. 68: (3) ((1990) ), 1272–1281. doi:10.1063/1.347181. |
[15] | V.R. Shinde et al., Hydrophobic and textured ZnO films deposited by chemical bath deposition: Annealing effect, Applied Surface Science. 245: (1–4) ((2005) ), 407–413. |
[16] | P. Thevenot, W. Hu and L. Tang, Surface chemistry influence implant biocompatibility, Current Topics in Medicinal Chemistry. 8: (4) ((2008) ), 270–280. doi:10.2174/156802608783790901. |
[17] | S. Xiong et al., Dye adsorption on zinc oxide nanoparticulates atomic-layer-deposited on polytetrafluoroethylene membranes, AIChE Journal. 62: (11) ((2016) ), 3982–3991. doi:10.1002/aic.15293. |
[18] | L. Zhang et al., Investigation into the antibacterial behaviour of suspensions of ZnO nanoparticles (ZnO nanofluids), Journal of Nanoparticle Research 9: (3) ((2006) ), 479–489. doi:10.1007/s11051-006-9150-1. |


