
Impact of a single distance phase retrieval algorithm on spatial resolution in X-ray inline phase sensitive imaging
Abstract
A single-projection based phase retrieval method based on the phase attenuation duality principle (PAD) was used to compare the spatial resolution of the acquired phase sensitive and PAD processed phase retrieved images. An inline phase sensitive prototype was used to acquire the phase sensitive images. The prototype incorporates a micro-focus x-ray source and a flat panel detector with a 50 μm pixel pitch. A phantom composed of a 2 cm thick 50–50 adipose-glandular mimicking slab sandwiched with a 0.82 cm thick slanted PMMA sharp edge was used. Phase sensitive image of the phantom was acquired at 120 kV, 3.35 mAs with a 16 μm tube focal spot size under a geometric magnification (M) of 2.5. The PAD based method was applied to the acquired phase sensitive image for the retrieval of phase values. With necessary data processing, modulation transfer function (MTF) curves were determined for the estimation and comparison of the spatial resolution. The PAD processed phase retrieved values of the phantom were in good agreement with the theoretically calculated values. Phase sensitive images showed higher spatial resolution at all spatial frequencies compared to the phase retrieved images. It was noted that the high-frequency signal components in the retrieved image were suppressed that resulted in lower MTF values. When compared to the phase sensitive image, the cutoff resolution (10% MTF) for phase retrieved image dropped 32% from 15.6 lp/mm (32 μm) to 10.6 lp/mm (47 μm). The resolution offered by this phase sensitive prototype is radiographically enough to detect breast cancer.
Key Abbreviations and Symbols
(PAD) | Phase Attenuation Duality |
(FPP) | Fresnel propagator phase |
(β) | Linear attenuation coefficients |
(δ) | Refractive index decrement |
( | Projected electron density |
(MTF) | Modulation Transfer Function |
1.Introduction
In-line phase sensitive imaging technique (also known as propagation-based phase sensitive imaging) has demonstrated its value as compared to the attenuation-based imaging [1–8]. Experimentally, this technique is the simplest to because its setup does not involve any optical element introduced between the sample and detector [9–11]. However, data processing required for extracting an object’s phase map from the measured intensity is very complicated for this technique. Theoretically, the x-ray intensity arriving at the detector plane I (
Both the attenuation and phase maps are differentially encoded with each other in the projection intensity
One of the methods of single-projection-based retrieval works correctly for a single material sample if the linear attenuation coefficients (β) and refractive index decrement (δ) of that material are known in advance [23]. In such special cases, the phase map of a single-material sample can be retrieved from just a single-phase sensitive projection of the sample. While this phase retrieval method is robust, the stringent requirement on the material homogeneity and prior knowledge of material’s δ and β limits its applicability. Another single-projection based retrieval method that utilizes the phase-attenuation duality (PAD) principle has been developed [24–26] and has been applied in various medical imaging studies [27–35]. This method is applicable when samples that are composed of light chemical elements with atomic number (Z)<10 are imaged with high energy x-rays (60–500 keV). With this method, one can retrieve the sample’s phase map using just a single-phase sensitive projection of the sample, without requiring any prior information of the sample’s δ and β at all. Another advantage of this method is its applicability with the multi-material samples. When low Z materials are imaged with high-energy x-rays, the x-ray-matter interactions are dominated by the Compton scattering. Hence, both the tissue attenuation (
Under such conditions, the phase-shift map can be retrieved from just a single-phase sensitive image as
In Eq. (7),
With the application of any image processing method on medical images, the impact of spatial resolution must be investigated. To the best of our knowledge, no comprehensive investigation of the impact of PAD based method on the spatial resolution has been performed. In this study, a phantom’s phase values retrieved experimentally by the PAD-based method are compared with the theoretically calculated phase values. Furthermore, the impact of this retrieval method on spatial resolution is studied by measuring the modulation transfer function (MTF). The measurement of MTF has been widely accepted for characterizing and quantifying the imaging performance of various imaging modalities. The calculation of MTF can be determined by normalizing the absolute value of the Fourier transform of the point spread function (PSF) or line spread function (LSF). By utilizing a sharp edge phantom, the edge spread function (ESF) can be acquired and then differentiated to obtain the LSF.
2.Materials and methods
2.1.Phase-sensitive imaging prototype
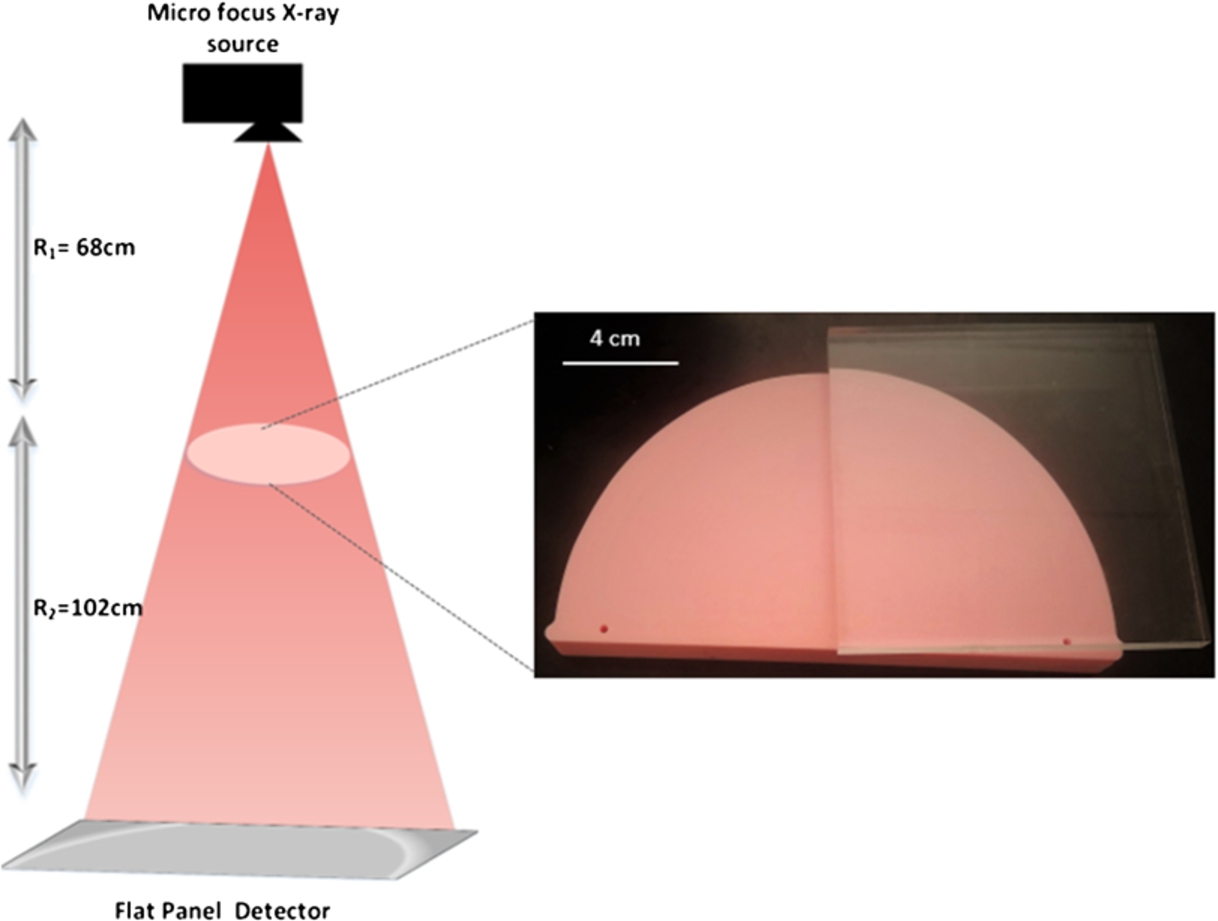
A benchtop inline phase sensitive x-ray imaging prototype was used for the acquisition of the phantom images. Details on the characterization of this prototype can be found elsewhere [29,30]. In summary, the prototype incorporates a microfocus x-ray source with a tungsten (W) target and a CMOS flat panel detector with an active area of 120 mm × 120 mm and 50 μm pixel pitch. The source to object distance was 68 cm while the source to image detector distance was 170 cm which corresponded to a magnification (M) factor of 2.5. The phase sensitive images of the phantom were acquired at 120 kV, 67 μA, 3.3 mAs with a focal spot (F) size of 16 μm. A 2.5 mm thick aluminum (Al) filter was utilized to harden the beam and block the low energy photons. These specific geometric and acquisition parameters are the optimized settings for this prototype operating with high energy x-rays for the acquisition of soft tissue and its equivalent materials [36]. In utilizing the polychromatic microfocus x-ray tube, it was necessary to approximate the values of the average wavelength (λ) and the Klein–Nishina total cross-section (
2.2.Phantom
A phantom composed of a 2 cm thick slab mimicking a 50% glandular-50% adipose density sandwiched with a 0.82 cm thick polymethyl methacrylate (PMMA) was used for imaging. Both the 50–50 slab and PMMA were manufactured by Gammex (Middleton, WI, USA). The 50–50 slab is composed of the epoxy resin (C21H25CIO5) that simulates the attenuation properties of breast tissue to x-rays. The 50–50 slab and PMMA (C5O2H8)n are composed of chemical elements with Z<10, thus, the requirement of applying the phase-attenuation duality is readily met. The combination of the 50–50 slab and PMMA makes the phantom multi-material, and the efficacy of this phase retrieval method can be fully realized. Laser cutting technique was used for the fabrication of a sharp edge to ensure reliable measurements of the spatial resolution. The schematics of the phase sensitive prototype along with the image of the phantom are shown in Fig. 1.
Fig. 1.
Schematics of the inline phase sensitive x-ray imaging prototype illustrating a micro-focus x-ray source, a flat panel detector and a 2.82 cm thick phantom placed in a magnification geometry.
2.3.MTF calculations
The PMMA edge was aligned to the source focal spot size and was slightly tilted (3° ∼ 5°) for the generation of oversampled ESF that had a data interval smaller than the size of the pixel pitch [37,38]. Using the Hough transformation [39–41], the edge angle was estimated to be 3.2° on both phase sensitive and phase retrieved images. A fixed window (W) of 4 elements was convolved with the raw ESF to get the smoothed ESF as
Then, the line spread function, LSF(X), was computed by differentiating the
3.Results
The phase sensitive image of the 50–50 slab-PMMA edge phantom acquired by the prototype and the retrieved image (
Fig. 2.
(a) phase sensitive image of the 50–50 slab-PMMA edge phantom acquired with the prototype (b) retrieved image (
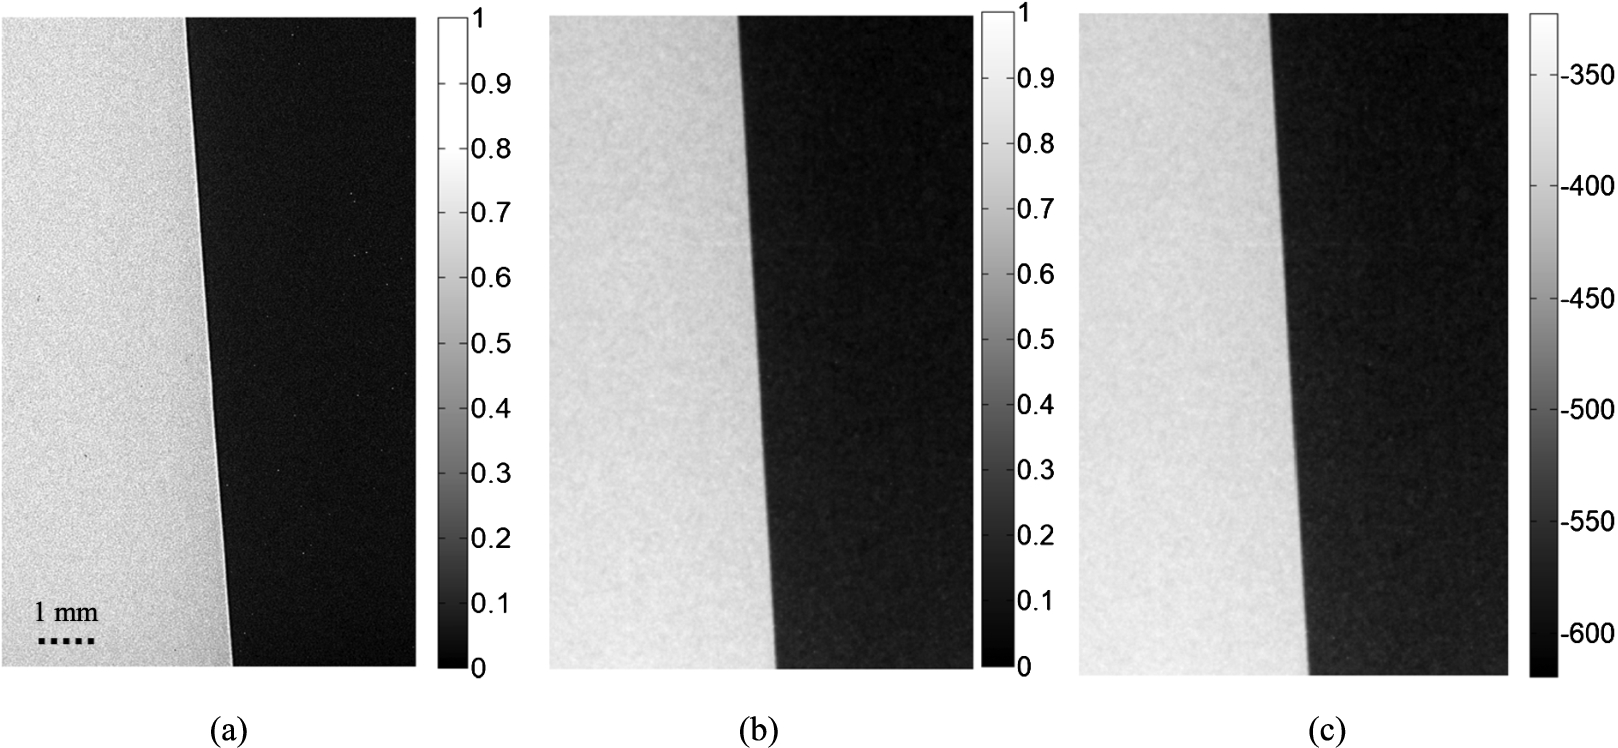
Note that with the PAD method, the phase retrieved map reported an average value of
Theoretically, the amount of phase shift along a ray can be calculated as
Table 1
Comparison of theoretical and retrieved phase values for the phantom
| Material type values (radians) | Theoretical phase values (radians) | Phase retrieved | % Error |
| 2 cm 50–50 slab | 2.63 | ||
| 2.82 cm Combo | 5.1 | ||
| 0.82 cm PMMA | 10.2 |
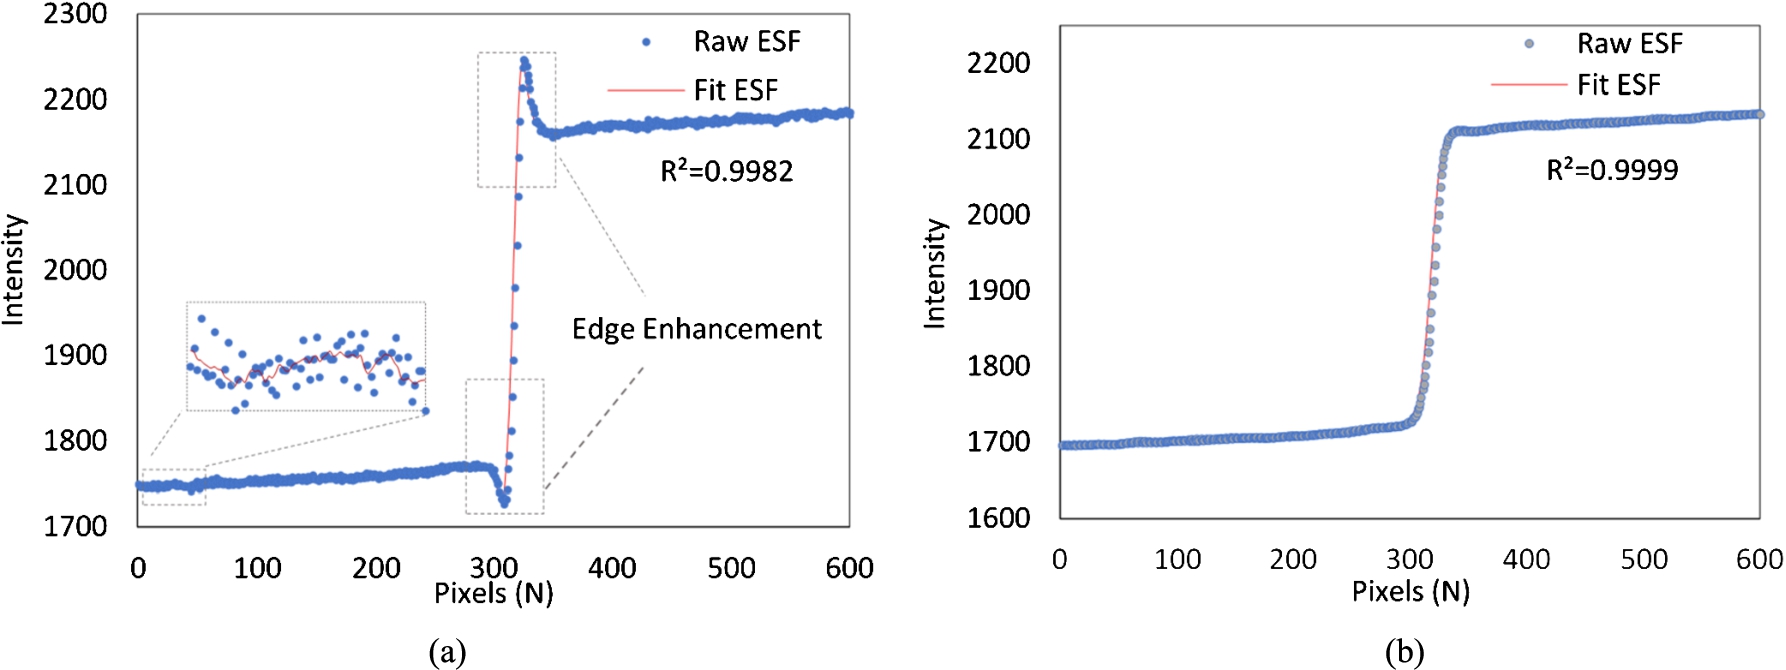
On the phase sensitive image, the overshooting at the boundaries are clearly seen. As the distorted wave-front propagates sufficiently far, the small differences in phase shifts of the wavefront cause interference patterns which causes edge enhancements (dark-bright fringes) at boundaries between components of varying phase shift coefficients. These interference patterns are not visible after the application of the phase retrieval method on the phase sensitive image. The oversampled ESFs evaluated across the sharp PMMA-air edge for both the phase sensitive and PAD processed images are given in Fig. 3. The application of Eq. (6) to raw ESF generates smooth ESF curves with a high coefficient of determination (
Fig. 3.
Oversampled edge spread functions (ESFs) obtained from the (a) phase sensitive image (b) phase retrieved image. The results of applying the window function to the raw ESF are zoomed in 3(a).
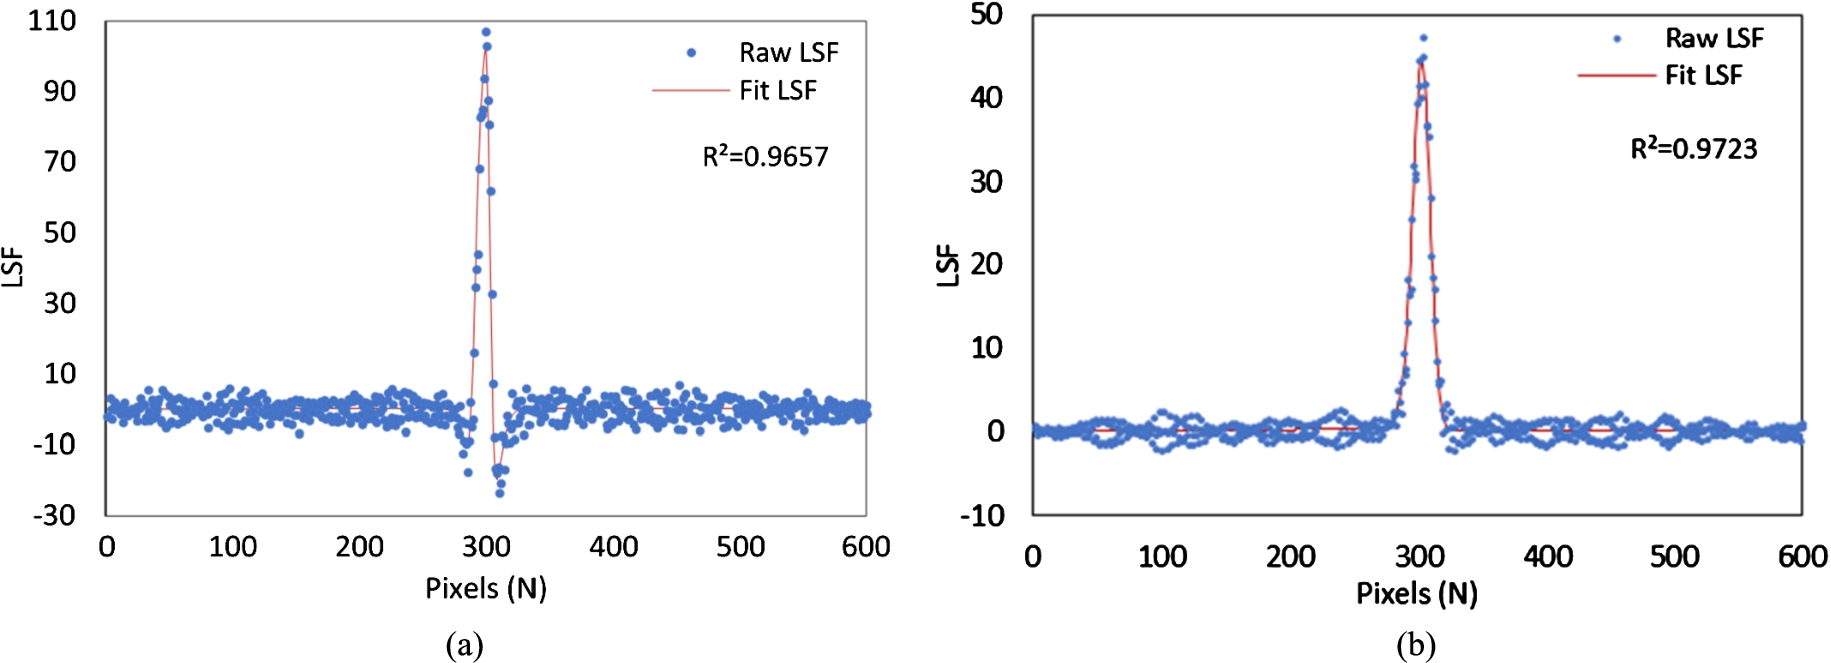
The differentiation of ESF curves produces LSF curves as shown in Fig. 4. The raw LSF curves were fitted using the Gaussian function given by Eqn. (7), generating the fitted LSF curves with high
Fig. 4.
Line spread functions (LSFs) obtained for the (a) phase sensitive image (b) phase retrieved image.
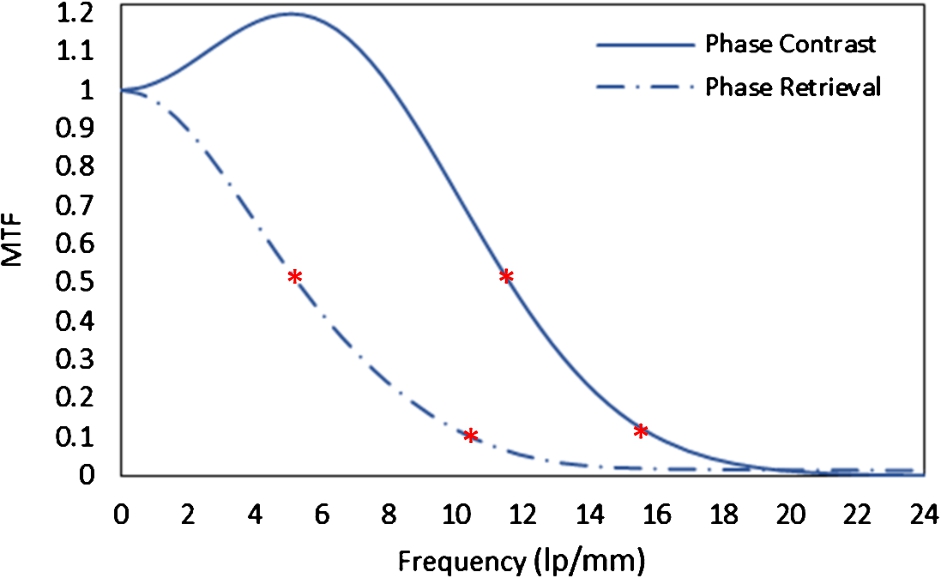
The MTF curves for phase sensitive and phase retrieved images are given in Fig. 5. On the phase sensitive image, the interference patterns occurring at the boundaries between components of varying phase shift coefficients results in the amplification of signals in the mid-frequencies. The recorded resolutions for the two images at 50% MTF are 11.5 lp/mm and 5.3 lp/mm; while 15.6 lp/mm and 10.6 lp/mm are reported at 10% MTF for the phase sensitive and phase retrieval imaging.
Fig. 5.
Modulation transfer function (MTF) curves for the phase sensitive and phase retrieved images. The asterisk (*) signs show the frequencies corresponding to 50% and 10% MTF values.
4.Discussion
Phase-contrast imaging has shown its value in the preclinical imaging studies, and there has been a rapid acceleration over the past few years towards its clinical implementation [7,9,42–45]. Experimentally, the in-line phase sensitive imaging is the most straightforward technique to implement. A necessary sample to detector distance is required to let the distorted wave propagate and diffract. This technique also works with polychromatic x-ray sources. One of the important goals for phase sensitive imaging is to get quantitative information such as tissue’s electron density and phase retrieval methods can yield that information. Depending on the sample’s composition, phase retrieval methods can be applied to a single-phase sensitive image. One such method is based on phase-attenuation duality (PAD) principle.
Without the prior information of δ and β of the multi-material phantom, PAD based method retrieved the phase numbers of the phantom which were within 2–10% of the theoretically calculated phase values. It was noted that with the PAD-based method, high-frequency signal components in the retrieved image were suppressed that resulted in lower MTF values. Mathematically, the Laplacian operator in Eqn (4) makes the denominator very large, thus, excessively suppressing high-frequency components in the resultant image. For example, the cutoff resolution (10% MTF) suggest that the smallest detectable details on phase retrieved and phase sensitive images were 47 μm and 31 μm. Yet, the retrieved image’s noise power spectrum (NPS) suggests that there is also suppression of high-frequency noise component. The comparison of NPS is beyond the scope of this topic and will be presented in a future study. It has been shown in the previous studies that the PAD-based method yielded images with an improvement of at least three times higher contrast to noise ratios (CNRs) than the phase sensitive images of biological samples [29–33]. In this study, the CNR values for the phantom were 24 and 66 for the phase sensitive and phase retrieved images.
The polychromatic beam has a contribution of different photon energies and thus, the approximate values of λ and
It is worth to mention that the phase sensitive imaging technique has been adapted to visualize materials with weak attenuation coefficients. The traditional spatial resolution measurements employ a highly attenuating sharp edge or wire composed of a metal. For a metal, the phase effects are not visualized under the diagnostic energy range. These phase effects are the edge enhancements (dark-bright fringes) that occur at the boundaries between components of varying phase shift coefficients. Furthermore, if a metal like tungsten (W) was to be utilized under 60 keV, the ratio of
The CT reconstruction performed directly with the phase sensitive projections offers an advantage in analyzing the structural inner and outer contours of weakly attenuating tissues. However, these tomograms would not be the maps of the linear attenuation coefficients (LACs) of the tissues. Instead, they may present unusually large or even negative LAC values at interfaces between different tissues [50]. Phase retrieval decodes the phase map from a given phase sensitive projection, and then the 3D images are reconstructed to enhance image contrast and enable to extract quantitative information such as tissue electron density and the so-called phase number [51]. Hence, any phase retrieval method must not degrade the spatial resolution to a great extent so that one could get refined phase maps and tissue’s electron density (
With a tube focus spot of 16 μm, the induced edge gradient blurring is 24 μm according to the relation
Acknowledgements
The research reported in the publication was supported by the National Cancer Institute of the National Institutes of Health under Award Number R01CA193378. The content is solely the responsibility of the authors and does not necessarily represent the official views of the National Institute of Health. We would like to acknowledge the support of Charles and Jean Smith Chair endowment fund as well.
References
[1] | E. Castelli, M. Tonutti, F. Arfelli, R. Longo, E. Quaia, L. Rigon, D. Sanabor et al., Mammography with synchrotron radiation: First clinical experience with phase-detection technique, Radiology 259: (3) ((2011) ), 684–694. doi:10.1148/radiol.11100745. |
[2] | M.B. Szafraniec, A.C. Konstantinidis, G. Tromba, D. Dreossi, S. Vecchio, L. Rigon, N. Sodini et al., Synchrotron based planar imaging and digital tomosynthesis of breast and biopsy phantoms using a CMOS active pixel sensor, Physica Medica 31: (2) ((2015) ), 192–198. doi:10.1016/j.ejmp.2014.11.003. |
[3] | K. Bliznakova, P. Russo, Z. Kamarianakis, G. Mettivier, H. Requardt, A. Bravin and I. Buliev, In-line phase-contrast breast tomosynthesis: A phantom feasibility study at a synchrotron radiation facility, Physics in Medicine & Biology 61: (16) ((2016) ), 6243. doi:10.1088/0031-9155/61/16/6243. |
[4] | P. Baran, S. Pacile, Y.I. Nesterets, S.C. Mayo, C. Dullin, D. Dreossi, F. Arfelli et al., Optimization of propagation-based x-ray phase-contrast tomography for breast cancer imaging, Physics in Medicine & Biology 62: (6) ((2017) ), 2315. doi:10.1088/1361-6560/aa5d3d. |
[5] | S.W. Wilkins, Y.I. Nesterets, T.E. Gureyev, S.C. Mayo, A. Pogany and A.W. Stevenson, On the evolution and relative merits of hard x-ray phase-contrast imaging methods, Phil. Trans. R. Soc. A 372: (2010) ((2014) ), 20130021. doi:10.1098/rsta.2013.0021. |
[6] | S.W. Wilkins, Y.I. Nesterets, T.E. Gureyev, S.C. Mayo, A. Pogany and A.W. Stevenson, On the evolution and relative merits of hard x-ray phase-contrast imaging methods, Phil. Trans. R. Soc. A 372: (2010) ((2014) ), 20130021. doi:10.1098/rsta.2013.0021. |
[7] | R. Longo, M. Tonutti, L. Rigon, F. Arfelli, D. Dreossi, E. Quai, F. Zanconati, E. Castelli, G. Tromba and M.A. Cova, Clinical study in phase-contrast mammography: Image-quality analysis, Phil. Trans. R. Soc. A 372: (2010) ((2014) ), 20130025. doi:10.1098/rsta.2013.0025. |
[8] | A. Horng, E. Brun, A. Mittone, S. Gasilov, L. Weber, T. Geith, S. Adam-Neumair et al., Cartilage and soft tissue imaging using X-rays: Propagation-based phase-contrast computed tomography of the human knee in comparison with clinical imaging techniques and histology, Investigative Radiology 49: (9) ((2014) ), 627–634. doi:10.1097/RLI.0000000000000063. |
[9] | A. Bravin, P. Coan and P. Suortti, X-ray phase-contrast imaging: From pre-clinical applications towards clinics, Physics in Medicine & Biology 58: (1) ((2012) ), R1. |
[10] | A. Snigirev, I. Snigireva, V. Kohn, S. Kuznetsov and I. Schelokov, On the possibilities of x-ray phase contrast microimaging by coherent high-energy synchrotron radiation, Review of Scientific Instruments 66: (12) ((1995) ), 5486–5492. doi:10.1063/1.1146073. |
[11] | S.W. Wilkins, T. Ei Gureyev, D. Gao, A. Pogany and A.W. Stevenson, Phase-contrast imaging using polychromatic hard X-rays, Nature 384: (6607) ((1996) ), 335. doi:10.1038/384335a0. |
[12] | X. Wu and H. Liu, A general theoretical formalism for X-ray phase contrast imaging, Journal of X-Ray Science and Technology 11: (1) ((2003) ), 33–42. |
[13] | X. Wu and H. Liu, Clinical implementation of x-ray phase-contrast imaging: Theoretical foundations and design considerations, Medical Physics 30: (8) ((2003) ), 2169–2179. doi:10.1118/1.1593836. |
[14] | X. Wu and H. Liu, A new theory of phase-contrast x-ray imaging based on Wigner distributions, Medical Physics 31: (9) ((2004) ), 2378–2384. doi:10.1118/1.1776672. |
[15] | P. Tafforeau, R. Boistel, E. Boller, A. Bravin, M. Brunet, Y. Chaimanee, P. Cloetens et al., Applications of X-ray synchrotron microtomography for non-destructive 3D studies of paleontological specimens, Applied Physics A 83: (2) ((2006) ), 195–202. doi:10.1007/s00339-006-3507-2. |
[16] | X. Wu and A. Yan, Phase retrieval from one single phase contrast x-ray image, Optics Express 17: (13) ((2009) ), 11187–11196. doi:10.1364/OE.17.011187. |
[17] | L.J. Allen and M.P. Oxley, Phase retrieval from series of images obtained by defocus variation, Optics Communications 199: (1–4) ((2001) ), 65–75. doi:10.1016/S0030-4018(01)01556-5. |
[18] | K.A. Nugent, X-ray noninterferometric phase imaging: A unified picture, JOSA A 24: (2) ((2007) ), 536–547. doi:10.1364/JOSAA.24.000536. |
[19] | A. Burvall, U. Lundström, P.A.C. Takman, D.H. Larsson and H.M. Hertz, Phase retrieval in X-ray phase-contrast imaging suitable for tomography, Optics Express 19: (11) ((2011) ), 10359–10376. doi:10.1364/OE.19.010359. |
[20] | A. Yan, X. Wu and H. Liu, Robustness of phase retrieval methods in x-ray phase contrast imaging: A comparison, Medical Physics 38: (9) ((2011) ), 5073–5080. doi:10.1118/1.3618731. |
[21] | T. Weitkamp, D. Haas, D. Wegrzynek and A. Rack, ANKAphase: Software for single-distance phase retrieval from inline X-ray phase-contrast radiographs, Journal of Synchrotron Radiation 18: (4) ((2011) ), 617–629. doi:10.1107/S0909049511002895. |
[22] | R.C. Chen, H.L. Xie, L. Rigon, R. Longo, E. Castelli and T.Q. Xiao, Phase retrieval in quantitative x-ray microtomography with a single sample-to-detector distance, Optics Letters 36: (9) ((2011) ), 1719–1721. doi:10.1364/OL.36.001719. |
[23] | D. Paganin, S.C. Mayo, T.E. Gureyev, P.R. Miller and S.W. Wilkins, Simultaneous phase and amplitude extraction from a single defocused image of a homogeneous object, Journal of Microscopy 206: (1) ((2002) ), 33–40. doi:10.1046/j.1365-2818.2002.01010.x. |
[24] | R.C. Chen, L. Rigon and R. Longo, Comparison of single distance phase retrieval algorithms by considering different object composition and the effect of statistical and structural noise, Optics Express 21: (6) ((2013) ), 7384–7399. doi:10.1364/OE.21.007384. |
[25] | X. Wu, H. Liu and A. Yan, X-ray phase-attenuation duality and phase retrieval, Optics Letters 30: (4) ((2005) ), 379–381. doi:10.1364/OL.30.000379. |
[26] | X. Wu and H. Liu, X-ray cone-beam phase tomography formulas based on phase-attenuation duality, Optics Express 13: (16) ((2005) ), 6000–6014. doi:10.1364/OPEX.13.006000. |
[27] | H. Liu, Y. Ren, H. Guo, Y. Xue, H. Xie, T. Xiao and X. Wu, Phase retrieval for hard X-ray computed tomography of samples with hybrid compositions, Chinese Optics Letters 10: (12) ((2012) ), 121101–121101. doi:10.3788/COL201210.121101. |
[28] | X. Guo, X. Liu, M. Gu, C. Ni, S. Huang and B. Liu, Polychromatic X-ray in-line phase-contrast tomography for soft tissue, EPL (Europhysics Letters) 98: (1) ((2012) ), 14001. doi:10.1209/0295-5075/98/14001. |
[29] | Wong, M. Donovan, A. Yan, M. Ghani, Y. Li, L. Fajardo, X. Wu and H. Liu, Dose and detectability improvements with high energy phase sensitive x-ray imaging in comparison to low energy conventional imaging, Physics in Medicine & Biology 59: (9) ((2014) ), N37. doi:10.1088/0031-9155/59/9/N37. |
[30] | M.U. Ghani, M.D. Wong, D. Wu, B. Zheng, L.L. Fajardo, A. Yan, J. Fuh, X. Wu and H. Liu, Detectability comparison between a high energy x-ray phase sensitive and mammography systems in imaging phantoms with varying glandular-adipose ratios, Physics in Medicine & Biology 62: (9) ((2017) ), 3523. doi:10.1088/1361-6560/aa644b. |
[31] | H. Liu, X. Wu and T. Xiao, Synchrotron-based high-energy x-ray phase sensitive microtomography for biomedical research, Medical Physics 42: (10) ((2015) ), 5595–5603. doi:10.1118/1.4929551. |
[32] | H. Liu, C. Zhang, X. Fan, Y. Duan, T. Xiao, G. Du, Y. Fu, H. Liu and H. Wen, Robust phase-retrieval-based X-ray tomography for morphological assessment of early hepatic echinococcosis infection in rats, PloS ONE 12: (9) ((2017) ), e0183396. doi:10.1371/journal.pone.0183396. |
[33] | D. Wu, A. Yan, Y. Li, M.D. Wong, B. Zheng, X. Wu and H. Liu, Characterization of a high-energy in-line phase contrast tomosynthesis prototype, Medical Physics 42: (5) ((2015) ), 2404–2420. doi:10.1118/1.4917227. |
[34] | P.-C. Lee, Phase retrieval method for in-line phase contrast x-ray imaging and denoising by regularization, Optics Express 23: (8) ((2015) ), 10668–10679. doi:10.1364/OE.23.010668. |
[35] | H. Liu, T. Xiao, H. Xie, Y. Fu, X. Zhang and X. Fan, Nondestructive material characterization of meteorites with synchrotron-based high energy x-ray phase micro-computed tomography, Journal of Physics D: Applied Physics 50: (5) ((2017) ), 055301. doi:10.1088/1361-6463/aa4f31. |
[36] | M.U. Ghani, A. Yan, M.D. Wong, Y. Li, L. Ren, X. Wu and H. Liu, Low dose high energy x-ray in-line phase sensitive imaging prototype: Investigation of optimal geometric conditions and design parameters, Journal of X-Ray Science and Technology 23: (6) ((2015) ), 667–682. doi:10.3233/XST-150519. |
[37] | E. Samei, M.J. Flynn and D.A. Reimann, A method for measuring the presampled MTF of digital radiographic systems using an edge test device, Medical Physics 25: (1) ((1998) ), 102–113. doi:10.1118/1.598165. |
[38] | E. Buhr, S. Günther-Kohfahl and U. Neitzel, Accuracy of a simple method for deriving the presampled modulation transfer function of a digital radiographic system from an edge image, Medical Physics 30: (9) ((2003) ), 2323–2331. doi:10.1118/1.1598673. |
[39] | E. Samei and M.J. Flynn, An experimental comparison of detector performance for direct and indirect digital radiography systems, Medical Physics 30: (4) ((2003) ), 608–622. doi:10.1118/1.1561285. |
[40] | Z. Zhou, F. Gao, H. Zhao, L. Zhang, L. Ren, Z. Li, M.U. Ghani and H. Liu, Monotone spline regression for accurate MTF measurement at low frequencies, Optics Express 22: (19) ((2014) ), 22446–22455. doi:10.1364/OE.22.022446. |
[41] | L. Ren, Z. Zhou, M.U. Ghani, Y. Li and H. Liu, Method for determining the modulation transfer function of X-ray fluorescence mapping system, Optics Express 22: (18) ((2014) ), 21199–21213. doi:10.1364/OE.22.021199. |
[42] | M. Stampanoni, Z. Wang, T. Thüring, C. David, E. Roessl, M. Trippel, R.A. Kubik-Huch, G. Singer, M.K. Hohl and N. Hauser, The first analysis and clinical evaluation of native breast tissue using differential phase-contrast mammography, Investigative Radiology 46: (12) ((2011) ), 801–806. doi:10.1097/RLI.0b013e31822a585f. |
[43] | Z. Wang, N. Hauser, G. Singer, M. Trippel, R.A. Kubik-Huch, C.W. Schneider and M. Stampanoni, Non-invasive classification of microcalcifications with phase-contrast X-ray mammography, Nature Communications 5: ((2014) ), 3797. doi:10.1038/ncomms4797. |
[44] | A. Momose, W. Yashiro, K. Kido, J. Kiyohara, C. Makifuchi, T. Ito, S. Nagatsuka et al., X-ray phase imaging: From synchrotron to hospital, Phil. Trans. R. Soc. A 372: (2010) ((2014) ), 20130023. doi:10.1098/rsta.2013.0023. |
[45] | M.U. Ghani, M.D. Wong, F.H. Omoumi, B. Zheng, L.L. Fajardo, A. Yan, X. Wu and H. Liu, Detectability comparison of simulated tumors in digital breast tomosynthesis using high-energy X-ray inline phase sensitive and commercial imaging systems, Physica Medica 47: ((2018) ), 34–41. doi:10.1016/j.ejmp.2018.02.012. |
[46] | CSIRO – website, https://ts-imaging.net/Services/Simple/ICUtilXdata.aspx (accessed 10.26.2017). |
[47] | J.M. Boone, Determination of the presampled MTF in computed tomography, Medical Physics 28: (3) ((2001) ), 356–360. doi:10.1118/1.1350438. |
[48] | M. Ohkubo, S. Wada, A. Kayugawa, T. Matsumoto and K. Murao, Image filtering as an alternative to the application of a different reconstruction kernel in CT imaging: Feasibility study in lung cancer screening, Medical Physics 38: (7) ((2011) ), 3915–3923. doi:10.1118/1.3590363. |
[49] | J.G. Ott, F. Becce, P. Monnin, S. Schmidt, F.O. Bochud and F.R. Verdun, Update on the non-prewhitening model observer in computed tomography for the assessment of the adaptive statistical and model-based iterative reconstruction algorithms, Physics in Medicine & Biology 59: (15) ((2014) ), 4047. doi:10.1088/0031-9155/59/4/4047. |
[50] | X. Wu and H. Liu, X-ray cone-beam phase tomography formulas based on phase-attenuation duality, Optics Express 13: (16) ((2005) ), 6000–6014. doi:10.1364/OPEX.13.006000. |
[51] | X. Wu, H. Liu and A. Yan, Phase-contrast X-ray tomography: Contrast mechanism and roles of phase retrieval, European Journal of Radiology 68: (3) ((2008) ), S8–S12. |
[52] | A. Sarno, G. Mettivier, B. Golosio, P. Oliva, G. Spandre, F. Di Lillo, C. Fedon, R. Longo and P. Russo, Imaging performance of phase-contrast breast computed tomography with synchrotron radiation and a CdTe photon-counting detector, Physica Medica 32: (5) ((2016) ), 681–690. doi:10.1016/j.ejmp.2016.04.011. |
[53] | J.T. Bushberg and J.M. Boone, The Essential Physics of Medical Imaging. Chapter-7, Lippincott Williams & Wilkins, (2011) , pp. 208–209. |


