
Recent advancements of EC-QCL based mid-IR transmission spectroscopy of proteins and application to analysis of bovine milk1
Abstract
Background:
High emission powers of external cavity-quantum cascade laser (EC-QCL) light sources allow to employ significantly larger path lengths for infrared (IR) transmission measurements compared to conventional Fourier-transform infrared (FTIR) measurements employing thermal emitters.
Objective:
An EC-QCL based IR transmission setup is presented as a viable alternative for analysis of proteins in both, academic protein structure studies as well as in process analytical applications. Here, the application of EC-QCL based IR transmission spectroscopy is introduced for i) monitoring of the protein secondary structure and ii) rapid screening of the thermal history of commercial milk samples without prior sample preparation.
Methods:
Proteins present in milk were measured by QCL-IR and FTIR spectroscopy and spectra were compared. Dynamic conformational changes were followed by QCL-IR spectroscopy after chemical denaturation. Sixteen commercial milk samples were surveyed by QCL-IR spectroscopy and classified according to the experienced heat load during processing.
Results:
The 4–5 times higher applicable transmission path length (38 μm for QCL-IR vs. 8 μm for FTIR measurements) allows robust measurements of the protein amide I band in aqueous solutions. It was shown that IR spectra of the protein amide I band acquired by EC-QCL transmission spectroscopy are comparable to FTIR spectra and the acquired spectra were employed for the study of conformational changes in protein standard solutions. Furthermore, a classification analysis of commercial bovine milk samples based on their thermal history was accomplished.
Conclusions:
The potential application of EC-QCL IR spectroscopy was demonstrated as a tool for following conformational changes of the secondary protein structure as well as for fast screening to estimate the heat load applied to commercial milk.
1.Introduction
The low feasible path lengths for FTIR transmission measurements of proteins in aqueous solution are a considerable impairment for the robustness of analysis and impede flow-through measurements and high-throughput applications. This is particularly the case for liquids with high viscosity and complex matrix composition, such as milk, that features a diverse chemical makeup involving fat, protein and lactose [1]. When milk is inserted into a liquid cell with low optical paths, it tends to clog or form air bubbles, thus preventing robust sample handling. This experimental constraint arises from the combination of two aspects: first, the HOH-bending band of water near 1645 cm−1 with a high molar absorption coefficient, which overlaps with the protein amide I band; and second, the low emission power provided by conventional thermal light sources (globars) that are used in FTIR spectrometers. As a consequence, most commonly employed path lengths for IR transmission measurements of proteins in aqueous solutions are below 10 μm to avoid total IR absorption in the region of the HOH-bending vibration [19].
As an alternative light source for mid-IR measurements, quantum cascade lasers (QCLs) have been introduced two decades ago [20]. They provide spectral power densities several orders of magnitude higher than thermal light [48], rendering these light sources highly interesting for measurements of aqueous samples [32,34]. Since then, custom-built setups based on QCLs have gained numerous implementations in mid-IR spectroscopy in process analytical applications as well as in biomedical spectroscopy of gaseous and liquid samples [43]. With the wide commercial availability of external cavity-QCLs (EC-QCLs), that combine a large spectral tuning range with high spectral power densities, this type of light source has progressively been used for investigations of liquid samples [11]. Accordingly, the optical path for transmission measurements could be significantly increased due to the high available emission power [12]. It has been shown that by employing an EC-QCL-based IR transmission setup, the optical path can be increased to 38 μm for IR measurements in aqueous solutions covering the amide I spectral region [3]. Moreover, also EC-QCL-IR measurements of proteins and polypeptides in deuterated buffer solution have been accomplished [42]. Recently, an IR microscope equipped with EC-QCLs became commercially available (Spero, Daylight Solutions), which refuelled the interest in IR spectroscopy for histopathology. It has been successfully applied for protein analysis in human colons [7], breast tissue microarrays [6], and dried human serum [28].
Mid-IR spectroscopy is a well-established analytical technique routinely employed to study the structure of polypeptides and proteins in a label free manner [5]. Vibrations of the polypeptide repeating units of proteins result in nine characteristic group frequencies in the mid-IR region referred to as amide bands. For investigation of the protein secondary structure, the amide I band (1600–1700 cm−1) is most commonly used, which originates from the C=O stretching and N–H in-phase bending vibration of the amide group [19]. The sensitivity to individual secondary structure elements originates in differing patterns of hydrogen bonding, dipole–dipole interactions and geometric orientations in the α-helices, β-sheets, turns and random coil structures that induce different frequencies of the C=O vibrations [4]. It has been shown that based on the analysis of the amide I band, quantitation of individual proteins in a protein mixture can be performed [47].
For analysis of milk, mid-IR spectroscopy has been adopted for the rapid and non-destructive evaluation of different parameters due to its high-throughput capacity, low cost and simplicity [1,18,24]. However, because of the above-discussed restrictions of the optical path, the protein amide I region has not been accessible for FTIR transmission measurements. For quantitative analysis of total protein content in milk, the amide II band is most commonly employed at a path length of ∼50 μm for transmission measurements, usually in combination with multivariate calibration [1,37]. Milk is mainly composed of water, lipids, lactose and proteins, with a total protein content of ∼32 g L−1 for bovine milk [25]. Casein proteins represent approximately 80% of the total protein content in bovine milk, and the remaining 20% belong to whey proteins, of which the most abundant one is β-lactoglobulin (β-LG) with concentrations of approx. 3.8 g L−1 [23,26]. For quantitation of individual milk proteins, methods based on chromatographic [10,39,44] and electrophoretic [44] approaches are employed, that involve time-consuming, wet-chemical sample preparation steps. During commercial milk production, different types of milk are exposed to diverse processing conditions. The most widespread commercially available milk types are pasteurized milk (low heat load), extended shelf life (ESL)-filtered milk (low heat load), ESL-high temperature short time (ESL-HTST) milk (high heat load) as well as ultra-high-temperature (UHT) milk (high heat load), that undergo different thermal treatments resulting in varying shelf life and that are accompanied by flavour and nutrient degradation [27]. It has been found that the concentration of specific proteins, e.g., β-LG, and other species provide information about the thermal history of milk samples [9]. Most recently, the feasibility of quantitation of individual proteins in commercial bovine milk samples by QCL-IR spectroscopy without any prior sample preparation has been demonstrated in combination with the evaluation of the amide I band using partial least squares (PLS) modelling [33].
In this work, we present the potential of EC-QCL based IR transmission measurements as excellent alternative to FTIR spectroscopy for analysis of proteins in both, scientifically-driven protein structure studies as well as for process analytical applications. We show QCL-IR spectra of dynamic protein secondary structure changes induced by chemical denaturation as well as an applied implementation for estimation of the heat load applied to commercial bovine milk samples.
2.Methods
2.1.Standards and reagents
Sodium phosphate monobasic dihydrate p.a. (NaH2PO4 · 2H2O) was purchased from Fluka (Buchs, Switzerland); sodium phosphate dibasic dihydrate (Na2HPO4 · 2H2O) BioUltra, for molecular biology, hydrochloric acid 37% (HCl) ACS reagent, sodium hydroxide solution 50% in water and 2,2,2-trifluoroethanol ReagentPlus ⩾99% (TFE), were obtained from Sigma-Aldrich (Steinheim, Germany). Lyophilized powder of α-lactalbumin (⩾85.0%, α-LA), α-chymotrypsin from bovine pancreas (⩾85%, α-CT) as well as β-LG (⩾90%) and casein sodium salt (Cas), both from bovine milk, were obtained from Sigma-Aldrich (Steinheim, Germany). An appropriate amount of lyophilized protein powder was dissolved in 16.0 mmol L−1 phosphate buffer pH 7.0.
For calibration standards, ten solutions containing protein mixtures were prepared in 45 mmol L−1 phosphate buffer at pH 6.6, reaching concentrations ranging between 0 and 30 g L−1 for Cas, and 0 and 15 g L−1 for β-LG. Total protein concentrations resulted from the sum of individual protein concentrations and ranged between 19 and 36 g L−1 [33]. Sixteen homogenized, commercial bovine milk samples (four different brands of pasteurized, ESL filtered, ESL HTST and UHT type each) were obtained from local grocery stores. Ultrapure water (18 MΩ) was used for the preparation of all solutions, obtained from a Milli-Q water purification system from Millipore (Bedford, USA).
2.2.EC-QCL setup
The custom-made EC-QCL setup has been described in detail elsewhere [3]. Briefly, the setup is equipped with an EC-QCL (spectral tuning range = 1729.30–1565.06 cm−1; Daylight Solutions Inc., San Diego, USA), a temperature-controlled 38 μm path length flow cell and a thermoelectrically cooled (−60°C) HgCdTe (mercury cadmium telluride) detector (MCT-7-TE3;
Fig. 1.
Laser-based IR transmission setup employing an EC-QCL as light source.
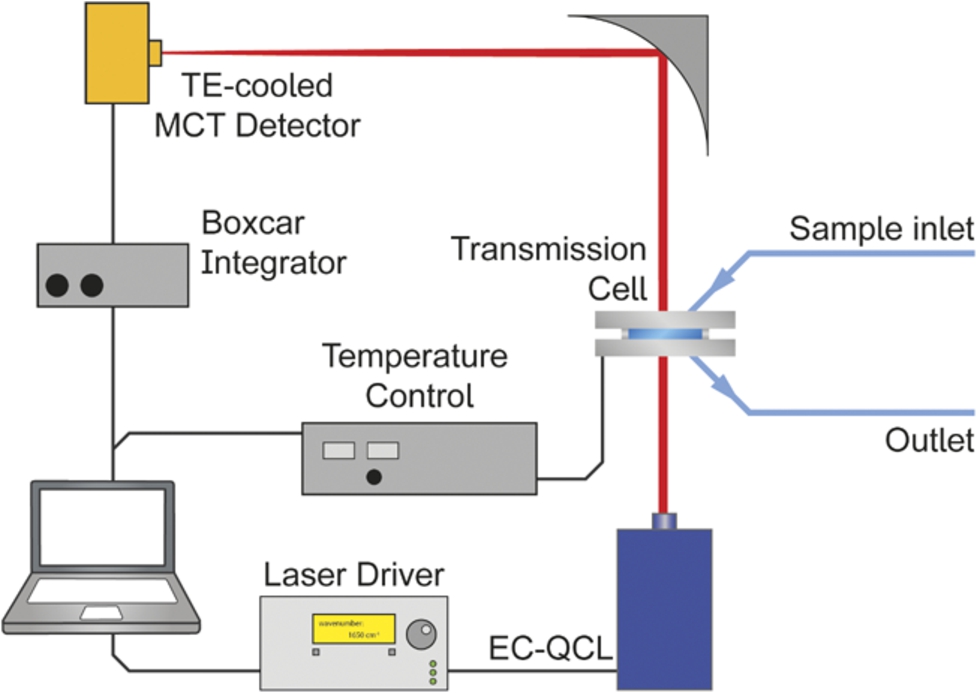
Each single beam spectrum consisting of 24,000 data points was recorded during a tuning time of 1.5 s. A total of 100 scans (total measurement time: ∼500 s) were recorded for background and sample single beam spectra. Data processing steps included data point reduction in the single beam spectra by a factor of 4 using cubic spline interpolation followed by Savitzky–Golay smoothing to reduce instrumental noise. This data point density allowed for subsequent correction of the spectral mismatch between successive scans by Correlation Optimized Warping (COW) on the basis of the mode hop fine structure of the laser emission characteristics [29]. First, consecutive scans of one measurement were aligned prior to averaging. In the next step, background (
The resolution of EC-QCL spectra was determined to be 0.2 cm−1 and 1.2 cm−1 for non-filtered and filtered spectra, respectively [3]. Data processing and analysis was performed in MATLAB R2014b (MathWorks, Inc., Natick, MA, 2014). OPUS 7.2 (Bruker Optik GmbH, Ettlingen, Germany, 2012) was used for spectral evaluation.
2.3.FTIR measurements
FT-IR absorption measurements were performed using a Bruker 80v FT-IR spectrometer (Ettlingen, Germany) equipped with a liquid nitrogen cooled HgCdTe (mercury cadmium telluride) detector (
3.Results and discussion
3.1.Comparison of QCL-IR protein spectra with FTIR spectroscopy
Fig. 2.
IR absorbance spectra of 10 mg mL−1 (green solid line), 5 mg mL−1 (green dashed line), and 2.5 mg mL−1 (green dotted line) protein solutions acquired by the EC-QCL setup (upper panels) and 20 mg mL−1 (brown solid line) protein solutions acquired by FTIR spectroscopy (lower panels). Grey dashed lines highlight the high congruence of the spectral features between the IR spectra acquired by EC-QCL and FTIR spectroscopy.
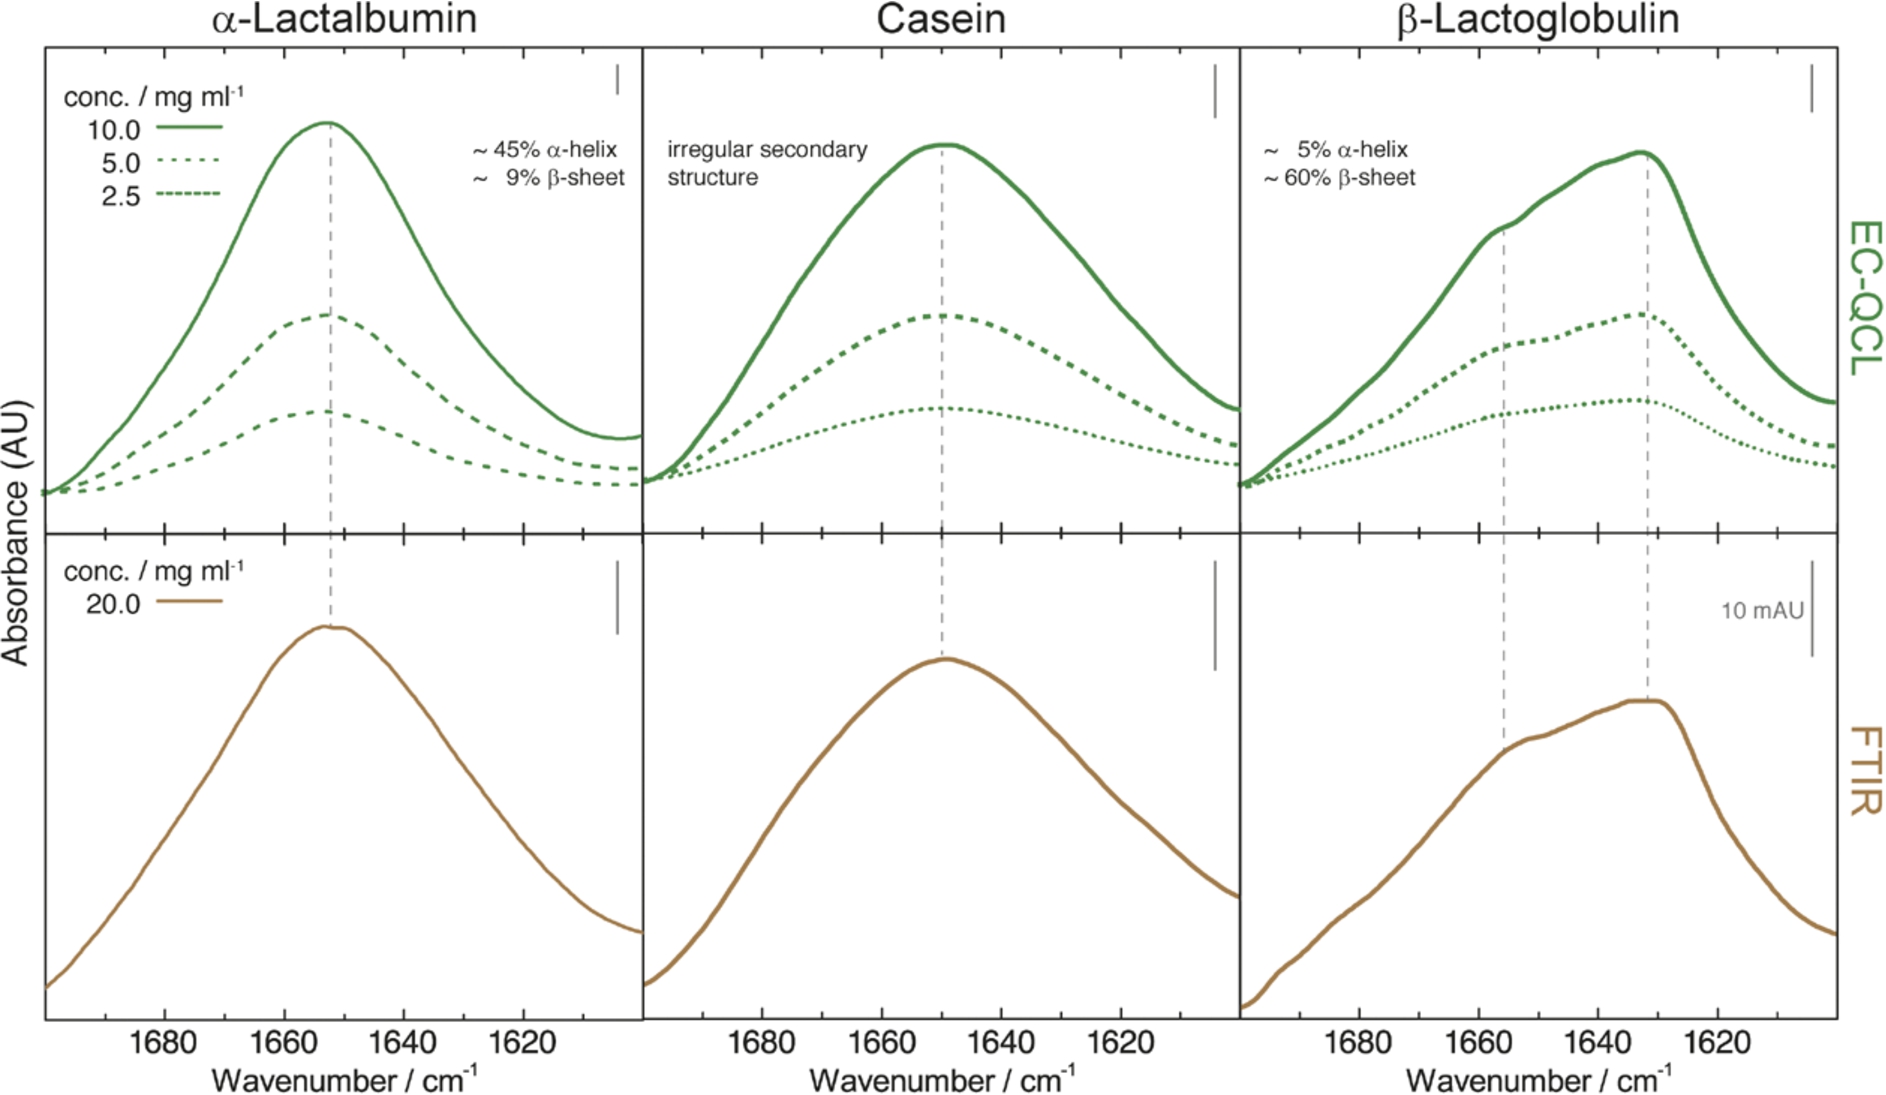
Mid-IR transmission spectra were recorded of aqueous solutions of the three main proteins present in bovine milk. Protein spectra at different concentrations were recorded by QCL-IR spectroscopy and compared to the spectra obtained by FTIR spectroscopy (Fig. 2). The studied proteins exhibit characteristic spectral features of different secondary structures. The spectrum of α-LA, a well-studied protein consisting primarily of α-helical structures [15,30], shows the α-helix characteristic band at 1654 cm−1 [5]. Cas features an irregular secondary structure with extended α-helices that results in a broad IR absorbance band with a maximum at approx. 1650 cm−1 [21]. β-LG is mainly composed of β-sheet secondary structure with a characteristic band maximum at approximately 1635 cm−1 and a sideband at 1680 cm−1 [35,40]. Spectral features of the diverse secondary structure elements could be identified at concentrations as low as 2.5 mg mL−1. Comparison of IR spectra shows excellent agreement of the QCL-IR transmission measurements with protein spectra acquired by FTIR spectroscopy. This could be achieved by employing the high optical path length of 38 μm enabled by the high emission power of the EC-QCL conjoined with a sophisticated data processing routine [3].
3.2.Monitoring dynamic protein conformational changes employing EC-QCL spectroscopy
The EC-QCL IR transmission setup was further employed to monitor dynamic changes of protein secondary structure. Alteration of external conditions such as pH, temperature or co-solvents leads to a change of secondary structure in most proteins, often accompanied by protein denaturation. In order to showcase the ability of the setup to follow dynamic protein conformation changes, protein denaturation of α-CT in presence of the co-solvent TFE was monitored. It has been shown that exposure of β-sheet rich proteins to TFE leads to rapid formation of non-native α-helical structures [38], followed by slower β-sheet aggregation. This helix-inducing effect of TFE has been attributed to its low dielectric constant (one third of water for pure solvent) that weakens solvophobic interactions stabilizing the native structure of proteins, and simultaneously strengthens electrostatic interactions, such as intermolecular hydrogen bonds, thereby stabilizing local secondary structures, particularly the α-helix [13,45].
Fig. 3.
Time-dependent QCL-IR absorbance spectra of 20.0 mg mL−1 α-CT in 50% TFE/buffer solution, pH 7.8, 25°C (solid lines). The spectra were recorded at time periods between 2 and 240 minutes after dissolving the protein in TFE/buffer. Blue solid line represents the spectrum of α-CT with TFE-induced α-helical structure. Orange solid lines indicate the spectra of the protein after gradual formation of intermolecular β-sheets. The grey dashed line shows the spectrum of native α-CT in non-denaturant aqueous buffer. Black arrows illustrate directions of absorbance changes as a function of time.
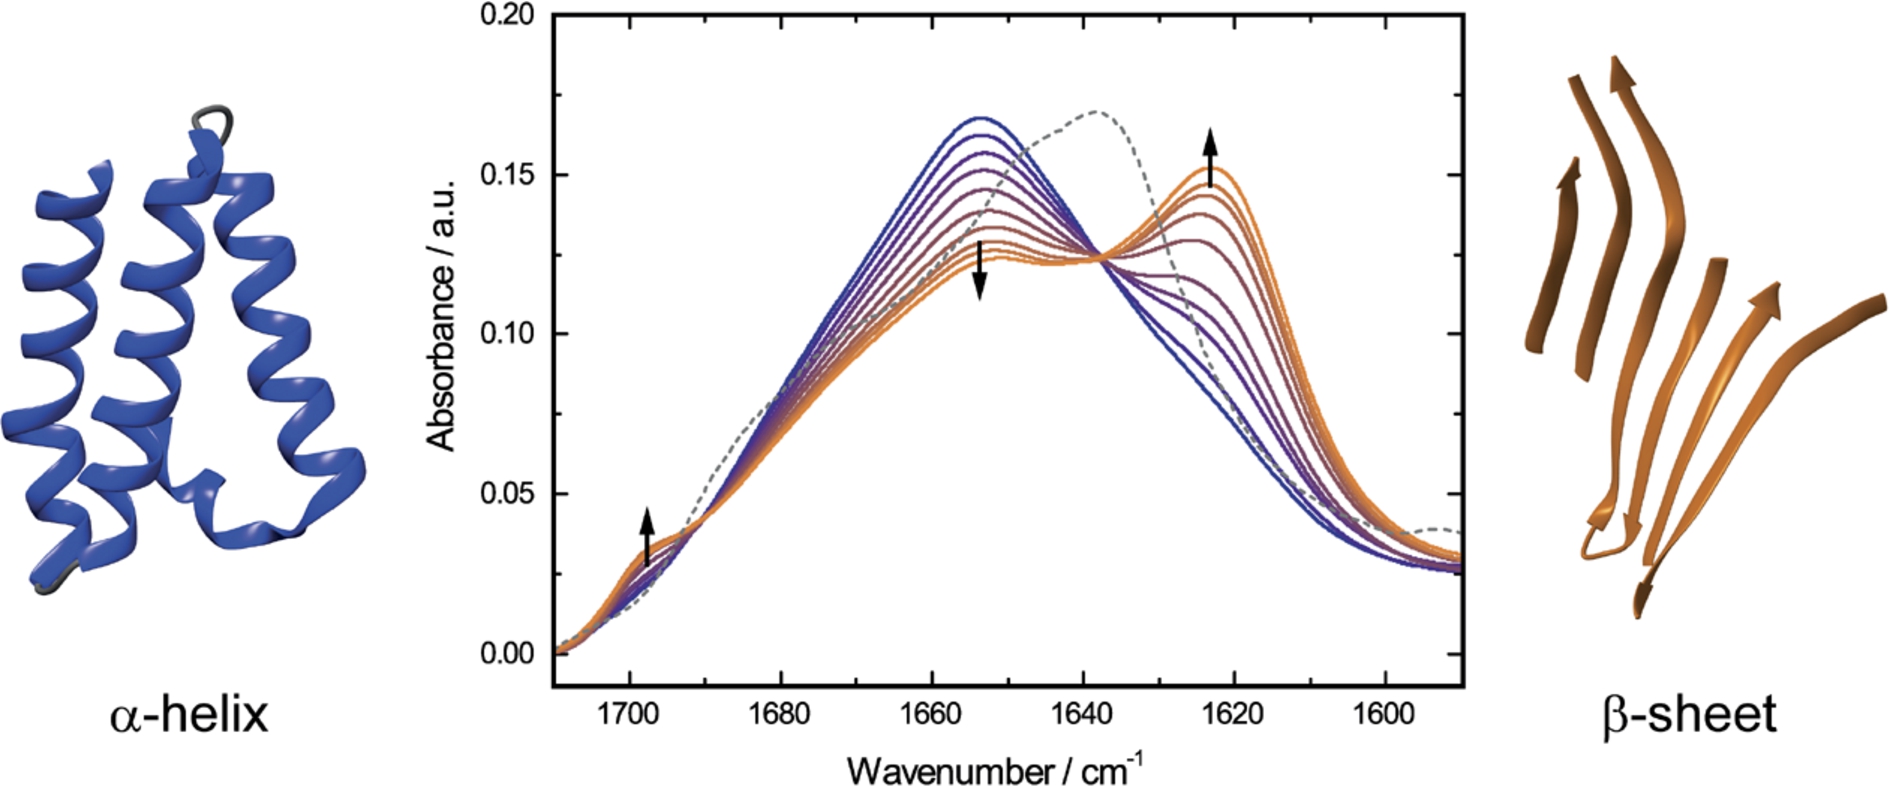
The QCL-IR absorbance spectrum of native α-CT shows a band maximum at 1638 cm−1 and a broad shoulder at 1680 cm−1, characteristic for the low- and high-frequency components in β-sheet secondary structure [16], respectively (Fig. 3). In order to induce denaturation of α-CT, the protein was dissolved in 50% TFE/buffer solution. The initial TFE-induced transition from native β-sheet secondary structure to α-helix occurs in the milliseconds time range [36] and is not directly observable with the QCL-IR setup. This α-helical structure is not stable over time [17], and the subsequent gradual conformational change of the protein was monitored with the QCL-IR setup throughout a time period of 240 min. As depicted in Fig. 3, the intensity of the TFE-induced α-helical band at 1654 cm−1 decreases as the bands at 1623 and 1697 cm−1 emerge. This arising spectral pattern is commonly attributed to intermolecular antiparallel β-sheet aggregates, frequently occurring in thermally denatured proteins [22,41]. The effect of different pH values and protein concentration on the kinetics of β-sheets aggregation has been investigated employing QCL-IR spectroscopy [2].
3.3.Estimation of the heat load applied to commercial bovine milk
With its peculiar properties, such as high viscosity and complex composition, milk poses an intriguing problem for analysis by IR spectroscopy. With high applicable transmission path lengths in the amide I region, QCL-IR spectroscopy offers advantages to conventional FTIR spectroscopy for protein analysis in milk [31]. QCL-IR spectroscopy without prior sample preparation particularly provides advantages in terms of analysis speed for screening applications in comparison to currently employed wet chemical analysis (Kjehldahl) in combination with chromatographic approaches that still need wet chemical sample preparation steps [8].
Here, the recently introduced method for quantitation of different proteins in milk based on QCL-IR spectroscopy and partial least squares (PLS) regression analysis [33] is performed and applied for the determination of β-LG in different types of commercial bovine milk. PLS regression models were built based on synthetic protein standard mixtures. Data processing involved baseline correction, calculation of the second derivative spectra as well as mean centering prior to PLS model calculation, which employed 1 latent variable. Coefficients of determination (R2) of calibration and leave-one-out cross validation are a measure of the goodness of fit for the calibration data set and were 0.96 and 0.93, respectively. Root-mean square error of calibration (RMSEC) and cross-validation (RMSECV) were 1.0 g L−1 and 1.3 g L−1, respectively, while the CV bias as a measure of accuracy was 0.06 g L−1.
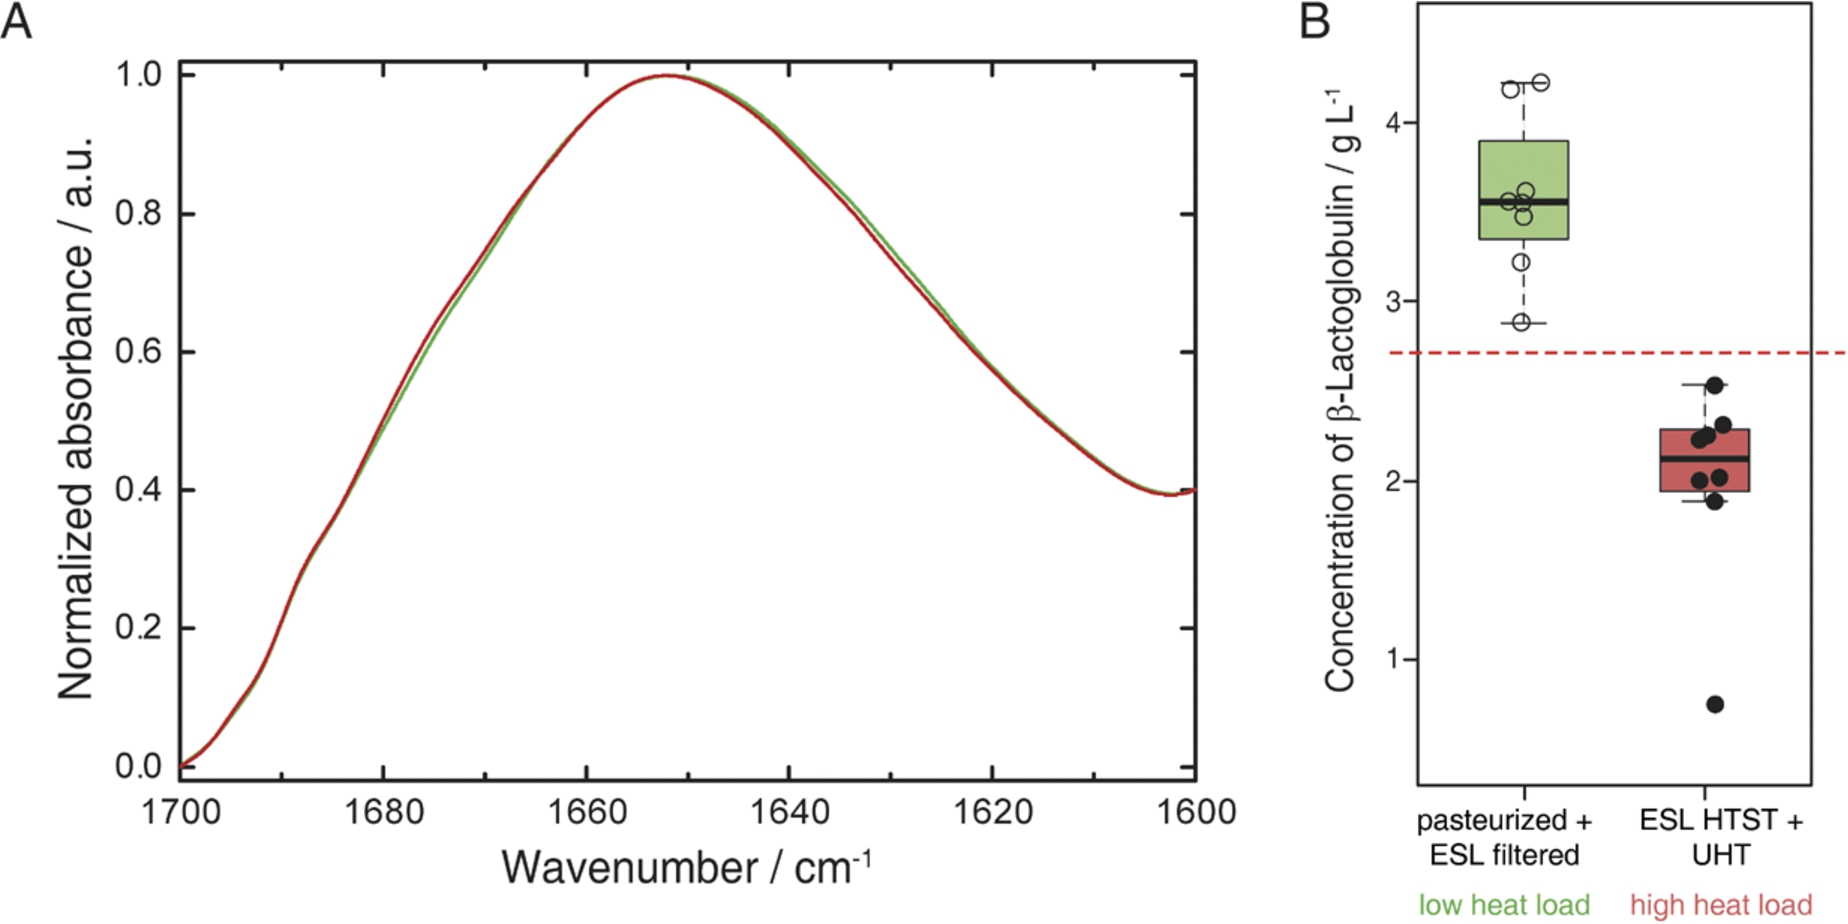
The samples were selected to contain milk types having experienced low (pasteurized, ESL-filtered) and high heat loads (ESL-HTST, UHT) throughout their production process [8,39]. β-LG denatures during prolonged heating above 60°C and this protein has been recognised as relevant indictor for the heat load of milk. Its concentrations inversely correlate with the heat load applied to the milk sample [8,14]. The described PLS model was employed for quantitation of β-LG in different types of bovine milk samples. For pasteurized and ESL filtered milk, β-LG concentrations of 3.7 ± 0.6 g L−1 and 3.5 ± 0.2 g L−1 were found respectively, whereas ESL-HTST and UHT samples contained 1.8 ± 0.7 g L−1 and 2.2 ± 0.3 g L−1. Figure 4(A) depicts representative QCL-IR spectra of milk that received low (green) and high (red) heat load. The IR spectrum of the low heat-load milk sample features higher absorbance at approx. 1630 cm−1, attributed to β-sheet secondary structure present in β-LG, as illustrated in Fig. 2. Figure 4(B) shows the β-LG levels found for the examined milk samples. Classification according to the applied heat load during processing could be performed after construction of a receiver operator curve (ROC) that showed an area under the curve of 1 (95% confidence interval 1–1). This indicates highly significant differences between the milk samples with a threshold at 2.7 g L−1 β-LG enabling classification of bovine milk samples, which received low vs. high heat load.
Fig. 4.
(A) Normalized QCL-IR spectra of milk that received low (green) and high (red) heat load during production. (B) Boxplots of commercial bovine milk samples after processing involving low (left/green) and high (right/red) heat load. Red dashed line indicates the threshold of 2.7 g L−1 β-LG obtained as computed by the receiver operator curve.
4.Conclusions
This work demonstrates the versatility of an EC-QCL based IR transmission setup for protein analysis. Successful usage was presented for protein structure analysis studies as well as for a process analytical application. It was shown that the characteristic features of QCL-IR spectra in the protein amide I region are equivalent to FTIR spectra. Dynamic conformational change of α-CT induced by chemical denaturation by TFE was successfully monitored. Furthermore, with the high applicable path length, it is possible to analyse the protein amide I region in complex solutions. The QCL-IR setup was applied for assessing the thermal process parameters of commercial milk and discrimination of low- and high heat load milk samples could be accomplished. In view of the obtained results, this fast measurement approach might potentially be applied as a screening tool in milk industry.
Acknowledgements
Financial support was provided by the Austrian research funding association (FFG) under the scope of the COMET program within the research project “Industrial Methods for Process Analytical Chemistry – From Measurement Technologies to Information Systems (imPACts)” (contract #843546). M.R.A. gratefully acknowledges the postdoc fellowship provided by CONICET. J.K. is grateful for her personal Miguel Servet grant (grant number: CP16/00034) provided by the Instituto Carlos III (Ministry of Economy and Competitiveness, Spain).
References
[1] | B. Aernouts, E. Polshin, W. Saeys and J. Lammertyn, Mid-infrared spectrometry of milk for dairy metabolomics: A comparison of two sampling techniques and effect of homogenization, Anal. Chim. Acta. 705: ((2011) ), 88–97. doi:10.1016/j.aca.2011.04.018. |
[2] | M.R. Alcaráz, A. Schwaighofer, H. Goicoechea and B. Lendl, EC-QCL mid-IR transmission spectroscopy for monitoring dynamic changes of protein secondary structure in aqueous solution on the example of beta-aggregation in alcohol-denaturated alpha-chymotrypsin, Anal. Bioanal. Chem. 408: ((2016) ), 3933–3941. doi:10.1007/s00216-016-9464-5. |
[3] | M.R. Alcaráz, A. Schwaighofer, C. Kristament, G. Ramer, M. Brandstetter, H. Goicoechea and B. Lendl, External cavity-quantum cascade laser spectroscopy for mid-IR transmission measurements of proteins in aqueous solution, Anal. Chem. 87: ((2015) ), 6980–6987. doi:10.1021/acs.analchem.5b01738. |
[4] | S. Bal Ram, in: Infrared Analysis of Peptides and Proteins, American Chemical Society, (1999) , pp. 2–37. |
[5] | A. Barth, Infrared spectroscopy of proteins, Biochim. Biophys. Acta, Bioenerg. 1767: ((2007) ), 1073–1101. doi:10.1016/j.bbabio.2007.06.004. |
[6] | P. Bassan, M.J. Weida, J. Rowlette and P. Gardner, Large scale infrared imaging of tissue micro arrays (TMAs) using a tunable Quantum Cascade Laser (QCL) based microscope, Analyst 139: ((2014) ), 3856–3859. doi:10.1039/C4AN00638K. |
[7] | B. Bird and J. Rowlette, High definition infrared chemical imaging of colorectal tissue using a spero QCL microscope, Analyst 142: ((2017) ), 1381–1386. doi:10.1039/C6AN01916A. |
[8] | L.I. Boitz, G. Fiechter, R.K. Seifried and H.K. Mayer, A novel ultra-high performance liquid chromatography method for the rapid determination of β-lactoglobulin as heat load indicator in commercial milk samples, J. Chromatogr. A 1386: ((2015) ), 98–102. doi:10.1016/j.chroma.2015.01.081. |
[9] | L.I. Boitz and H.K. Mayer, Extended shelf life milk – one concept, different qualities: A comprehensive study on the heat load of differently processed liquid milk retailed in Austria in 2012 and 2015, LWT-Food, Sci. Technol. 79: ((2017) ), 384–393. doi:10.1016/j.lwt.2017.01.058. |
[10] | G. Bordin, F. Cordeiro Raposo, B. de la Calle and A.R. Rodriguez, Identification and quantification of major bovine milk proteins by liquid chromatography, J. Chromatogr. A 928: ((2001) ), 63–76. doi:10.1016/S0021-9673(01)01097-4. |
[11] | M. Brandstetter, A. Genner, K. Anic and B. Lendl, Tunable external cavity quantum cascade laser for the simultaneous determination of glucose and lactate in aqueous phase, Analyst 135: ((2010) ), 3260–3265. doi:10.1039/C0AN00532K. |
[12] | M. Brandstetter, L. Volgger, A. Genner, C. Jungbauer and B. Lendl, Direct determination of glucose, lactate and triglycerides in blood serum by a tunable quantum cascade laser-based mid-IR sensor, Appl. Phys. B: Lasers Opt. 110: ((2013) ), 233–239. doi:10.1007/s00340-012-5080-z. |
[13] | M. Buck, Trifluoroethanol and colleagues: Cosolvents come of age. Recent studies with peptides and proteins, Q. Rev. Biophys. 31: ((1998) ), 297–355. doi:10.1017/S003358359800345X. |
[14] | H.L. Casal, U. Kohler and H.H. Mantsch, Structural and conformational-changes of beta-lactoglobulin-B – an infrared spectroscopic study of the effect of ph and temperature, Biochim. Biophys. Acta 957: ((1988) ), 11–20. doi:10.1016/0167-4838(88)90152-5. |
[15] | N. Chandra, K. Brew and K.R. Acharya, Structural evidence for the presence of a secondary calcium binding site in human alpha-lactalbumin, Biochemistry 37: ((1998) ), 4767–4772. doi:10.1021/bi973000t. |
[16] | A. Dong, P. Huang and W.S. Caughey, Protein secondary structures in water from second-derivative amide I infrared spectra, Biochemistry 29: ((1990) ), 3303–3308. doi:10.1021/bi00465a022. |
[17] | A. Dong, J. Matsuura, M.C. Manning and J.F. Carpenter, Intermolecular beta-sheet results from trifluoroethanol-induced nonnative alpha-helical structure in beta-sheet predominant proteins: Infrared and circular dichroism spectroscopic study, Arch. Biochem. Biophys. 355: ((1998) ), 275–281. doi:10.1006/abbi.1998.0718. |
[18] | Y. Etzion, R. Linker, U. Cogan and I. Shmulevich, Determination of protein concentration in raw milk by mid-infrared Fourier transform infrared/attenuated total reflectance spectroscopy, J. Dairy Sci. 87: ((2004) ), 2779–2788. doi:10.3168/jds.S0022-0302(04)73405-0. |
[19] | H. Fabian and W. Mäntele, in: Handbook of Vibrational Spectroscopy, John Wiley & Sons, Ltd, Hoboken, NJ, USA, (2006) . |
[20] | J. Faist, F. Capasso, D.L. Sivco, C. Sirtori, A.L. Hutchinson and A.Y. Cho, Quantum cascade laser, Science 264: ((1994) ), 553–556. doi:10.1126/science.264.5158.553. |
[21] | H.M. Farrell, E.D. Wickham, J.J. Unruh, P.X. Qi and P.D. Hoagland, Secondary structural studies of bovine caseins: Temperature dependence of beta-casein structure as analyzed by circular dichroism and FTIR spectroscopy and correlation with micellization, Food Hydrocolloids 15: ((2001) ), 341–354. doi:10.1016/S0268-005X(01)00080-7. |
[22] | A. Filosa, Y. Wang, A.A. Ismail and A.M. English, Two-dimensional infrared correlation spectroscopy as a probe of sequential events in the thermal unfolding of cytochromes C, Biochemistry 40: ((2001) ), 8256–8263. doi:10.1021/bi002710n. |
[23] | P.F. Fox, T. Uniacke-Lowe, P.L.H. McSweeney and J.A. O’Mahony, in: Dairy Chemistry and Biochemistry, Springer International Publishing, Cham, (2015) , pp. 145–239. doi:10.1007/978-3-319-14892-2_4. |
[24] | C.D. Gondim, R.G. Junqueira, S.V.C. de Souza, I. Ruisanchez and M.P. Callao, Detection of several common adulterants in raw milk by MID-infrared spectroscopy and one-class and multi-class multivariate strategies, Food. Chem. 230: ((2017) ), 68–75. doi:10.1016/j.foodchem.2017.03.022. |
[25] | G.F. Greppi, P. Roncada and R. Fortin, in: Dairy Goats Feeding and Nutrition, A. Cannas and G. Pulina, eds, CABI, Cambridge, MA, (2008) , pp. 71–94. doi:10.1079/9781845933487.0071. |
[26] | A. Haug, A.T. Høstmark and O.M. Harstad, Bovine milk in human nutrition – a review, Lipids Health Dis. 6: ((2007) ), 1–16. doi:10.1186/1476-511x-6-25. |
[27] | A.B. Hougaard, J.S. Vestergaard, C. Varming, W.L.P. Bredie and R.H. Ipsen, Composition of volatile compounds in bovine milk heat treated by instant infusion pasteurisation and their correlation to sensory analysis, Int. J. Dairy Technol. 64: ((2011) ), 34–44. doi:10.1111/j.1471-0307.2010.00641.x. |
[28] | C. Hughes, G. Clemens, B. Bird, T. Dawson, K.M. Ashton, M.D. Jenkinson, A. Brodbelt, M. Weida, E. Fotheringham, M. Barre, J. Rowlette and M.J. Baker, Introducing discrete frequency infrared technology for high-throughput biofluid screening, Sci. Rep. 6: ((2016) ), 20173. doi:10.1038/srep20173. |
[29] | R.H. Jellema, in: Comprehensive Chemometrics, B. Walczak, S.D. Brown and R. Tauler, eds, Elsevier, Oxford, (2009) , pp. 85–108. doi:10.1016/B978-044452701-1.00104-6. |
[30] | W. Kabsch and C. Sander, Dictionary of protein secondary structure – pattern-recognition of hydrogen-bonded and geometrical features, Biopolymers 22: ((1983) ), 2577–2637. doi:10.1002/bip.360221211. |
[31] | A. Kohler, N.K. Afseth, K. Jørgensen, Å. Randby and H. Martens, in: Handbook of Vibrational Spectroscopy, John Wiley & Sons, Ltd, (2006) . |
[32] | M. Kolhed, M. Haberkorn, V. Pustogov, B. Mizaikoff, J. Frank, B. Karlberg and B. Lendl, Assessment of quantum cascade lasers as mid infrared light sources for measurement of aqueous samples, Vib. Spectrosc. 29: ((2002) ), 283–289. doi:10.1016/S0924-2031(01)00190-4. |
[33] | J. Kuligowski, A. Schwaighofer, M.R. Alcaráz, G. Quintás, H. Mayer, M. Vento and B. Lendl, External Cavity-Quantum Cascade Laser (EC-QCL) spectroscopy for protein analysis in bovine milk, Anal. Chim. Acta 963: ((2017) ), 99–105. doi:10.1016/j.aca.2017.02.003. |
[34] | B. Lendl, J. Frank, R. Schindler, A. Muller, M. Beck and J. Faist, Mid-infrared quantum cascade lasers for flow injection analysis, Anal. Chem. 72: ((2000) ), 1645–1648. doi:10.1021/ac990833b. |
[35] | M. Levitt and J. Greer, Automatic identification of secondary structure in globular proteins, J. Mol. Biol. 114: ((1977) ), 181–239. doi:10.1016/0022-2836(77)90207-8. |
[36] | H. Lu, M. Buck, S.E. Radford and C.M. Dobson, Acceleration of the folding of hen lysozyme by trifluoroethanol, J. Mol. Biol. 265: ((1997) ), 112–117. doi:10.1006/jmbi.1996.0715. |
[37] | H.J. Luinge, E. Hop, E.T.G. Lutz, J.A. Vanhemert and E.A.M. Dejong, Determination of the fat, protein and lactose content of milk using Fourier-transform infrared spectrometry, Anal. Chim. Acta 284: ((1993) ), 419–433. doi:10.1016/0003-2670(93)85328-H. |
[38] | K. Matsuo, Y. Sakurada, S. Tate, H. Namatame, M. Taniguchi and K. Gekko, Secondary-structure analysis of alcohol-denatured proteins by vacuum-ultraviolet circular dichroism spectroscopy, Proteins: Struct., Funct., Genet. 80: ((2012) ), 281–293. doi:10.1002/prot.23206. |
[39] | H.K. Mayer, B. Raba, J. Meier and A. Schmid, RP-HPLC analysis of furosine and acid-soluble beta-lactoglobulin to assess the heat load of extended shelf life milk samples in Austria, Dairy Sci. Technol. 90: ((2010) ), 413–428. doi:10.1051/dst/2009058. |
[40] | H.L. Monaco, G. Zanotti, P. Spadon, M. Bolognesi, L. Sawyer and E.E. Eliopoulos, Crystal-structure of the trigonal form of bovine beta-lactoglobulin and of its complex with retinol at 2.5 – a resolution, J. Mol. Biol. 197: ((1987) ), 695–706. doi:10.1016/0022-2836(87)90476-1. |
[41] | K. Murayama and M. Tomida, Heat-induced secondary structure and conformation change of bovine serum albumin investigated by Fourier transform infrared spectroscopy, Biochemistry 43: ((2004) ), 11526–11532. doi:10.1021/bi0489154. |
[42] | A. Schwaighofer, M.R. Alcaraz, C. Araman, H. Goicoechea and B. Lendl, External cavity-quantum cascade laser infrared spectroscopy for secondary structure analysis of proteins at low concentrations, Sci. Rep. 6: ((2016) ), 33556. doi:10.1038/srep33556. |
[43] | A. Schwaighofer, M. Brandstetter and B. Lendl, Quantum cascade lasers (QCLs) in biomedical spectroscopy, Chem. Soc. Rev. 46: ((2017) ), 5903–5924. doi:10.1039/C7CS00403F. |
[44] | E.D. Strange, E.L. Malin, D.L. Van Hekken and J.J. Basch, Chromatographic and electrophoretic methods used for analysis of milk proteins, J. Chromatogr. A 624: ((1992) ), 81–102. doi:10.1016/0021-9673(92)85675-J. |
[45] | V.N. Uversky, N.V. Narizhneva, S.O. Kirschstein, S. Winter and G. Lober, Conformational transitions provoked by organic solvents in beta-lactoglobulin: Can a molten globule like intermediate be induced by the decrease in dielectric constant?, Folding Des. 2: ((1997) ), 163–172. doi:10.1016/S1359-0278(97)00023-0. |
[46] | C. Wagner, A. Genner, G. Ramer and B. Lendl, in: Modeling, Programming and Simulations Using LabVIEW, (2011) . |
[47] | P. Wang, W. Bohr, M. Otto, K.M. Danzer and B. Mizaikoff, Quantifying amyloid fibrils in protein mixtures via infrared attenuated-total-reflection spectroscopy, Anal. Bioanal. Chem. 407: ((2015) ), 4015–4021. doi:10.1007/s00216-015-8623-4. |
[48] | M.J. Weida and B. Yee, Quantum cascade laser-based replacement for FTIR microscopy, Proc. Soc. Photo-Opt. Instrum. Eng. 7902: ((2011) ), 79021C. |


