
Two-dimensional infrared (2D IR) spectroscopy for elucidating ion occupancies in the selectivity filter of ion channels1
Abstract
This article reviews work presented at the ESCBM 2017 on using two-dimensional infrared (2D IR) spectroscopy to probe ion binding configurations in the potassium ion channel KcsA. We discuss two studies in which we use 2D IR spectroscopy in conjunction with protein semisynthesis and molecular dynamics (MD) simulations to test against two competing models of ion permeation and to investigate how changes in the conformation of the intracellular gate affect the structure and ion affinities of the selectivity filter. In our initial study, the 2D IR spectrum of an isotopically labeled KcsA filter reveals two spectral features that correspond to different structures and ion binding configurations. MD simulations help us link the experiments to atomistic structures, allowing us to determine the prevailing mechanism of ion conduction. In a follow-up study, we probe how ion occupancies in the filter change with the opening and closing of the intracellular gate. We experimentally modulate the conformation of KcsA using different sample conditions, and are able to show that the ion occupancies in the filter change with the state of the gate, revealing complexities in the conformational landscape of the potassium ion channel. Our work shows the potential of these techniques in addressing the fundamental biophysical questions in membrane protein structure and function.
1.Introduction and background
Potassium ion channels are a family of ion channels that conduct potassium ions across cell membranes with high selectivity and fidelity. These ion channels play a pivotal role in many physiologically relevant processes, including signal transduction and sensation, and are essential for maintaining the resting membrane potentials of excitable cells [11,13,17,24,28,40]. While these channels are diverse in their channel activity and gating mechanisms, the architecture of these potassium channels are strikingly similar [13,40]. Proteins in this superfamily are canonically composed of multiple subunits with several transmembrane-spanning α-helices and a conserved pore-loop domain that assemble to form the ion permeation pathway through which potassium ions cross the cell membrane. In the ion permeation pathway, the ions typically traverse a narrow central pore, known as the selectivity filter, which is lined with backbone carbonyls that coordinate ions during conduction. The electronegative carbonyls from the signature sequence motif
K+ channels conduct ions at a rate near the diffusion limit (
Fig. 1.
KcsA structure and ion binding configurations. (A) KcsA in the closed conformation (PDB 1K4C), where the intracellular gating helices form an inverted pyramid that occludes ion access to the filter. Only the two opposing subunits are shown for clarity. (B) Selectivity filter of KcsA with ion binding sites (S1-S4, extracellular to intracellular) formed by backbone carbonyls of the residues Thr75-Gly79. (C) Structure of the open conformation of KcsA (PDB 3F5W) where the helices splay open. (D) Structure of the selectivity filter in the constricted conformation (from PDB 1K4D). K+ ions are shown in purple. (E) Cartoon illustration of the two ion permeation models: the knock on model (two configurations on the left) and the hard-knock model (five configurations on the right). Waters are represented in red and K+ ions are represented in purple.
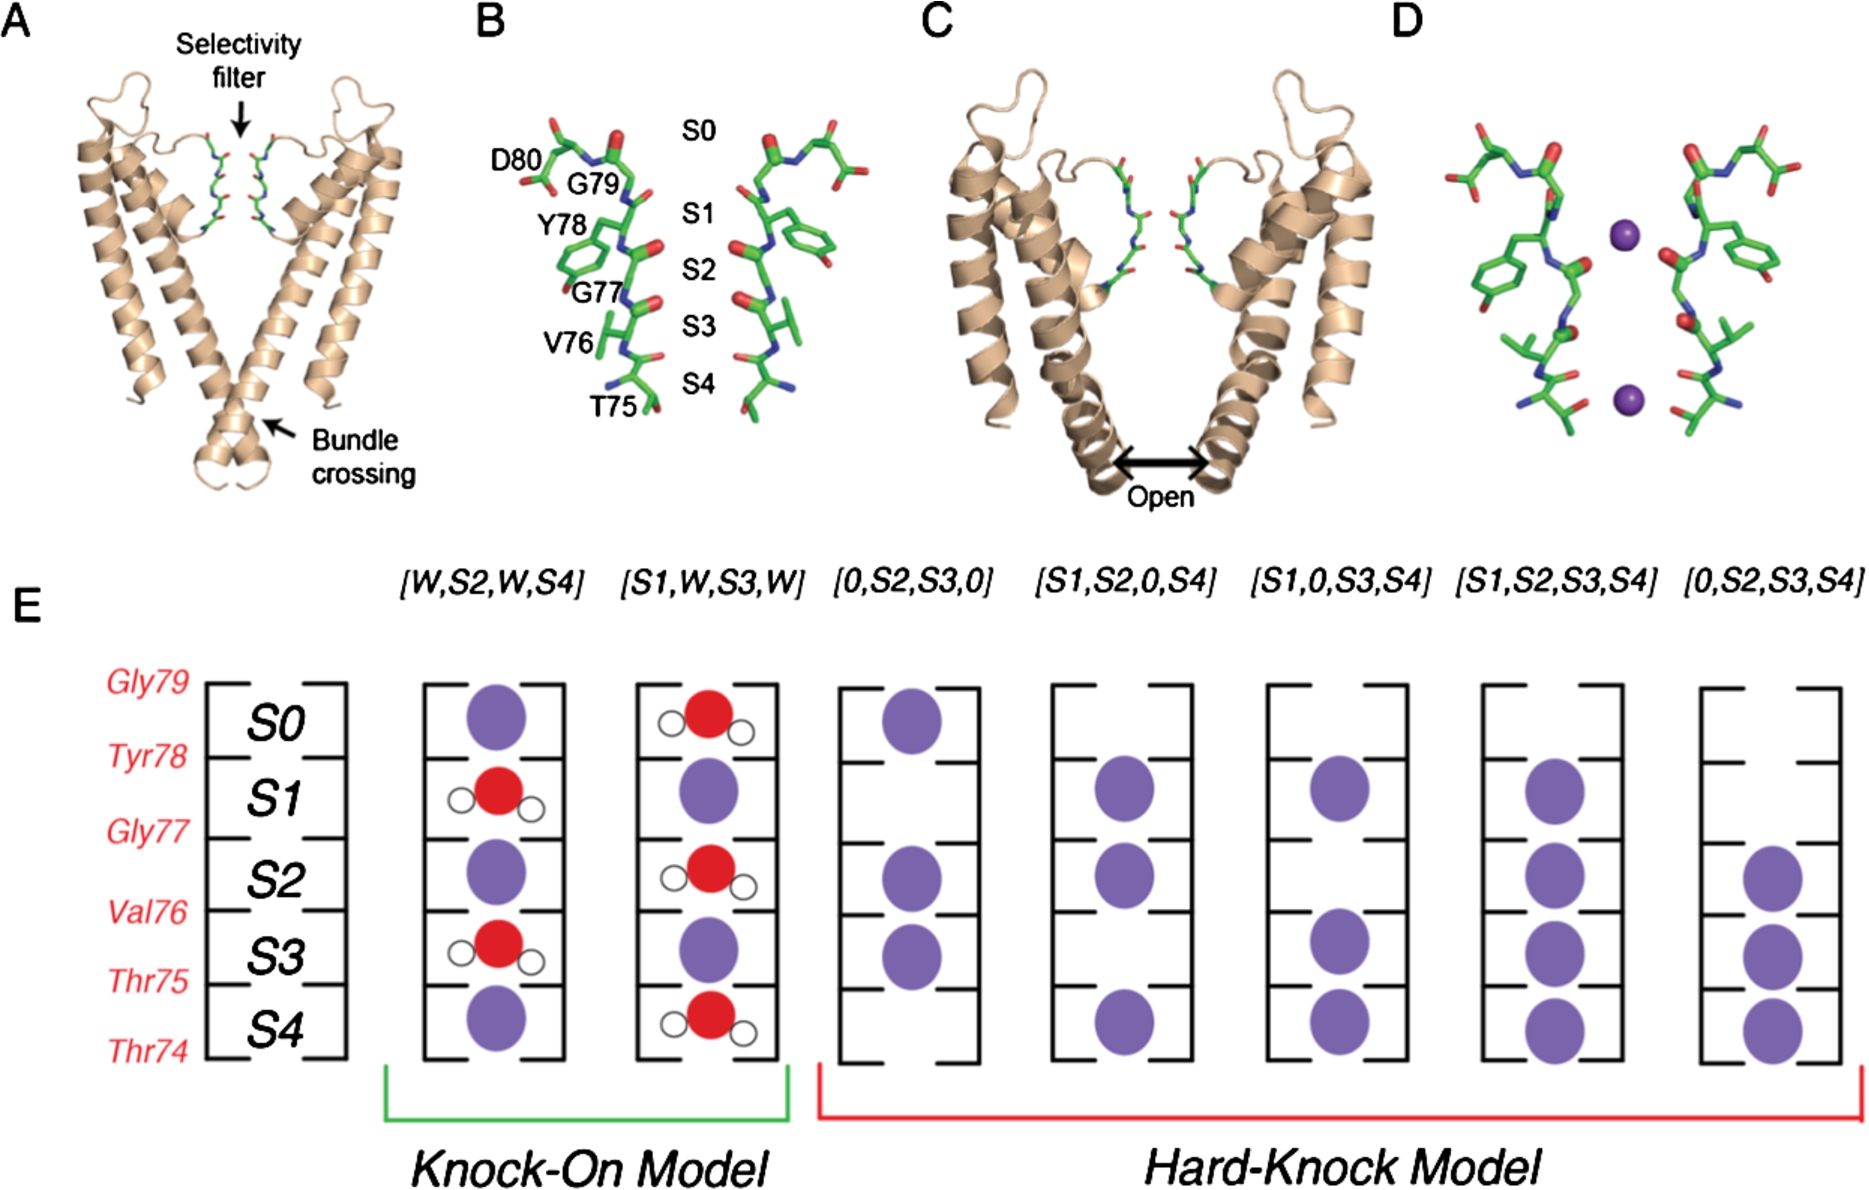
Gating, or how these channels allow ions to access the pore, is characterized by large conformational changes in the protein as well as changes in the structure and ion occupancy in the selectivity filter [6,24,29,46,49]. For the potassium ion channel KcsA, specifically, these structural transitions between the conducting and non-conducting states of the channel are controlled at both the selectivity filter and the intracellular helix bundle (Fig. 1(A)) [15,16]. Previous structural studies have pointed to two unique structural conformations of the filter referred to as the conductive and constricted states [18,58]. In the conductive conformation (Fig. 1(B)), the backbone carbonyls that form the binding sites point directly into the cavity of the filter to coordinate passing ions [18,58]. The constricted conformation of the selectivity filter (Fig. 1(D)) is characterized by the pinching in of the pore into an hourglass shape at Gly77, which splays the backbone carbonyls of nearby residues away from the central axis and destabilizes the S2 and S3 binding sites [16,58]. Likewise, the intracellular helix bundle gate goes between two different conformational states, as illustrated in Fig. 1(A) and 1(C). In the closed conformation, the inner helices of the channel form an inverted pyramid, occluding ions from the intracellular side of the membrane from the pore. The transition to the open state causes these helices to rotate and splay open (Fig. 1(C)), separating the helices and permitting permeation. The structural conformations of both the intracellular helix bundle gate and the selectivity filter are modulated by pH and K+ concentrations, respectively [16,18,57,58]. Not surprisingly, these two separate domains are allosterically coupled. When the helix gate opens as the channel transitions from the closed to the open conformation to enable ion flux, it promotes the conformational change of the selectivity filter [14–16]. Therefore, to elucidate the molecular determinants of gating, it is imperative to determine the degree of coupling between the inner helix gate and the selectivity filter and how this interplay ultimately affects ion conduction. Previous experiments and simulations have suggested a mechanical mechanism by which the collective motions of the inner helices affect the conformation of the selectivity filter [14–16,45]. These studies point to the Phe103 residue, which resides near the hinge of the inner helix, sterically clashing with the bottom of the selectivity filter when the channel transitions between the closed to the open position [15,45]. This then causes a conformational change in the selectivity filter, subsequently leading to inactivation of the channel [14,16,35,39]. To this end, the intricacies of the communication pathway between the selectivity filter and the helix bundle gate are complex, and remain to be delineated.
In this work, we describe the experimental implementation of two-dimensional infrared (2D IR) spectroscopy to address fundamental biophysical questions in ion channel conduction and gating. The theoretical details of third-order nonlinear spectroscopy have been described elsewhere [23,42], so, instead, we will focus on the aspects of this technique that make it an invaluable tool for studying these ion channels and for answering questions about conduction and gating. 2D IR spectroscopy is a relatively new technology that utilizes molecular vibrations to gain insight into the structure and dynamics of biomacromolecular systems [3,12,22,47,51,56]. The inherent time resolution of 2D IR spectroscopy is on the order of picoseconds, which is much faster than the timescales of many physiologically relevant biological processes. This means that when we take a 2D IR spectrum of a protein, we are fundamentally taking snapshot of the structural distributions of the protein and its local environment [22,25]. In terms of the ion channels, this means that we can probe the instantaneous ion binding configurations in the selectivity filter. Furthermore, vibrations are intrinsically sensitive to their local electrostatic environment, and, as such, their frequencies and lineshapes are influenced by nearby ions, water, and even the structure and dynamics of the protein itself [20]. In other words, the magnitude and direction of spectral shift for the amide I mode, the vibrational mode typically measured in protein IR spectroscopy, is highly dependent on the chemical surroundings. The spectral signature for a carbonyl in close proximity to an ion is different than that of a carbonyl hydrogen-bonded to water, and so, we can use this to our advantage to experimentally probe ion occupancies in the selectivity filter. It is this combination of the inherent time resolution and the sensitivity of vibrations to the local electric fields that makes 2D IR spectroscopy a particularly powerful tool in probing ion binding configurations in the pore of potassium ion channels.
2.Objective
The data we present at ECSBM 2017 represent an overview of two studies in which we used 2D IR spectroscopy to probe ion occupancies in the selectivity filter of the bacterial potassium ion channel, KcsA. In our initial study, we use a combination of protein semisynthesis, 2D IR spectroscopy and MD simulations to probe the instantaneous ion binding configurations in the pore of KcsA in the closed-conductive configuration to test against the two existing models of ion conduction [33]. We semisynthesized a KcsA channel with a total of twelve
3.Methods
3.1.Preparation of KcsA samples
The potassium ion channel in our study, KcsA, is semisynthesized through methods that have been previously utilized to incorporate non-natural amino acids into the selectivity filter [30,31]. This approach allows for the introduction of three
3.2.Spectroscopic measurements
2D IR spectroscopic measurements are carried out using rapid-scan 2D IR technology, which has been developed around the mid-IR pulse shaper [50–52]. The output of a Ti:Sapphire oscillator is amplified in a Nd:YLF pumped regenerative amplifier before it is sent into a β-barium borate optical parametric amplifier and AgGaS2 difference frequency generation setup to produce the femtosecond mid-IR pulses that are essential for the 2D IR experiments. Using a ZnSe beamsplitter, a large fraction of the mid-IR beam is focused into a germanium acousto-optic modulator which facilitates the shaping of the two pump pulses by modulating both the phase and amplitude of incoming beam through computer-generated acoustic waves that propagate through the crystal. The two pump pulses are then spatially and temporally overlapped with the probe pulse at the sample to produce the 2D IR signal that propagates in the direction of the probe beam, which is directed into a spectrograph and measured by a single array mercury cadmium telluride detector. The mid-IR pulse shaper gives us the ability to generate these pulse pairs with each laser shot and to control relative delay between the two pump pulses (
3.3.MD simulations and 2D IR calculations
While the details of the MD simulations are provided elsewhere [33,34]. Briefly, for our initial studies, we performed MD simulations using Drude oscillator derived polarizable force fields starting from previously described equilibrated structures [38]. For each of knock-on and hard-knock simulation systems, 100 configurations were generated for each ion binding configuration, which were energy minimized in a GROMOS 53a6 force field that was conducive for calculating 2D IR spectra [43]. 20 ps MD trajectories were run for each of these configurations and sampled with a 2 fs integration time step. Ion configurations of interest were constrained to the filter using flat bottom potentials. The amide I 2D IR spectra are calculated using established methods [36,37,55]. Briefly, the frequencies are calculated from the MD simulations as projections of the electric fields on point charges and shifted by 66 cm−1 to match the experimental shifts observed for the
In our follow-up investigation, we use a slightly different method for the MD simulations of the closed-constricted and open-constricted states, which are discussed elsewhere [44]. Each of these 532 ns long MD simulations is run using a CHARMM36 force field. To maintain the open state, we took care to protonate the appropriate residues along the activation gate. All of the structures from the MD simulations show that the channel structure is conserved between lipids and micelles when compared to the X-ray crystal structures. From these 532 ns trajectories, the initial configurations for the open- and closed-constricted states were extracted every 250 ps, effectively giving us 2128 snapshots which are then used to generate the response functions for the 2D IR calculations, as described in the previous study. Hamiltonian clustering analysis is performed in the analysis of the 2D IR spectra. In this methodology, a parameter
Fig. 2.
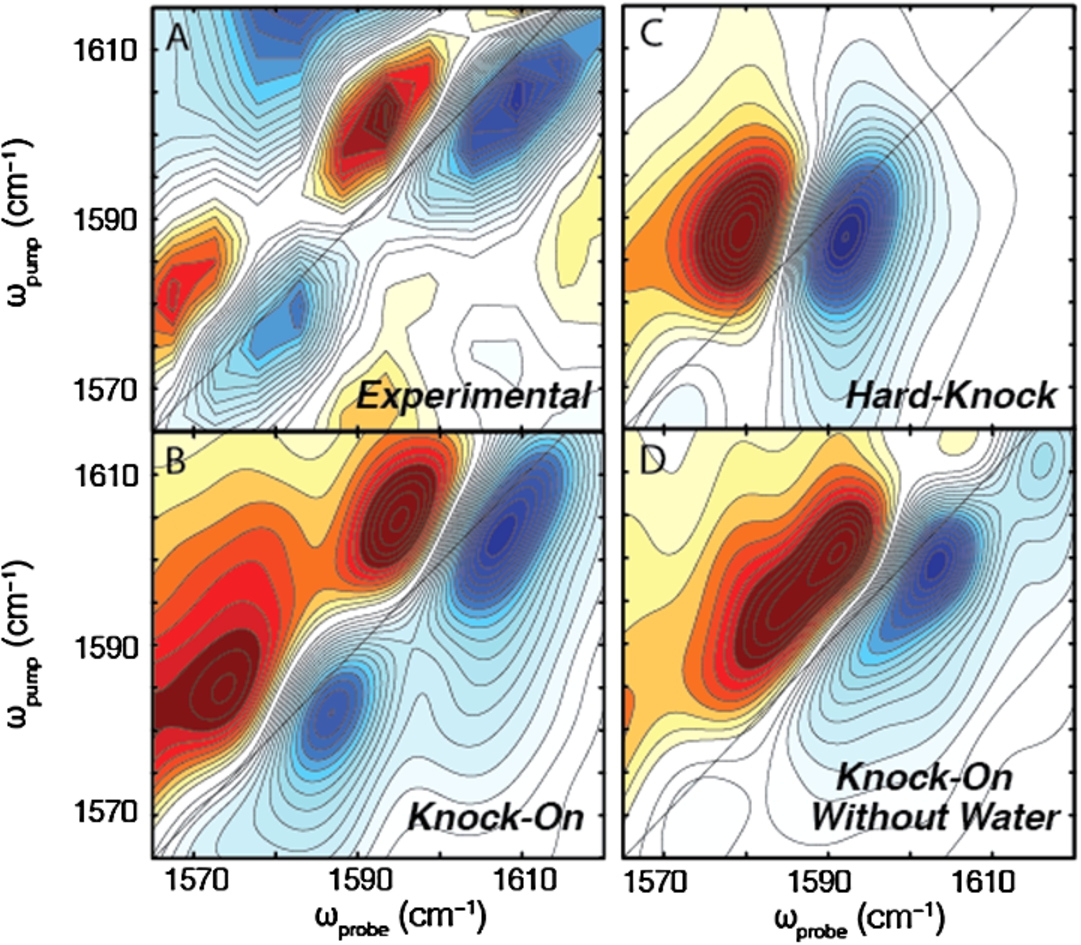
Comparison of experimental spectrum to calculated spectra of different ion permeation models. (A) Experimental spectrum shows two inhomogeneously broadened peaks. (B) Linear combination of the knock-on states (including a Val-76 flipped state) exactly reproduces the frequencies and lineshapes observed in the 2D IR experiment. (C) No linear combination of the hard-knock spectra could reproduce the experimental spectrum. The spectrum reveals a single pair of peaks that are homogeneous in lineshape. (D) No linear combination of the knock-on spectra without water could recapture the frequencies and lineshapes observed in the experiment, indicating that water must also be in the pore of the filter.
4.Results and discussion
Our initial study focused on the question of ion conduction through the selectivity filter [33]. In Fig. 2(A), we show the experimental 2D IR difference spectrum of KcsA (obtained by subtracting the unlabeled spectrum from the isotope labeled spectrum) compared to simulated spectra of the linear combination of knock-on states (Fig. 2(B)), the linear combination of hard-knock states (Fig. 2(C)), and the linear combination of knock-on states without water (Fig. 2(D)). In the experimental difference spectrum, we see two elongated peaks at
Fig. 3.
Experimental and simulated 2D IR spectra of the open-constricted and closed-constricted states. (A) Experimental spectrum of the open-constricted state shows a dominant pair of high frequency peaks. (B) Experimental spectrum of the closed-constricted state shows a pair of low frequency peaks. (C)–(D) Simulated 2D IR spectrum of the open-constricted and closed constricted states, respectively. (E), (G) Hamiltonian clustering analysis of the open-constricted simulations reveal two main groups in which (E) an ion is absent from the S1 binding site and (G) an ion is present. The majority of the states lack an ion in the S1 binding site. (F), (H) Hamiltonian clustering analysis of the closed-constricted states reveal the same two groups: (F) an S1-unoccupied state and (H) an S1-occupied configuration. In the closed-constricted conformation, the majority of states favor the presence of the ion in the S1 binding site.
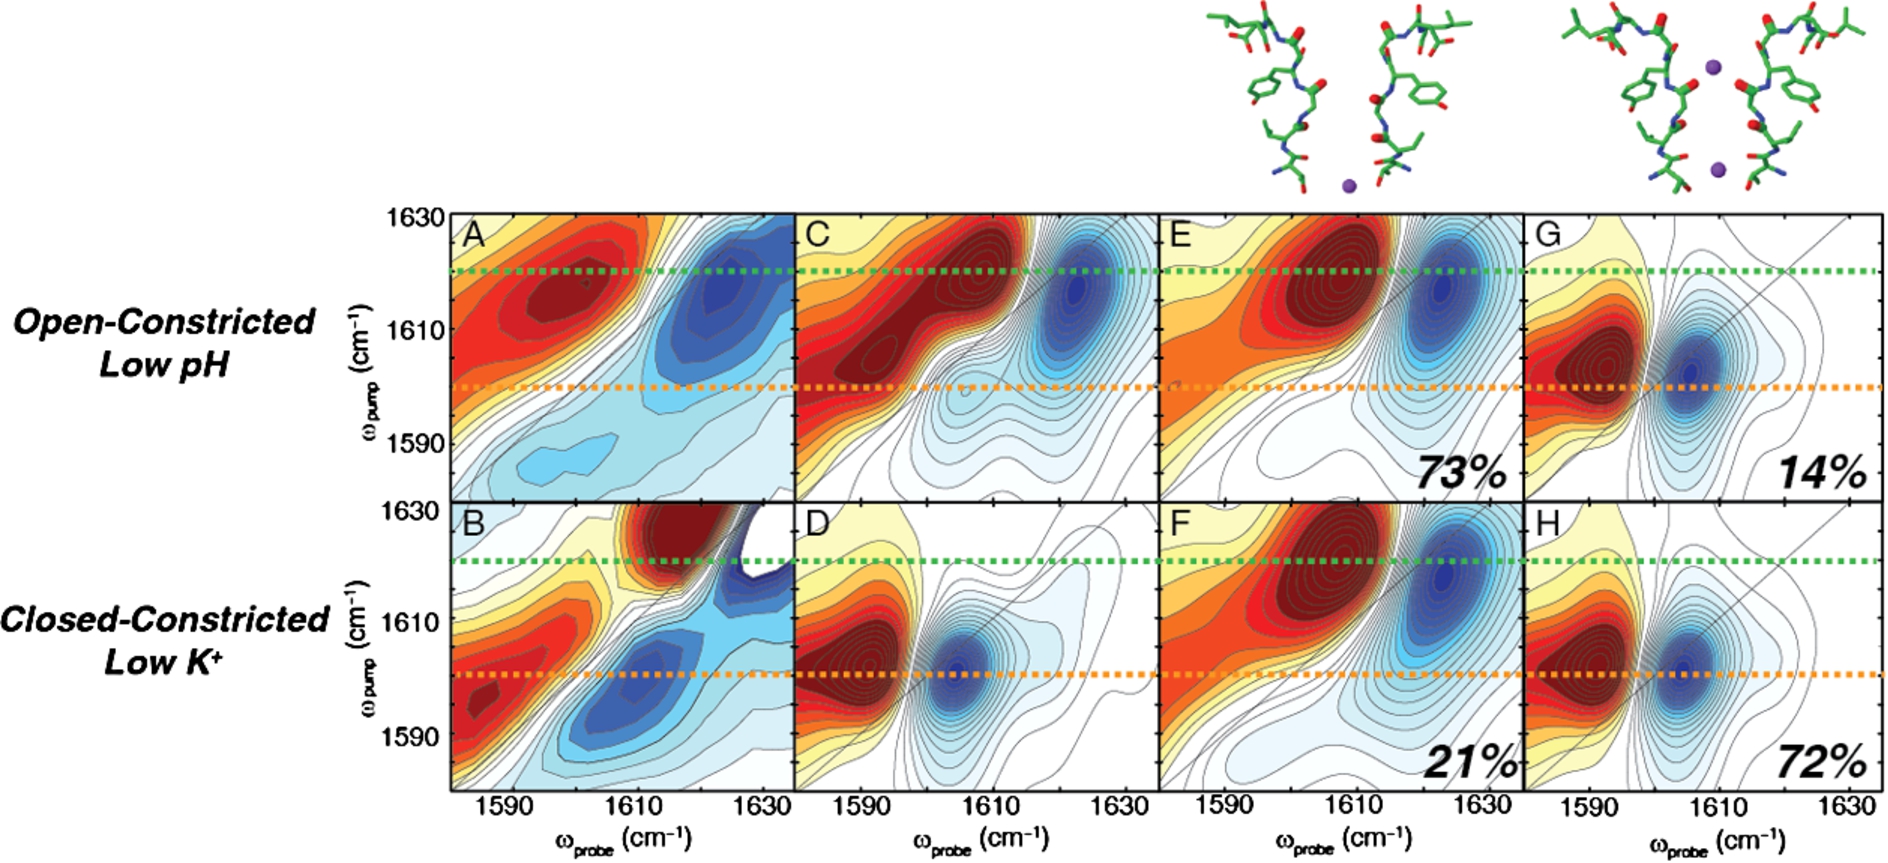
In our subsequent study, we probed the effects of gating on the ion occupancy in the selectivity filter [34]. Figures 3(A) and 3(B) shows the experimental difference spectra for the open-constricted and the closed-constricted states of the channel. The spectrum for the open-constricted state reveals an intense pair of high frequency peaks at
5.Conclusions
As illustrated in our two studies, using a combination of protein semisynthesis, 2D IR spectroscopy, and MD simulations, we were able to elucidate the ion occupancies in the selectivity filter of KcsA. Because of the ultrafast time resolution of the technique, we are able to get an instantaneous snapshot of the ensemble of ions, water, and protein structures. Furthermore, the sensitivity of vibrations to their local environment makes it an appropriate technique if we want to discern between two competing ion permeation models. In our initial studies, we provide new experimental evidence for the knock-on model of ion permeation. Our experimental 2D IR spectrum reveals two spectral features that can only be reproduced by structures and ion binding configurations of knock-on states where water and ions alternate through the filter. Additionally, we observe the Val76-flipped state, which was predicted to exist for the [S1, W, S3, W] from MD simulations. Furthermore, we show that none of the hard-knock ion binding configurations could recapture the two elongated peaks we observe experimentally, indicating that the hard-knock model is not the main mechanism for ion conduction. In our follow-up study, we probed the ion occupancies of the selectivity filter of KcsA under different experimental conditions. Using the different sample conditions, we were able to modulate both the conformational state of the inner gating helix and the selectivity filter, thus allowing us to examine the ion binding configurations of the closed-constricted and the open-constricted states. Our experimental spectra reveal two different spectra for these two states, which is intriguing given the distinction between these two states is whether the gate is open or closed. Further analysis using MD simulations and Hamiltonian clustering analysis indicates that the frequencies and intensities of the peaks describe the ion occupancy at the S1 binding site. We show that there is a greater population of states with an S1 ion in the closed-constricted state, which is contrary to what we observe in the open-constricted state where the majority of states lack an ion in the S1 binding site. Additional analysis suggests structural differences between the filters with and without K+ in the S1 binding site, implying that the state of the gate affects the binding affinity of the S1 binding site. Ultimately, we postulate that several residues like Phe103 and Arg64 outside of the selectivity filter couple the motions of the inner helix gate to the conformational changes of the filter. As we have shown in this work, the methodology we describe has been successfully implemented to address fundamental questions of ion permeation and gating in potassium ion channels. We anticipate that this combination of techniques will be a powerful set of tools in the investigations of functional mechanisms of other complex biomolecular systems.
Acknowledgements
This research was supported by US National Institutes of Health grants NIH DK079895 (H.T.K. and M.T.Z.) and the Membrane Protein Structural Dynamics Consortium U54 GM087519. M.T.Z. is an owner of PhaseTech Spectroscopy, Inc. We are also grateful to Michał Maj, Francis I. Valiyaveetil, Alvin W. Annen, Kimberly Matulef, Joshua K. Carr, Benoît Roux, Hui Li, Jared Ostmeyer, Arnaldo L. Serrano, H. Raghuraman, Sean D. Moran, James L. Skinner, and Eduardo Perozo for their essential contributions to the work published in references [33] and [34].
References
[1] | C. Alcayaga, X. Cecchi, O. Alvarez and R. Latorre, Streaming potential measurements in Ca2+-activated K+ channels from skeletal and smooth muscle. Coupling of ion and water fluxes, Biophys. J. 55: ((1989) ), 367–371. doi:10.1016/S0006-3495(89)82814-0. |
[2] | J. Aqvist and V. Luzhkov, Ion permeation mechanism of the potassium channel, Nature 404: ((2000) ), 881–884. doi:10.1038/35009114. |
[3] | S. Bagchi, S.G. Boxer and M.D. Fayer, Ribonuclease S dynamics measured using a nitrile label with 2D IR vibrational echo spectroscopy, J. Phys. Chem. B 116: ((2012) ), 4034–4042. doi:10.1021/jp2122856. |
[4] | C.R. Baiz, Y.S. Lin, C.S. Peng, K.A. Beauchamp, V.A. Voelz, V.S. Pande and A. Tokmakoff, A molecular interpretation of 2D IR protein folding experiments with Markov state models, Biophys. J. 106: ((2014) ), 1359–1370. doi:10.1016/j.bpj.2014.02.008. |
[5] | C.R. Baiz and A. Tokmakoff, Structural disorder of folded proteins: Isotope-edited 2D IR spectroscopy and Markov state modeling, Biophys. J. 108: ((2015) ), 1747–1757. doi:10.1016/j.bpj.2014.12.061. |
[6] | K.A. Baker, C. Tzitzilonis, W. Kwiatkowski, S. Choe and R. Riek, Conformational dynamics of the KcsA potassium channel governs gating properties, Nat. Struct. Mol. Biol. 14: ((2007) ), 1089–1095. doi:10.1038/nsmb1311. |
[7] | D. Bang and S.B. Kent, A one-pot total synthesis of crambin, Angew Chem Int Ed Engl 43: ((2004) ), 2534–2538. doi:10.1002/anie.200353540. |
[8] | S. Berneche and B. Roux, Energetics of ion conduction through the K+ channel, Nature 414: ((2001) ), 73–77. doi:10.1038/35102067. |
[9] | S. Berneche and B. Roux, A microscopic view of ion conduction through the K+ channel, Proc. Natl. Acad. Sci. U.S.A. 100: ((2003) ), 8644–8648. doi:10.1073/pnas.1431750100. |
[10] | S. Berneche and B. Roux, A gate in the selectivity filter of potassium channels, Structure 13: ((2005) ), 591–600. doi:10.1016/j.str.2004.12.019. |
[11] | F. Bezanilla, Voltage-gated ion channels, IEEE Trans Nanobioscience 4: ((2005) ), 34–48. doi:10.1109/TNB.2004.842463. |
[12] | L.E. Buchanan, E.B. Dunkelberger, H.Q. Tran, P.N. Cheng, C.C. Chiu, P. Cao, D.P. Raleigh, J.J. de Pablo, J.S. Nowick and M.T. Zanni, Mechanism of IAPP amyloid fibril formation involves an intermediate with a transient beta-sheet, Proc. Natl. Acad. Sci. U.S.A. 110: ((2013) ), 19285–19290. doi:10.1073/pnas.1314481110. |
[13] | S. Choe, Potassium channel structures, Nat Rev Neurosci 3: ((2002) ), 115–121. doi:10.1038/nrn727. |
[14] | J.F. Cordero-Morales, L.G. Cuello, Y. Zhao, V. Jogini, D.M. Cortes, B. Roux and E. Perozo, Molecular determinants of gating at the potassium-channel selectivity filter, Nat. Struct. Mol. Biol. 13: ((2006) ), 311–318. doi:10.1038/nsmb1069. |
[15] | L.G. Cuello, V. Jogini, D.M. Cortes, A.C. Pan, D.G. Gagnon, O. Dalmas, J.F. Cordero-Morales, S. Chakrapani, B. Roux and E. Perozo, Structural basis for the coupling between activation and inactivation gates in K(+) channels, Nature 466: ((2010) ), 272–275. doi:10.1038/nature09136. |
[16] | L.G. Cuello, V. Jogini, D.M. Cortes and E. Perozo, Structural mechanism of C-type inactivation in K(+) channels, Nature 466: ((2010) ), 203–208. doi:10.1038/nature09153. |
[17] | T.E. DeCoursey, Voltage-gated proton channels, Cell Mol Life Sci 65: ((2008) ), 2554–2573. doi:10.1007/s00018-008-8056-8. |
[18] | D.A. Doyle, J.H. Morais-Cabral, R.H. Pfuetzner, A. Kuo, J.M. Gulbis, S.L. Cohen, B.T. Chait and R. MacKinnon, The structure of the potassium channel: Molecular basis of K+ conduction and selectivity, Science 280: ((1998) ), 69–77. doi:10.1126/science.280.5360.69. |
[19] | P.W. Fowler, E. Abad, O. Beckstein and M.S. Sansom, Energetics of multi-ion conduction pathways in potassium ion channels, J. Chem. Theory Comput. 9: ((2013) ), 5176–5189. doi:10.1021/ct4005933. |
[20] | S.D. Fried, S. Bagchi and S.G. Boxer, Measuring electrostatic fields in both hydrogen-bonding and non-hydrogen-bonding environments using carbonyl vibrational probes, J. Am. Chem. Soc. 135: ((2013) ), 11181–11192. doi:10.1021/ja403917z. |
[21] | S. Furini and C. Domene, Atypical mechanism of conduction in potassium channels, Proc. Natl. Acad. Sci. U.S.A. 106: ((2009) ), 16074–16077. doi:10.1073/pnas.0903226106. |
[22] | A. Ghosh, J. Qiu, W.F. DeGrado and R.M. Hochstrasser, Tidal surge in the M2 proton channel, sensed by 2D IR spectroscopy, Proc. Natl. Acad. Sci. U.S.A. 108: ((2011) ), 6115–6120. doi:10.1073/pnas.1103027108. |
[23] | P. Hamm and M. Zanni, Concepts and Methods of 2D Infrared Spectroscopy, Cambridge University Press, New York, (2011) . |
[24] | B. Hille, Ion Channels of Excitable Membranes, Sinauer Associates, Inc., Sunderland, Massachusetts, (2001) . |
[25] | R.M. Hochstrasser, Dynamical Models for Two-Dimensional Infrared Spectroscopy of Peptides, 2005, pp. 1–56. |
[26] | A.L. Hodgkin and R.D. Keynes, The potassium permeability of a giant nerve fibre, J. Physiol. 128: ((1955) ), 61–88. doi:10.1113/jphysiol.1955.sp005291. |
[27] | M. Iwamoto and S. Oiki, Counting ion and water molecules in a streaming file through the open-filter structure of the K channel, J. Neurosci. 31: ((2011) ), 12180–12188. doi:10.1523/JNEUROSCI.1377-11.2011. |
[28] | L.Y. Jan and Y.N. Jan, Voltage-sensitive ion channels, Cell 56: ((1989) ), 13–25. doi:10.1016/0092-8674(89)90979-3. |
[29] | Y. Jiang, A. Lee, J. Chen, M. Cadene, B.T. Chait and R. MacKinnon, The open pore conformation of potassium channels, Nature 417: ((2002) ), 523–526. doi:10.1038/417523a. |
[30] | A.G. Komarov, C.A. Costantino and F.I. Valiyaveetil, Engineering K+ channels using semisynthesis, Methods Mol. Biol. 995: ((2013) ), 3–17. doi:10.1007/978-1-62703-345-9_1. |
[31] | A.G. Komarov, K.M. Linn, J.J. Devereaux and F.I. Valiyaveetil, Modular strategy for the semisynthesis of a K+ channel: Investigating interactions of the pore helix, ACS Chem. Biol. 4: ((2009) ), 1029–1038. doi:10.1021/cb900210r. |
[32] | D.A. Kopfer, C. Song, T. Gruene, G.M. Sheldrick, U. Zachariae and B.L. de Groot, Ion permeation in K(+) channels occurs by direct Coulomb knock-on, Science 346: ((2014) ), 352–355. doi:10.1126/science.1254840. |
[33] | H.T. Kratochvil, J.K. Carr, K. Matulef, A.W. Annen, H. Li, M. Maj, J. Ostmeyer, A.L. Serrano, H. Raghuraman, S.D. Moran, J.L. Skinner, E. Perozo, B. Roux, F.I. Valiyaveetil and M.T. Zanni, Instantaneous ion configurations in the K+ ion channel selectivity filter revealed by 2D IR spectroscopy, Science 353: ((2016) ), 1040–1044. doi:10.1126/science.aag1447. |
[34] | H.T. Kratochvil, M. Maj, K. Matulef, A.W. Annen, J. Ostmeyer, E. Perozo, B. Roux, F.I. Valiyaveetil and M.T. Zanni, Probing the effects of gating on the ion occupancy of the K+ channel selectivity filter using two-dimensional infrared spectroscopy, J. Am. Chem. Soc. 139: ((2017) ), 8837–8845. doi:10.1021/jacs.7b01594. |
[35] | H.T. Kurata and D. Fedida, A structural interpretation of voltage-gated potassium channel inactivation, Prog. Biophys. Mol. Biol. 92: ((2006) ), 185–208. doi:10.1016/j.pbiomolbio.2005.10.001. |
[36] | T. la Cour Jansen, A.G. Dijkstra, T.M. Watson, J.D. Hirst and J. Knoester, Modeling the amide I bands of small peptides, J. Chem. Phys. 125: ((2006) ), 44312. doi:10.1063/1.2218516. |
[37] | T. la Cour Jansen and J. Knoester, A transferable electrostatic map for solvation effects on amide I vibrations and its application to linear and two-dimensional spectroscopy, J. Chem. Phys. 124: ((2006) ), 044502. doi:10.1063/1.2148409. |
[38] | H. Li, V. Ngo, M.C. Da Silva, D.R. Salahub, K. Callahan, B. Roux and S.Y. Noskov, Representation of ion-protein interactions using the drude polarizable force-field, J. Phys. Chem. B 119: ((2015) ), 9401–9416. doi:10.1021/jp510560k. |
[39] | S. Liu, P.J. Focke, K. Matulef, X. Bian, P. Moenne-Loccoz, F.I. Valiyaveetil and S.W. Lockless, Ion-binding properties of a K+ channel selectivity filter in different conformations, Proc. Natl. Acad. Sci. U.S.A. 112: ((2015) ), 15096–15100. doi:10.1073/pnas.1510526112. |
[40] | R. MacKinnon, Potassium channels, FEBS Lett. 555: ((2003) ), 62–65. doi:10.1016/S0014-5793(03)01104-9. |
[41] | J. MacQueen, Some methods for classification and analysis of multivariate observations, in: Proceedings of the Fifth Berkeley Symposium on Mathematical Statistics and Probability, Volume 1: Statistics, University of California Press, Berkeley, CA, (1967) , pp. 281–297. |
[42] | S. Mukamel, Principles of Nonlinear Optical Spectroscopy, Oxford University Press, New York, (1995) . |
[43] | C. Oostenbrink, A. Villa, A.E. Mark and W.F. Van Gunsteren, A biomolecular force field based on the free enthalpy of hydration and solvation: The GROMOS force-field parameter sets 53A5 and 53A6, J. Comput. Chem. 25: ((2004) ), 1656–1676. doi:10.1002/jcc.20090. |
[44] | J. Ostmeyer, S. Chakrapani, A.C. Pan, E. Perozo and B. Roux, Recovery from slow inactivation in K+ channels is controlled by water molecules, Nature 501: ((2013) ), 121–124. doi:10.1038/nature12395. |
[45] | A.C. Pan, L.G. Cuello, E. Perozo and B. Roux, Thermodynamic coupling between activation and inactivation gating in potassium channels revealed by free energy molecular dynamics simulations, J. Gen. Physiol. 138: ((2011) ), 571–580. doi:10.1085/jgp.201110670. |
[46] | G. Panyi and C. Deutsch, Cross talk between activation and slow inactivation gates of shaker potassium channels, J. Gen. Physiol. 128: ((2006) ), 547–559. doi:10.1085/jgp.200609644. |
[47] | A. Remorino and R.M. Hochstrasser, Three-dimensional structures by two-dimensional vibrational spectroscopy, Acc. Chem. Res. 45: ((2012) ), 1896–1905. doi:10.1021/ar3000025. |
[48] | B. Roux, S. Berneche, B. Egwolf, B. Lev, S.Y. Noskov, C.N. Rowley and H. Yu, Ion selectivity in channels and transporters, J. Gen. Physiol. 137: ((2011) ), 415–426. doi:10.1085/jgp.201010577. |
[49] | E. Sadovsky and O. Yifrach, Principles underlying energetic coupling along an allosteric communication trajectory of a voltage-activated K+ channel, Proc. Natl. Acad. Sci. U.S.A. 104: ((2007) ), 19813–19818. doi:10.1073/pnas.0708120104. |
[50] | S.H. Shim, D.B. Strasfeld, E.C. Fulmer and M.T. Zanni, Femtosecond pulse shaping directly in the mid-IR using acousto-optic modulation, Opt. Lett. 31: ((2006) ), 838–840. doi:10.1364/OL.31.000838. |
[51] | S.H. Shim, D.B. Strasfeld, Y.L. Ling and M.T. Zanni, Automated 2D IR spectroscopy using a mid-IR pulse shaper and application of this technology to the human islet amyloid polypeptide, Proc. Natl. Acad. Sci. U.S.A. 104: ((2007) ), 14197–14202. doi:10.1073/pnas.0700804104. |
[52] | S.H. Shim and M.T. Zanni, How to turn your pump-probe instrument into a multidimensional spectrometer: 2D IR and vis spectroscopies via pulse shaping, Phys. Chem. Chem. Phys. 11: ((2009) ), 748–761. doi:10.1039/B813817F. |
[53] | A. Sivashanmugam, V. Murray, C. Cui, Y. Zhang, J. Wang and Q. Li, Practical protocols for production of very high yields of recombinant proteins using Escherichia coli, Protein Science 18: ((2009) ), 936–948. doi:10.1002/pro.102. |
[54] | H. Torii and M. Tasumi, Ab initio molecular orbital study of the amide I vibrational interactions between the peptide groups in di- and tripeptides and considerations on the conformation of the extended helix, J. Raman Spectrosc. 29: ((1998) ), 81–86. doi:10.1002/(SICI)1097-4555(199801)29:1<81::AID-JRS214>3.0.CO;2-H. |
[55] | L. Wang, C.T. Middleton, M.T. Zanni and J.L. Skinner, Development and validation of transferable amide I vibrational frequency maps for peptides, J. Phys. Chem. B 115: ((2011) ), 3713–3724. doi:10.1021/jp200745r. |
[56] | A.M. Woys, Y.S. Lin, A.S. Reddy, W. Xiong, J.J. de Pablo, J.L. Skinner and M.T. Zanni, 2D IR line shapes probe ovispirin peptide conformation and depth in lipid bilayers, J. Am. Chem. Soc. 132: ((2010) ), 2832–2838. doi:10.1021/ja9101776. |
[57] | Y. Zhou and R. MacKinnon, The occupancy of ions in the K+ selectivity filter: Charge balance and coupling of ion binding to a protein conformational change underlie high conduction rates, J. Mol. Biol. 333: ((2003) ), 965–975. doi:10.1016/j.jmb.2003.09.022. |
[58] | Y. Zhou, J.H. Morais-Cabral, A. Kaufman and R. MacKinnon, Chemistry of ion coordination and hydration revealed by a K+ channel-fab complex at 2.0 A resolution, Nature 414: ((2001) ), 43–48. doi:10.1038/35102009. |


