
Vacuum-ultraviolet circular dichroism study of oligosaccharides using a synchrotron-radiation spectrophotometer
Abstract
Vacuum-ultraviolet circular dichroism (VUVCD) spectra of malto-, laminari-, isomalto-, and cello-oligosaccharide series and their corresponding polysaccharides (laminarin and dextran) were measured from 200 to 168 nm in aqueous solution at 25°C using a synchrotron-radiation VUVCD spectrophotometer. Disaccharides exhibited markedly different CD spectra depending on the types of glycosidic linkages, and the CD spectra of each oligosaccharide series (with the exception of the isomalto-oligosaccharide series) varied with the chain length below 190 nm while retaining the spectral shape of the constituent disaccharide. These results indicate that the basic structures of oligosaccharides were greatly affected by the configurations of their constituent disaccharides, which had unique torsion angles restricted by the intramolecular hydrogen bonds between glucose units. Based on comparisons between the experimental and theoretical data, we suggest that the chain-length dependence of CD above 180 nm reflects the backbone structure of oligosaccharides (e.g., helical structures), while those below 180 nm are influenced by other factors associated with higher-energy chromophores such as the hydroxyl groups. The reported comprehensive VUVCD spectra provide basic information for understanding the complicated structures of oligosaccharides in aqueous solution that can be used in their theoretical assignments.
1.Introduction
Vacuum-ultraviolet circular dichroism (VUVCD) spectroscopy is a powerful tool for analyzing saccharide structures (especially unsubstituted saccharides) in aqueous solution [2,11,14] because they contain high-energy chromophores such as hydroxyl groups and acetal bonds whose n–σ* electronic transitions are only detectable in the vacuum-ultraviolet (VUV) region below 190 nm [1,3,17,24,25]. Some previous studies have found that the VUVCD spectra are sensitive to the equilibrium structures of monosaccharides in aqueous solution, such as the gauche (G) and trans (T) conformations of the hydroxylmethyl group at C-5, and the α- and β-anomer configurations of the hydroxyl group at C-1 [3,17,24,25]. However, since the pairwise relationships between the structures and VUVCD of monosaccharides remained unclear from these experimental results, we have recently measured the VUVCD spectra of various methyl aldopyranosides including methyl α-d-glucopyranosides in aqueous solution [19,20] using a synchrotron-radiation (SR) VUVCD spectrophotometer at the Hiroshima Synchrotron Radiation Center [21,28]. Using the time-dependent density functional theory (TDDFT) and molecular dynamics (MD) simulations involving explicit water molecules [15,35,40], we theoretically revealed that the GT and GG rotamers exhibited negative and positive CD around 170 nm, respectively, while the α- and β-anomer configurations showed negative and positive CD around 160 nm, respectively [19,20]. These results indicate that the experimentally observed and theoretically calculated CD spectra of saccharides can be used to analyze the structures of not only monosaccharides but also more complicated saccharides such as oligosaccharides in aqueous solution.
Few VUVCD spectra of unsubstituted oligosaccharides including disaccharides have been reported, but interesting results have already been obtained, as well as for monosaccharides. Stipanovic et al. measured the CD spectrum of an isomalto-oligosaccharide series with an α-(
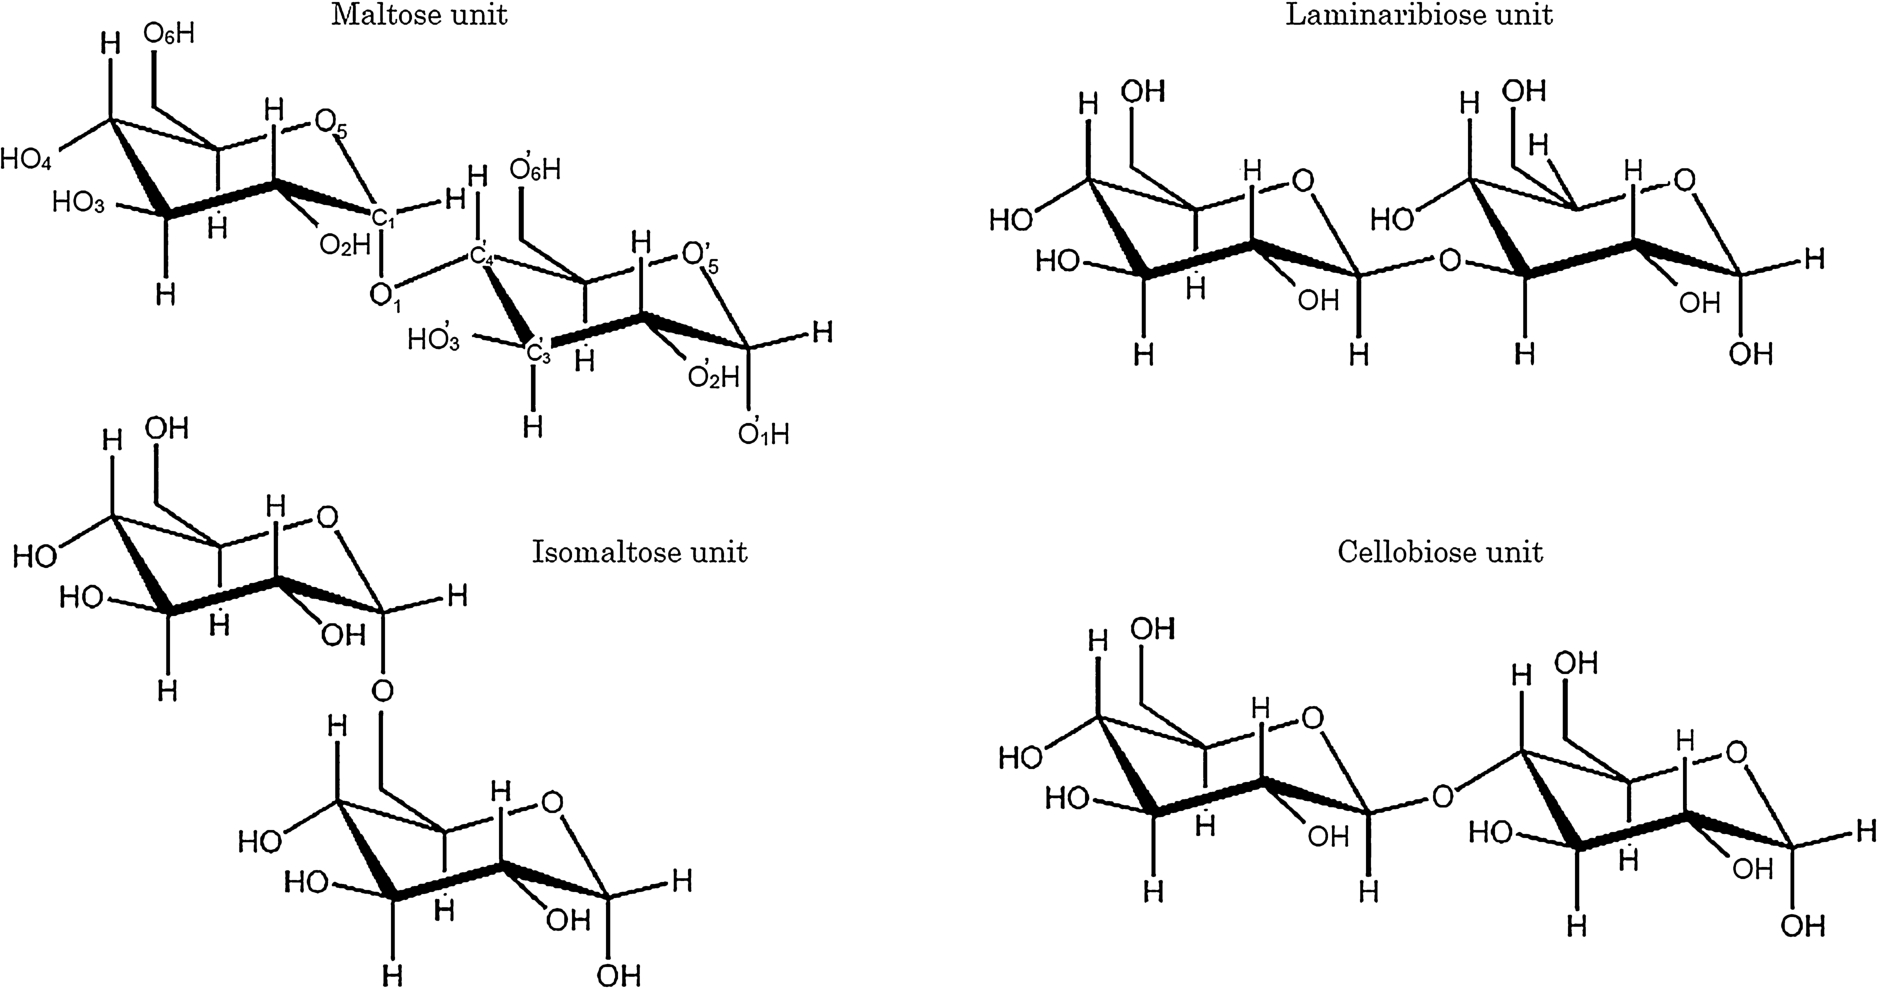
In the present study we measured the VUVCD spectra of the unsubstituted malto-, laminari-, isomalto-, and cello-oligosaccharide series down to 168 nm in aqueous solution at 25°C using a VUVCD spectrophotometer with an SR light source with the aim of clarifying the contributions of the different types of constituent disaccharides and increases in chain length to the structures and CD spectra of oligosaccharides. Table 1 and Fig. 1 respectively present the structural parameters and the chemical structures of disaccharide units of each oligosaccharide series. Although the types of glycosidic linkages differ between the series, all of them are composed of glucose units in order to simplify the comparisons among the CD spectra. To our knowledge, this is the first systematic investigation of the VUVCD of oligosaccharides in aqueous solution using an SR spectrophotometer.
Table 1
Structural parameters of the oligosaccharide series examined in this study
| Oligosaccharide | Monosaccharide unit | Disaccharide unit | Polymer | Glycosidic linkage |
| Malto-oligosaccharide | d-Glucose | Maltose | Amylose | α-( |
| Laminari-oligosaccharide | d-Glucose | Laminaribiose | Laminarin | β-( |
| Isomalto-oligosaccharide | d-Glucose | Isomaltose | Dextran | α-( |
| Cello-oligosaccharide | d-Glucose | Cellobiose | Cellulose | β-( |
Fig. 1.
Chemical structures of disaccharide units of the malto-, laminari-, isomalto-, and cello-oligosaccharide series examined in this study.
2.Materials and methods
2.1.Materials
Malto-oligosaccharides (
2.2.VUVCD measurements
The VUVCD spectra were measured from 200 to 168 nm at 25°C using the SR-VUVCD spectrophotometer. Details of the spectrophotometer and optical cell used are available elsewhere [21,28]. The path length of the CaF2 optical cell was adjusted using a Teflon spacer to 10 μm for the measurements from 200 to 172 nm, while no spacer was used for measurements below 172 nm in order to reduce the absorption of light by water. The spectra obtained without the spacer were calibrated by normalizing the ellipticities to the spectra measured using a 10 μm spacer in the overlapping wavelength region from 200 to 172 nm. The path length of the cell without spacer was estimated to be 1.4 μm by this calibration method [19,20]. All spectra were recorded with a 1.0-mm slit, 4-s time constant, 20-nm/min scan speed, 0.067-nm data interval, and 4–9 accumulations. The molar ellipticity (θ) of all saccharides was calculated using the molecular weight per monosaccharide unit, in which the total molecular weight is divided by the number of monosaccharides. The obtained spectra were reproducible within 5%, and the errors were mainly attributable to noise in the signals and inaccuracies in the length of the light path. The error was approximately twofold higher below 170 nm, mainly due to the increased noise of the signals and inaccuracies in the length of the light path.
3.Results
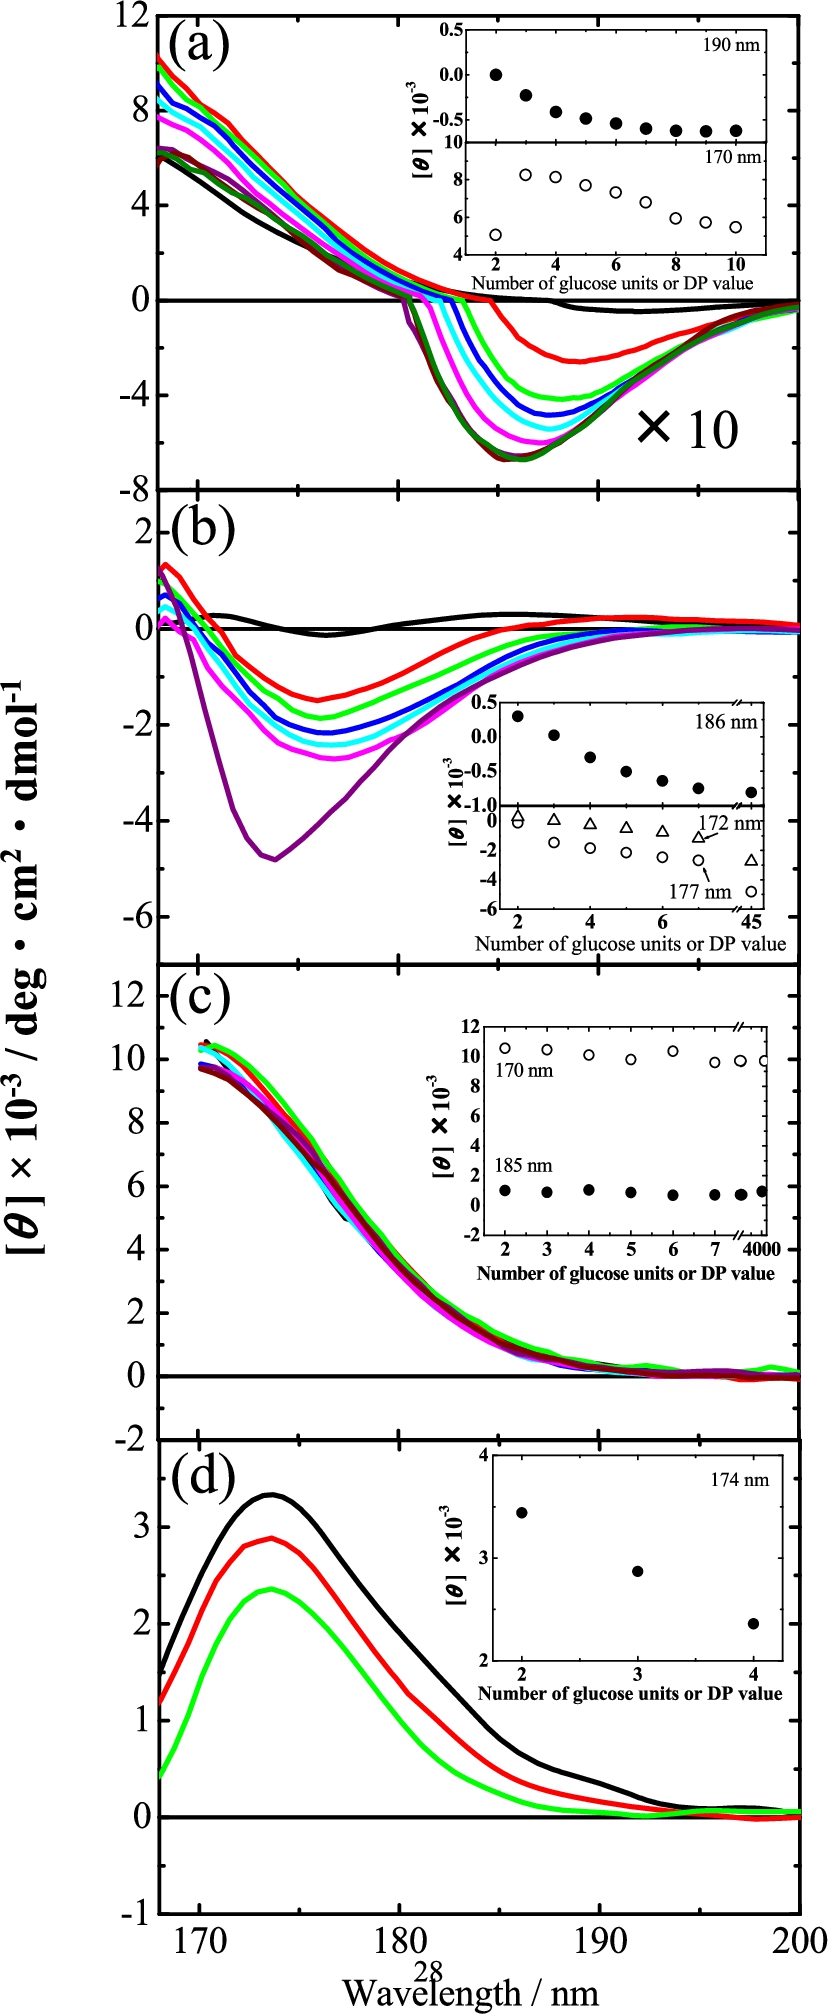
Figure 2 show the VUVCD spectra of the malto-, laminari-, isomalto-, and cello-oligosaccharides measured in this study, respectively. Two dextran polysaccharides and one laminarin polysaccharide were also measured for comparisons, and these are described in the corresponding figures. These figures clearly show CD spectra only in the VUV region below 190 nm, indicating that VUVCD spectroscopy is a powerful tool for detecting the structures of oligosaccharides in aqueous solution. None of these spectra exhibited any concentration dependence, suggesting the absence of aggregations between the solutes within the concentration range examined (1.0–8.0 w/v%) and also meaning that sufficient signal can be detected in the wavelength region below 190 nm where the absorption of water becomes heavy [22].
Fig. 2.
VUVCD spectra of oligosaccharides in aqueous solution at 25°C (a) malto-oligosaccharide series (maltose, black; maltotriose, red; maltotetraose, green; maltopentaose, blue; maltohexaose, sky blue; maltoheptaose, pink; maltooctaose, violet; maltononaose, brown; and maltodecaose, dark green). The intensities of CD in the negative region were shown in the 10-fold spectra. (b) laminari-oligosaccharide series (laminaribiose, black; laminaritriose, red; laminaritetraose, green; laminaripentaose, blue; laminarihexaose, sky blue; and laminariheptaose, pink) and laminarin (violet). (c) isomalto-oligosaccharide series (isomaltose, black; isomaltotriose, red; isomaltotetraose, green; isomaltopentaose, blue; isomaltohexaose, sky blue; and isomaltoheptaose, pink) and dextran (
3.1.Malto-oligosaccharide
Maltose is a disaccharide that has an α-(
To clarify how the malto-oligosaccharide spectra varied with the chain length, the CD intensity at the peaks at 190 and 170 nm (where maltose exhibited a negative CD peak and positive CD, respectively) are plotted against the DP in the inset of Fig. 2(a). It is evident that the peak intensity around 190 nm decreased exponentially as the DP increased, saturating at around
3.2.Laminari-oligosaccharide
Laminaribiose contains two d-glucose molecules joined by an β-(
The CD intensities at 186, 177, and 172 nm where laminaribiose exhibited CD peaks are plotted against the number of glucose units in the inset of Fig. 2(b). As for the malto-oligosaccharide series (Fig. 2(a)), the CD intensity decreased gradually as the chain length increased. A particularly interesting finding was that the intensities of the CD spectra of laminariheptaose and laminarihexaose at 186 nm were similar to that of laminarin, indicating that the intensity at this wavelength decreased exponentially and saturated around
3.3.Isomalto-oligosaccharide
Isomaltose contains two d-glucose molecules joined by an α-(
d-Glucose is a monosaccharide unit of isomalto-oligosaccharides that has equilibrium structures in aqueous solution such as the G/T conformers of the hydroxylmethyl group at C-5 and the α/β-anomers of the hydroxyl group at C-1. It is known that these structures affect the CD spectra below 190 nm [19,20]. The end reducing glucose units with α/β-anomer configurations might underlie the chain-length dependence of the CD spectra, because this effect should decrease gradually as the chain length increases. However, since the VUVCD spectra of isomalto-oligosaccharide series are mostly constant, this suggests negligible or only small contributions of the anomer to the VUVCD spectra down to 170 nm. Further, all of the oligosaccharide series examined in this study are composed of glucose units, and each oligosaccharide series has the same glycosidic linkage, and hence it can be assumed that the contributions of the hydroxylmethyl group at C-5 to CD spectra are largely similar within each oligosaccharide series. This assumption would be reasonable because the populations of G/T conformers of the constituent monosaccharides could be used to accurately calculate the optical rotations of certain disaccharides [9,36].
3.4.Cello-oligosaccharide
Cellobiose is a disaccharide with a β-(
4.Discussion
Our VUVCD measurements of oligosaccharides revealed that the VUVCD spectra exhibited characteristic peaks reflecting differences in the types and lengths of oligosaccharides, thereby demonstrating that VUVCD is sensitively affected by the structure of oligosaccharides. Further, the spectral shapes within each oligosaccharide series were highly similar and the change in the spectra with increases in chain length depended on the types of oligosaccharides or constituent disaccharides, suggesting that the structure of oligosaccharides is mainly determined by the configurations of the constituent disaccharides. Therefore, the disaccharide configurations would be useful for understanding the structures and CD spectra of oligosaccharide in aqueous solution.
4.1.Unique torsion angles of constituent disaccharides affect VUVCD spectra
The crystal structures of disaccharides investigated in this study were already determined by X-ray crystallography [30], showing that maltose, laminaribiose, and cellobiose formed the intramolecular hydrogen bonds between HO’-3…O-2, HO’-4…O-5, and HO’-3…O-5, respectively, while isomaltose did not participate in such bonding (Fig. 1). These intramolecular hydrogen bonds should directly affect the backbone torsion angles of glycosidic linkages. Actually, analyses of the torsion angles of these disaccharides using NMR and X-ray methods [6,29,32] revealed differences in the types of glycosidic linkages, such as ϕ and φ values of 96.8 and 105.2, respectively, for maltose, and
In CD calculations of methyl D-aldopyranosides using the TDDFT method at the CAM-B3LYP/6-311++G** level, the molecular orbitals and rotational strengths related to the electronic transitions of the hydroxyl group, ring oxygen, and methoxy oxygen showed that the wavelength region around 180–170 nm was mainly assigned to the n-σ* transitions from the lone-pair orbital (n-orbital) to the σ*-orbital of ring oxygen and methoxy oxygen (or acetal bond), with only small contributions from hydroxyl groups [19,20]. Further, CD calculations of maltose, laminaribiose, isomaltose, and cellobiose based on their crystal structures [30] using TDDFT method at the CAM-B3LYP/6-311++G** level showed that the wavelength region around 180 nm included the electronic transitions originating from the acetal bond in glysocidic linkages. This theoretical results are supported by the experimental ones of several disaccharides and polysaccharides in which some characteristic CD peaks depended on the types of glycosidic linkages were found around 180–170 nm [14,17]. These results suggest that the unique torsion angles of maltose, laminaribiose, isomaltose, and cellobiose molecules could contribute to their spectral differences (Fig. 2) and also become important factors influencing the backbone structure of oligosaccharide because the spectral shapes within each oligosaccharide series were highly similar.
4.2.Characteristic structures of oligosaccharides affect VUVCD spectra
To understand the spectral change of oligosaccharides with increases in chain length, it is important if the structural changes of oligosaccharides occur at the level of the torsion angle of glycosidic linkages as the chain length increases. Sugiyama et al. determined the torsion angles of malto-oligosaccharides (
Deslandes et al. reported that torsion angles ϕ and φ of β-(
Shen et al. showed differences in backbone torsion angles between cellobiose [7] and cellotetraose [12] in crystal structures [34]. Dudley et al. measured the 13C NMR spectra of cello-oligosaccharides and revealed that the transformation of the cello-oligosaccharide spectrum into that of cellulose is definitely established for cellotetraose and complete for cellopentaose and higher oligomers [10]. Cellulose is known to form sheet structures in crystal form [26,27]. These results suggest the presence of differences in torsion angles among the cello-oligosaccharides as well as the malto- and laminari-oligosaccharide series. Although we could not measure the CD spectra of cello-oligosaccharides above
Dextran is known to form random structures [23], while amylose and laminarin form helical crystal structures. Figure 2(c) shows that there was no characteristic dependence on increases in the chain length in the isomalto-oligosaccharide series and dextran, which suggests that this oligosaccharide series is similar to random structures. These flexible structures would be induced by the extended structure of isomaltose units without intermolecular hydrogen bonds between glucose units.
While the theoretical assignment of oligosaccharide CD spectra using the TDDFT method and MD simulations would be necessary for understanding the relationships between the structure and VUVCD (especially, below 180 nm) of oligosaccharides, the present comprehensive experimental data suggest that the chain length dependence observed in the VUVCD spectra of malto- and laminari-oligosaccharide series should reflect their characteristic structures such as helices, while the isomalto-oligosaccharide series does not show such CD changes due to its flexibility.
5.Conclusions
The VUVCD spectra of various oligosaccharide series suggested that the structure of an oligosaccharide is based on the configuration of the constituent disaccharides, with some oligosaccharides forming a helical structure as the chain length increases, affecting the CD spectra below 190 nm. Investigating the structural characteristics of oligosaccharides is not only inherently interesting but also an important step toward understanding the structure and dynamics of polysaccharides. The further accumulation of VUVCD data and their theoretical assignments is important for understanding the more detailed structures of oligosaccharides and their biological functions, which opens new fields in the structural biology of glycoconjugates.
Acknowledgements
This work was financially supported by Grant-in-Aids for Scientific Research from the Ministry of Education, Science, Sports, and Culture of Japan (No. 22870021 and No. 15KK0260 to K.M.) and by a grant from Kurata Memorial Hitachi Science and Technology Foundation.
References
[1] | E.R. Arndt and E.S. Stevens, Vacuum ultraviolet circular dichroism studies of simple saccharides, J. Am. Chem. Soc. 115: ((1993) ), 7849–7853. doi:10.1021/ja00070a034. |
[2] | N. Berova, K. Nakanishi and R.W. Woody, Circular Dichroism: Principles and Applications, 2nd edn, John Wiley & Sons, New York, (2000) . |
[3] | C. Bertucci, P. Salvadori, Z. Giampaolo, D. Pini and W.C. Johnson Jr., Circular dichroism spectra of some model compounds related to D-glucopyranose and D-galactopyranose, Carbohydr. Chem. 149: ((1986) ), 299–307. doi:10.1016/S0008-6215(00)90053-3. |
[4] | R.B. Best, G.E. Jackson and K.J. Naidoo, Molecular dynamics and NMR study of the α( |
[5] | J. Brown, C.A. O’Callaghan, A.S.J. Marshall, R.J.C. Gilbert, C. Siebold, S. Gordon, G.D. Brown and E.Y. Jones, Structure of the fungal β-glucan-binding immune receptor dectin-1: Implications for function, Protein Sci. 16: ((2007) ), 1042–1052. doi:10.1110/ps.072791207. |
[6] | N.W.H. Cheetham, P. Dasgupta and G.E. Ball, NMR and modelling studies of disaccharide conformation, Carbohydr. Res. 338: ((2003) ), 955–962. doi:10.1016/S0008-6215(03)00069-7. |
[7] | S.S.C. Chu and G.A. Jeffrey, The refinement of the crystal structures of β-D-glucose and cellobiose, Acta Crystallogr. B 24: ((1968) ), 830–838. doi:10.1107/S0567740868003250. |
[8] | Y. Deslandes, R.H. Marchessault and A. Sarko, Triple-helical structure of ( |
[9] | C.A. Duda and E.S. Stevens, Solution conformation of laminaribioside and ( |
[10] | R.L. Dudley, C.A. Fyfe, P.J. Stephenson, Y. Deslandes, G.K. Hamer and R.H. Marchessault, High-resolution carbon-13 CP/MAS NMR spectra of solid cellulose oligomers and the structure of cellulose II, J. Am. Chem. Soc. 105: ((1983) ), 2469–2472. doi:10.1021/ja00346a059. |
[11] | G.D. Fasman, Circular Dichroism and the Conformational Analysis of Biomolecules, Plenum Press, New York, (1996) . |
[12] | K. Gessler, N. Krauss, T. Steiner, C. Betzel, A. Sarko and W. Saenger, β-D-cellotetraose hemihydrate as a structural model for cellulose II. An X-ray diffraction study, J. Am. Chem. Soc. 117: ((1995) ), 11397–11406. doi:10.1021/ja00151a003. |
[13] | E. Goldsmith, S. Sprang and R. Fletterick, Structure of maltoheptaose by difference Fourier methods and a model for glycogen, J. Mol. Biol. 156: ((1982) ), 411–427. doi:10.1016/0022-2836(82)90336-9. |
[14] | W.C. Johnson Jr., The circular dichroism of carbohydrates, Adv. Carbohydr. Chem. Biochem. 45: ((1986) ), 73–124. doi:10.1016/S0065-2318(08)60137-7. |
[15] | K.N. Kirschner and R.J. Woods, Solvent interactions determine carbohydrate conformation, Proc. Natl. Acad. Sci. USA 98: ((2001) ), 10541–10545. doi:10.1073/pnas.191362798. |
[16] | D.G. Lewis and W.C. Johnson Jr., Optical properties of sugars. VI. Circular dichroism of amylose and glucose oligomers, Biopolymers 17: ((1978) ), 1439–1449. doi:10.1002/bip.1978.360170605. |
[17] | K. Matsuo and K. Gekko, Vacuum-ultraviolet circular dichroism study of saccharides by synchrotron radiation spectrophotometry, Carbohydr. Res. 339: ((2004) ), 591–597. doi:10.1016/j.carres.2003.11.019. |
[18] | K. Matsuo and K. Gekko, Construction of a synchrotron-radiation vacuum-ultraviolet circular-dichroism spectrophotometer and its application to the structural analysis of biomolecules, Bull. Chem. Soc. Jpn. 86: ((2013) ), 675–689. doi:10.1246/bcsj.20120341. |
[19] | K. Matsuo, H. Namatame, M. Taniguchi and K. Gekko, Vacuum-ultraviolet electronic circular dichroism study of methyl α-D-glucopyranoside in aqueous solution by time-dependent density functional theory, J. Phys. Chem. A 116: ((2012) ), 9996–10003. doi:10.1021/jp306914s. |
[20] | K. Matsuo, H. Namatame, M. Taniguchi and K. Gekko, Solution structures of methyl aldopyranosides revealed by vacuum-ultraviolet electronic circular-dichroism spectroscopy, Biomed. Spectrosc. Imaging 4: ((2015) ), 269–282. doi:10.3233/BSI-150116. |
[21] | K. Matsuo, K. Sakai, Y. Matsushima, T. Fukuyama and K. Gekko, Optical cell with a temperature-control unit for a vacuum-ultraviolet circular dichroism spectrophotometer, Anal. Sci. 19: ((2003) ), 129–132. doi:10.2116/analsci.19.129. |
[22] | J. Miles and B.A. Wallace, Synchrotron radiation circular dichroism spectroscopy of proteins and applications in structural and functional genomics, Chem. Soc. Rev. 35: ((2006) ), 39–51. doi:10.1039/B316168B. |
[23] | J.W. Mwangi and C.M. Ofner 3rd, Crosslinked gelatin matrices: Release of a random coil macromolecular solute, Int. J. Pharma. 278: ((2004) ), 319–327. doi:10.1016/j.ijpharm.2004.03.024. |
[24] | R.G. Nelson and W.C. Johnson Jr., Optical properties of sugars. I. Circular dichroism of monomers at equilibrium, J. Am. Chem. Soc. 94: ((1972) ), 3343–3345. doi:10.1021/ja00765a013. |
[25] | R.G. Nelson and W.C. Johnson Jr., Optical properties of sugars. 4. Circular dichroism of methyl aldopyranosides, J. Am. Chem. Soc. 98: ((1976) ), 4296–4301. doi:10.1021/ja00430a048. |
[26] | Y. Nishiyama, P. Langan and H. Chanzy, Crystal structure and hydrogen-bonding system in cellulose |
[27] | Y. Nishiyama, J. Sugiyama, H. Chanzy and P. Langan, Crystal structure and hydrogen bonding system in cellulose |
[28] | N. Ojima, K. Sakai, K. Matsuo, T. Matsui, T. Fukazawa, H. Namatame, M. Taniguchi and K. Gekko, Vacuum-ultraviolet circular dichroism spectrophotometer using synchrotron radiation: Optical system and on-line performance, Chem. Lett. 30: ((2001) ), 522–523. doi:10.1246/cl.2001.522. |
[29] | C.S. Pereira, D. Kony, R. Baron, M. Müller, W.F. van Gunsteren and P.H. Hünenberger, Conformational and dynamical properties of disaccharides in water: A molecular dynamics study, Biophys. J. 90: ((2006) ), 4337–4344. doi:10.1529/biophysj.106.081539. |
[30] | S. Pérez, C. Gautier and A. Imherty, Oligosaccharide conformations by diffraction methods, in: Carbohydrates in Chemistry and Biology, B. Ernst, G.W. Hart and P. Sinaý, eds, John Wiley & Sons, New Jersey, (2008) , pp. 969–1001. |
[31] | B. Pfannemüller and G. Ziegast, Properties of aqueous amylose and amylose – iodine solutions, in: Solution Properties of Polysaccharides, D. Brant, ed., ACS Symposium Series, Vol. 150: , (1981) , pp. 529–548. doi:10.1021/bk-1981-0150.ch035. |
[32] | V.S.R. Rao, P.K. Qasba, P.V. Balaji and R. Chandrasekaran, Conformation of Carbohydrates, Harwood Academic Publishers, Amsterdam, The Netherlands, (1998) . |
[33] | H. Saito, R. Tabeta, Y. Yashioka, C. Hara, T. Kiho and S. Ukai, A high-resolution solid-state 13C NMR study of the secondary structure of branched ( |
[34] | T.Y. Shen, P. Langan, A.D. French, G.P. Johnson and S. Gnanakaran, Conformational flexibility of soluble cellulose oligomers: Chain length and temperature dependence, J. Am. Chem. Soc. 131: ((2009) ), 14786–14794. doi:10.1021/ja9034158. |
[35] | C. Simmerling, T. Fox and P.A. Kollman, Use of locally enhanced sampling in free energy calculations: Testing and application to the |
[36] | E.S. Stevens and B.K. Sathyanarayana, Potential-energy surfaces of cellobiose and maltose in aqueous solution: A new treatment of disaccharide optical rotation, J. Am. Chem. Soc. 111: ((1989) ), 4149–4154. doi:10.1021/ja00194a001. |
[37] | A.J. Stipanovic and E.S. Stevens, Vacuum ultraviolet circular dichroism of ( |
[38] | A.J. Stipanovic, E.S. Stevens and K. Gekko, Vacuum ultraviolet circular dichroism of dextran, Macromolecules 13: ((1980) ), 1471–1473. doi:10.1021/ma60078a021. |
[39] | H. Sugiyama, T. Nitta, M. Horii, K. Motohashi, J. Sakai, T. Usui, K. Hisamichi and J.I. Ishiyama, The conformation of α-( |
[40] | T. Suzuki, The hydration of glucose: The local configurations in sugar–water hydrogen bonds, Phys. Chem. Chem. Phys. 10: ((2008) ), 96–105. doi:10.1039/B708719E. |
[41] | B.A. Wallace, K. Gekko, S.V. Hoffmann, Y. Lin, J.C. Sutherland, Y. Tao, F. Wien and R.W. Janes, Synchrotron radiation circular dichroism (SRCD) spectroscopy: An emerging method in structural biology for examining protein conformations and protein interactions, Nucl. Instrum. Methods Phys. Res. A 649: ((2010) ), 177–178. doi:10.1016/j.nima.2010.10.135. |
[42] | H.-C.H. Wu and A. Sarko, The double-helical molecular structure of crystalline b-amylose, Carbohydr. Res. 61: ((1978) ), 7–25. doi:10.1016/S0008-6215(00)84463-8. |
[43] | H.-C.H. Wu and A. Sarko, The double helical molecular structure of crystalline a-amylose, Carbohydr. Res. 61: ((1978) ), 27–40. doi:10.1016/S0008-6215(00)84464-X. |
[44] | A. Yiannikouris, G. André, A. Buléon, G. Jeminet, I. Canet, J. François, G. Bertin and J.-P. Jouany, Comprehensive conformational study of key interactions involved in zearalenone complexation with β-D-glucans, Biomolecules 5: ((2004) ), 2176–2185. |


