
Two sides of the same coin: How enzymes distort substrates and vice versa. An infrared spectroscopic view on pyruvate kinase and Ca2+-ATPase
Abstract
This review summarises our infrared spectroscopy and density functional theory studies on the mutual interactions between enzymes and their substrates. We investigated phosphoenolpyruvate bound to pyruvate kinase (EC 2.7.1.40, M1 isozyme), ATP bound to the Ca2+-ATPase (SERCA1a), and the aspartylphosphate moiety of the Ca2+-ATPase phosphoenzyme E2P. Conformational changes of the enzymes and distortions of substrate structure are discussed. In all cases, the infrared absorption of the substrate in the enzyme environment could be identified by a combination of reaction-induced difference spectroscopy and isotopic labelling. The experimentally-determined vibrational frequencies were interpreted in structural terms using experimental correlations or modelling of the active site in density functional theory calculations. For none of the three systems, a weakening of the bond that is cleaved in the following enzymatic reaction could be detected in the ground state of the enzyme-substrate complex. However, for the dephosphorylation reaction of the Ca2+-ATPase phosphoenzyme E2P, a high energy intermediate, not detected in experiments, is the reactant state according to density functional theory calculations.
Abbreviations
ATR | attenuated total reflection. |
1.Introduction
The active site of enzymes catalyses chemical reactions at a rate that highly exceeds that in aqueous solution. This has been explained for several decades by a stabilisation of the transition state of the reaction by the enzyme environment. A more recent suggestion is that the structure of the reacting groups is perturbed already the ground state so that the energy difference between ground state and transition state reduces. This has been denoted by technical terms as ground state or substrate destabilization, or near-attack conformers [2,18,20,21,68]. Structural distortions on the level of individual bonds are difficult to detect with X-ray crystallography because of insufficient resolution of most structures (see [10] for a more detailed discussion). Here, vibrational spectroscopy comes to rescue, since the vibrational frequencies are intimately linked to bond length via the bond force constant. As a consequence, the vibrational spectrum is sensitive to bond length changes on the pm scale [26]. In the following, bond length distortions are discussed for two enzymes, pyruvate kinase and Ca2+-ATPase. The vibrational spectroscopy method used was in both cases infrared spectroscopy.
In order to study the structure of reactive groups in enzyme environments with infrared spectroscopy, one needs to record their infrared spectrum with high fidelity. Unfortunately, the simple approach to record a spectrum of the enzyme with its substrate will not be sufficiently sensitive. Proteins have a massive number of vibrations (nearly 50,000 in the case of the Ca2+-ATPase, for example) and the absorption of the substrate will “drown” in the absorption of the protein. Therefore, two measures usually need to be combined to obtain the absorption of the substrate: the recording of a difference spectrum of substrate binding, and the identification of substrate signals in this spectrum by isotopic labelling. The former aspect is discussed in the following, whereas the latter is illustrated when the enzyme reactions of interest are discussed.
The approach of choice for recording difference spectra is reaction-induced infrared difference spectroscopy [8,30,39,40,69,71]. It implies to trigger the reaction of interest directly in the infrared cuvette. This avoids the comparison of spectra from different samples and provides a very sensitive detection of the small infrared absorbance changes associated with protein reactions. Several methods are available to trigger the binding of molecules to proteins: rapid mixing in specially designed cuvettes [50,70], the use of photolabile molecules that release the substrate upon illumination [14], and several techniques using attenuated total reflection (ATR) [33]:
(i) Protein films can be prepared on the ATR crystal either by direct adsorption in the case of membrane proteins [3] or via chemical linkers [61,67]. Then a buffer is allowed to flow over the protein film to which a substrate can be added.
(ii) The protein sample may be confined between ATR crystal and a dialysis membrane [31,34]. A substrate can then be added to the buffer on top of the dialysis membrane.
Two of these approaches have been used in our studies of pyruvate kinase and Ca2+-ATPase will be discussed in the respective sections.
2.Phosphenolpyruvate binding to pyruvate kinase
Pyruvate kinase catalyses the final step of glycolysis, i.e. the phosphate transfer from phosphenolpyruvate to ADP. The reaction products are pyruvate and ATP. In spite of ATP being produced, the reaction belongs to the three exergonic reactions in glycolysis because of the high phosphoryl-transfer potential of phosphenolpyruvate. We studied rabbit muscle pyruvate kinase (EC 2.7.1.40, M1 isozyme), which is a homo-tetramer where each monomer consists of 530 residues. The active site is at the interface between two domains of the same monomer. Binding of the phosphenolpyruvate analogue L-phospholactate leads to a more closed conformation of the two domains that form the active site [45]. In this conformation, a Mg2+ coordinates to L-phospholactate via a carboxylate oxygen, the bridging ester oxygen and a terminal phosphate oxygen as shown in Fig. 1. A further terminal phosphate oxygen coordinates to a K+. Most subunits in this structure adopt a more open conformation and their active sites are not fully occupied by the substrate analogue. In these subunits, the coordination of L-phospholactate to K+ is retained but that to Mg2+ is lost.
Fig. 1.
Structure of the phosphoenolpyruvate binding site of pyruvate kinase in a closed conformation (site A of protein data bank entry 1AQF [45]). The structure was obtained with the substrate analogue L-phospholactate shown as balls and sticks. Mg2+ is dark green and K+ magenta.
![Structure of the phosphoenolpyruvate binding site of pyruvate kinase in a closed conformation (site A of protein data bank entry 1AQF [45]). The structure was obtained with the substrate analogue L-phospholactate shown as balls and sticks. Mg2+ is dark green and K+ magenta.](https://content.iospress.com:443/media/bsi/2016/5-2/bsi-5-2-bsi134/bsi-5-bsi134-g001.jpg)
Fig. 2.
Scheme of the dialysis setup used to study pyruvate kinase. Several pyruvate kinase monomers (pdb entry 1PKN) are shown in the protein compartment and a number of phosphenolpyruvate molecules in the reservoir and the protein compartment. Light source and detector of the Fourier-transform infrared spectrometer are indicated and the screen shows a section of the binding-induced difference spectrum. The figure is adapted from our figure on the cover of the issue that contains the description of our setup [41].
![Scheme of the dialysis setup used to study pyruvate kinase. Several pyruvate kinase monomers (pdb entry 1PKN) are shown in the protein compartment and a number of phosphenolpyruvate molecules in the reservoir and the protein compartment. Light source and detector of the Fourier-transform infrared spectrometer are indicated and the screen shows a section of the binding-induced difference spectrum. The figure is adapted from our figure on the cover of the issue that contains the description of our setup [41].](https://content.iospress.com:443/media/bsi/2016/5-2/bsi-5-2-bsi134/bsi-5-bsi134-g002.jpg)
In our studies of pyruvate kinase, we used a dialysis setup [41] to initiate phosphenolpyruvate binding to the enzyme. In this setup, shown in Fig. 2, the sample compartment is enclosed on one side by the ATR crystal (diamond) and on the other side by a dialysis membrane. The dialysis membrane is attached via an O-ring to a reservoir that is accessible for the operator. Thus, the composition of the solution in the reservoir can be altered, for example by adding a protein ligand. A small stirrer speeds up equilibration of the solution in the reservoir. A typical measurement is performed in the following way. A few µl of highly concentrated protein solution are placed on the ATR crystal and as hanging drop on the dialysis membrane (a total of 6 µl at 0.8 mM protein concentration were used). Then, the reservoir is allowed to slide down in a cylindrical block which combines the two protein solutions and closes the sample compartment. After this, the protein settles and this process needs to complete before a ligand can be added to the reservoir. Settling increases the overall protein absorption detected in the measurement because the infrared light penetrates only a few µm into the sample compartment, i.e. it is sensitive only to processes that are close to the surface of the ATR crystal. Once the absorbance of the sample is stable, a ligand can be added to the reservoir. It diffuses into the sample compartment and binds to the protein. From a reference spectrum before addition of the ligand and a series of spectra after the addition, a series of difference spectra can be calculated that reflect the absorbance changes induced by addition of the ligand. The early phase of these changes reflects the conformational change of the protein and the absorption of the bound ligand. Once the available binding sites are occupied, the absorption of the free ligand is also evident in the difference spectra. Further additions of the ligand cause only absorbance changes due to an increase in concentration of the free ligand [42].
Fig. 3.
Difference spectra of phosphenolpyruvate binding to pyruvate kinase (0.8 mM) in 1H2O [42]. Top and bottom spectra were obtained with unlabelled and 13C labelled phosphenolpyruvate, respectively. Band shifts due to isotopic labelling are indicated by the lines between the spectra. The arrows above the spectra mark the approximate band positions of phosphoenolpyruvate in aqueous solution. The text at the top of the figure gives the assignments of bands to molecular groups of phosphenolpyruvate.
![Difference spectra of phosphenolpyruvate binding to pyruvate kinase (0.8 mM) in 1H2O [42]. Top and bottom spectra were obtained with unlabelled and 13C labelled phosphenolpyruvate, respectively. Band shifts due to isotopic labelling are indicated by the lines between the spectra. The arrows above the spectra mark the approximate band positions of phosphoenolpyruvate in aqueous solution. The text at the top of the figure gives the assignments of bands to molecular groups of phosphenolpyruvate.](https://content.iospress.com:443/media/bsi/2016/5-2/bsi-5-2-bsi134/bsi-5-bsi134-g003.jpg)
The advantage of the approach is that it can be used for soluble proteins. For some proteins, it enables measurements with superb sensitivity, as in the case of pyruvate kinase. However, it does not work well for all proteins. Some take very long to settle, which implies that it takes very long to achieve a stable absorbance spectrum before a ligand can be added. Even if the absorbance becomes eventually stable, an addition to the solution in the reservoir might induce more settling of the protein, which can mask the absorbance changes of interest.
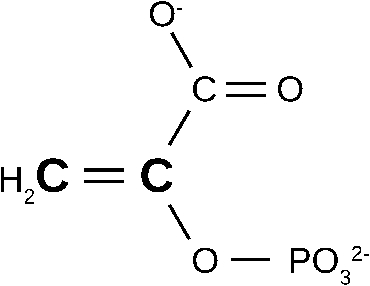
The difference spectrum of phosphenolpyruvate binding to pyruvate kinase is shown in Fig. 3 (top spectrum) and the structure of phosphenolpyruvate in Fig. 4. The difference spectrum reflects absorbance changes of the protein and the absorption spectrum of the bound substrate. Note that in case of the substrate, the difference spectrum does not reflect the absorbance changes of the substrate upon binding, i.e. the difference between free and bound substrate. The reason for this is that the substrate was absent when the reference spectrum was recorded. The protein, however, was present, and thus the difference spectrum contains the absorbance changes of the protein upon binding. The protein signals reflect conformational changes of the protein backbone as well as changes in interaction of the side chains. The former are found in specific regions of the spectrum, called amide I (1700–1610 cm−1), amide II (1570–1510 cm−1), and amide III (1400–1200 cm−1) regions, whereas the latter occur in the entire mid-infrared spectral range. Also the substrate can absorb in the entire mid-infrared range. Therefore the spectral position of a band is generally not sufficient to attribute it to substrate, protein side chains, or protein backbone. There are two exceptions: (i) the region above 1700 cm−1 exhibits the absorption of the carbonyl groups of aldehydes, ketones, esters and protonated carboxyl groups. If the substrate does not contain such groups, the signals can be assigned to protonated Asp and Glu residues. (ii) Bands in the 1700–1610 cm−1 region are usually dominated by changes in the amide I vibration of the protein backbone. Such an assignment can be strengthened by repeating the experiment in D2O, since amide I bands typically shift by 5–10 cm−1, whereas side chain bands [5] shift more.
Fig. 4.
Structure of phosphenolpyruvate. The two 13C labelled carbon atoms are indicated by boldface and a larger letter size.
Changes of the amide I protein absorption are due to conformational changes of the protein backbone. Although these are not the focus of this article, they are briefly discussed here in order to provide a comprehensive account of the observed effects. The amide I spectral region is usually interpreted in terms of secondary structure. However, it should be kept in mind that secondary structure is only indirectly encoded in the spectrum. The structural sensitivity of the amide I vibration stems from a number of parameters like the relative orientation and distance of amide groups, hydrogen bonding, and the local conformation of the backbone [8,17]. Therefore, also structural changes within existing secondary structure elements reflect in the difference spectra.
For pyruvate kinase it is known that substrate binding induces a transition to a more closed conformation [35,53]. Such changes are often achieved by bringing two domains together that are connected by a flexible linker. The linker is likely not to contribute much to the infrared difference spectrum, since its absorption can be expected to be broad in both the open and the closed state due to its conformational fluctuations. Instead, the amide I signals will be caused by structural distortions of the secondary structure elements within the domains.
The amide I region of the difference spectrum shown in Fig. 3 does not provide much more information than that all secondary structure types are perturbed by binding. However, when repeating the experiment under different conditions, more detailed information can be obtained. For example, β-sheets were differently affected by phosphenolpyruvate binding in the presence of Na+ than in the presence of Li+, K+, and Cs+. In contrast, α-helices were perturbed in a similar way in the presence of all monovalent ions. When Mn2+ replaced Mg2+, the binding-induced conformational change was considerably larger indicating that more subunits converted to the closed conformation [43]. As the substrate binds to the divalent ion only in the closed conformation [45], it is conceivable that the nature of the divalent affects the equilibrium between open and closed states.
The presence of the allosteric effector fructose 1,6-bisphosphate leads to a larger conformational change upon binding of phosphenolpyruvate when K+ and Mg2+ are bound at the active site, but not when K+ is substituted by Na+, or when Mg2+ is substituted by Mn2+ [44]. Under the former conditions, the conformational change is as large as without the allosteric modulator when Mn2+ is the divalent ion. This is illustrated in Fig. 5. Thus it seems that fructose 1,6-bisphosphate compensates for a deficiency of Mg2+ to promote the formation of the closed conformation.
Fig. 5.
The extent of conformational change upon phosphenolpyruvate binding to pyruvate kinase [44]. The difference in absorbance values of the positive band at 1696 and the negative band at 1678 cm−1 was used as a measure of conformational change. The ions in the active site of pyruvate kinase are indicated. FBP stands for fructose 1,6-bisphosphate.
![The extent of conformational change upon phosphenolpyruvate binding to pyruvate kinase [44]. The difference in absorbance values of the positive band at 1696 and the negative band at 1678 cm−1 was used as a measure of conformational change. The ions in the active site of pyruvate kinase are indicated. FBP stands for fructose 1,6-bisphosphate.](https://content.iospress.com:443/media/bsi/2016/5-2/bsi-5-2-bsi134/bsi-5-bsi134-g005.jpg)
For bands on the low wavenumber side of the amide I region, additional experiments need to be performed to assign them to specific molecular groups. A first indication as to where substrate bands are to be expected can be obtained by recording a spectrum of the substrate in aqueous solution. However, this spectrum can change when the substrate binds to an enzyme because the interactions in the active site are different from those in water. For a definitive assignment of bands, an experiment with isotopically labelled substrate is necessary. Substitution of the naturally occurring isotope of an atom by a heavier one decreases the frequencies of vibrations which involve movement of the considered atom. Since the vibrational frequency equals the frequency of the absorbed light for the fundamental transitions observed in the mid-infrared spectral range, such a frequency shift reflects in the spectrum and can be used to identify the absorption of the substrate in the spectrum.
The bottom spectrum in Fig. 3 shows the binding-induced difference spectrum obtained with 13C-labelled phosphenolpyruvate. The two 13C atoms are indicated in Fig. 4. Labelling leads to several shifts in the spectrum which are indicated by the connecting lines between the spectra in Fig. 3. The observed shifts are in line with those expected from spectra in aqueous solution and can be assigned to specific vibrations from tabulated assignments [25] and density functional theory (DFT) calculations [59]. This has identified the absorption of four substrate vibrations in the binding-induced difference spectrum: the antisymmetric and symmetric COO− stretching vibrations (1590 and 1415 cm−1, respectively), the C–O(–P) stretching vibration (1214 cm−1) and the symmetric PO32− stretching vibration (968 cm−1). Unfortunately, the asymmetric PO32− stretching vibration exhibits only a very small shift upon isotopic substitution in aqueous solution which cannot be detected in the binding-induced difference spectrum. However, intensity and width of its absorption band are considerably larger than for the symmetric stretching vibration and therefore most of the band at 1111 cm−1 can be assigned to the asymmetric stretching vibration. The arrows in Fig. 3 indicate the absorption of phosphenolpyruvate in aqueous solution which occurs at slightly different wavenumbers. These differences demonstrate that the enzyme environment induces distortions of the bound substrate which comprise bond length and/or bond angle changes. However, these changes are small. Using the bond valence model [19], we estimated that the scissile C–O bond elongates ⩽3 pm and weakens ⩽1.4% when phosphenolpyruvate binds to the enzyme. Thus, phosphenolpyruvate binding alone does not lead to a ground state distortion that significantly reduces the activation energy. Such an effect would probably not be “desired”, since it would increase the rate of dephosporylation of phosphenolpyruvate in the absence of the second substrate ADP.
Also for other bonds, the terminal P–O bonds and the shorter of the two carboxylate C–O bonds, only small bond length changes were concluded. Regarding the carboxylate group, an interesting observation was made when the phosphenolpyruvate binding experiment was performed in the presence of Mn2+ instead of Mg2+. The minor bands near 1570 cm−1, i.e. between the 1590 and 1551 cm−1 bands, are no longer present. Instead their absorption and that of the 1590 cm−1 bands seem to be concentrated in one band at 1582 cm−1. From this observation of only one band, a more homogeneous binding mode of phosphenolpyruvate in the presence of Mn2+ was concluded [43]. This is likely related to the larger conformational change observed in the presence of Mn2+ which causes more subunits to be in a closed conformation. In this conformation, the divalent cation binds to the carboxylate group (as well as to the phosphate group) of phosphenolpyruvate. Thus, the transition from open to closed conformation is expected to alter the binding mode of the carboxylate group in line with our observation.
The choice of the monovalent ion affects the band position of the carboxylate symmetric stretching vibration of bound phosphenolpyruvate (1417–1415 cm−1). These differences were interpreted according to DFT calculations [59] in terms of a rotation of the carboxylate group around the adjacent C–C bond by a few degrees [43]. They are observed although the monovalent ion does not directly coordinate to the carboxylate group. This indicates that the entire binding mode of phosphenolpyruvate is affected when a single local interaction is modified.
In summary, the infrared difference spectra of phosphenolpyruvate binding to pyruvate kinase provide clear evidence for a distortion of substrate structure upon binding. This evidence was obtained after identifying the absorption of the bound substrate with help of isotopic labelling. Spectrum and structure were linked by empirical correlations and DFT calculations. On a whole, binding of phosphenolpyruvate alone does not lead to a significant weakening of the scissile P–O bond.
3.ATP binding to the Ca2+-ATPase
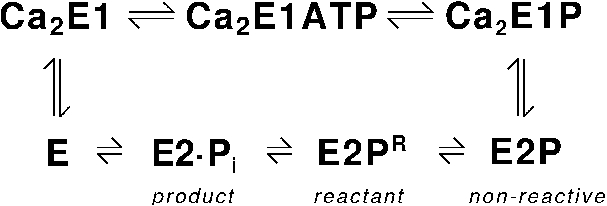
The sarcoplasmic reticulum Ca2+-ATPase (SERCA1a) [36] carries out the primary active transport of Ca2+ across sarcoplasmic reticulum membranes [52,64]. This transport is fuelled by ATP and the Ca2+-ATPase stands for ∼6% of the total ATP consumption in mammals [56]. Its function is to remove Ca2+ from the cytosol of an excited muscle cell and thereby to induce muscle relaxation. The reaction cycle of the Ca2+-ATPase is shown in Fig. 6. When two Ca2+ are bound to the enzyme, ATP can transfer its γ-phosphate to Asp351 of the ATPase. This forms a first phosphoenzyme intermediate Ca2E1P, where both Ca2+ are occluded. Subsequently, a second phosphoenzyme intermediate E2P is formed, the two Ca2+ are released towards the lumen of the sarcoplasmatic reticulum, and the Ca2+ binding sites become partly protonated. Dephosphorylation of E2P and rebinding of Ca2+ from the cytosolic side complete the reaction cycle. Two partial reactions are of interest here: ATP binding to the Ca2+ loaded ATPase and dephosphorylation of the E2P phosphoenzyme. The focus will be on the latter reaction, which was recently studied by quantum chemical calculations [10,58,60] whereas our results regarding the former reaction have been summarised before [9].
Fig. 6.
Reaction cycle of the Ca2+-ATPase. E2P denotes the ground state of the second phosphoenzyme intermediate. It is called non-reactive for reasons given in the text. E2PR is the reactant state for the dephosphorylation reaction.
For both reactions, the relevant infrared difference spectra were generated with the help of caged compounds [14,32,37,51]. These are photolabile molecules that release a compound of interest upon UV illumination. For the experiments described in the following, caged ATP and caged ATP analogues were used. As the photolysis of caged ATP is a chemical reaction, it reflects in the infrared difference spectra [7,13,14,23]. Most of these changes are instantaneous at the time resolution (60 ms) of our rapid scan experiments, but the side reactions of the photolysis products are slower [12]. Because of the photolysis signals, it is advisable to optimise the concentration of the caged compound in the sample so that just enough compound is released to obtain saturating protein signals. This maximises the protein signals relative to the photolysis signals and enables to subtract the latter [15,16]. In this way, the entire mid-infrared spectral region becomes accessible for the study of protein reactions. The caged compound approach has the advantage of high time resolution, so that consecutive protein reactions can be followed. The primary compound released or the primary product of an enzymatic reaction can be modified at a later time by helper enzymes that are added in small amounts to induce a second reaction [29,38,49]. This increases the versatility of the approach. However, it is less general than the dialysis method described above, as it might require the synthesis of a new caged compound. In addition, the caged compound might already bind to the protein [22,62] and might even be a substrate of the enzyme. Both aspects should be considered when using this approach.
Fig. 7.
Infrared difference spectra of ATP binding (top) and E2P formation (bottom) in 1H2O at an ATPase concentration of 0.7 mM [16]. In both cases, the initial state was the Ca2+ loaded state Ca2E1. Several spectral regions are marked by a grey background: the amide I region, where conformational changes are monitored, is labelled C. The label P indicates regions where the photolysis reaction contributes to the signals. Also, the spectral region of phosphate absorption is indicated. The arrow points to a band of the E2P phosphate group.
![Infrared difference spectra of ATP binding (top) and E2P formation (bottom) in 1H2O at an ATPase concentration of 0.7 mM [16]. In both cases, the initial state was the Ca2+ loaded state Ca2E1. Several spectral regions are marked by a grey background: the amide I region, where conformational changes are monitored, is labelled C. The label P indicates regions where the photolysis reaction contributes to the signals. Also, the spectral region of phosphate absorption is indicated. The arrow points to a band of the E2P phosphate group.](https://content.iospress.com:443/media/bsi/2016/5-2/bsi-5-2-bsi134/bsi-5-bsi134-g007.jpg)
In the following, the conformational change of the protein is discussed first, which is followed by an analysis of the structure of the bound substrate. Fig. 7 shows the difference spectra of two partial reactions, ATP binding (Ca2E1 → Ca2E1ATP, obtained within the first 400 ms after ATP relase) and of E2P formation (Ca2E1 → E2P, obtained 90–150 s after ATP release) [16]. The largest changes are seen in the amide I region and indicate conformational changes of the protein. The conformational change upon nucleotide binding is thought to reflect the transition from a more open cleft between the nucleotide binding and the phosphorylation domain in Ca2E1 to a closed conformation in Ca2E1ATP [47]. These changes have been used to identify the functional groups of ATP that are important for binding to the ATPase [46,47]. To this end caged ATP analogues were synthesised that lacked individual functional groups of ATP (γ-phosphate, hydroxyls, amino group). The lack of each of these groups reduced the extent of conformational change, while keeping the shape of the amide I signals similar. This demonstrates that the modified groups interact with the Ca2+-ATPase in the Ca2E1ATP complex, which was later confirmed by X-ray crystallography [63,65] as shown in Fig. 8. In addition, the spectra reveal the consequences of removing each of these interactions: the conformational change is reduced and this has been interpreted as evidence for a less closed conformation of the ATPase complex with the ATP analogues as compared to the complex with ATP. In experiments with a further ATP analogue, 2′,3′-O-(2,4,6-trinitrophenyl)adenosine 5′-monophosphate (TNP-AMP), the amide I range revealed a different binding mode and it was suggested that the binding of this analogue opens the cleft [48].
Fig. 8.
Structure of the nucleotide binding site of the Ca2+-ATPase (protein data bank entry 1T5S [63]). The ATP-analog AMPPCP is shown as balls and sticks. Mg2+ is coloured dark green. ATPase residues in the foreground are represented as sticks and residues in the background as spheres. The nucleotide binding domain is indicated by light grey carbon and backbone atoms while the respective atoms are dark grey for the phosphorylation domain. The figure illustrates that the nucleotide mediates the interactions between the two domains.
![Structure of the nucleotide binding site of the Ca2+-ATPase (protein data bank entry 1T5S [63]). The ATP-analog AMPPCP is shown as balls and sticks. Mg2+ is coloured dark green. ATPase residues in the foreground are represented as sticks and residues in the background as spheres. The nucleotide binding domain is indicated by light grey carbon and backbone atoms while the respective atoms are dark grey for the phosphorylation domain. The figure illustrates that the nucleotide mediates the interactions between the two domains.](https://content.iospress.com:443/media/bsi/2016/5-2/bsi-5-2-bsi134/bsi-5-bsi134-g008.jpg)
As mentioned already in the pyruvate kinase section, bands of the bound substrate can only be identified in the spectrum by isotopic labelling of the substrate. In case of ATP binding to the Ca2+-ATPase, the β- and the γ-phosphate of ATP were 18O labelled and the respective caged compounds were synthesised. Then, ATP binding spectra were recorded and small differences in the phosphate region (see Fig. 7) analysed. These changes are difficult to interpret because two states contribute to each of the compared spectra (e.g. free ATP and bound ATP) each of which has 6 vibrations of the three phosphate groups (not counting the symmetric stretching vibration of the PO32− group which absorbs outside the investigated spectral range) that shift to different degrees upon isotopic substitution. Nevertheless, five of the six vibrations of bound ATP could be identified in the spectra. Band shifts were observed with respect to the spectrum of free ATP, however, the overall conclusion was that the phosphate groups experience interactions of similar strength in the protein environment and in water. An interesting difference to similar studies on GTP bound to Ras [1,22,24,28] is that the vibrations of α-, β- and γ-phosphate are largely decoupled in this case, whereas they are coupled in the ATPase ATP complex.
4.Dephosphorylation of the Ca2+-ATPase E2P phosphoenzyme
Dephosphorylation of the E2P aspartyl phosphate proceeds much faster [55] than the respective reaction of the model compound acetyl phosphate in water [27]. Therefore it was interesting to study whether ground state destabilisation could explain some of the rate enhancement observed for the enzymatic reaction. The particular question was whether the bridging bond between aspartyl moiety and phosphate group was already elongated and weakened in the E2P ground state. Again, the absorption of the reactive group was identified by isotopic labelling. In principle, the experiment is easy. The ATPase can be phosphorylated by inorganic phosphate in a back reaction of its physiological reaction cycle and this can be done with unlabelled and 18O-labelled phosphate. However, we did not manage to observe phosphorylation in infrared difference spectra when we used caged phosphate to initiate the reaction. Therefore, E2P had to be generated in the forward mode of the reaction cycle by using labelled and unlabelled caged ATP [4]. This revealed one band that was sensitive to isotopic substitution (marked with an arrow in Fig. 7) and which therefore could be assigned to the E2P phosphate group. The obtained spectra with different isotopes were subtracted to reveal only the effects of isotopic substitution, however, the resulting spectrum contained too much noise to clearly identify the phosphate bands [6]. Therefore a different experiment was designed which directly monitored an isotope exchange at the phosphate oxygens in a single sample. The experiment exploited that each dephosphorylation reaction incorporates a water oxygen. If that consists of a different isotope than the original phosphate oxygen, an isotope exchange takes place. After several dephosphorylation and rephosphorylation reactions, a complete isotope exchange of all terminal phospate oxygens can be obtained. The experiment took a while to optimise since several conditions needed to be met:
(i) The E2P intermediate had to be generated and its decay had to be inhibited (by the addition of DMSO) so that this intermediate accumulated in the sample. Its steady state concentration had to be maintained stable over several minutes. If the concentration of E2P had changed during the isotope exchange, the associated absorbance changes would have been much larger than those of the isotope exchange.
(ii) While E2P decay had to be prevented, its dephosphorylation reaction had to proceed at a significant rate so that isotope exchange could be observed. At the same time, the equilibrium of the dephosphorylation was required to lie on the reactant (E2P) side, otherwise the signals of E2P would have been too small.
In the end, the isotope exchange experiment [6,11] generated a difference spectrum that only showed the signals of two phosphate vibrations in this protein with nearly 50,000 vibrations. It identified the bands of the asymmetric P–O stretching vibrations at 1194 and 1137 cm−1. In the original publications, we assigned three main bands of the isotope exchange spectrum to the E2P phosphate group. However, this assignment was later corrected in the light of our quantum chemical calculations to two bands of E2P and two of Ca2E1P as discussed in the supplementary data of [10].
The knowledge of the phosphate wavenumbers prompted us to perform DFT calculations on models of the active site in order to obtain structural parameters for the aspartyl phosphate moiety. In these models, acetyl phosphate replaced the asparty phosphate and individual HF or H2O molecules modelled interactions with protein residues. The positions of the HF and H2O molecules were adjusted until the wavenumbers calculated for the asymmetric P–O stretching vibrations matched the experimentally determined ones. It turned out that the two vibrations were not sufficient to define the environment of the phosphate group. For example, either a strong interaction with one of the terminal phosphate oxygens, or strong interactions with two oxygens produced very similar wavenumbers for the two vibrations [10]. Therefore it was necessary to adopt the interaction pattern that was known from crystal structures obtained with the phosphate analogue BeF3− [54,66]. One of the models reproduced the experimental wavenumbers exactly and is shown in Fig. 9.
Fig. 9.
The acetyl phosphate model that reproduced the experimental wavenumbers in our DFT calculations [10]. Three of the distances between HF and acetyl phosphate were constrained (150, 180, 200 pm) when the energy was minimised.
![The acetyl phosphate model that reproduced the experimental wavenumbers in our DFT calculations [10]. Three of the distances between HF and acetyl phosphate were constrained (150, 180, 200 pm) when the energy was minimised.](https://content.iospress.com:443/media/bsi/2016/5-2/bsi-5-2-bsi134/bsi-5-bsi134-g009.jpg)
The comparison between this model and acetyl phosphate in a continuum dielectric (representing water) revealed the following:
(i) One of the terminal P–O bonds is 0.02 Å shorter and thus stronger in the enzyme environment than in an aqueous environment. This is due to weaker interactions with the enzyme.
(ii) The other terminal P–O bonds and the bridging P–O bond have the same length in both environments (1.52 and 1.77 Å respectively).
Thus, the enzyme distorts the structure of the phosphate group but it does not elongate and weaken the bond that is cleaved in the dephosphorylation reaction.
This pattern of bond lengths was confirmed in DFT calculations of larger (150 atoms) models of the catalytic site [10]. The agreement validates the approach of determining structural data from very simple models that reproduce experimentally determined wavenumbers. The advantage of small catalytic site models over more comprehensive ones is the possibility to use large basis sets. The basis set used in our study – 6-311++G (3df, 3pd) – was able to calculate the wavenumbers of two PO32− containing molecules in aqueous solution with high accuracy [57]. Therefore, we decided to use this basis set without scaling the vibrational wavenumbers. Nevertheless, it should be kept in mind that bond length determinations with this approach are only as good as the wavenumber accuracy of the DFT calculations.
Further insight into the catalytic mechanism was revealed by the comparison between the small acetyl phosphate model, which was based on experimentally determined wavenumbers, and large models of the catalytic site, which were based on several crystal structures. It turned out that the enzyme is in a non-reactive conformation when it adopts the E2P state in aqueous solution [10]. In the transition to the reactant state of the dephosphorylation reaction E2PR [58] (see Fig. 6), the general base Glu 183 moves to face the aspartyl phosphate and the attacking water molecule enters the active site. The Lys684 side chain is now closer to the bridging oxygen which elongates the bridging bond by 0.04 Å. This effect was also observed in simple models, when a HF molecule was placed close to the bridging oxygen of acetyl phosphate [60], which validates again the use of simple models for the analysis of catalytic sites.
The reactant state E2PR seems to be only weakly populated in the ensemble of structures that constitute the E2P state. If not, the absorption of the phosphate group of E2PR would be expected to contribute to the experimental isotope exchange spectrum. The 150-atom model calculations predict different phosphate spectra for the reactive E2PR and the non-reactive E2P conformation. However, the experimental spectrum does not show bands in the spectral range expected for E2PR and accordingly this state was not detected in the experiments. Therefore its energy seems to be at least 1 kcal/mol higher than that of the E2P ground state.
5.Conclusions
Vibrational spectroscopy provides detailed information about bond lengths and bond strengths. The information is obtained indirectly via the vibrational frequencies of the molecule of interest. They have to be identified in the vibrational spectrum usually with help of isotopic labelling. The correlation between frequencies and structure should be preferentially done via quantum chemical calculations of models of the active site rather than from plots that correlate these properties for different molecules or for a molecule in different environments. The data points in such plots scatter, which might lead to an incorrect interpretation (manuscript in preparation and [10]).
For the three catalytic reactions studied by us, we do not find evidence for ground state destabilisation, i.e. a weakening of the bond that is cleaved in the reaction. However, for the dephosphorylation reaction of the ATPase E2P phosphoenzyme, our DFT calculations indicate that the reactant state E2PR has a weakened scissile P–O bond. This state seems to be a high-energy intermediate that is not detected in experiments.
Acknowledgements
Main contributions to the work summarised here came from my coworkers Saroj Kumar (pyruvate kinase), Man Liu (ATP binding), and Maria Rudbeck (DFT calculations) and I thank them and all other contributors for their excellent work. The DFT calculations were done in collaboration with Margareta Blomberg (Stockholm University). The author’s research has been funded by Deutsche Forschungsgemeinschaft, Deutscher Akademischer Austauschdienst, Vetenskapsrådet, Knut och Alice Wallenberg Stiftelse, Wenner-Gren Foundations, Wenner-Grenska Samfundet, Carl Tryggers Stiftelse, Alzheimerfonden, and Magnus Bergvalls Stiftelse.
References
1 | [[1]] C. Allin and K. Gerwert, Biochemistry 40: ((2001) ), 3037–3046. |
2 | [[2]] V.E. Anderson, Arch. Biochem. Biophys. 433: ((2005) ), 27–33. |
3 | [[3]] J.E. Baenziger, K.W. Miller and K.J. Rothschild, Biophys. J. 61: ((1992) ), 983–992. |
4 | [[4]] A. Barth, J. Biol. Chem. 274: ((1999) ), 22170–22175. |
5 | [[5]] A. Barth, Prog. Biophys. Mol. Biol. 74: ((2000) ), 141–173. |
6 | [[6]] A. Barth, Biopolymers 67: ((2002) ), 237–241. |
7 | [[7]] A. Barth, Time-resolved IR spectroscopy with caged compounds: An introduction, in: Dynamic Studies in Biology – Phototriggers, Photoswitches and Caged Biomolecules, M. Goeldner and R.S. Givens, eds, Wiley-VCH, Weinheim, (2005) , pp. 369–399. |
8 | [[8]] A. Barth, Biochim. Biophys. Acta 1767: ((2007) ), 1073–1101. |
9 | [[9]] A. Barth, Spectroscopy. 22: ((2008) ), 63–82. |
10 | [[10]] A. Barth, Biochim. Biophys. Acta – Bioenerg. 1847: ((2015) ), 1036–1043. |
11 | [[11]] A. Barth and N. Bezlyepkina, J. Biol. Chem. 279: ((2004) ), 51888–51896. |
12 | [[12]] A. Barth, J.E.T. Corrie, M.J. Gradwell, Y. Maeda, W. Mäntele, T. Meier and D.R. Trentham, J. Am. Chem. Soc. 119: ((1997) ), 4149–4159. |
13 | [[13]] A. Barth, K. Hauser, W. Mäntele, J.E.T. Corrie and D.R. Trentham, J. Am. Chem. Soc. 117: ((1995) ), 10311–10316. |
14 | [[14]] A. Barth, W. Kreutz and W. Mäntele, FEBS Lett. 277: ((1990) ), 147–150. |
15 | [[15]] A. Barth, W. Kreutz and W. Mäntele, Biochim. Biophys. Acta – Biomembr. 1194: ((1994) ), 75–91. |
16 | [[16]] A. Barth, F. von Germar, W. Kreutz and W. Mäntele, J. Biol. Chem. 271: ((1996) ), 30637–30646. |
17 | [[17]] A. Barth and C. Zscherp, Quart. Rev. Biophys. 35: ((2002) ), 369–430. |
18 | [[18]] S.J. Benkovic and S. Hammes-Schiffer, Science 301: ((2003) ), 1196–1202. |
19 | [[19]] I.D. Brown, The Chemical Bond in Inorganic Chemistry. The Bond Valence Model, Oxford University Press, Oxford, (2002) . |
20 | [[20]] T.C. Bruice, Acc. Chem. Res. 35: ((2002) ), 139–148. |
21 | [[21]] T.C. Bruice, Chem. Rev. 106: ((2006) ), 3119–3139. |
22 | [[22]] V. Cepus, A.J. Scheidig, R.S. Goody and K. Gerwert, Biochemistry 37: ((1998) ), 10263–10271. |
23 | [[23]] V. Cepus, C. Ulbrich, C. Allin, A. Troullier and K. Gerwert, Methods Enzym. 291: ((1998) ), 223–245. |
24 | [[24]] H. Cheng, S. Sukal, R. Callender and T.S. Leyh, J. Biol. Chem. 276: ((2001) ), 9931–9935. |
25 | [[25]] N.B. Colthup, L.H. Daly and S.E. Wiberley, Introduction to Infrared and Raman Spectroscopy, Academic Press, New York, (1975) . |
26 | [[26]] H. Deng and R. Callender, Methods Enzym. 308: ((1999) ), 176–201. |
27 | [[27]] G. Di Sabato and W.P. Jencks, J. Am. Chem. Soc. 83: ((1961) ), 4400–4405. |
28 | [[28]] X. Du, H. Frei and S.-H.H. Kim, J. Biol. Chem. 275: ((2000) ), 8492–8500. |
29 | [[29]] N. Eremina and A. Barth, J. Phys. Chem. B 117: ((2013) ), 14967–14972. |
30 | [[30]] H. Fabian and W. Mäntele, Infrared spectroscopy of proteins, in: Handbook of Vibrational Spectroscopy, J.M. Chalmers and P. Griffiths, eds, John Wiley & Sons, Chichester, (2002) , pp. 3399–3426. |
31 | [[31]] K. Fahmy, Biophys. J. 75: ((1998) ), 1306–1318. |
32 | [[32]] M. Goeldner and R. Givens, Dynamic Studies in Biology, Wiley-VCH, Weinheim, (2005) . |
33 | [[33]] E. Goormaghtigh, V. Raussens and J. Ruysschaert, Biochim. Biophys. Acta – Rev. Biomembr. 1422: ((1999) ), 105–185. |
34 | [[34]] S. Gourion-Arsiquaud, S. Chevance, P. Bouyer, L. Garnier, J.-L. Montillet, A. Bondon and C. Berthomieu, Biochemistry 44: ((2005) ), 8652–8663. |
35 | [[35]] S.J. Harris and D.J. Winzor, Arch. Biochem. Biophys. 265: ((1988) ), 458–465. |
36 | [[36]] W. Hasselbach and M. Makinose, Biochem. Z. 333: ((1961) ), 518–528. |
37 | [[37]] J.H. Kaplan, B. Forbush and J.F. Hoffman, Biochemistry 17: ((1978) ), 1929–1935. |
38 | [[38]] E.-L. Karjalainen, A. Hardell and A. Barth, Biophys. J. 91: ((2006) ), 2282–2289. |
39 | [[39]] C. Kötting and K. Gerwert, Chemphyschem. 6: ((2005) ), 881–888. |
40 | [[40]] C. Kötting and K. Gerwert, Biol. Chem. 396: ((2015) ), 131–144. |
41 | [[41]] M. Krasteva, S. Kumar and A. Barth, Spectroscopy 20: ((2006) ), 89–94. |
42 | [[42]] S. Kumar and A. Barth, Biophys. J. 98: ((2010) ), 1931–1940. |
43 | [[43]] S. Kumar and A. Barth, J. Phys. Chem. B 115: ((2011) ), 6784–6789. |
44 | [[44]] S. Kumar and A. Barth, J. Phys. Chem. B 115: ((2011) ), 11501–11505. |
45 | [[45]] T.M. Larsen, M.M. Benning, G.E. Wesenberg, I. Rayment and G.H. Reed, Arch. Biochem. Biophys. 345: ((1997) ), 199–206. |
46 | [[46]] M. Liu and A. Barth, Biopolymers 67: ((2002) ), 267–270. |
47 | [[47]] M. Liu and A. Barth, J. Biol. Chem. 278: ((2003) ), 10112–10118. |
48 | [[48]] M. Liu and A. Barth, Biophys. J. 85: ((2003) ), 3262–3270. |
49 | [[49]] M. Liu, E.-L.E.-L. Karjalainen and A. Barth, Biophys. J. 88: ((2005) ), 3615–3624. |
50 | [[50]] R. Masuch and D.A. Moss, Stopped flow system for FTIR difference spectroscopy of biological macromolecules, in: Spectroscopy of Biological Molecules: New Directions, J. Greve, G.J. Puppels and C. Otto, eds, Kluwer Academic Publishers, Dordrecht, (1999) , pp. 689–690. |
51 | [[51]] J.A. McCray and D.R. Trentham, Annu. Rev. Biophys. Biophys. Chem. 18: ((1989) ), 239–270. |
52 | [[52]] J.V. Møller, C. Olesen, A.-M.L. Winther and P. Nissen, Quart. Rev. Biophys. 43: ((2010) ), 501–566. |
53 | [[53]] T. Nowak, J. Biol. Chem. 253: ((1978) ), 1998–2004. |
54 | [[54]] C. Olesen, M. Picard, A.-M.L. Winther, C. Gyrup, J.P. Morth, C. Oxvig, J.V. Møller and P. Nissen, Nature 450: ((2007) ), 1036–1042. |
55 | [[55]] B. Rauch, D. von Chak and W. Hasselbach, Z. Naturforsch. 32c: ((1977) ), 828–834. |
56 | [[56]] D.F. Rolfe and G.C. Brown, Physiol. Rev. 77: ((1997) ), 731–758. |
57 | [[57]] M. Rudbeck, Int. J. Quantum Chem. 112: ((2012) ), 2435–2439. |
58 | [[58]] M.E. Rudbeck, M.R.A. Blomberg and A. Barth, J. Phys. Chem. B 117: ((2013) ), 9224–9232. |
59 | [[59]] M.E. Rudbeck, S. Kumar, M.-A. Mroginski, S.O.N. Lill, M.R.A. Blomberg and A. Barth, J. Phys. Chem. A 113: ((2009) ), 2935–2942. |
60 | [[60]] M.E. Rudbeck, S.O. Nilsson Lill and A. Barth, J. Phys. Chem. B 116: ((2012) ), 2751–2757. |
61 | [[61]] J. Schartner, J. Güldenhaupt, B. Mei, M. Rögner, M. Muhler, K. Gerwert and C. Kötting, J. Am. Chem. Soc. 135: ((2013) ), 4079–4087. |
62 | [[62]] I. Schlichting, G. Rapp, J. John, A. Wittinghofer, E.F. Pai and R.S. Goody, Proc. Natl. Acad. Sci. U.S.A. 86: ((1989) ), 7687–7690. |
63 | [[63]] T.L.-M. Sørensen, J.V. Møller and P. Nissen, Science 304: ((2004) ), 1672–1675. |
64 | [[64]] C. Toyoshima, Arch. Biochem. Biophys. 476: ((2008) ), 3–11. |
65 | [[65]] C. Toyoshima and T. Mizutani, Nature 430: ((2004) ), 529–535. |
66 | [[66]] C. Toyoshima, Y. Norimatsu, S. Iwasawa, T. Tsuda and H. Ogawa, Proc. Natl. Acad. Sci. U.S.A. 104: ((2007) ), 19831–19836. |
67 | [[67]] M. Voue, E. Goormaghtigh, F. Homble, J. Marchand-Brynaert, J. Conti, S. Devouge and J. De Coninck, Langmuir 23: ((2007) ), 949–955. |
68 | [[68]] A. Warshel, Ann. Rev. Biophys. Biomol. Struct. 32: ((2003) ), 425–443. |
69 | [[69]] C.W. Wharton, Nat. Prod. Rep. 17: ((2000) ), 447–453. |
70 | [[70]] A.J. White, K. Drabble and C.W. Wharton, Biochem. J. 306: ((1995) ), 843–849. |
71 | [[71]] C. Zscherp and A. Barth, Biochemistry 40: ((2001) ), 1875–1883. |


