
Role of NMR metabonomics in Celiac Disease (CeD)
Abstract
Metabonomics study provides a comprehensive metabolic profile of biological samples using techniques like mass spectroscopy and nuclear magnetic resonance (NMR) spectroscopy. The metabolites identified are later analysed using multivariate statistical methods. Metabonomics has the potential to provide putative biomarker/s for disease diagnosis and for monitoring the disease progression and can be used in patient management. Recently, a few metabonomics studies have been reported on blood sera, urine and intestinal mucosal biopsies of celiac disease (CeD) patients using proton NMR. Significantly decreased levels of amino acids, methylamine, lactate, lipids, pyruvate, creatinine, choline and glycoprotein and increased levels of glucose and β-hydroxybutyrate have been reported in blood sera of CeD patients. In intestinal mucosal biopsies of CeD patients, a higher concentration of isoleucine, leucine, aspartate, succinate and pyruvate and lower concentration of glycerophosphocholine was seen as compared to controls. These studies indicates that the metabonomics study of CeD using in-vitro NMR spectroscopy helps in the determination of metabolic signature/s of the disease. It also provides an insight into the biochemistry of the disease and also helps in the identification of metabolites that could serve as putative biomarker/s for the diagnosis of CeD. This review focuses on the application of NMR based metabonomics in CeD and highlights the potential of NMR based metabonomics in the identification of biomarker/s for diagnosis and prognosis.
1.Introduction
Metabonomics is a systematic investigation of the multiple metabolic changes in response to environment, pathophysiological stimuli and genetic modulation [29]. It provides comprehensive metabolic profiling of low molecular weight metabolites present within a living system using spectroscopic techniques combined with multivariate analysis. The primarily used techniques for metabonomic studies are: (i) mass spectroscopy (MS) combined with gas chromatography (GC) or liquid chromatography (LC); and (ii) NMR spectroscopy. In modern metabonomics studies, these techniques are often integrated with multivariate data analyses to identify the biochemical changes associated with specific physiological and pathological conditions. NMR based metabonomics approach has been applied extensively in medicine for delineating metabolic signature/s of several diseases such as colonic tumors [28], fatty liver disease [19], inflammatory bowel disease [1], cardiac disease [7], liver cirrhosis and fibrosis [11] and breast cancer [31].
Celiac Disease (CeD) is a systemic autoimmune disease of small intestine that occurs as a consequence of intake of cereals like wheat, barley and rye in individuals who are genetically susceptible with human leukocyte antigen (HLA-DQ2 or HLA-DQ8) haplotypes [20]. Gluten protein and related prolamines present in these cereals have been identified as prominent factors that cause CeD. It affects around 0.7–3.0% of the population worldwide and its prevalence is increasing over the years as seen in United States and Europe [10,34,40]. CeD is characterised by both the presence of gluten-dependent gastrointestinal and extra gastrointestinal clinical manifestations of variable degree. These include diarrhoea, abdominal distension, failure to thrive and fatigue in infants and children, anemia, metabolic bone disease, liver diseases and ataxia and these complicate its diagnosis [35]. Currently screening of CeD is based on the detection of serological markers such as endomysial (EMA) and tissue transglutaminase (tTG) IgA antibodies, however, confirmation of diagnosis of CeD is achieved only after comprehensive evaluation of clinical, serological, genetic and histological specimens.
Recently, NMR based metabonomics approach using samples like urine, blood plasma/sera and mucosa samples showed putative biomarkers for the diagnosis of CeD [4,16,38]. These studies demonstrated that in-vitro high-resolution NMR spectroscopy may emerge as a promising tool for the evaluation of CeD through the analysis of intestinal mucosal biopsies, body fluids and faecal extracts.
This review presents some salient features of pathophysiology of CeD and the experimental aspects of metabonomics studies using proton (
2.Pathophysiology of celiac disease
As previously described, CeD is triggered by dietary ingestion of gluten and related prolamines, which are the main storage protein in several cereals such as wheat, barley and rye in genetically susceptible individuals. Gluten is a complex mixture of gliadins and glutenins, which contain CeD activating peptides [13]. Of these, gliadin peptides play a key role in the development of CeD. The amino acids, proline and glutamine are predominant in gliadin peptides and make these proteins highly resistant to proteolytic degradation. The incomplete proteolytic degradation leads to the accumulation of large peptides in small intestine. These large peptide fragments evoke both innate as well as adaptive immune responses in genetically susceptible individuals [42]. Further, tissue transglutaminase (tTG) enzyme plays a key role in the pathogenesis of CeD by causing deamidation of glutamine and converting it to glutamate in gliadin peptides [27]. These deamidated gliadin peptides have increased affinity for HLA-DQ2 or HLA-DQ8 molecule which is relevant in the pathogenesis of CeD [41]. The complex formed from gliadin peptides and HLA-DQ2 or HLA-DQ8 activates the T-cells present in the lamina propria which mediate adaptive immune response through the production of cytokines and consequently leading to inflammation of the intestine [39,41]. T cells produce interferon (IFN)-γ which is considered to have an important role in mucosal damage [30]. Further, the gliadin peptides which are not recognized by T-cells activate the innate immunity. The innate immune response is characterized by increased production of interleukin (IL)-15, a major pro-inflammatory cytokine that promotes inflammatory reactions and causes mucosal damage [24,25].
3.Experimental considerations of in-vitro NMR metabonomics
3.1.Samples
Versatility of in-vitro high-resolution NMR spectroscopy based metabonomic studies is that experiments can be performed on a variety of biological samples including biopsied tissue samples and a number of biofluids like blood, urine, cerebrospinal fluid, seminal plasma etc. Biofluids are widely studied using NMR spectroscopy due to their easy accessibility. Detailed experiment aspects of
3.2.Preparation of body fluids: Blood plasma and urine
Blood. Blood samples were generally collected during morning pre-prandial in a pre-chilled vacutainer after overnight fasting. For collection of blood plasma, heparin vacutainer need to be used while SST (serum separating tubes) vacutainer tubes were used for serum collection. This is followed by centrifugation to separate plasma or serum and were stored frozen (−20°C or lower) until NMR analyses. For
Urine. Morning pre-prandial urine was usually collected in sterile collection cups and immediately frozen in liquid N2 and stored frozen (at −20°C or lower). For
3.3.Preparation of mucosal biopsies sample
Generally, intestinal mucosal biopsies were taken from folds in the third part of duodenum of patients undergoing esophagogastroduodenoscopy. For in-vitro
3.3.1.Perchloric acid extraction
The frozen tissue was homogenized in 6% perchloric acid [32]. The homogenate was centrifuged, the supernatant was collected and pH of the supernatant was adjusted to pH 7.0 by using potassium hydroxide and the precipitated perchlorate salts was removed by centrifugation. The resultant supernatant was then lyophilized and the tissue powder was stored at low temperature until NMR spectroscopy was performed.
3.3.2.Chloroform methanol extraction
This is a dual-phase extraction procedure which allows the simultaneous assessment of both water soluble and lipid soluble metabolites [2]. Frozen tissue was weighed and homogenised with methanol and water. Chloroform and water were added to the homogenate followed by vortexing. The sample was centrifuged that resulted in separation of the two phases. Lipids were present in lower chloroform phase while upper methanol aqueous phase contains water soluble small molecular weight metabolites. Nitrogen gas stream was used to flush out the solvent and then the sample was stored at low temperature. For
3.4.Preparation of faecal samples
A detailed procedure for faecal sample preparation for NMR spectroscopy analyses is given in [14]. Briefly, faecal samples collected in sterile plastic container are immediately mixed (1:1 wt/wt) with the Amies Transport medium (Oxoid LTD, Basingstoke, Hampshire, UK) under anaerobic conditions and stored frozen for NMR analyses [14]. For
4.Data analysis
4.1.Quantification of metabolites
In NMR, each metabolite gives rise to distinct resonance peak from which the concentration of metabolites can be determined. Thus, the metabolites present in specimens from intestinal mucosa, blood plasma and urine can be quantified. The intensity of the NMR signal is directly proportional to the concentration of metabolite and the number of protons corresponding to that peak. Thus, the concentration of metabolite is calculated by comparing the integral area of metabolite with the integral area of reference compound using the formula [37].
For tissue sample
For blood and urine
4.2.Statistical analysis: Univariate and multivariate methods
NMR spectrum contains enormous amount of data from samples. Biological information from such a large datasets is retrieved by means of univariate and multivariate statistical methods [9,23,36].
4.2.1.Univariate analyses
Univariate is the simplest method of analysing the NMR data by comparing a single variable at a time. Commonly used methods are t-test and analyses of variance (ANOVA) [26] together with their corresponding nonparametric versions [18] and with appropriate correction methods for multiple testing [8].
4.2.2.Multivariate analyses
Multivariate methods used for the analyses of dataset that contain large number of variables. These variables may be correlated to each other and their statistical dependence is taken into account during the analyses. Multivariate analyses utilises the application of various data reduction, pattern recognition, and clustering algorithms. These are grouped into two major classes: unsupervised and supervised algorithms.
Unsupervised statistical analyses methods include principal component analyses (PCA) [21] and hierarchical clustering [22]. PCA is a mathematical method that transforms the high dimension dataset into the low-dimension by reducing the number of variables. The small dimension of original dataset can be used to explore the correlations between the datasets, where as cluster analysis is used for classifying data into several subsets (clusters) so that the data in the same cluster contain observations with same features. These clusters are created on the basis of distance and probability.
Multiple regressions or partial least squares regression and discriminant analyses (PLS-DA) [43], random forest [6] and support vector machines [12] are supervised methods used for analysing the metabonomics data. Multiple regression method allows the prediction of one variable on the basis of other variables where as PLS-DA combines the features of both PCA and multiple regressions. PLS-DA predicts a set of dependent variable extracted from a set of factors which have the best predictive power. Support vector machines and random forest are machine learning techniques that are also used in metabonomics. For more details, readers may refer to review on the multivariate analyses methods [5].
5.NMR metabonomics in celiac disease
NMR based metabonomics coupled with multivariate statistical analyses provides an opportunity to identify changes in biological specimens such as serum, plasma and urine which may be linked to pre-morphological and biochemical changes associated with the disease and thus could provide early indication of disease pathology. NMR profiling of biological samples thus enables the determination of metabolic signatures of the disease which may help in understanding the biochemistry of the disease and may eventually lead to identification of biomarker/s which will be of great value in clinical medicine [29]. Figure 1 shows the
Fig. 1.
Expanded aliphatic region (0.5–4.2 ppm) of 1D
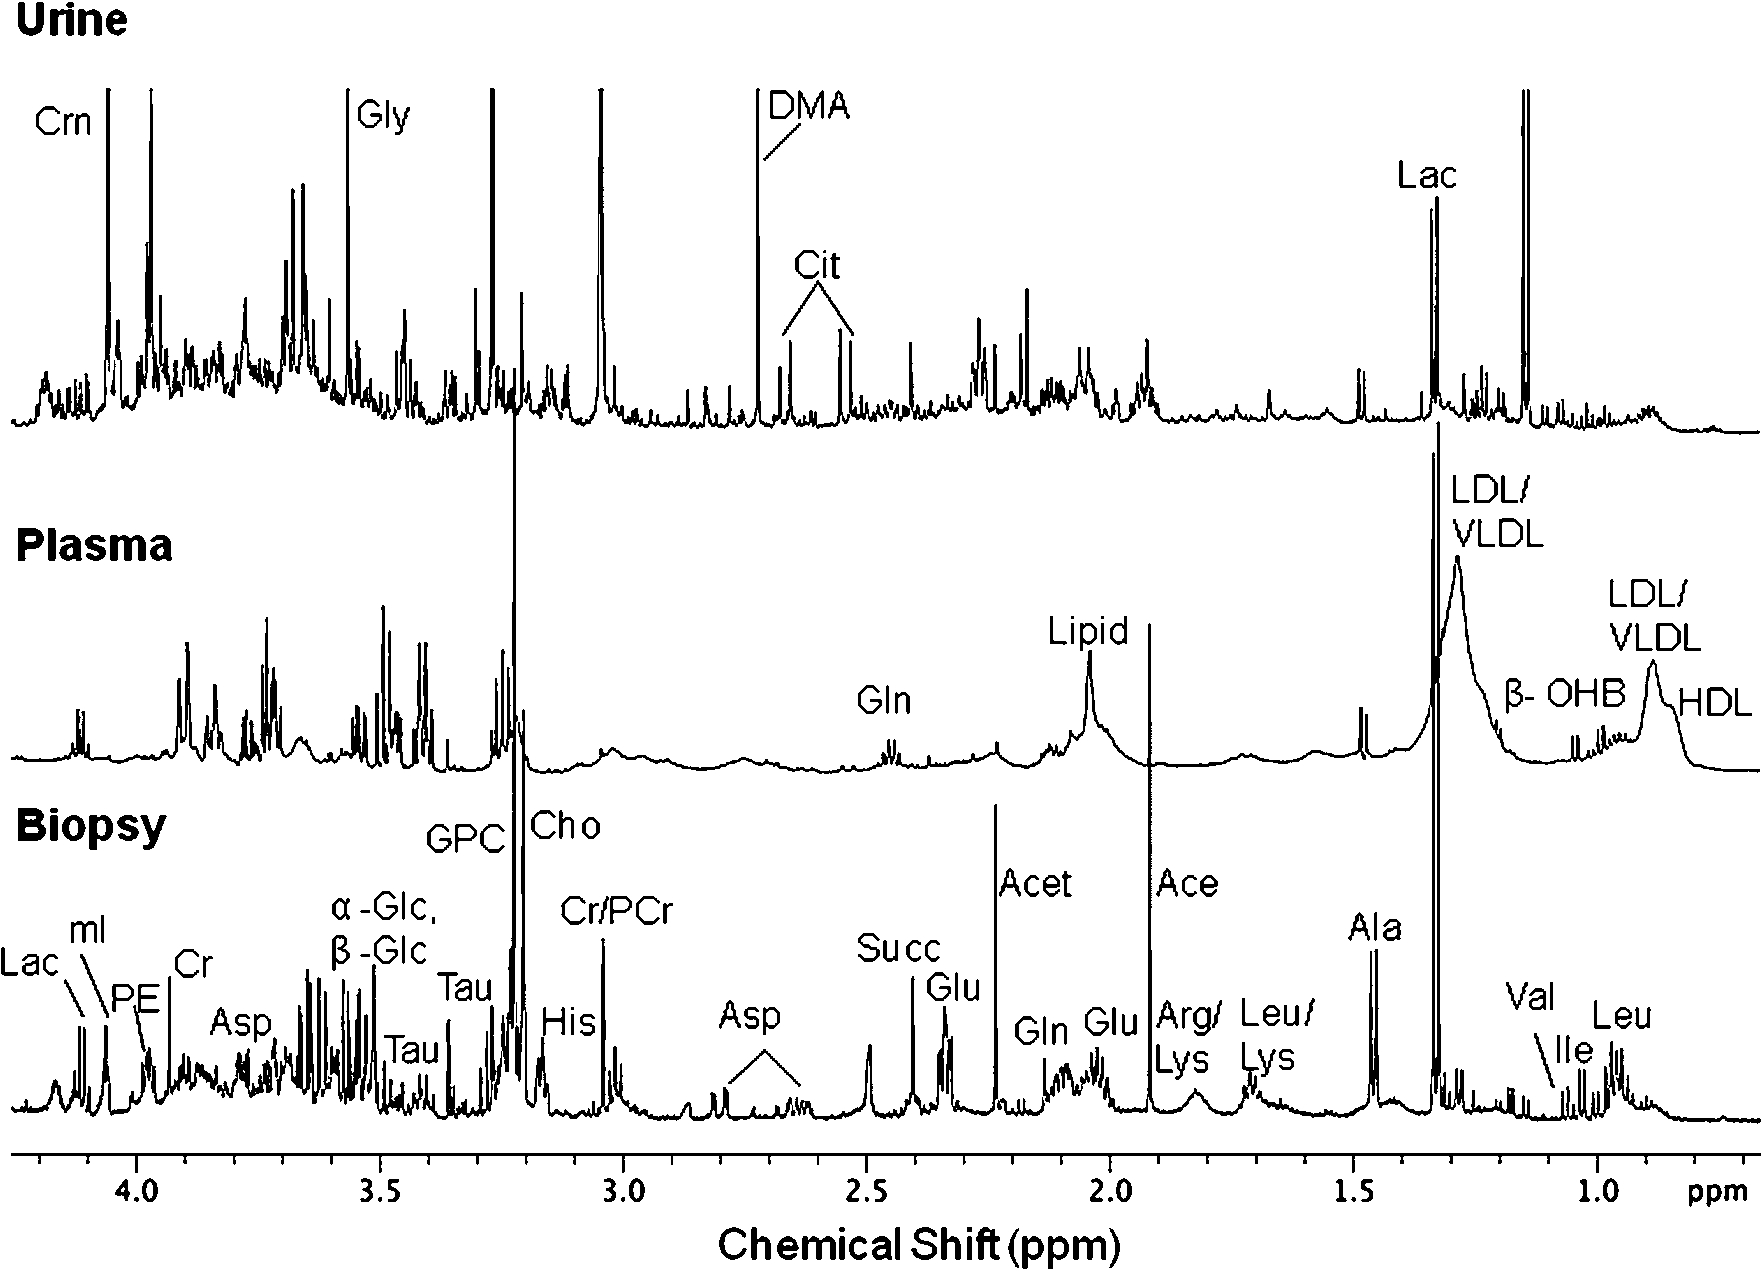
Fig. 2.
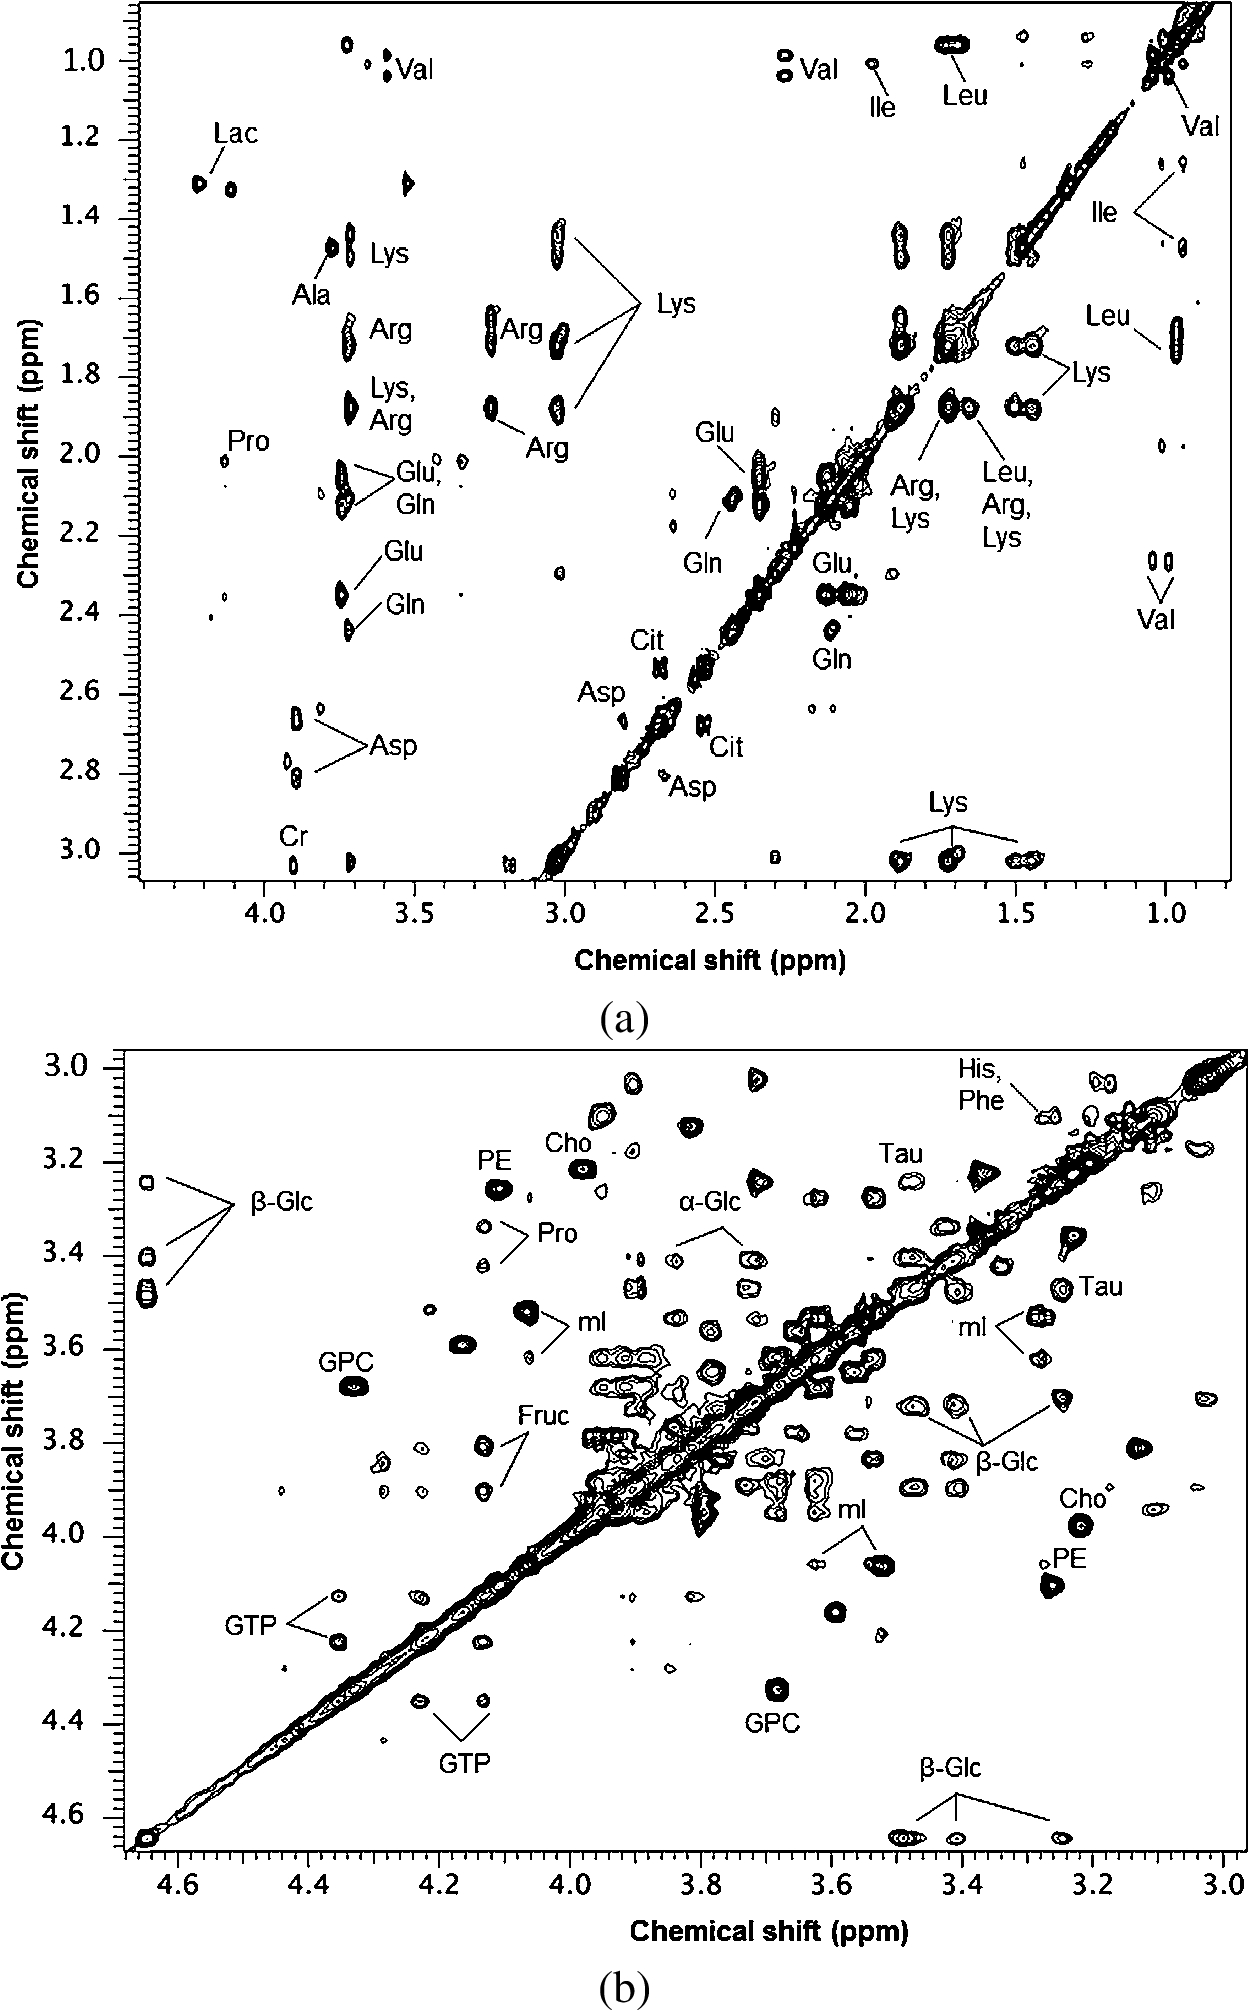
Table 1
Metabolites [chemical shift position (δ) ppm] observed in the
| S. No. | Metabolites | Chemical shift assignment (δ, ppm) | Biological sample |
| Sugars | |||
| 1. | α-glucose | 3.42 (H4′), 3.53 (H2′), 3.72 (H3′), 3.84 (H5′), 5.22 (H1′) | Mucosal biopsy, blood, urine |
| 2. | β-glucose | 3.24 (H2′), 3.41 (H4′), 3.47 (H5′), 3.73 (H6′), 3.90 (H6′), 4.64 (H1′) | Mucosal biopsy, blood, urine |
| 3. | Myo-inositol | 3.28 (H5′), 3.53 (H1′, H3′), 3.63 (H4′, H6′), 4.07 (H2′) | Mucosal biopsy, urine |
| 4. | Fructose | 3.80 (H3′), 3.91 (H4′), 4.13 (H5′) | Mucosal biopsy, blood, urine |
| Amino acids | |||
| 1. | Isoleucine | 0.94 (δ-CH3), 1.26 (γ-CH2), 1.48 (γ-CH2), 1.97 (β-CH), 3.62 (α-CH) | Mucosal biopsy, blood, urine |
| 2. | Leucine | 0.96 (δ-CH3), 1.69 (γ-CH2), 1.72 (β-CH2) | Mucosal biopsy, blood, urine |
| 3. | Valine | 1.00 (γ-CH2), 1.04 (γ-CH3), 2.21 (β-CH), 3.52 (α-CH) | Mucosal biopsy, blood, urine |
| 4. | Alanine | 1.46 (β-CH3), 3.76 (α-CH) | Mucosal biopsy, blood, urine |
| 5. | Glutamate | 2.04 (β-CH2), 2.36 (γ-CH2), 3.65 (α-CH) | Mucosal biopsy, blood, urine |
| 6. | Glutamine | 2.08 (β-CH2), 2.45 (γ-CH2), 3.65 (α-CH) | Mucosal biopsy, blood, urine |
| 7. | Glycine | 3.55 (CH2) | Mucosal biopsy, blood, urine |
| 8. | Lysine | 1.47 (γ-CH2), 1.82 (β-CH2), 1.72 (δ-CH2), 3.02 (ε-CH2), 3.61 (α-CH) | Mucosal biopsy, blood, urine |
| 9. | Arginine | 1.68 (γ-CH2), 1.82 (β-CH2), 3.25 (δ-CH2), 3.62 (α-CH) | Mucosal biopsy, blood, urine |
| 10. | Aspartate | 2.67 (β-CH2), 2.80 (β-CH2), 3.89 (α-CH) | Mucosal biopsy, urine |
| 11. | Proline | 2.07 (β-CH), 2.34 ( | Mucosal biopsy, blood, urine |
| 12. | Histidine | 3.14 (β-CH2), 7.06 (H4), 7.83 (H2) | Mucosal biopsy, blood, urine |
| 13. | Tyrosine | 3.06 (β-CH), 3.20 ( | Mucosal biopsy, blood, urine |
| 14. | Phenylalanine | 3.09 (β-CH), 3.25 ( | Mucosal biopsy, blood, urine |
| 15. | Tryptophan | 3.26 (β-CH), 3.43 ( | Mucosal biopsy, urine |
| Lipids | |||
| 1. | Low-density lipoprotein (LDL) | 0.90 (CH3), 1.30 (CH2)n | Blood |
| 2. | Very-low-density lipoprotein (VLDL) | 0.90 (CH3), 1.30 (CH2)n | Blood |
| 3. | High-density lipoprotein (HDL) | 0.84 (CH3) | Blood |
| Organic acids | |||
| 1. | β-hydroxy butyrate (β-OHB) | 1.21 (γ-CH3), 4.16 (β-CH) | Mucosal biopsy, blood, urine |
| 2. | Succinate | 2.41 (CH2–CH2) | Mucosal biopsy, blood, urine |
| 3. | Citrate | 2.52 (CH2), 2.64 (CH2) | Mucosal biopsy, blood, urine |
| 4. | Pyruvate | 2.37 (CH3) | Mucosal biopsy, blood, urine |
| 5. | Acetate | 1.92 (CH3) | Mucosal biopsy, blood, urine |
| 6. | Fumarate | 6.52 (CH=CH) | Mucosal biopsy, blood, urine |
| 7. | Formate | 8.46 (CH) | Mucosal biopsy, blood, urine |
| Membrane components | |||
| 1. | Phosphoethanolamine | 3.26 (NCH2), 4.10 (α-CH2OH) | Mucosal biopsy |
| 2. | Choline | 3.21 (NCH3), 3.66 (NCH2), 4.00 (CH2OH) | Mucosal biopsy, blood, urine |
| 3. | Glycerophosphocholine | 3.23 (NCH3), 3.64 (H1′), 3.68 (H5′), 3.73 (H2′), 3.91 (H3′), 4.27 (H4′) | Mucosal biopsy, blood, urine |
| Nucleotides | |||
| 1. | Adenosine | 6.04 (H1′), 8.20 (base) | Mucosal biopsy, blood, urine |
| 2. | Adenosine-tri-phosphate (ATP) | 6.14 (H1′), 8.27 (base), 8.54 (base) | Mucosal biopsy, blood, urine |
| 3. | Guanine-tri-phosphate (GTP) | 4.13 ( | Mucosal biopsy, blood, urine |
| 4. | Nicotinamide | 8.1 (H5′), 8.5 (cyclic H) | Mucosal biopsy, blood, urine |
| 5. | N-methyl nicotinamide | 8.90 (H4′), 8.96 (H6′), 9.27 (H2′) | Urine |
| Other compounds | |||
| 1. | Acetoacetate | 2.23 (CH3) | Mucosal biopsy, blood, urine |
| 2. | Dimethylamine | 2.73 (CH3) | Mucosal biopsy, blood, urine |
| 3. | Creatine/phosphocreatine | 3.04 (NCH3), 3.93 (CH2) | Mucosal biopsy, blood, urine |
| 4. | Taurine | 3.25 (CH2SO3), 3.43 (CH2NH) | Mucosal biopsy, urine |
| 5. | Creatinine | 4.06 (CH2) | Blood, urine |
| 6. | Hippurate | 7.53 (H3′/H5′), 7.61 (H4′), 7.81 (H2′/H6′) | Urine |
| 7. | Indoxyl sulpahte | 7.17 (H5′), 7.25 (H6′) | Urine |
Table 2
Summary of NMR metabonomics studies on Celiac Disease
| References | Biological sample | Sample size | Findings | Conclusions |
| Bertini et al. [4] | Blood serum, urine | CeD patients ( | Serum: (a) Lower level of amino acids, methylamine, lactate, lipids, pyruvate, creatinine, choline and glycoprotein in serum of CeD compared to controls. (b) Higher level of glucose and β-hydroxybutyric acid in blood of CeD patients as compared to healthy control. | Malabsorption and alteration in energy metabolism are associated with CeD |
| Urine: (a) Lower level of mannitol, glutamate, glutamine and pyridines and higher level of acetoacetate, indoxyl sulphate (IS), meta hydrophenylpropionic acid and phenyacetylglycine in the urine sample of CeD patients as compared to controls. (b) Levels of glucose and β-hydroxybutyric acid reverts to normal value after 12 month of GFD | CeD is associated with intestinal dysbiosis | |||
| Fathi et al. [16] | Blood serum | CeD patients ( | Lactate, lipid and valine were lower in CeD patients as compared to controls | CeD patients utilized lipid as energy source |
| Sharma et al. [38] | Intestinal mucosal biopsy | CeD patients ( | CeD patients showed higher concentration of isoleucine, leucine, aspartate, succinate and pyruvate and lower concentration of glycerophosphocholine in comparison with controls | Abnormalities in amino acid metabolism and citric acid cycle leading to energy deficiency in CeD |
| Bernini et al. [3] | Blood serum, urine | CeD patients ( | Serum: Metabolic profile of blood serum of potential celiac subjects is similar to CeD patients, characterised by lower level of amino acids and increased level of glucose and β-hydroxybutyric acid. | Metabolic abnormalities precede the villous atrophy |
| Urine: Potential celiac subjects have lower level of hippurate, indoxyl sulphate, meta hydrophenylpropionic acid and phenyacetylglycine compared to CeD patients | ||||
| Rezaei-Tavirani et al. [33] | Blood serum | CeD patients ( | Lipid and lactate are decreased while choline is increased in CeD patients as compared to controls | Lipid, lactate and choline can be used as biomarker to differentiate between CeD patients, patients on GFD and healthy controls |
| Fathi et al. [17] | Blood serum | CeD patients ( | Isoleucine and lactate are lower in CeD compared to Crohn’s disease | Revealed differentiating metabolites for Crohn’s disease and CeD |
| Di Cango et al. [14] | Urine, faeces | Treated CeD children ( | Urine: Urine samples of treated CeD children are characterised by higher levels of lysine, arginine, creatine and methylamine and lower level of glucose, glutamine and carnosine compared to healthy children. | Changes are associated with intestinal microflora modifications |
| Faecal sample: Tyrosine, proline, asparagine, histidine and methionine are higher in faecal sample of treated CeD children compared to healthy children | Villous atrophy associated with decreased absorptive surface results in malabsorption of amino acids which are consequently lost with stool |
Notes: CeD – Celiac disease, HC – Healthy controls, GFD – Gluten free diet.
5.1.Blood
Only a limited number of metabolomic studies of body fluids have been reported on CeD (see Table 2). Bertini et al. reported the metabolome of serum samples of treatment naïve CeD patients, patients on gluten free diet (GFD), and healthy controls using
A subsequent study by the same group reported the metabolic profile of blood and urine samples of potential CeD patients using
Further, Rezaei-Tavirani et al. analyzed the serum samples of CeD patients, patients on GFD and healthy control using
In another study by the same research group compared the metabolic profile of blood serum of patients with CeD and Crohn’s disease using
5.2.Urine
Urine is another important biofluid that gives important information on altered biochemistry related to disease processes. Elevated levels of meta-hydroxyphenyl-propionic acid, indoxyl sulphate, and phenylacetyglycine were seen in the urine samples of patients with CeD in comparison to healthy controls [4]. These metabolites are known to be related to gut microbiota, suggesting that there is an alteration in gut microflora of small bowel of CeD patients [4]. Further the same group documented dissimilarity in biochemical profile of urine samples between CeD patients and the potential CeD patients. The authors concluded that the alterations in the metabolic profile may occur prior to intestinal damage.
5.3.Intestinal mucosa
Till date there is only one in-vitro
5.4.Metabonomics after gluten free diet
Few studies have reported the metabonomics of CeD patients after gluten free diet using serum, urine and faeces samples [4,14]. Bertini et al. reported that the metabolic profile including levels of glucose and beta hydroxy butyrate of CeD patients revert to normal value after 12 months of strict GFD [4].
Di Cango et al. [14] reported differences between the metabolic profiles of faeces and urine of treated CeD and healthy children using a combination of
6.Conclusion
This review presented an overview on the major findings in
Acknowledgements
The authors thank the Department of Biotechnology, Government of India for financial support (BT/Bio-CARe/01/233/2010-11). NRJ thanks the Department of Science and Technology, Government of India for J.C. Bose Fellowship.
References
1 | [[1]] K. Balasubramanian, S. Kumar, R.R. Singh, U. Sharma, V. Ahuja, G.K. Makharia and N.R. Jagannathan, Metabolism of the colonic mucosa in patients with inflammatory bowel diseases: An in vitro proton magnetic resonance spectroscopy study, Magn. Reson. Imaging 27: ((2009) ), 79–86. |
2 | [[2]] O. Beckonert, H.C. Keun, T.M. Ebbels, J. Bundy, E. Holmes, J.C. Lindon and J.K. Nicholson, Metabolic profiling, metabolomic and metabonomic procedures for NMR spectroscopy of urine, plasma, serum and tissue extracts, Nat. Protoc. 2: ((2007) ), 2692–2703. |
3 | [[3]] P. Bernini, I. Bertini, A. Calabrò, G. la Marca, G. Lami, C. Luchinat, D. Renzi and L. Tenori, Are patients with potential celiac disease really potential? The answer of metabonomics, J. Proteome. Res. 10: ((2011) ), 714–721. |
4 | [[4]] I. Bertini, A. Calabrò, V. De Carli, C. Luchinat, S. Nepi, B. Porfirio, D. Renzi, E. Saccenti and L. Tenori, The metabonomic signature of celiac disease, J. Proteome. Res. 8: ((2009) ), 170–177. |
5 | [[5]] G. Blekherman, R. Laubenbacher, D.F. Cortes, P. Mendes, F.M. Torti, S. Akman, S.V. Torti and V. Shulaev, Bioinformatics tools for cancer metabolomics, Metabolomics 7: ((2011) ), 329–343. |
6 | [[6]] L. Breiman, Random forests, Mach. Learn. 45: ((2001) ), 5–32. |
7 | [[7]] J.T. Brindle, H. Antti, E. Holmes, G. Tranter, J.K. Nicholson, H.W. Bethell, S. Clarke, P.M. Schofield, E. McKilligin, D.E. Mosedale and D.J. Grainger, Rapid and non-invasive diagnosis of the presence and severity of coronary heart disease using |
8 | [[8]] D.I. Broadhurst and D.B. Kell, Statistical strategies for avoiding false discoveries in metabolomics and related experiments, Metabolomics 2: ((2006) ), 171–196. |
9 | [[9]] M. Brown, W.B. Dunn, D.I. Ellis, R. Goodacre, J. Handl, J.D. Knowles, S. O’Hagan, I. Spasić and D.B. Kell, A metabolome pipeline: From concept to data to knowledge, Metabolomics 1: ((2005) ), 39–51. |
10 | [[10]] C. Catassi, The world map of celiac disease, Acta Gastroenterol. Latinoam. 35: ((2005) ), 37–55. |
11 | [[11]] M.A. Constantinou, S.E. Theocharis and E. Mikros, Application of metabonomics on an experimental model of fibrosis and cirrhosis induced by thioacetamide in rats, Toxicol. Appl. Pharmacol. 218: ((2007) ), 11–19. |
12 | [[12]] C. Cortes and V. Vapnik, Support-vector networks, Mach. Learn. 20: ((1995) ), 273–297. |
13 | [[13]] D.H. Dewar, M. Amato, H.J. Ellis, E.L. Pollock, N. Gonzalez-Cinca, H. Wieser and P.J. Ciclitira, The toxicity of high molecular weight glutenin subunits of wheat to patients with coeliac disease, Eur. J. Gastroenterol. Hepatol. 18: ((2006) ), 483–491. |
14 | [[14]] R. Di Cagno, M. De Angelis, I. De Pasquale, M. Ndagijimana, P. Vernocchi, P. Ricciuti, F. Gagliardi, L. Laghi, C. Crecchio, M.E. Guerzoni, M. Gobbetti and R. Francavilla, Duodenal and faecal microbiota of celiac children: Molecular, phenotype and metabolome characterization, BMC Microbiol. 11: ((2011) ), 219. |
15 | [[15]] A. Emwas, C. Luchinat, P. Turano, L. Tenori, R. Roy, R.M. Salek, D. Ryan, J.S. Merzaban, R. Kaddurah-Daouk, A.C. Zeri, G.A.N. Gowda, D. Raftery, Y. Wang, L. Brennan and D.S. Wishart, Standardizing the experimental conditions for using urine in NMR-based metabolomic studies with a particular focus on diagnostic studies: A review, Metabolomics 11: ((2015) ), 872–894. |
16 | [[16]] F. Fathi, F. Ektefa, A. Arefi Oskouie, K. Rostami, M. Rezaei-Tavirani, A.H. Mohammad-Alizadeh, M. Tafazzoli and M. Rostami Nejad, NMR based metabonomics study on celiac disease in the blood serum, Gastroenterol. Hepato. Bed. Bench 6: ((2013) ), 190–194. |
17 | [[17]] F. Fathi, L.M. Kasmaee, K. Sohrabzadeh, M. Rostami Nejad, M. Tafazzoli and A. Arefi Oskouie, The differential diagnosis of Crohn’s Disease and Celiac Disease using nuclear magnetic resonance spectroscopy, Appl. Magn. Reson. 45: ((2014) ), 451–459. |
18 | [[18]] J. Fletcher, Non-parametric tests, Br. Med. J. 338: ((2009) ), b781. |
19 | [[19]] J.L. Griffin, J. Scott and J.K. Nicholson, The influence of pharmacogenetics on fatty liver disease in the wistar and Kyoto rats: A combined transcriptomic and metabonomic study, J. Proteome Res. 6: ((2007) ), 54–61. |
20 | [[20]] S. Husby, S. Koletzko, I.R. Korponay-Szabó, M.L. Mearin, A. Phillips, R. Shamir, R. Troncone, K. Giersiepen, D. Branski, C. Catassi, M. Lelgeman, M. Mäki, C. Ribes-Koninckx, A. Ventura, K.P. Zimmer, ESPGHAN Working Group on Coeliac Disease Diagnosis and ESPGHAN Gastroenterology Committee European Society for Pediatric Gastroenterology, Hepatology, and Nutrition guidelines for the diagnosis of coeliac disease, J. Pediatr. Gastroenterol. Nutr. 54: ((2012) ), 136–160. |
21 | [[21]] I.T. Jolliffe, Principal component analysis: A beginner’s guide – I. Introduction and application, Weather 45: ((2012) ), 375–382. |
22 | [[22]] L. Kaufman and P.J. Rousseeuw, Finding Groups in Data: An Introduction to Cluster Analysis, Vol. 34: , Wiley, (2009) . |
23 | [[23]] K.H. Liland, Multivariate methods in metabolomics – From pre-processing to dimension reduction and statistical analysis, Trends Anal. Chem. 30: ((2011) ), 827–841. |
24 | [[24]] L. Maiuri, C. Ciacci, S. Auricchio, V. Brown, S. Quaratino and M. Londei, Interleukin15 mediates epithelial changes in celiac disease, Gastroenterology 119: ((2000) ), 996–1006. |
25 | [[25]] J.J. Mention, M. Ben Ahmed, B. Bègue, U. Barbe, V. Verkarre, V. Asnafi, J.F. Colombel, P.H. Cugnenc, F.M. Ruemmele, E. McIntyre, N. Brousse, C. Cellier and N. Cerf-Bensussan, Interleukin 15: A key to disrupted intraepithelial lymphocyte homeostasis and lymphomagenesis in celiac disease, Gastroenterology 125: ((2003) ), 730–745. |
26 | [[26]] R.G. Miller and B.W. Brown, Beyond ANOVA: Basics of Applied Statistics, Chapman & Hall/CRC, (1997) . |
27 | [[27]] O. Molberg, S. McAdam, K.E. Lundin, C. Kristiansen, H. Arentz-Hansen, K. Kett and L.M. Sollid, T cells from celiac disease lesions recognize gliadin epitopes deamidated in situ by endogenous tissue transglutaminase, Eur. J. Immunol. 31: ((2001) ), 1317–1323. |
28 | [[28]] A. Moreno and C. Arus, Quantitative and qualitative characterization of |
29 | [[29]] J.K. Nicholson, J.C. Lindon and E. Holmes, ‘Metabonomics’: Understanding the metabolic responses of living systems to pathophysiological stimuli via multivariate statistical analysis of biological NMR spectroscopic data, Xenobiotica 29: ((1999) ), 1181–1189. |
30 | [[30]] E.M. Nilsen, F.L. Jahnsen, K.E. Lundin, F.E. Johansen, O. Fausa, L.M. Sollid, J. Jahnsen, H. Scott and P. Brandtzaeg, Gluten induces an intestinal cytokine response strongly dominated by interferon gamma in patients with celiac disease, Gastroenterology 115: ((1998) ), 551–563. |
31 | [[31]] C. Oakman, L. Tenori, W.M. Claudino, S. Cappadona, S. Nepi, A. Battaglia, P. Bernini, E. Zafarana, E. Saccenti, M. Fornier, P.G. Morris, L. Biganzoli, C. Luchinat, I. Bertini and A. Di Leo, Identification of a serum-detectable metabolomic fingerprint potentially correlated with the presence of micrometastatic disease in earlybreast cancer patients at varying risks of disease relapse by traditional prognostic methods, Ann. Oncol. 22: ((2011) ), 1295–1301. |
32 | [[32]] J.F. Payen, N. Fouilhe, E. Sam-Lai, C. Remy, R. Dupeyre, P. Mezin, J. Halsall and P. Stieglitz, In vitro |
33 | [[33]] M. Rezaei-Tavirani, F. Fathi, F. Darvizeh, M.R. Zali, M. Rostami Nejad, K. Rostami, M. Tafazzoli, A. Arefi Oskouie and S.A. Mortazavi-Tabatabaei, Advantage of applying OSC to |
34 | [[34]] E. Roma, J. Panayiotou, H. Karantana, C. Constantinidou, S.I. Siakavellas, M. Krini, V.P. Syriopoulou and G. Bamias, Changing pattern in the clinical presentation of paediatric celiac disease: A 30-year study, Digestion 80: ((2009) ), 185–191. |
35 | [[35]] A. Rubio-Tapia, R.A. Kyle, E.L. Kaplan, D.R. Johnson, W. Page, F. Erdtmann, T.L. Brantner, W.R. Kim, T.K. Phelps, B.D. Lahr, A.R. Zinsmeister, L.J. Melton 3rd and J.A. Murray, Increased prevalence and mortality in undiagnosed celiac disease, Gastroenterology 137: ((2009) ), 88–93. |
36 | [[36]] E. Saccenti, H.C.J. Hoefsloot, A.K. Smilde, J.A. Westerhuis and M.M.W.B. Hendriks, Reflections on univariate and multivariate analysis of metabolomics data, Metabolomics 10: ((2014) ), 361–374. |
37 | [[37]] U. Sharma, K. Chaudhury, N.R. Jagannathan and S.K. Guha, A proton NMR study of the effect of a new intravasal injectable male contraceptive RISUG on seminal plasma metabolites, Reproduction 122: ((2001) ), 431–436. |
38 | [[38]] U. Sharma, D. Upadhyay, S. Mewar, A. Mishra, P. Das, S.D. Gupta, S.N. Dwivedi, G.K. Makharia and N.R. Jagannathan, Metabolic abnormalities of gastrointestinal mucosa in celiac disease: An in vitro proton nuclear magnetic resonance spectroscopy study, J. Gastroenterol. Hepatol. 30: ((2015) ), 1492–1498. |
39 | [[39]] L.M. Sollid, Molecular basis of celiac disease, Annu. Rev. Immunol. 18: ((2000) ), 53–81. |
40 | [[40]] G.J. Tack, W.H. Verbeek, M.W. Schreurs and C.J. Mulder, The spectrum of celiac disease: Epidemiology, clinical aspects and treatment, Nat. Rev. Gastroenterol. Hepatol. 7: ((2010) ), 204–213. |
41 | [[41]] Y. van de Wal, Y. Kooy, P. van Veelen, S. Peña, L. Mearin, G. Papadopoulos and F. Koning, Selective deamidation by tissue transglutaminase strongly enhances gliadin-specific T cell reactivity, J. Immunol. 161: ((1998) ), 1585–1588. |
42 | [[42]] D.A. van Heel and J. West, Recent advances in coeliac disease, Gut 55: ((2006) ), 1037–1046. |
43 | [[43]] S. Wold, M. Sjöström and L. Eriksson, PLS-regression: A basic tool of chemometrics, Chemometr. Intell. Lab. Syst. 58: ((2001) ), 109–130. |


