
Strategic argumentation dialogues for persuasion: Framework and experiments based on modelling the beliefs and concerns of the persuadee
Abstract
Persuasion is an important and yet complex aspect of human intelligence. When undertaken through dialogue, the deployment of good arguments, and therefore counterarguments, clearly has a significant effect on the ability to be successful in persuasion. Two key dimensions for determining whether an argument is “good” in a particular dialogue are the degree to which the intended audience believes the argument and counterarguments, and the impact that the argument has on the concerns of the intended audience. In this paper, we present a framework for modelling persuadees in terms of their beliefs and concerns, and for harnessing these models in optimizing the choice of move in persuasion dialogues. Our approach is based on the Monte Carlo Tree Search which allows optimization in real-time. We provide empirical results of a study with human participants that compares an automated persuasion system based on this technology with a baseline system that does not take the beliefs and concerns into account in its strategy.
1.Introduction
Persuasion is an important and multifaceted human facility. The ability to induce another party to believe or do something is as essential in commerce and politics as it is in many aspects of daily life. We can consider examples such as a doctor trying to get a patient to enter a smoking cessation programme, a politician trying to convince people to vote for him in the elections, or even just a child asking a parent for a rise in pocket money. There are many components that boost the effectiveness of persuasion, and simple things such as how someone is dressed or a compliment can affect the person they are trying to convince. Nevertheless, arguments are a crucial part of persuasion, and resolving a given person’s doubts and criticisms is necessary to win them over.
While arguments can be implicit, as in a product advert, or explicit, as in a discussion with a doctor, in both cases they need to be selected with the target audience in mind. In this paper, we focus on the following two dimensions in which a potential persuadee may judge arguments in the context of a dialogue.
Beliefs | Arguments are formed from premises and a claim, either of which may be explicit or partially implicit. An agent can express a belief in an argument based on the agent’s belief in the premises being true, the claim being implied by the premises, and the claim being true. There is substantial evidence in the behaviour change literature that shows the importance of the beliefs of a persuadee in affecting the likelihood that the persuasion attempt is successful (see for example the review by Ogden [83]). Furthermore, beliefs can be used as a proxy for fine-grained argument acceptability, the need for which was highlighted by empirical studies conducted in [86,97]. |
Concerns | Arguments are statements that contain information about the agent and/or the world. Furthermore, they can refer to impacts on the agent and/or the world, which in turn may relate to the concerns of the agent. In other words, some arguments may have a significant impact on what the agent is concerned about. In empirical studies, it has been shown that taking the persuadee’s concerns into account can improve the likelihood that persuasion is successful [29,32,52]. Conceptually, concerns can be seen as related to values as used in value-based argumentation. For instance, values can be used to capture the general goals of an agent as discussed in [9]. However, as we will explain, the way we use concerns in this paper is quite different to the way values are used in value-based argumentation. |
To illustrate how beliefs (respectively concerns) arise in argumentation, and how they can be harnessed for more effective persuasion, consider Example 1 (respectively Example 2).
Example 1.
Consider a health advisor who wants to persuade a student to join a smoking cessation programme (i.e., a health programme designed to help someone give up smoking). The student may be expressing reluctance to join but not explaining why. Through experience, the advisor might guess that the student believes one of the following arguments.
Argument 1: If I give up smoking, I will get more anxious about my studies, I will eat less, and I will lose too much weight.
Argument 2: If I give up smoking, I will start to eat more as a displacement activity while I study, and I will get anxious as I will put on too much weight.
Example 2.
Consider a volunteer street-fundraising for a hospital charity who has managed to engage in a conversation with a passerby.
Argument 1: Supporting this hospital will fund innovative cancer research.
Argument 2: Supporting this hospital will fund specialized hearing equipment for deaf people.
So in Example 1, the student has the same concerns, but different beliefs, associated with the arguments. In contrast, in Example 2, the passer-by has the same beliefs, but different concerns, associated with the arguments. We therefore see both the concerns and beliefs as being orthogonal kinds of information that an agent might have about an argument, and knowing about them can be valuable to a persuader.
In the research reported in this paper, we consider how beliefs and concerns can be taken into account in automated persuasion systems (APSs). An APS plays the role of the persuader and engages in a dialogue with a user (the persuadee) in order to convince them to accept a certain persuasion goal (i.e., the argument that encapsulates the reason for a change of behaviour in some respect) [67]. Whether an argument is convincing or not depends on the context of the dialogue and on the characteristics of the persuadee. Thus, an APS may maintain a model of the persuadee, use it to predict what arguments they may know about and/or believe, and harness this information in order to improve the choices of move in a dialogue.
In previous research, we have used the epistemic approach to probabilistic argumentation to reason with beliefs [21,62,64,87,105], and the value of this has been supported by experiments with participants [86]. In applying this approach to modelling a persuadee’s beliefs in arguments, we have developed methods for: (1) updating beliefs during a dialogue [57,66,68]; (2) efficiently representing and reasoning with the probabilistic user model [49]; (3) modelling uncertainty in the modelling of persuadee beliefs [51,69]; (4) harnessing decision rules for optimizing the choice of argument based on the user model [50,53]; (5) crowdsourcing the acquisition of user models based on beliefs [56]; (6) modelling a domain in a way that supports the use of the epistemic approach [30]. These developments for taking belief into account offer a well-understood theoretical and computationally viable framework for applications such as behaviour change.
However, belief in an argument is not the only dimension of a user model that could be taken into account. Recent research provides some evidence that taking concerns into account can improve the persuasiveness of a dialogue [32,52]. Thus, in order to model users better, it is worth exploring a combination of consideration of a user’s beliefs with consideration of their concerns in a coherent framework for strategic argumentation. Beliefs and concerns are different concepts (as seen in Examples 1 and 2). For instance, it is possible for an argument to be believed but neither raises nor addresses concerns that are important for an agent. Similarly, it is possible for an argument to be disbelieved but it does raise or address concerns that are important for an agent. Ideally, to increase the impact of arguments that we present to an agent, we would want the agent to believe the argument and to see that it raises or addresses concerns that are important to her. However, to date, there is a lack of a computational framework for harnessing both dimensions together in making strategic choices of move in a persuasion dialogues.
The aim of this paper is therefore to provide a computational approach to strategic argumentation for persuasion that takes both the concerns and the beliefs of the persuadee into account. They will be used to provide a more advanced user model which can be harnessed by a decision-theoretic APS to choose the arguments to present in a dialogue. To render this approach viable for real-time applications and to dynamically update an APS’s strategy as the dialogue progresses, we present an approach based on Monte Carlo Tree Search. We evaluate our proposal in an empirical study with human participants using an APS based on this technology which we will refer to as the advanced system. We compare its performance with an approach that does not rely either on beliefs nor concerns, which we will refer to as the baseline system. The analysis is carried out both on all of the dialogues conducted by the systems, as well as their certain subgroups exhibiting desirable properties.
We proceed as follows: (Sections 2, 3 and 4) We present our setting, from domain and user modelling to dialogue protocols; (Section 5) We present our framework for optimizing choices of moves in persuasion dialogues; (Section 6) We present our approach to acquiring and harnessing the crowdsourced data for user models; (Section 7) We present our experiments for evaluating our technology in automated persuasion systems; (Section 8) We discuss our work with respect to the related literature; and (Section 9) We discuss our contributions and future work.
2.Domain modelling
In the context of this paper, we focus on arguments as they can be found in newspaper articles or in discussions between humans, e.g. on forums or social media. In other words, we assume that they are pieces of text (1-2 sentences), and are either a short claim representing a persuasion goal or fact (e.g. “Universities should continue charging students the £9K fee.”), or loosely follow the premise-claim construction (e.g. “Students should regard their university education as an investment in their future, and so they should agree to pay the student fees.”). In order to improve readability, the claim may be left implicit if it is sufficiently obvious.
We will represent arguments and relations between them through the means of argument graphs as defined by Dung [38], which do not presuppose any particular argument structure and focus on modelling the attack relation.
Definition 1.
An argument graph is a pair
For arguments
An argument graph can be easily depicted as a directed graph, where nodes represent arguments and arcs represent attacks. We will therefore use
Given an argument graph, a natural question to ask is which arguments are acceptable, i.e., which arguments can be seen as “winning”. Based on dialectical notions, Dung made some important proposals for acceptable subsets of arguments where each subset is conflict-free (i.e., no arguments in the set attacks another argument in the subset) and admissible (i.e., for every attacker of an argument in the subset, there is a defender in the subset). Numerous proposals have been made that investigate variants and developments of Dung’s proposal and we refer the reader to [20] for a comprehensive review.
In our work, we will use the definition of an argument graph. However, as we will see in Section 5, we do not assume that the agents use dialectical semantics. The reason for not using dialectical semantics is that we are not concerned with determining the arguments acceptable according to normative principles. Instead, we wish to model how persuasion may occur in scenarios where the participants are allowed the freedom of opinion and as such do not need to adhere to any rationality principles. Certain studies show that the performance of dialectical semantics can be rather low in such applications [86,93]. Since we wish to construct a predictive model, we will not impose conditions for when an agent should be persuaded, but rather have a model that reflects how an agent is likely to behave. We refer to Section 8 for a discussion on approaches that follow the dialectical semantics.
3.User modelling
In this section we will describe the type of user model that we want to incorporate into our APS. We focus on two possible dimensions – the concerns and the beliefs of the user – and in the next sections we explain how they can be interpreted and modelled.
3.1.Concerns
A concern is meant to represent something that is important to an agent. It may be something that they want to maintain (for example, a student may wish to remain healthy during the exam period), or it may be something that they want to bring about (for example, a student may wish to do well in the exams). Often arguments can be seen as either raising a concern or addressing a concern, as we illustrate in the following example.
Example 3.
Consider the following arguments about abolishing student fees. Depending on the participant, the first argument could be addressing the concern of student finances whereas the second could be raising the concern of education.
(
(
The types of concern may reflect the possible motivations, agenda, or plans that the persuadee has in the domain (i.e., subject area) of the persuasion dialogue. They may also reflect the worries or issues she might have in the domain. When an argument is labelled with a type of concern, it is meant to denote that the argument has an impact on that concern, irrespective of the exact nature of that impact. For more discussion of the nature of concerns, see [32,52].
Various agents can, independently of each other, identify similar concerns. Thus, it may be appropriate to group these into types of concern. For example, we could choose to define the type “Fitness” to cover a variety of concepts, from lack of exercise through to training for marathons. The actual types of concern we might consider, and the scope and granularity of them, depend on the application. However, we assume that they are atomic, and that ideally, the set is sufficient to be able to type all the possible arguments that we might want to consider using in the dialogue. We therefore introduce the following notation:
Definition 2.
Let
While certain agents can agree on what kinds of concern a given argument raises or addresses, this does not mean that the concerns themselves are equally important or relevant to them. We thus also require information about the preferences over types of concern of an agent. For instance, if we have a collection of arguments on the topic of the university fees, we may have types such as “Student Well-being”, “Education”, or “Student Satisfaction”. We then may have an agent that regards “Student Well-Being” as the most important concern for them, “Education” being the second, and “Student Satisfaction” as last one. Another agent may have an entirely different preference regarding those categories, and these need to be represented, so that they can be harnessed by an APS to put forward more convincing arguments during a dialogue (see also Example 2).
Definition 3.
With
By
There are some potentially important choices for how we can model agent’s preferences. For instance, we can define them as pairwise choices or assume they form a partial or even linear ordering. While during the experiments we will focus on the linear approach (see Section 6), our general method is agnostic as to how preferences are represented. There are also numerous techniques for acquiring preferences from participants (see e.g., [34], for a survey). We thus assume that appropriate representation and sourcing techniques can be harnessed depending on the desired application.
3.2.Beliefs
The beliefs of the user strongly affect how they are going to react to persuasion attempts [83]. There is a close relationship between the belief an agent has in an argument, and the degree to which the agents regard the argument as convincing [56]. Furthermore, beliefs can be used as a proxy for fine-grained argument acceptability, the need for which was highlighted by empirical studies conducted in [86,97]. We therefore treat the belief in arguments as a key dimension in a user model. In this section we explain how we represent belief for an individual, and how we can capture the uncertainty in that belief when considering multiple (sub)populations of agents.
For modelling the beliefs of a user, we use the epistemic approach to probabilistic argumentation [21,63,64,106], which defines a belief model as a probability distribution over all possible subsets of arguments.
Definition 4.
A probability distribution over a graph
For a probability distribution P and
The persuader uses a belief distribution P as a belief model of the persuadee and updates it at each stage of the dialogue in order to reflect the changes in persuadee’s opinions. There are various possible ways to perform the updates (such as discussed in e.g., [66,68]) and the method we will focus on will be explained in Section 5.1.2.
Definition 4 considers the belief we have in an argument. However, it lacks any quantification of the uncertainty about the belief in an argument. For example, an agent may be certain of the value that
These distributions offer a well-established and well-understood approach to quantifying uncertainty. Additionally, they allow for a principled way of representing subgroups within a population. This is particularly important for applications in persuasion, where different subpopulations may have significantly different beliefs in the arguments in a dialogue. Furthermore, they may also have radically different ways of responding to specific dialogue moves. In such situations, easy-to-get or already gathered data (such as a medical record for instance) can be leveraged to match a new user with a particular subpopulation in order to use a more efficient argumentation strategy.
So rather than use a probability distribution as given in Definition 4 to formalize the belief in an argument, we will use a beta distribution. In a beta distribution for an argument A, the X axis gives the belief in the argument in the unit interval (i.e.
As we see in the following definition, the shape of the beta distribution is determined by two hyperparameters α and β. Fig. 1 shows two examples of beta distributions.
Definition 5.
A beta distribution
Whilst this definition may appear complex, it gives a natural way of capturing the probability of a probability value. Furthermore, the definition can be easily understood in terms of capturing Bernoulli trials.
Given the definition for a beta distribution, the mean μ and variance ν can easily be obtained as follows.
Using the beta distributions gives us a number of advantages. The distribution can handle the uncertainty on the belief (i.e. the uncertainty over the value assigned to
We can then plug the estimates
Another advantage of beta distributions is that we use them to detect the subpopulations with homogeneous behaviours (i.e. similar belief). In other words, we may find that the data about a population suggests that there are multiple underlying beta distributions. This can be handled by the notion of a mixture of beta distributions which we define below.
Fig. 1.
Examples of beta distributions with parameters
![Examples of beta distributions with parameters (α=0.12,β=0.45) and (α=3.41,β=3.38) (zoomed in for visualisation), and the mixture with weights vector π=[0.15,0.85] for the argument “University education is an investment in the economy of the whole country, and therefore everyone should contribute to university education.”](https://content.iospress.com:443/media/aac/2023/14-2/aac-14-2-aac210005/aac-14-aac210005-g001.jpg)
The mixture of beta distributions in Fig. 1 shows the initial belief of all the participants in the argument “University education is an investment in the economy of the whole country, and therefore everyone should contribute to university education.”. We see that a unimodal distribution (i.e., containing only one “bell”) cannot accurately represent the data. Indeed, it is composed of extreme values on both ends, and high values in the middle of the range. This multimodal shape suggests that there is a heterogeneous underlying population. Therefore, there are multiple underlying beta distributions, each representing a more homogeneous subpopulation. For this reason, we use a mixture of beta distributions in order to create a multimodal distribution. Each distribution is called a component, and all components are weighted and summed as a linear combination as defined next.
Definition 6.
A beta mixture is characterised by a triple
Therefore, a mixture M is calculated as follows:
By extension, the probability of a belief
Figure 1 also presents the mixture of the two components, combined with a weights vector
So beta distributions offer a flexible and practical way of representing the belief in arguments when there is uncertainty in what that belief might be. As we will see, we can collect data from crowdsourced participants about their belief in arguments, and use this to populate the beta distributions in our user models. This involves finding the choice of components that best describes the data. This may involve a trade-off of the number of components and the fit with the data (see [51] for more details).
4.Dialogue representation and rules
There are many possible moves and protocols for dialogical argumentation (see Section 8), and they vary in their goals or properties. For the purpose of this study, the protocol we require would have to meet the following principles – asymmetry, timeliness and incompleteness.
Asymmetry of a dialogue means that different parties have different types of moves available, or one party has control over how others can express their opinions. In our case, this means that while the system can put forward arguments freely, the user will need to select theirs from a list displayed to them, referred to as a menu. This bypasses the need for a natural language processing module within our APSs that would extract user arguments from free text, but puts additional burden on the domain design to increase the applicability of the menus to the users.
Timeliness means that the user’s counterarguments are addressed when they are stated. Typically, persuasion dialogues allow only for one argument to be expressed at a time, or proceed in a depth-first manner. In other words, if the user has three counterarguments, then the first one (and its counterarguments, and counterarguments of these counterarguments, etc) is fully explored before moving onto the second. This kind of narrative can be natural for various settings, such as scientific discussions, but less intuitive in others. It also makes the success of the dialogue vulnerable to the estimation of what the user’s most important issue is (i.e. which discussion branch should be explored first). Getting the order right is even more important due to the fact that the longer the discussion is, the less effective it may be [108]. Consequently, we believe that there is a need for a more breadth-first approach, where user’s issues are not “put on hold”, which can mean that multiple arguments may have to be dealt with at each step of the dialogue. Whilst, we do not appear to be the first to suggest the need for dialogue protocols to support the need for multiple answers to be given at once (see for example [112]), there is a need to study formalizations of such behaviour.
Last, but not least, incompleteness means we do not force all arguments to be matched with appropriate counterarguments. In real life, an exhaustive response can simply be too exhausting to the user, which creates the risk of disengagement. In some cases, dealing with key issues may be more effective than dealing with all of them. We are therefore more concerned with what are the allowed exchanges between the system and user and what effect they have. Completeness of a dialogue is often an effect of assuming that a dialogue is evaluated using dialectical semantics, which is something we are not doing in this study.
In the next sections we will provide a formalization of dialogue moves and the above intuitions concerning the protocol. In this paper we will assume that a dialogue is a sequence of moves
4.1.Dialogue moves
In this paper, we will only consider two types of move – the posit move, which will be used by the APS to state arguments, and the menu move, which will allow the user to give their counterarguments. In order to make certain notation easier, throughout this section we will assume that we have a dialogue D and a graph
The purpose of the posit move is to present the starting argument, and after that the counterarguments to the previously presented arguments. In order to do so, we first consider a function returning a set of attackers of a given argument that does not contain statements that have already been made during a dialogue.
Definition 7.
The set of options of argument A at step i in dialogue D is defined as follows, where for all
With this, we define posit moves as follows:
Definition 8.
For a dialogue D and step i, the set of posit moves is given by a function
We note that for every posit move
Now we introduce the menu move as a way for the user to give their input into the discussion. In an asymmetric dialogue, the counterarguments to choose from are displayed to the user by the system, and the user is meant to select their response from the list 11 In our approach, we not only include the arguments to choose from, but also the null options (denoted with
Definition 9.
The menu listing at step i in dialogue D for an argument A is defined as follows:
Fig. 2.
Interface for an asymmetric dialogue move for asking the user’s counterarguments. Multiple statements (and their counterarguments) can be displayed, one after another.

A menu move is simply a selection of responses from the menu listings against previously stated arguments, with the added constraints that for any given argument, a choice has to be made, and one cannot pick the null moves and counterarguments at the same time.
Definition 10.
For a dialogue D and step i, the set of menu moves is given by a function
We observe that for a given menu move
The posit and menu moves as defined here are only some of the possible moves that could be used in asymmetric persuasion dialogues. Nevertheless, they are sufficient for our purposes and have the benefit of resembling other popular non-dialogical interfaces for user input. In the next sections, we define our dialogue protocol based on these moves.
4.2.Dialogue protocol
Let us now formally define the protocol for our dialogues using the previously proposed moves. The use of posit and menu moves and the lack of certain restrictions on them allows the protocol to meet our principles of asymmetry, timeliness and incompleteness. This, along with certain classical requirements (such as participants taking turns in expressing their opinions), leads to the following formalization.
Definition 11.
A dialogue
1. For each step
2. For each step
3. For step
4. For each step i such that
5. For each step i such that
6. For step
7. For each step
8. For the final step k, one of the following conditions hold, and for all steps
(a)
(b)
Example 4.
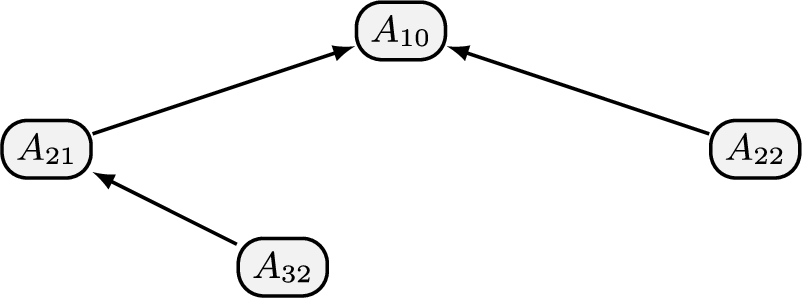
For the purpose of our experiments, we have constructed two argument graphs that we will discuss in Section 6.1. Figure 3 presents the subgraph of the original graph associated with the discussion visible in Table 1. The table presents a dialogue between the user and one of the APSs we have implemented; for the sake of readability, we refer to arguments with their tags rather than textual content.
We observe that the agents take turns in presenting their arguments, and since the definition of our dialogue moves forces an argument-counterargument relation, the system moves are at an even distance from the persuasion goal (argument 0) and user moves are at an odd distance. In other words, they are (indirect) defends and (indirect) attackers of the goal respectively. The fact that not every user argument has to be answered by the system in our protocol results in arguments 17, 34, 35, 36 and 83 being unattacked.
Table 1
An example of a dialogue adhering to the asymmetric posit protocol for the argument graph in favour of maintaining student fees (see data appendix)
| Step | Agent | Move made |
| 1 | System | |
| 2 | User | |
| 3 | System | |
| 4 | User | |
| 5 | System | |
| 6 | User | |
| 7 | System |
Fig. 3.
A subgraph of the argument graph in favour of maintaining student fees (see data appendix) induced by the dialogue from Table 1.
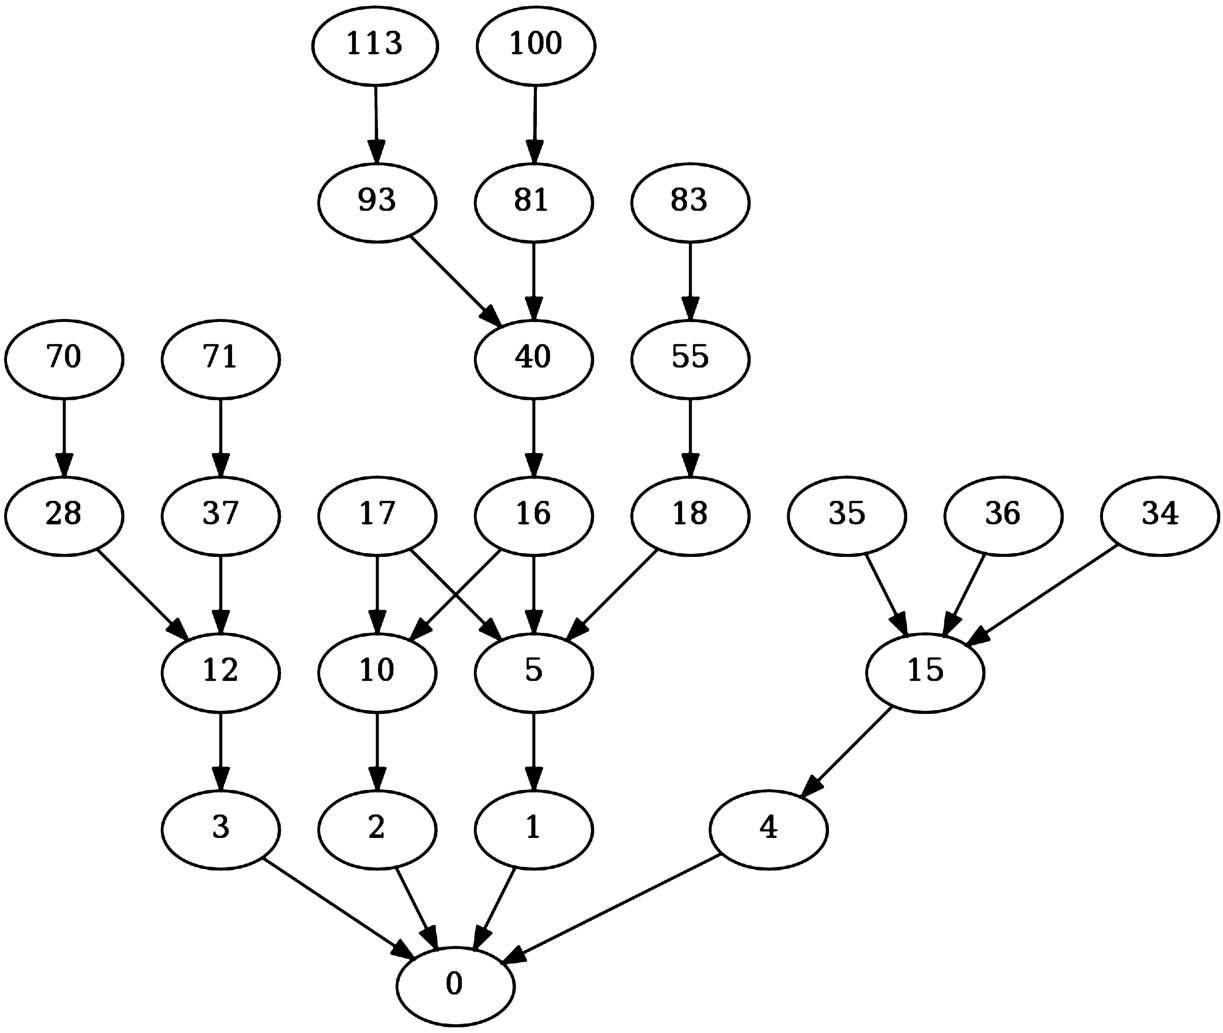
The above restrictions can be simply explained as follows. First, only the arguments that occur in the graph can be exchanged. The system and the user take turns in the dialogue, with the system making the first move by positing the persuasion goal. The system posits need to be met with appropriate user menu moves, and the counterarguments raised by the user may be (not necessarily fully) addressed by system posits. The system is only forced to give a complete response to the first user move – after that, the responses can be partial. In particular, we limit the number of active dialogue lines to two, i.e., that at most two arguments that can still be responded to by the user can be played by the system22. This also means that any number of initial arguments can be played, as they do not lead to further discussions. Finally, the dialogue terminates if the system decides not to play any arguments or no further moves can be made. This can happen if neither the user nor the system have any arguments left to play (i.e we have reached leaf arguments), the user concedes or all of their counterarguments are outside of the domain (i.e. the user chooses only the
At the end of the dialogue, the system (i.e., the persuader) hopes to have convinced the user (i.e., the persuadee) to accept the persuasion goal (i.e., the first argument in the dialogue). We do not use dialectical semantics to determine whether the persuasion goal is a winning argument (for example, if it is in a grounded or preferred extension of the subgraph of
Our approach is one of many, and there exist various different dialogue protocols (see also Section 8). Nevertheless, we are not aware of other methods that would adhere to our principles. This protocol is different to the dialogue protocols for abstract argumentation that are used for determining whether specific arguments are in the grounded extension [90] or preferred extension [35]. It is also different to the dialogue protocols for arguments that are generated from logical knowledge bases (e.g., [22,39]). Those protocols are concerned with determining the winning arguments in a dialogue in a way that is sound and complete with respect to the underlying knowledge base. Finally, it is worth noting that many proposals for dialogical argumentation protocols involve depth-first search (e.g., [19]), which goes against our timeliness requirement.
5.Dialogue strategies
Typically, at any step of the dialogue, there can be multiple move options to choose from. In other words, particularly with large domains, more often than not it can be the case that
5.1.Advanced strategy
Our approach to making strategic choices of move is to harness decision trees [50]. A decision tree represents all the possible combinations of decisions and outcomes of a sequential decision-making problem. In a situation with two agents taking turns, a path from the root to any leaf crosses alternately nodes associated with the proponent (called decision nodes) and nodes associated with the opponent (called chance nodes). In our case, the role of the proponent is played by the APS, and user is the opponent.
In the case of dialogical argumentation, a full decision tree represents all the possible dialogues. Each path from the root to a leaf is one possible permutation of the moves permitted by the dialogue protocol i.e., one possible complete dialogue between the two agents. An edge between any two nodes n and
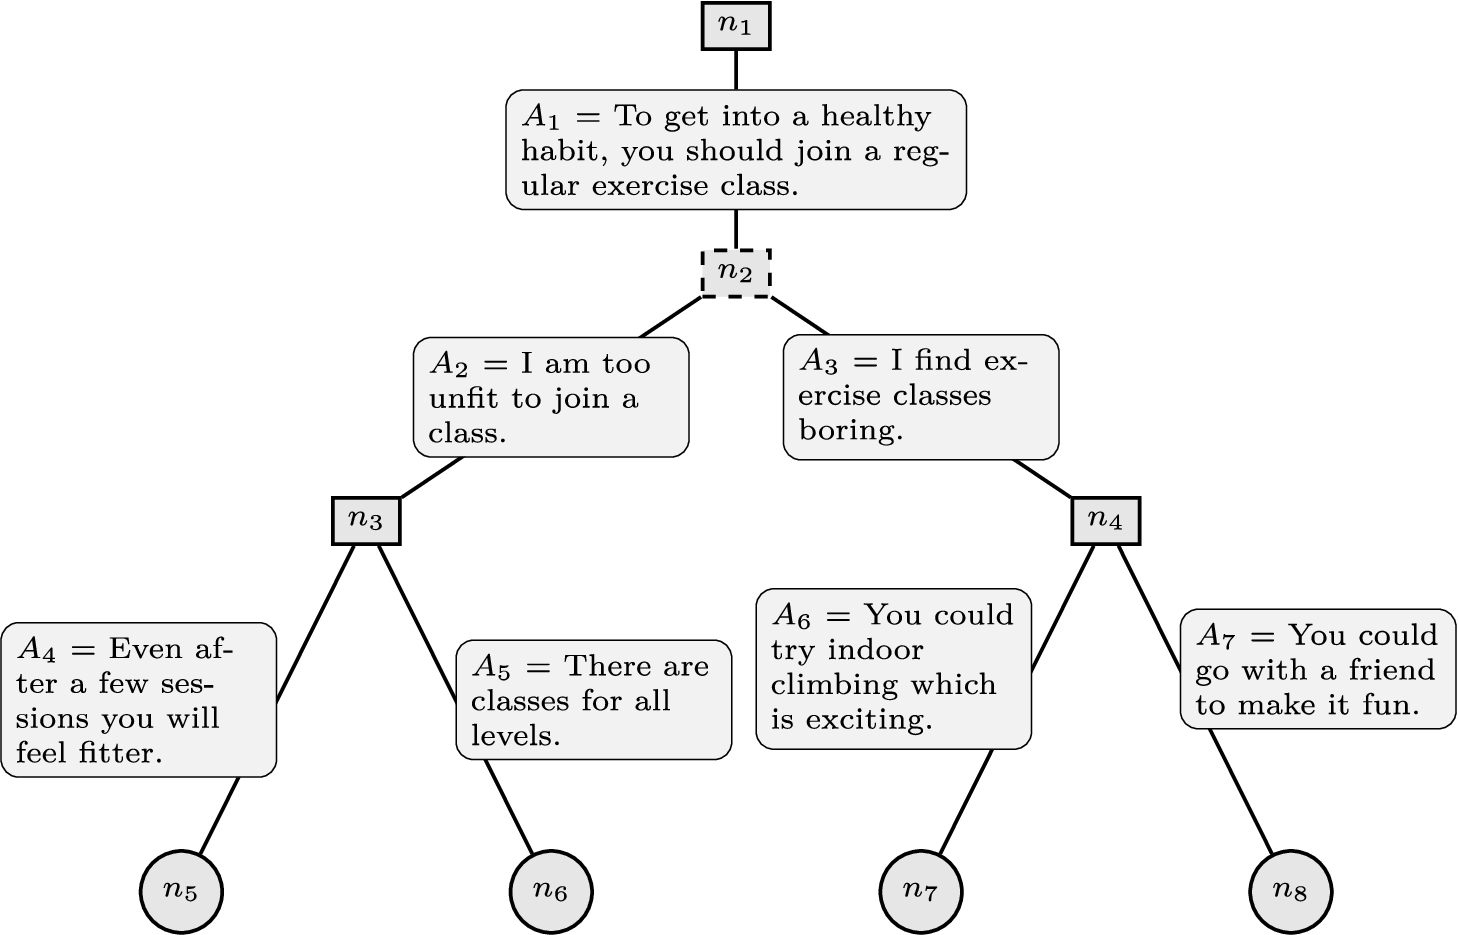
Fig. 4.
A decision tree for an argumentation dialogue. Each arc is labelled with a posit move in a dialogue, which for readability purposes is assumed to consist of only single arguments in this example. Each branch denotes a dialogue involving exactly three arguments with the first (respectively the second) being posited by the proponent (respectively the opponent). The proponent (decision) nodes are solid boxes, the opponent (chance) nodes are dashed boxes and the leaf nodes are circles.
In order to compare different dialogues so as to be able to select the best one that can be reached from each step, we need to define a reward function that gives a value of the dialogue or outcome of the dialogue to the system. Every node in a tree can then be evaluated based on the outcomes it leads to. Hence, for every decision node, we can also find an action to perform (e.g., the arguments to posit in each state of the debate) that would lead to a more beneficial result according to a given criterion.
Decision trees are useful tools in artificial intelligence. However, they also have their limits, and quickly become unmanageable in applications with a large number of possible outcomes. For instance, while we can use decision trees for a tic-tac-toe game, Go is too complicated. Unfortunately, given the sizes of argument graphs we will be dealing with in this paper, the same holds for our APS. A possible solution is to make use of appropriate sampling techniques that explore only certain branches of the tree (i.e. only certain dialogues) rather than all of them, and in this paper we will rely on the Monte Carlo Tree Search method.
Monte-Carlo Tree Search (MCTS) [33] methods are amongst the most efficient online methods to approximately solve large-sized sequential decision-making problems (for a review, see [23]). This method is notably used in the Partially Observable Monte-Carlo Planning (POMCP) algorithm [104] and in applications such as Alpha-Go [102]. Unlike traditional decision tree solving methods such as backward induction, using an MCTS is significantly less affected by the dimensionality. Since the branching factor (i.e. the number of actions we can perform in a given node) increases with the number of arguments we can play, choosing a resilient method is vital for the efficiency of our system.
5.1.1.Monte Carlo tree search
The approach can be roughly split into four phases – selection, expansion, simulation and backpropagation – that are repeated until the desired number of simulations has occurred or some time limit is reached.
Selection: | Starting from the root of the tree (the current state of the dialogue) the algorithm chooses an action to perform in a black box simulator of the environment. It uses the UCB1 [4] procedure to choose the action and then observes the new state of the environment that is output by the simulator. It then goes down a level in the tree depending on this new state. The algorithm repeats this step until it reaches a leaf in the tree. |
Expansion: | If this leaf is not a terminal state of the problem (i.e., a possible end of the dialogue), the algorithm expands the tree at this leaf and adds a child for each possible subsequent state. |
Simulation: | Once the leaf node has been expanded (and is thus not a leaf anymore) the algorithm simulates all the subsequent steps in the dialogue until it reaches a possible terminal state. This simulation does not expand the tree. |
Backpropagation: | Once a terminal state has been reached, a reward can be calculated and then backpropagated up in the tree to calculate the most promising nodes. |
These four steps are repeated until the desired number of simulations has occurred or some time limit is reached. At this point, the most promising next argument in the dialogue is selected as the child of the root node with the highest backpropagated reward. This argument is played in the real dialogue, a new state is observed after the user responds and the root of the simulation tree is moved down to the node representing this new state.
5.1.2.Reward function
The purpose of the reward function is to be able to compare dialogues; the higher the reward, the better or more desirable the dialogue is. In our framework, the reward function is based on the usage of concerns arising in the arguments, and the belief in the persuasion goal at the end of the dialogue. For this, we have designed the reward function in two parts, that are ultimately combined into one single value, as we describe in this section.
Scoring of concerns. In this subsection, we will introduce a function for scoring a dialogue in terms of the concerns that are associated with the arguments presented in the dialogue, and the user’s preferences over them. We will use this function to compare dialogues as part of a reward function in Section 5.1.2. Note, in this paper, we assume that concerns and preferences between them are static and so not updated during the dialogue.
The aim of the concern scoring function is to reflect how well the arguments posited by the system match the user’s preferences over concerns. We assume that arguments covering fewer, but more important concerns to the user, are more interesting than arguments covering more, but less relevant concerns.
We thus aim to select the most appropriate argument(s) to state out of the possible ones. Every argument uttered in a dialogue (aside from the persuasion goal) is stated in response to one or more arguments that appeared in the previous move (see Section 4.2). We can thus speak about “dialogue parents” of a given argument (i.e., arguments at a previous step that they attack) and “dialogue siblings” (i.e., all arguments that could potentially be used against a dialogue parent). We can then analyze the concerns associated with a given argument, with its siblings, with those that have appeared in the dialogue and those that have not.
Notation 1.
We introduce the following notation, where
We explain these functions as follows:
In addition, we require the function
Definition 12.
Let
The concern score of a given dialogue step associated with the system is now defined in terms of how “good” or “bad” the sibling arguments that were not played are. For obvious reasons, the first step in which the persuasion goal is played is ignored. The score of the dialogue is then simply an average of these values:
Definition 13.
Assume
The non-chosen score for a step of the dialogue generates an average preference score for each non-chosen concern. This is done by taking each concern of the arguments played (i.e.,
We observe that the concern score of a dialogue is always in the
Proposition 1.
For all dialogues D,
Proof.
Let
Example 5.
Consider the following dialogue based on the argument graph in Fig. 5 where the graph and dialogue are hypothetical: 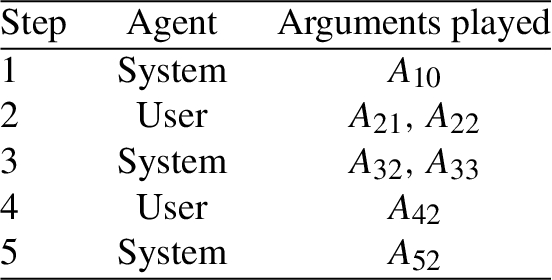
Assume that the concerns associated with the arguments and the population preference scores are as follows:
The concern score combines the information about the concerns associated with the arguments appearing and not appearing in the dialogue, and the relative preference over those concerns, to a single value in the unit interval. The definition incorporates a bias favouring arguments that have fewer concerns associated with them. Increasing the number of concerns for the chosen arguments causes the non-chosen score (given by the NonChosenScore) to increase, which then causes the concern score (given by the ConcernScore) for the dialogue to increase, whereas increasing the number of concerns for the non-chosen arguments, causes the non-chosen score to decrease, which then causes the concern score for the dialogue to increase. This and other features of the definition could be further investigated, and alternative definitions could be devised and harnessed with our framework for strategic argumentation. We leave this task for future work.
Updating the user’s beliefs. The user model gives the predicted beliefs of the user in the arguments at the start of the dialogue. By the end of the dialogue, the user’s beliefs may have changed as a result of the discussion. We therefore need an appropriate update function for producing new, more accurate beliefs throughout the dialogue.
In principle, we could update a user model during a dialogue using a belief redistribution function that takes the old probability distribution and returns a revised one. To do this, we could consider the notion of an update method
However, if the update is applied on all of the possible subsets of arguments, it may lead to a computationally intractable problem. To address this issue, we can for instance exploit the structure of the argument graph
Definition 14.
A probability labelling is defined as
For further details on the properties of such labellings we refer to [61,88,89]. What is important to note is that every probability distribution has a corresponding labelling, and for every labelling we can find at least one probability distribution producing it.
We also need the following notion of an induced graph, i.e. the subgraph of
Definition 15.
Let D be a dialogue and
Example 6.
Consider the argument graph
Fig. 6.
Example of an induced argument graph.
Throughout the rest of this section, we will assume that we are working with a graph
We consider three stages of belief for an argument (and hence three labellings) as arising in a dialogue (and so attack and defence is with respect to the arguments in the dialogue).
the initial belief (init) when the argument has just been played,
the attacked belief (att) after the argument has been attacked, and
the reinstated belief (reinst) if the argument is defended at the end of the dialogue.
In order to model this behaviour of partial effectiveness of updating belief, we introduce the following coefficients to play the role of dampening factors (as suggested in [17]) which causes the effect of an attacker to decrease as the length of the chain of arguments increases. We will introduce the
Definition 16.
For
The definition of these coefficients provides a balance between how strongly the attackers are believed and their number. There are other ways to aggregate beliefs of attackers, each with their advantages and disadvantages. Summing the attackers’ beliefs, while simple, may not be in [0,1], whereas taking the maximal or average belief does not reflect the number of attackers. Our definition addresses these issues and additionally provides a form of dampening effect so that the influence of an argument decreases as the length of the chain of arguments increases.
In the following, we show that: the coefficients are in the unit interval (Proposition 2); when there are attackers of an argument, and all the attackers have an initial belief of 1 (respectively 0), then the
Proposition 2.
For an argument A,
Proof.
Let n denote the cardinality of
Proposition 3.
If
Proof.
Assume
In the following result, we assume that the attackers for an argument A are given in some arbitrary ordering (i.e. the ordering has no meaning).
Proposition 4.
For arguments A and
Proof.
From the proof of Proposition 2, we have
Like in the previous result, the following result assumes that the attackers for A are given in some arbitrary ordering, and then we can put the first m attackers in
Proposition 5.
For arguments A and
Proof.
From the proof of Proposition 2, we have
Now we define the way initial, attacked, and reinstated belief are calculated for each argument A. In this paper, we assume that for the
Definition 17.
Let
So
In contrast,

Example 7.
Consider the argument graph in Fig. 7. The following table gives the 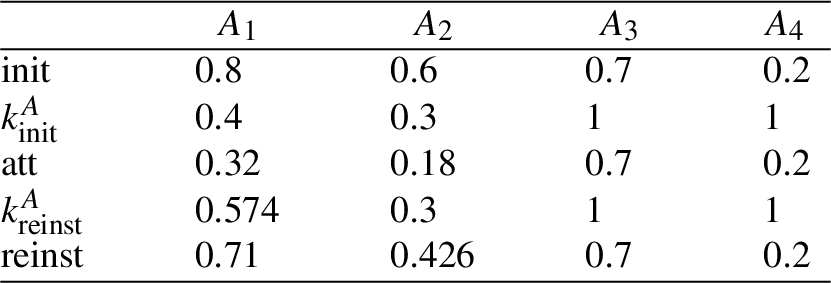
Here we see that because
We use the formulae in Definition 17 for several reasons. First, the definition takes the initial belief into account (where that comes from the beta distribution). Second, the definition takes the number of attackers into account. In a fine-grained setting, it is normally difficult to have a uniform intuition as to whether a single attacker with high belief should be more effective in decreasing the belief on the attackee than 10 attackers with lower beliefs. Using our k calculation, we take into account both the number of attackers and their respective weight in the set of attackers. Finally, we have made the common assumption that the reinstated belief should be lower than the initial belief in the argument (see [97] for an empirical study and [86] for a discussion). For this, the use of the coefficients has a dampening effect so that an indirect attacker or defender has decreasing effect as the length of the path to the attacked or defended argument increases.
The
Combining concerns and beliefs. We now combine the two dimensions of the reward that we have specified in Sections 5.1.2 and 5.1.2 as follows.
Definition 18.
For a dialogue D, and a persuasion goal A, the reward function is
Put simply, the reward function is the product of the two dimensions. This means we give equal weight to the two dimensions. It also means that weakness in either dimension is sufficient to give a low reward.
Example 8.
We continue Example 5 where for the dialogue D,
The reward function is a simple and intuitive way of aggregating the two dimensions, but other aggregations could be specified and used directly in our framework.
5.1.3.Simulating a choice from the user
When simulating the results of the system’s actions, we also need to simulate a credible behaviour from the user in order to advance in the simulated dialogue. Thus, it is important to mimic the choices of arguments that the user could make. In order to do that, we propose a multistep process, for each argument A from the system to counter:
1. Sample: for each counterarguments B to A, we sample from the beta mixture to simulate whether the user believes B or not, i.e., whether the value drawn from the mixture is greater than 0.5 or not;
2. Order: the set of believed counterarguments
In other words, the arguments are ranked from the user point of view, according to her preferences and belief;3. Filter: to take into account the fact that a user can decide to withhold arguments she believes, we randomly draw a subset size
All the subsets of believed counterarguments to the arguments played by the system are then used as the new step in the simulated dialogue, i.e., a new state in the Monte-Carlo tree, from which any subsequent simulation for this line of dialogue will start.
The assumptions that we have made for the simulation of the user choices are supposed to encompass any possible actual behaviour for the users (supposing their choices are based on the same elements: belief in arguments, ranking on them and then choice of whether to play them or not). Therefore, in theory, with enough simulation, the strategy that we obtain is the most robust way for facing the real users.
5.2.Baseline strategy
The baseline and advanced systems use the same protocol and the same argument graphs. This means that the baseline and advanced systems only differ on the argument selection strategy. The baseline strategy is a form of random strategy: When the baseline system has a choice of counterargument to present, it makes a selection using a uniform random distribution.
6.Data for domain and user modelling
In this section, we describe the methods used for obtaining the data we required for populating our domain and user model. The domain model is based on an argument graph (Section 6.1) and the assignment of concerns to arguments (Section 6.3), and the user model is based on the belief in arguments (Section 6.2), preferences over concerns (Section 6.4), and classification trees for predicting preferences over concerns (Section 6.5). This data is available as an appendix.33
For each task, we have recruited a certain number of participants from a crowdsourcing platform called Prolific44 and ensured the quality of their responses by using appropriate attention checks. We have also excluded the participants of one task from taking part in another task. We note that while the participants came from a single platform, various tools were used to create the questionnaires and tasks themselves, depending on the kind of functionality that was needed.
6.1.Argument graphs
For the experiments that we present in Section 7, we used two argument graphs on the topic of charging students a fee for attending university. Since the experiments were conducted with participants from the UK, the arguments used in the argument graph pertain to the UK context. In the UK, the current situation is that students from the UK or other EU countries pay £9K per year for tuition at most universities. This is a controversial situation, with some people arguing for the fees to be abolished, and with others arguing that they should remain in place.
Each argument graph has a persuasion goal. For the first argument graph, the persuasion goal is “Charging students the £9K fee for university education should be abolished”, and for the second argument graph, the persuasion goal is “Universities should continue charging students the £9K fee”. The reason we have two graphs is that when we ran the experiments, we asked a participant whether they believe the £9K tuition fees should be abolished or maintained. If they believed that the fees should be maintained, then the APSs used the first argument graph (i.e. the graph in favour of abolishing the fees), to enter the discussion, whereas if they believed that they should be abolished, then the APSs used the second argument graph (i.e. the graph in favour of continuing charging the fees).
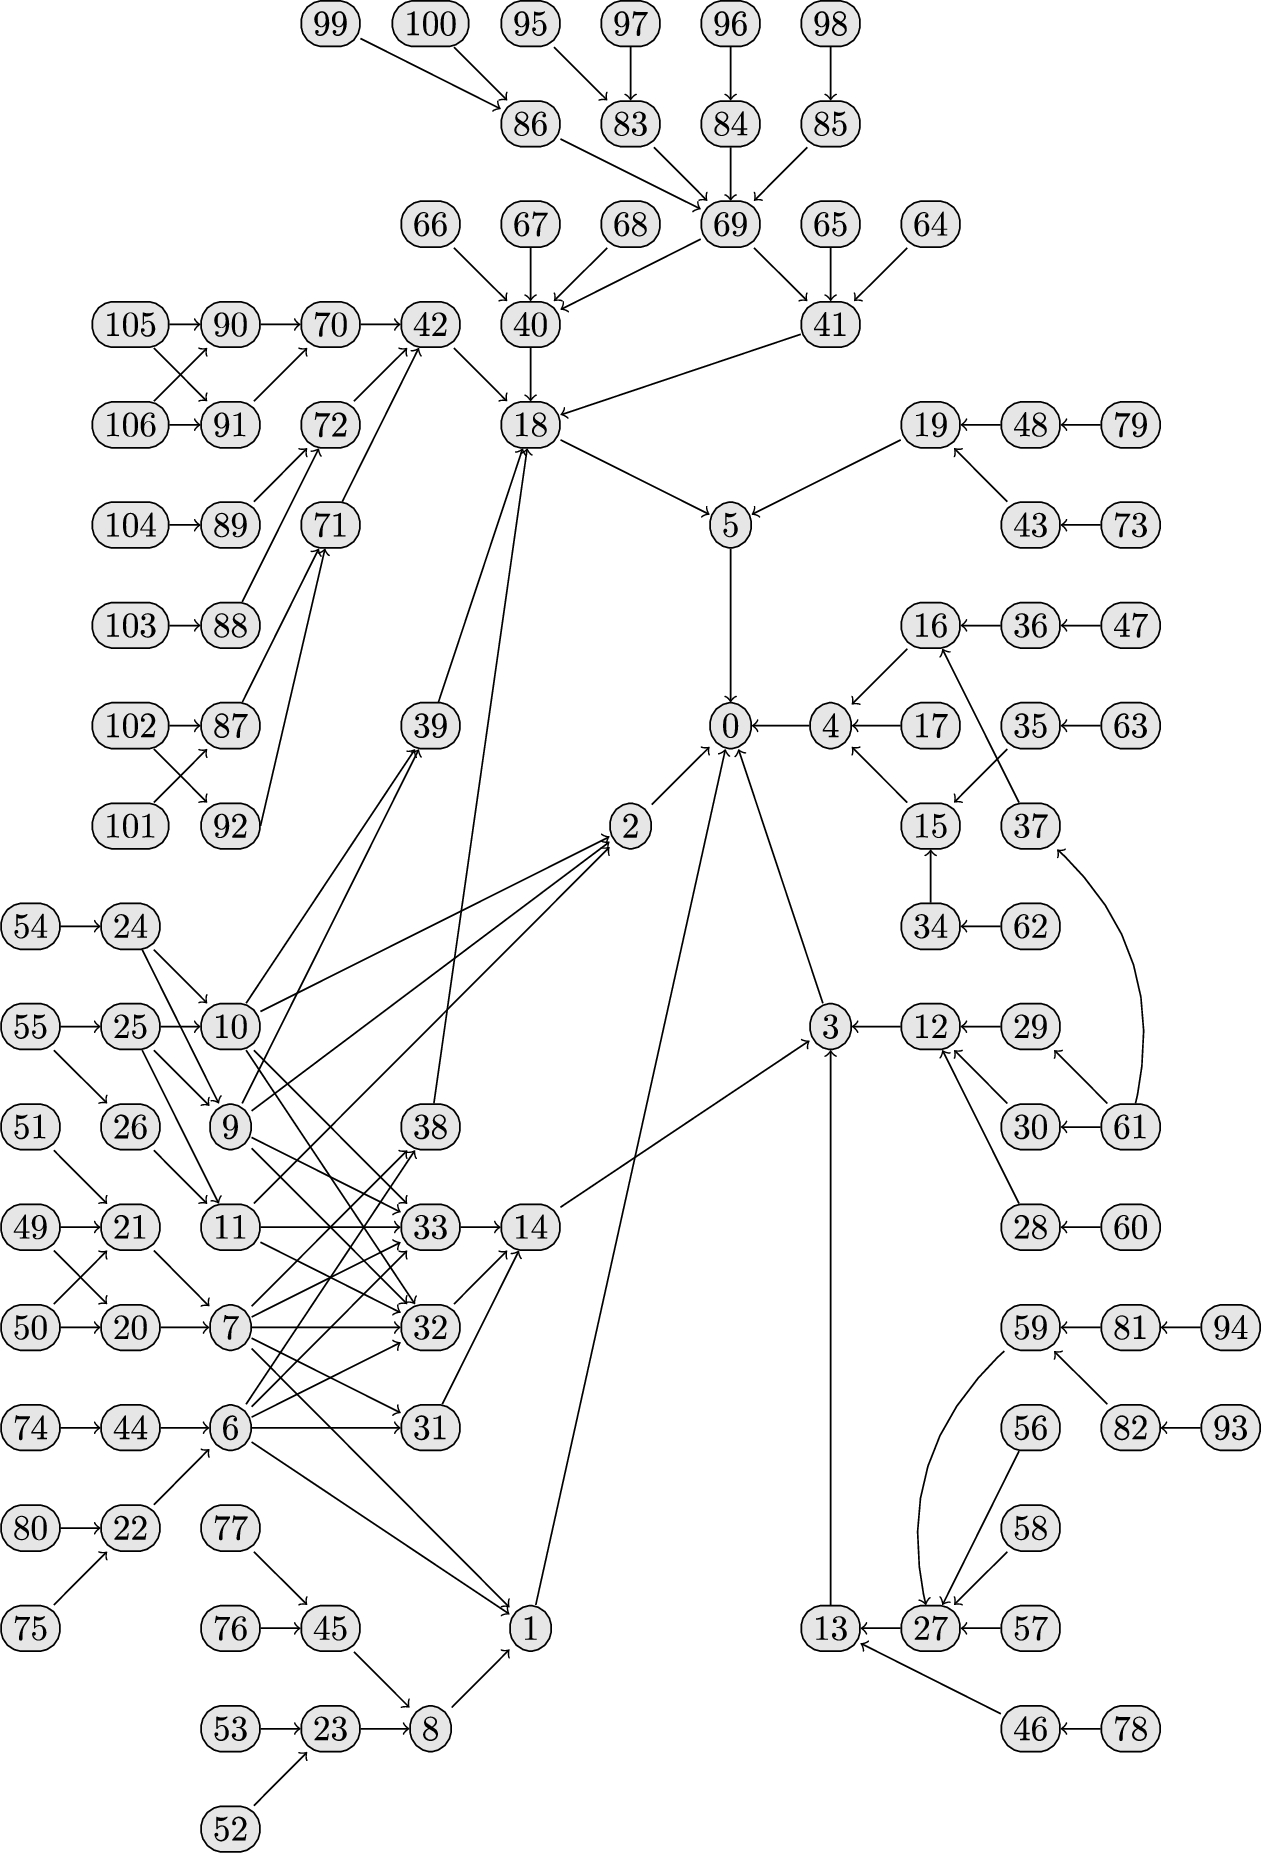
The arguments were hand-crafted, however, the information in them has been obtained from diverse sources such as online forums and newspaper articles so that it would reflect a diverse range of opinions. These arguments are enthymemes (i.e., some premises/claims are implicit) as this offers more natural exchanges in the dialogues. We obtained 146 arguments, which were then used to construct the two argument graphs (the first graph contains 106 of them, while the second 119). Hence, many of the arguments are shared, but often play contrary roles (i.e. a defender of the persuasion goal in one graph was typically an attacker in the other). In the context of this work, we only deal with the attack relation, and so we did not consider other kinds of interactions such as support. Furthermore, we did not attempt to distinguish between the different kinds of attack (such as undercutting or undermining). Some arguments were edited to enable us to have reasonable depth (so that the dialogues were of a reasonable length) and breadth (so that alternative dialogues were possible) to the argument graph. Authors have used a group deliberation approach, which has shown to improve performance in argumentation tasks [27], in order to ensure the best possible correctness and coherence of the graph. Nevertheless, we acknowledge that with natural arguments, there can be some degree of subjectivity in the structure of the graph. The full list of the arguments is available in the Data Appendix, and the structure for one of the argument graphs is also presented in Fig. 8.
For the following data gathering steps, we split the 146 arguments into 13 groups (the groups are distinguished in the Data Appendix files associated with surveys in which grouping was needed). We did this so that no group contained two directly related arguments (i.e. no arguments where one argument attacks the other) and or sibling arguments (i.e. attacking the same argument). The aim of this was to avoid the participants consciously or subconsciously evaluating interactions between arguments when undertaking the tasks in the following steps. In other words, when a participant was given a group of arguments, we wanted them to consider the arguments individually and not collectively.
Fig. 8.
One of the argument graphs for the university case study. The persuasion goal is “Charging students the £9K fee for university education should be abolished”. In order to better show the structure of the graph, the textual content of the arguments has been removed. The text is available in the data appendix.
6.2.Belief in arguments
In order to determine the belief that participants have in each argument, we used the 13 groups of arguments as described in the previous section. For each group, we recruited 80 participants from the Prolific crowdsourcing platform and asked each of them to assign a belief value to every argument in the group.55 For each argument in the group, we asked the participants to state how much they agree or disagree both with the information and the reasoning presented in it (if applicable). For example, given a text “X therefore Y”, we asked them to consider whether they agree with X and Y and believe that X justifies Y, and to make their final judgment by looking at all of these elements.
For each statement, the participants could provide their belief using a slider bar that has a range from −5 to 5 and with a granularity of 0.01. This means that a participant can give a belief such as −2.89 or 0.08. Whilst the granularity is finer grained than perhaps necessary, we believe it is better to do this than risk losing information with a less-fine grained granularity. We also associated a text description with each integer value as follows: (−5) Strongly disagree; (0) Neither agree nor disagree; and (5) Strongly agree.
Once all the beliefs were gathered, we calculated the beta mixture for every argument (recall Section 3.2), using the method described in [51]. Using an Expectation Maximisation (EM) algorithm, we learnt the set of components (the beta distributions) describing data the best, while taking into account the complexity of the model in order to avoid overfitting. Please see [51] for details on how this was done.
Table 2
Types of concern for the topic of charging university tuition fees
| Concern | Description of what concern deals with |
| Economy | Economy of the country, including public sector, private sector, import, export, taxation of companies, etc. |
| Government Finances | Government finances, including general taxation, government spending etc. |
| Employment | Careers and employability of students and the general job market. |
| Student Finances | Finances of students, including tuition fees, student debts, credit scores, life costs etc. |
| Education | Education, including the quality and value of education, grade inflation, personal development etc. |
| Student Satisfaction | Whether students are satisfied with their courses and universities and whether their requests are heard and met. |
| Student Well-Being | The physical and mental health of students, recreation and leisure activities, stress, future fears etc. |
| University Management | How universities are run, including university finances, competition between universities, investment into facilities or research etc. |
| Commercialization of Universities | How universities are commercialized, including private sector universities, treating students as customers, market forces affecting the running of universities etc. |
| Fairness | Whether something is fair or not (using a general understanding of fairness), including equal and just treatment of individuals. |
| Society | Various groups of society as well as society as a whole, and includes social mobility, minorities, disadvantaged groups of society etc. |
6.3.Concerns of arguments
Once all the arguments have been defined, they need to be appropriately tagged with concerns. The types of concern that can be associated with the arguments are topic dependent and in this work we manually defined a set of 12 classes (as presented in Table 2). These were based on a consideration of the different possible stakeholders who might have a view on university tuition fees in the UK, and what their concerns might be.
In order to determine the concerns that the participants associate with each argument, we used the 13 groups of arguments as described previously. For each argument described in the Data Appendix, we asked the participants to choose the type of concern they think is the most appropriate from the list presented in Table 2 (i.e., assign concerns to each argument that in their opinion arose or are addressed by the argument). The participants were restricted to assigning between 1 and 3 concerns per argument.
The concern assignment was later post-processed in order to reduce possible noise in the data. The concerns of a given argument are ordered based on the number of times they were selected by the participants. The threshold is set at half of the number of votes of the most popular concern and only concerns above this threshold were kept. For instance, if Employment is the most popular concern assigned to argument A and was voted 20 times, then only concerns that have been selected by strictly more than 10 participants are assigned to this argument. The processed concern assignment can be found in the Data Appendix.
For this step, we recruited at least 40 participants from the Prolific66 crowdsourcing platform for each group of arguments .77 The prescreening required their nationality to be British and age between 18 and 100. Only the participants who passed the prescreening were able to take part in the studies described here.
6.4.Preferences over concerns
After the set of types of concern had been created, the next step was to determine the preferences that the users of our system could have on these types. Preference elicitation and preference aggregation are research domains by themselves and it would take more than a paper to fully investigate them all in our context. Consequently, in this work, we decided to use a simple approach which was to ask the participants to provide a linear ordering over the types of concern.
It is interesting to note that the results show that on average, the “Education” and “Student Well-being” concerns were ranked respectively first and second and “Government Finances” was ranked last.
For this step, we used 110 participants from the Prolific crowdsourcing website.88 The prescreening required their nationality to be British and age between 18 and 100. In addition to the preference task, the participants were also asked a series of profiling questions, which will be discussed in more detail in the next subsection. The results can be found in the Data Appendix.
6.5.Creation of classification trees
The preferences of concerns may allow an APS to offer a more user-tailored experience: When the APS has a choice of arguments to present as its next move, choosing the argument with the more preferred concern may be advantageous. However, agents may differ in their preferences, and so we need to discover the preferences of the current user during a dialogue. This then creates certain challenges. A simple way to achieve it would be to query the user about all the concerns to determine their ranking. However, in practice, we do not want to ask the user too many questions as it is likely to increase the risk of them disengaging. Longer discussions also tend to be less effective [108]. Furthermore, it is normally not necessary to know about all of the preferences of the user. To address this, we can acquire comprehensive data on the preferences of a set of participants, and then use this data to train a classifier to predict the preferences for other participants. Thus, in this study we have created the classification trees using information that we had obtained about the users.
In addition to asking for the ranking of the concerns of the participants (as explained in the previous subsection), we asked them to take a personality test. We used the Ten-Item Personality Inventory (TIPI) [46] to assess the values on 5 features of personality based on the OCEAN model [77], one of the most famous model of the psychology literature. These features were “Openness to experience”, “Conscientiousness”, “Extroversion”, “Agreeableness” and “Neuroticism” (emotional instability). We also asked them to provide some demographic information and domain dependent information, such as age, sex, if they were a student in any higher institution, and the number of children they might have in general as well as in school or university.
Using all the above data, we learnt a decision tree for each pair of concerns using the Scikit-learn99 Python library. The purpose of each decision tree was to determine the ratio of preference (i.e., for each pair of concerns, the proportion who ranked the first concern higher than the second concern) on the concerns depending on the data about the individual. In other words, for such a decision tree, each leaf is a ratio of preference (i.e., the classification), and so the arcs on the branch to that leaf are for attributes that hold for the individual who is predicted to have that ratio.
As a first stage, we ran a meta-learning process in order to determine the best combination of tree depth and minimum number of samples at each leaf for each pair of types. The meta-learning process is the repeated application of the learning algorithm for different choices of these parameters (i.e., tree depth and minimum number if samples at each leaf) until the best combination of parameters is found. The criterion to minimize is the Hamming loss, i.e., the difference between the prediction and the actual preferred type.
We used cross-validation in the meta-learning to determine the best combination of tree depth and minimum number of datapoints at each leaf. Once the best parameters were found for each pair of types, we then ran the actual learning part using these parameters with all the datapoints concerning the personality and demographic information. We thus obtained one decision tree for each pair of types that was used by the automated persuasion system in the final study.
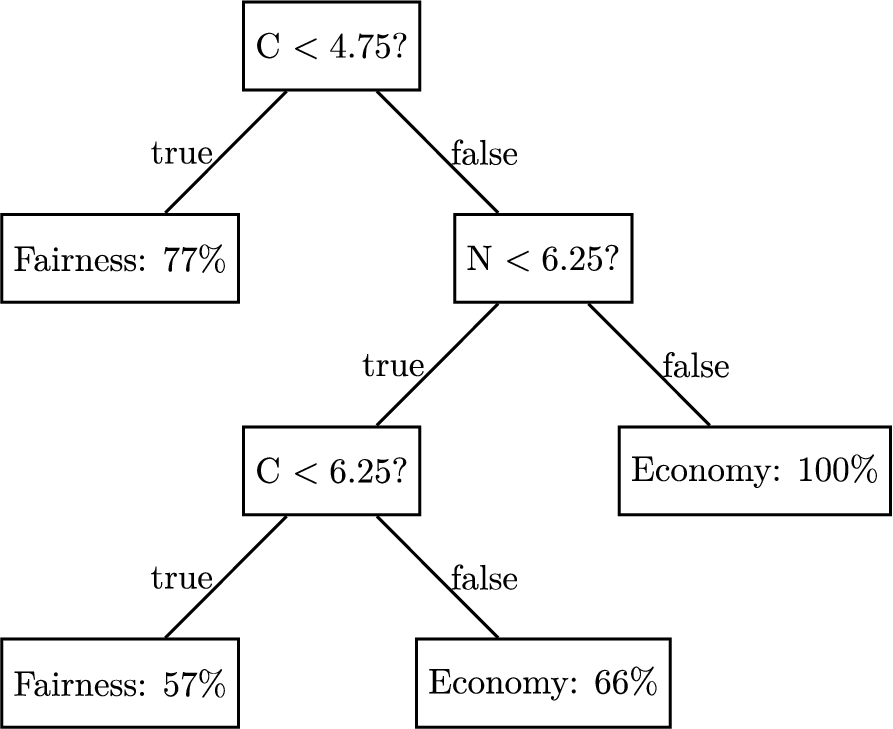
Figure 9 shows the example of the decision tree learnt for the Economy/Fairness pair of types where “C” (resp. “N”) stands for “Conscienciousness” (resp. “Neuroticism”) in the OCEAN model.
Fig. 9.
Example of a decision tree for the economy/fairness pair where “C” (resp. “N”) stands for “conscienciousness” (resp. “Neuroticism”) in the OCEAN model.
7.Experiments
We now describe the experiments we undertook to evaluate our approach to strategic argumentation for persuasion using the data and models explained in the previous parts of this paper.
7.1.Methods
In this section, we describe the implemented systems that we used for the experiments, and we describe the recruitment of participants.
7.1.1.Implementations used in the experiments
For the experiments, we implemented two versions of our automated persuasion system, and we deployed them with participants to measure their ability to change the belief of participants in a persuasion goal. We excluded the participants from data gathering studies from taking part in the persuasion experiments. The two versions followed the protocol described in Section 4.2, and were implemented as follows.
Baseline system | This was the baseline or control system, and it chose arguments at random from the ones attacking at least one of the arguments presented by the persuadee in the previous step. |
Advanced system | This was the system that made a strategic choice of move that maximizes the reward (see Section 5.1. It incorporates the Monte Carlo Tree Search algorithm as presented in Section 5.1.1 and uses the reward function as presented in Section 5.1.2. |
Each chatbot was composed of a front-end we coded in Javascript and a back-end in C
Fig. 10.
High level architecture of chatbot platform.
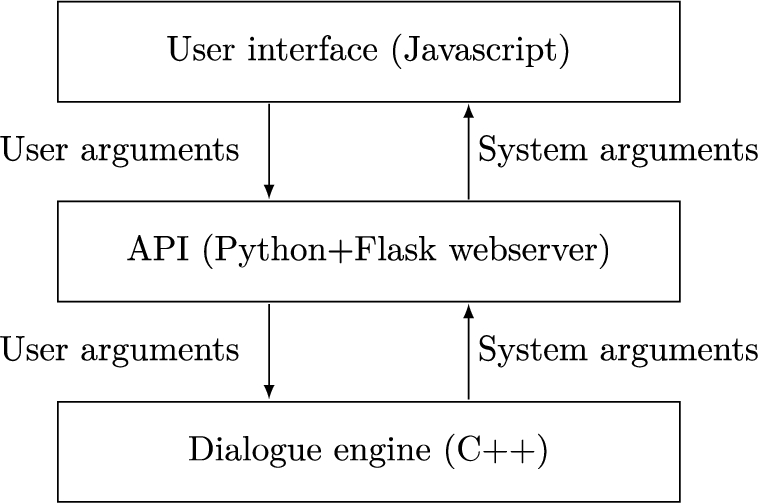
For the MCTS component of the advanced APS, we set the number of simulations to 1000 to balance out the trade-off between the completeness of exploration and the time waited by the participant. Indeed, the longer they wait, the less engaged they are, which causes deterioration in the quality of data. On average, the round trip from sending the counterarguments picked by the user to the back-end through the API, calculating the answer and back to the front-end for presentation (therefore including network time and client side execution) took between 0.5 and 5 seconds, depending on the number of counterarguments selected by the participant. We argue that these are acceptable times compared to traditional human to human chat experience.
7.1.2.Participants used in the experiments
In this study, we used 261 participants recruited from the Prolific crowdsourcing website, which later allowed us to have 126 participants for the advanced system and 119 for the baseline.1111 The prescreening required their first language to be English, nationality British, and age between 18 and 70. We used this upper limit on the age for the dialogue study because we wanted the participants to be, or to have children, in the age range for most students in higher education. This was so that they may feel more strongly on the topic.
At the start of each experiment, each participant was asked the same TIPI, demographic and domain dependant questions as in the ranking of concerns explained in Section 6.5. The full survey description and demographic statistics can be found in the Data Appendix.
After collecting the demographic and personality information, we asked the participants for their opinion on the following statement (using a slider bar ranging from −3 to 3 with 0.01 graduation). We note that the answer 0 (i.e. neither agree nor disagree) was not permitted – we requested the participants to express their preference, independently of how small it may be.
Are you against (slider to the left) or for (slider to the right) the abolishment of the £9K fees for universities, and to what degree?
Then we presented each participant with a chatbot (either the baseline system or the advanced system). After the end of the dialogue with the chatbot, the participant was again presented the statement about the abolition of the £9K student fee, and asked to express their belief using the slider bar. This way we obtain a value for the participant’s belief before and after the persuasion dialogue.
7.2.Results
From the dialogues we obtained from running the advanced system and the baseline system, we obtained a head-to-head comparison for both of the graphs we have considered (Section 7.2.2). This analysis corresponds to the two kinds of conditions we had in mind when designing the experiment. This general analysis is further supplemented by an explorative study of if and how certain structural properties of dialogues may have had an impact on the behaviour of the users. Appropriate vertical or horizontal lines are used in tables when reporting on these two kinds of results. We note that for not all different subtypes of dialogues sufficient samples have been obtained that would allow us to speak of the results with confidence. This is due to the fact that while we had control over whether users engaged with the advanced or baseline system, the graph that was chosen for the discussion or the nature of the dialogue that was created were essentially determined by the users themselves. All the dialogues are presented in the Data Appendix.
7.2.1.Structural analysis of dialogues
We start by considering the structure of the dialogues produced by our APSs. We focus on three dimensions: completeness, linearity and length.
By a complete dialogue we understand a dialogue such that all the leaves in the subgraph associated with the dialogue are of even depth in the original graph on which the dialogue was based, and no
By a linear dialogue we understand a dialogue such that the subgraph associated with it is simply a chain from the root to the leaf. In other words, at most one argument is used in every dialogue move. Distinguishing these kinds of dialogues is useful due to their simplicity. When faced with such dialogues, many of the well-known argumentation semantics “converge”, i.e. offer similar predictions as to whether an argument is accepted or rejected, what kind of rank it obtains, and so on. A tree-like structure is not necessarily sufficient for that when we consider ranking or gradual semantics, particularly those that aim to balance the strength and the number of the attackers of a given argument [1,3,17]. Linearity therefore removes the issue of how the impact of multiple attackers of a given argument should be approached in a fine-grained setting such as ours. It is also worth noting that branching dialogues are more complex and more demanding from the user, and thus more likely to promote disengagement. It is therefore interesting to consider dialogues that lessen this burden.
The effectiveness of a dialogue can be linked to its length, as seen in [108]. We will also therefore consider if and what kind of a relationship exists between the dialogue length and belief change in our study. For this purpose, we consider two kinds of lengths; one seen as the number of exchanges between the system and the user, and one seen as the number of arguments uttered during the dialogue. While for linear dialogues these two lengths are identical, they are different in situations where more than one argument is uttered in a given turn and branching occurs.
We also separate our analysis with respect to the graph that was used for the dialogue. We have the graph built in favour of keeping the university fees (used when the participant was in favour of their abolishment), and the dual abolishing graph (used when the participant was in favour of keeping the fees). While these graphs partially overlap, they are not the same and each one possesses arguments unique to it; the analysis needs to respect these differences.
Tables 3 and 4 show the distributions of dialogues structure of different types that were produced by the advanced and baseline systems.
Table 3
Analysis of the dialogues with the advanced system w.r.t. completeness, linearity, and used graph
| Complete | Linear | Keeping graph | # of dialogues | % of dialogues | |
| ✓ | ✓ | ✓ | 62 | 49.21% | |
| ✓ | ✓ | 23 | 18.25% | ||
| ✓ | ✓ | 14 | 11.11% | ||
| ✓ | ✓ | 10 | 7.94% | ||
| ✓ | 5 | 3.97% | |||
| ✓ | 5 | 3.97% | |||
| 5 | 3.97% | ||||
| ✓ | 2 | 1.59% | |||
| # of dialogues | 104 | 88 | 100 | 126 | |
| % of dialogues | 82.54% | 69.84% | 79.37% |
Table 4
Analysis of the dialogues with the baseline system w.r.t. completeness, linearity, and used graph
| Complete | Linear | Keeping graph | # of dialogues | % of dialogues | |
| ✓ | ✓ | ✓ | 54 | 45.38% | |
| ✓ | ✓ | 7 | 5.88% | ||
| ✓ | ✓ | 14 | 11.76% | ||
| ✓ | ✓ | 12 | 10.08% | ||
| ✓ | 2 | 1.68% | |||
| ✓ | 21 | 17.65% | |||
| 7 | 5.88% | ||||
| ✓ | 2 | 1.68% | |||
| # of dialogues | 77 | 82 | 94 | 119 | |
| % of dialogues | 64.71% | 68.91 % | 78.99% |
In the case of both APSs we therefore observe that the dialogues are more likely to be complete than incomplete, and linear rather than non-linear (i.e. branched). We also note that in both cases, the majority of the participants were in favour of abolishing the university fees, and therefore the graph in favour of keeping them was used for the dialogue – this is however something out of the control of the APS and merely reflects the views of the participant pool.
There are however some differences between the dialogues produced by the two systems. We first observe that while complete discussions are prevalent in both the advanced and the baseline system, there is still quite a difference as to their degree. Deeper analysis of the reasons for this variance in incompleteness (see Table 5) shows that the primary cause of this is associated with the baseline system being less likely to address all of the user’s arguments (i.e. the system is more likely to lead to odd-branched dialogues).
We believe this behaviour is simply a result of the design of the baseline system, where counterarguments are selected from the applicable ones at random. This behaviour might also contribute to the differences in the distributions of different kinds of dialogues produced by the APSs – while complete and linear dialogues are prevalent in both cases, there are differences further down. In particular, incomplete and nonlinear dialogues rank second for the baseline system, while complete and nonlinear dialogues rank second for the advanced system.
Table 5
Reasons for incompleteness of dialogues in the advanced and baseline systems
| Contains | Contains odd branch | Contains both | ||
| Advanced | as % of dialogues | 15.08% | 2.38% | 0.00% |
| as % of incomplete dialogues | 86.36% | 13.64% | 0.00% | |
| Baseline | as % of dialogues | 18.49% | 19.33% | 2.52% |
| as % of incomplete dialogues | 52.38% | 54.76% | 7.14% | |
An additional message to take out of this is that
Last, but not least, we look at the dialogue lengths. The boxplots depicting the results obtained from the advanced and baseline systems can all be found in the appendix. They appear to indicate that a relationship between dialogue lengths and belief change, if it exists, is highly likely to be non-monotonic. We have therefore decided to use Fisher’s exact test of independence to see if belief change and dialogue lengths are somehow linked. As visible in Table 6, independently of the system, length and dialogue type, all of the p-values we have obtained are greater than 0.05. We therefore fail to obtain a statistically significant association between the lengths of the dialogues that took place and the resulting belief changes.
Table 6
P-values of Fisher’s exact test of independence between belief change and dialogue lengths in discussions carried out by the baseline and the advanced systems. We distinguish two dialogue lengths, one understood as the number of turns that took place and one as the number of arguments exchanged. For the purpose of this analysis, belief change values have been discretized into the following intervals:
| Advanced system | Baseline system | |||
| Dialogue type | # of turns | # of arguments | # of turns | # of arguments |
| All | 0.594 | 0.8476 | 0.559 | 0.6285 |
| Keeping Graph | 0.09652 | 0.9068 | 1 | 0.6724 |
| Abolishing Graph | 1 | 0.5292 | 0.09 | 0.4833 |
| Complete | 1 | 0.7257 | 0.238 | 0.1243 |
| Incomplete | 0.7143 | 0.8052 | 1 | 1 |
| Linear | 0.3447 | 1 | 0.6186 | 0.435 |
| Nonlinear | 0.4211 | 1 | 1 | 0.7357 |
7.2.2.Comparing the system and the baseline
A natural next step is to compare the performance of the advanced and baseline systems, by which we understand the belief changes they lead to.
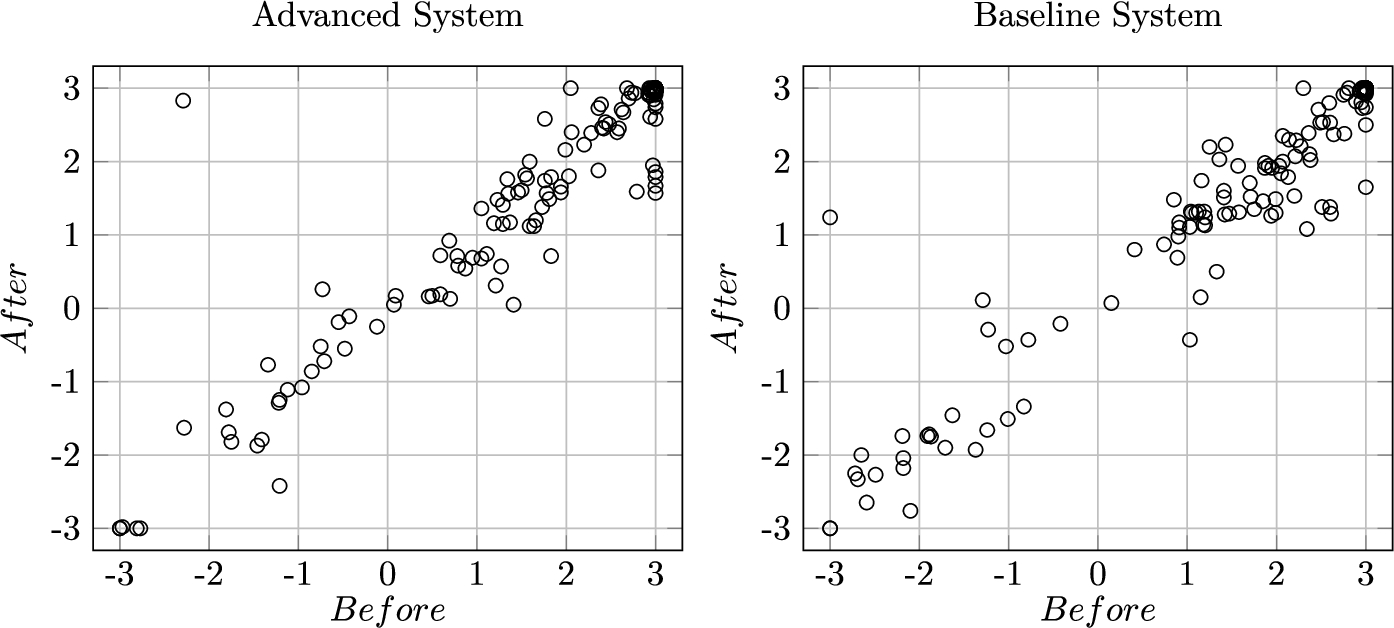
The scatter plots for the before-after beliefs in persuasion goal for each of our APSs are visible in Fig. 11. Please note that a “perfect” system, managing to convince the participant to radically change their stance on the persuasion goal, would be one producing an “after” belief of 3 for any participant with a negative “before” belief, and an “after” belief of −3 for any participant with a positive “before” belief (i.e. the perfect scatter plot would not be diagonal).
Fig. 11.
Scatter plots of the before and after beliefs for participants that entered a dialogue with the advanced or with the baseline system.
We supplement the scatterplots with additional statistical analysis of the belief change. We can observe that the distributions of beliefs before the dialogues in the advanced and baseline systems are not statistically different, meaning that the two populations are not dissimilar belief-wise for the two systems. The same holds for the distributions of beliefs after the dialogues have taken place, independently of the subdistribution chosen according to a particular structural condition (assuming the sample was large enough to carry out the tests). We also note that the before and after belief distributions per system are also not dissimilar. We highlight this result speaks only about the distributions, not the effects of the dialogues with the system. Wilcoxon rank-sum test has been used for establishing these results, and detailed statistics can be found in the appendix at the end of this paper in Tables 11 and 12.
However, the effects that these systems had on the users are not the same, as visible in Table 7. We have used Shapiro–Wilk test in order to determine whether the “before” beliefs of the participants were normally distributed. If the answer was positive, student t-test was used to determine if the changes in beliefs were significant or not; if the answer was negative, Wilcoxon signed-rank test was used.1212
We observe that for the baseline system, independently of the considered subclass of dialogues, the changes in beliefs were either not significant or significance could not have been determined. In turn, the advanced system led to statistically significant changes in beliefs in most cases where significance could have been determined.
Table 7
Results of analysis of statistical significance of belief changes caused by the APSs on different types of dialogues. Shapiro–Wilk test was used to determine whether the “before” beliefs were normally distributed. If they were, t-test was used to determine significance of belief changes; otherwise, Wilcoxon signed-rank test was used. By “−” we understand that due to the nature of the data, exact p-value could not have been computed, and we make no claims about the significance. Further details can be found on Table 13
| Advanced system | Baseline system | |||
| Dialogue type | Normality | Significance | Normality | Significance |
| All | x | ✓ | x | x |
| Keeping Graph | x | ✓ | x | x |
| Abolishing Graph | ✓ | x | ✓ | x |
| Complete | x | ✓ | x | x |
| Incomplete | x | – | x | – |
| Linear | x | ✓ | x | x |
| Nonlinear | x | – | x | – |
Despite these positive results, the actual differences in belief changes between the two systems are rather modest when we look at the numbers. Table 8 shows the average changes in beliefs between the two system. We distinguish between the normal average, which simply takes the mean of all differences in beliefs (which can be negative or positive depending on the persuasion goal), and the absolute average, which ignores whether the change is negative or positive and focuses on the value only. Additionally, in Tables 9 and 10 we include the percentage distribution of the changes.
Table 8
Average changes in beliefs in dialogues with the advanced and baseline systems. A change in beliefs can be negative or positive depending on the persuasion goal. Average changes takes the average of all the obtained differences; absolute average ignores whether the change is negative or positive and focuses on the value. Results are rounded to the third decimal place
| Advanced system | Baseline system | |||
| Dialogue Type | Average change | Average absolute change | Average change | Average absolute change |
| All | 0.162 | 0.308 | 0.139 | 0.321 |
| Keeping Graph | 0.146 | 0.271 | 0.094 | 0.264 |
| Abolishing Graph | 0.224 | 0.451 | 0.309 | 0.536 |
| Complete | 0.165 | 0.313 | 0.203 | 0.361 |
| Incomplete | 0.152 | 0.285 | 0.022 | 0.248 |
| Linear | 0.216 | 0.348 | 0.148 | 0.342 |
| Nonlinear | 0.038 | 0.217 | 0.119 | 0.273 |
Table 9
Belief change analysis of the dialogues with the advanced system. The results are rounded to two decimal places. Second row shows the interval to which a belief change value should belong to be interpreted as very positive (
| + | x | − | ||||
| Population % | 0 | |||||
| All | 100% | 7.14% | 44.44% | 7.14% | 40.48% | 0.79% |
| Keeping Graph | 79.37% | 8% | 47% | 7% | 38% | 0% |
| Abolishing Graph | 20.63% | 3.85% | 34.62% | 7.69% | 50% | 3.85% |
| Complete | 82.54% | 5.77% | 50% | 6.73% | 36.54% | 0.96% |
| Incomplete | 17.46% | 13.64% | 18.18% | 9.09% | 59.09% | 0% |
| Linear | 69.84% | 9.09% | 44.32% | 6.82% | 39.77% | 0% |
| Nonlinear | 30.16% | 2.63% | 44.74% | 7.89% | 42.11% | 2.63% |
Table 10
Belief change analysis of the dialogues with the baseline system. The results are rounded to two decimal places. Second row shows the interval to which a belief change value should belong to be interpreted as very positive (
| + | x | − | ||||
| Population % | 0 | |||||
| All | 100% | 7.56% | 41.18% | 14.29% | 36.97% | 0% |
| Keeping Graph | 78.99% | 7.45% | 37.23% | 14.89% | 40.43% | 0% |
| Abolishing Graph | 21.01% | 8% | 56% | 12% | 24% | 0% |
| Complete | 64.71% | 10.39% | 38.96% | 14.29% | 36.36% | 0% |
| Incomplete | 35.29% | 2.38% | 45.24% | 14.29% | 38.10% | 0% |
| Linear | 68.91% | 7.32% | 41.46% | 10.98% | 40.24% | 0% |
| Nonlinear | 31.09% | 8.11% | 40.54% | 21.62% | 29.73% | 0% |
An important thing to notice here is the behaviour of the participants in the complete dialogues. The arguments uttered by the APS in these scenarios correspond to the grounded/preferred/stable extensions of the graphs associated with the dialogues. Predictions using classical Dung semantics would put both of our APS in a strongly winning position, while we would argue that it is not the case here.
Despite these properties of the complete dialogues, we achieve no statistical significance of the changes in beliefs for the baseline system (see Table 7). This important threshold is only passed by the advanced system, which, in contrast to the baseline APS, attempts to tailor the dialogue to the profile of the user. This indicates that relying only on the structure of the graph for selecting arguments in dialogues is insufficient. Presenting just any counterargument to a participant’s argument turned out to be ineffective in the context of this experiment. In contrast, including beliefs and concerns as factors in the selection of the counterarguments, proved to have statistically significant effects.
Nevertheless, we still need to acknowledge that in pure numbers, the results are modest. The average changes in beliefs require improvement. While 55.77% of the users that engaged with the advanced system did experience positive changes, this still leaves a significant proportion of participants that were affected negatively or not affected at all. Thus, there is the need for increasing both the number of participants experiencing positive changes, as well as the degree of these changes.
We therefore believe that further research in this direction needs to be undertaken. The results require improvement and/or replication; there may also exist other additional factors, besides their beliefs and concerns, that would allow for dialogues to be better tailored for participants.
7.3.Conclusions
In general, the changes in beliefs (good direction, bad direction, etc) are quite similar between the baseline and advanced systems. The averages are also relatively close. Yet, only in the advanced system, do we get a statistically significant change in users’ beliefs. Even if we focus on the simpler dialogues (i.e. those that are complete, which are all dialogues that a classical argumentation system would create), the results are similar. Yet again, only the advanced system is significant. So the results suggest that the advanced system is better at changing belief more in favour of the persuasion goal than the baseline system.
Our claim at the start of this study was that a dialogue needs to be tailored to the user, otherwise it is less effective than it could be. Lack of significance in the baseline system supports that, as no tailoring was taking place. The advanced system was doing some tailoring, and we obtain significance. Nevertheless, the end gain is not as marked as we might hope for. We get a little less than 5% population increase in positive changes, and over 1% increase in negative changes. Despite this, we need to remember that it is widely acknowledged that convincing anyone of anything (when they are allowed to have their own opinions, as opposed to a logical reasoning exercise), is a difficult task. So developing a system that is going to persuade the majority of participants on a real and controversial topic such as university fees is not very likely. Therefore, even these small improvements of the advanced system over the baseline system are valuable, and indicate that further research into dialogue tailoring approaches is promising.
Throughout the paper we have been clarifying what assumptions we have made about the systems and methods used in the experiments. Therefore, in the remainder of this subsection, we collate and discuss these assumptions, and how they impact the conclusions we can draw from the experiments.
The argument graphs were edited by the research team. While the arguments and attacks between them were not tested with participants, it has been shown that group deliberation approach improves performance in argumentation tasks [27]. Nevertheless, we acknowledge that with natural arguments, there is a degree of subjectivity in whether one argument attacks another. Moreover, both systems use the overlapping graphs, and so the effect is to some degree the same for both systems.
We acknowledge that there are certain restrictions in how the system can react to the user. We assume that each dialogue is started by the system, and that the system is required to respond to the first move by the user. Without this, there would not be meaningful engagement by the user, and no opportunity for belief change. Additionally, when there are more than 2 active dialogue lines, the number of arguments can be quite large. This can further lead to the users being overwhelmed and disengage; we have therefore limited the amount of information presented to the user at any given time. We made an exception for the reply to the user’s first move because the user is more likely to understand and appreciate the system’s response to each of the user’s arguments. It would be desirable to investigate alternative definitions in future work.
In order to model how propagating the update of beliefs may be influenced by proximity of the original update to the other arguments, we used a dampening factor (as suggested in [17]) which causes the effect of an attacker to decrease as the length of the chain of arguments increases. Given that the existing theoretical proposals for such approaches follow design patterns that are highly undesirable in our setting (please see Section 5.1.2), the strategic system uses a different method that is more suited for epistemic probabilities. Nonetheless, we acknowledge that none of the existing dampening factor proposals have been empirically verified. It would be desirable to consider this in future work, and equip the strategic system with alternative approaches.
We note that even though we use both beliefs and concerns in our strategic system, there are certain differences in how they are treated. The concerns that are associated with each argument have been determined during the pre-dialogue experiments, and we do not ask users for this information in studies that require engaging with our APSs. In a similar fashion, the preferences that each user can have over these concerns are predicted from data obtained using another pre-dialogue experiment, and not directly obtained from each APS user. The purpose of this was to lower the risk of exhausting the users and causing them to disengage. Nevertheless, we acknowledge that we did not check for this domain whether the inferred preference is used by the participants when moving an argument. We have done this check in other domains (commuting by bicycle [52] and improving health by doing more sport [32]), and so we felt it was reasonable to extrapolate from those studies for the purposes of setting up this study. Finally, in the user model, there was the assumption that the preferences over concerns are static throughout the dialogue. The dialogues were relatively short and did not contain any arguments aimed at changing the concerns of a given user, thus allowing us to assume that the concerns have remained static. We leave it to future work to consider how we could incorporate changing of concerns.
In contrast to the above, the beliefs the users have in arguments have been assumed to be dynamic. Furthermore, the belief in the persuasion goal of each dialogue was directly obtained from the user prior to and after the discussion has concluded. Nevertheless, the beliefs in the remaining arguments are computed using beta distributions obtained from pre-dialogue experiments, and not obtained directly. It would be possible to personalize the beliefs of a participant further; however, asking the users for their fine-grained beliefs at each stage runs the risk of the users being overwhelemed and disengage, while more advanced methods (see for example, modelling sub-populations using beta distributions [51]) would increase the computational complexity of the system and the waiting time between responses. We therefore leave further investigations of these alternatives to future work.
In the experiments, we only compared a baseline system with a strategic system that was based on beliefs and concerns. However, to better understand the proposal, it would be desirable to undertake trials with a strategic system that just uses beliefs and a strategic systems that just uses concerns.
8.Literature review
Since the original proposals for formalizing dialogical argumentation [47,74], a number of proposals have been made for various kinds of protocol (e.g., [7,8,35,37,55,78–81,90,91]). More recently, interest has been focused on strategies. In the following, we review some of the key work on strategies. We also refer to [106] for a review of strategies in multi-agent argumentation.
Some strategies have focussed on correctness with respect to argumentation undertaken directly with the knowledge base, in other words, whether the argument graph constructed from the knowledge base yields the same acceptable arguments as those from the dialogue (e.g., [22,39]). Strategies in argumentation have been analysed using game theory (e.g., [95,96], [40]), but these are more concerned with issues of mechanism design, rather than persuasion. In these papers, the game is a one step process rather than a dialogue, and they are concerned with manipulation rather than persuasion.
In [15], a planning system is used by the persuader to optimize choice of arguments based on belief in premises, and in [16], an automated planning approach is used for persuasion that accounts for the uncertainty of the proponent’s model of the opponent by finding strategies that have a certain probability of guaranteed success no matter which arguments the opponent chooses to assert. Alternatively, heuristic techniques can be used to search the space of possible dialogues [75]. Persuasion strategies can also be based on convincing participants according to what arguments they accept given their view of the structure of an argument graph [76]. As well as trying to maximize the chances that a dialogue is won according to some dialectical criterion, a strategy can aim to minimize the number of moves made [2]. The application of machine learning is another promising approach to developing more sophisticated strategies such as the use of reinforcement learning [5,11,54,71,73,92,94,98] and transfer learning [93].
There are some proposals for strategies using probability theory to, for instance, select a move based on what an agent believes the other is aware of [101], or, to approximately predict the argument an opponent might put forward based on data about the moves made by the opponent in previous dialogues [60]. Using the constellations approach to probabilistic argumentation, a decision-theoretic lottery can be constructed for each possible move [62]. Other works represent the problem as a probabilistic finite state machine with a restricted protocol [65], and generalize it to POMDPs when there is uncertainty on the internal state of the opponent [48]. POMDPs are in a sense more powerful than the MCTS that we advocate in our proposal. However, as discussed in [48], there is a challenge in managing the state explosion in POMDPs that arises from modelling opponents in argumentation.
A novel feature of the protocol in this study is that it allows a form of incompleteness in that not every user argument has to be countered for the dialogue to continue. The protocol ensures that for each user argument presented at each step of the dialogue, if the system has a counterargument to it that has not been presented in the dialogue so far, then it will present a counterargument to that user argument. However, if the system does not have a counterargument for a user argument, but it does have a counterargument for another user argument played at that step of the dialogue, then the dialogue can still continue. The aim of this tolerance to incompleteness is to reflect how real-life discussions do not necessitate every argument to be countered. This means that discussions can usefully continue, and they are not sensitive to a participant be able to counter every possible argument from the other participants. So our protocol is in contrast to protocols in other approaches to computational argumentation where the aim is for each participant to counter all the arguments by the other agent.
In our previous work [52], we developed an APS that selects arguments based on the concerns of the participant in the current dialogue. For this, we assumed that we have a set of arguments, and that each argument is labelled with the type(s) of concern it has an impact on. Furthermore, the system had a model of the user in the form of a preference relation over the types of concern. We did not assume any structure for the preference relation. In particular, we did not assume it is transitive. For each user argument A that the system wishes to attack with a counterargument, the set of attackers (the set of candidates) is identified (i.e., the set of arguments B such that
Conceptually, concerns can be seen as related to value-based argumentation. This approach takes the values of the audience into account, where a value is typically seen as moral or ethical principle that is promoted by an argument. It can also be used to capture the general goals of an agent, as discussed in [9]. A value-based argumentation framework (VAF) extends an abstract argumentation framework by assigning a value to each argument, and for each type of audience, a preference relation over values. This preference relation which can then be used to give a preference ordering over arguments [9,10,12–14]. The preference ordering is used to ignore an attack relationship when the attackee is more preferred than the attacker, for that member of the audience. This means the extensions obtained can vary according to who the audience is. VAFs have been used in a dialogical setting to make strategic choices of move [19]. So theoretically, VAFs could take concerns into account, but they would be unable to model beliefs.There is also no decision-theoretic framework for this, nor is there an empirical evaluation of VAFs.
More recently, the use of values has been proposed for labelling arguments that have been obtained by crowdsourcing. Here a value is a category of motivation that is important in the life of the agent (e.g., family, comfort, wealth, etc.), and a value assignment to an argument is a category of motivation for an agent if she were to posit this argument. It was shown with participants that different people tend to apply the same (or similar) values to the same argument [31], and chatbot that used concerns to choose arguments to present in a dialogue was shown to be more persuasive than a baseline system [29]. This provides additional evidence that the use of concerns is meaningful and practical, thus further supporting our methodology.
The notion of interests as arising in negotiation is also related to concerns. In psychological studies of negotiation, it has been shown that it is advantageous for a participant to determine which goals of the other participants are fixed and which are flexible [41]. In [100], this idea was developed into an argument-based approach to negotiation where meta-information about each agent’s underlying goals can help improve the negotiation process. Argumentation has been used in another approach to co-operative problem solving where intentions are exchanged between agents as part of dialogue involving both persuasion and negotiation [37]. Even though the notions of interests and intentions are used in a different way to the way we use the notion of concerns in this paper, it would be worthwhile investigating the relationship between these concepts in future work.
The empirical approach taken in this paper is part of a trend in the field of computational argumentation for studies with participants (for a review see [26]). This includes studies that evaluate the accuracy of dialectical semantics of abstract argumentation for predicting behaviour of participants in evaluating arguments [36,97], studies comparing a confrontational approach to argumentation with argumentation based on appeal to friends, appeal to group, or appeal to fun [110,111], studies of appropriateness of probabilistic argumentation for modelling aspects of human argumentation [86], studies to investigate physiological responses of argumentation [109], studies using reinforcement learning for persuasion [54], and studies of the use of predictive models of an opponent in argumentation to make strategic choices of move by the proponent [93]. There have also been studies in psycholinguistics to investigate the effect of argumentation style on persuasiveness [72].
There have already been some promising studies that indicate the potential of using automated dialogues in behaviour change such as using dialogue games for health promotion [28,42,44,45], conversational agents for encouraging exercise [25,82] and for promoting plant-based diets [113], dialogue management for persuasion [6], persuasion techniques for healthy eating messages [107], and tailored assistive living systems for encouraging exercise [43]. However, none of these studies have provided a framework for strategic argumentation, in contrast to the proposal we present in this paper.
9.Discussion
In this paper, we have presented a framework for user modelling that incorporates the beliefs and concerns of persuadees, as well as introduced a framework for optimizing the choice of moves in dialogical argumentation by taking into account these user models. We have shown how we can crowdsource the data required for constructing the user models, and that this can be used by APSs to make strategic choices of move that outperform a baseline system over a population of participants.
This study therefore indicates the value of taking the beliefs and concerns of agents into account. Furthermore, it indicates the viability and utility of undertaking real-time decisions on moves to make based on the Monte Carlo Tree Search algorithm. The way we have harnessed this algorithm is quite general, and alternative options for the reward function could be deployed. For instance, the belief component of the reward function could be replaced by different methods of modelling belief updates (e.g. [57,68]), or even having a richer modelling of user beliefs and updating of them (e.g. [58,59]). One can also consider different concern scoring approaches, where rather than using preferences, we can focus on how the concerns associated with the played arguments are matched between the system and user moves or investigate different quantity-quality balancing. Finally, the way these two score values are aggregated can also be modified. In future work, we will investigate some of the options to get a more comprehensive understanding of the effectiveness and behaviour of different reward functions.
In the user model, there was the assumption that the preferences over concerns are static throughout the dialogue. The dialogues were relatively short and did not contain any arguments aimed at changing the concerns of a given user, thus allowing us to assume that the concerns have remained static. Dynamic concerns is a very interesting topic. It raises questions about what kinds of move could possibly change a users preferences over concerns, and how we could model this. Investigating this would complicate how we would undertake globally optimal decisions over moves, and it would require a different study design for the experiments with participants.
Another topic for future work is the specification of the protocol. Many protocols for dialogical argumentation involve a depth-first approach (e.g., [19]). So when one agent presents an argument, the other agent may provide a counterargument, and then the first agent may provide a counter-counterargument. In this way, a depth-first search of the argument graph is undertaken. With the aim of having more natural dialogues, we used a breadth-first approach. So when a user selects arguments from the menu, the system then may attack more than one of the arguments selected. For the argument graph we used in our study, this appeared to work well. However, for larger argument graphs, a breadth-first approach could also be unnatural. This then raises the questions of how to specify a protocol that interleaves depth-first and breadth-first approaches, and of how to undertake studies with participants to evaluate such protocols. Other possibilities for improving the naturalness of the dialogue by considering chains of arguments [99].
The aim of our dialogues in this paper is to raise the belief in goal arguments. A goal argument may, among other things, incorporate an intention to change behaviour, though we accept that there is a difference between have a intention to do something, and actually doing it. Nonetheless, having an intention to change behaviour is a valuable step to make towards actually changing behaviour. We focus on the beliefs in arguments because belief is an important aspect of the persuasiveness of an argument (see for example [56]). Furthermore, beliefs can be measured more easily than intentions in crowdsourced surveys. In future work, we would like to investigate to what extent an increased belief in the persuasion translates to actual changes in behaviour. This would be interesting to investigate in healthcare applications, such as persuading participants to undertake regular exercise or reduce alcohol intake.
We also need to investigate new ways of asking for the beliefs in the arguments. Currently, we do it through a direct question. Unfortunately, this method is vulnerable to participants who misunderstand the instructions, select values carelessly or lie on purpose. Therefore, we need to create a new, indirect way, of asking for the belief. A possible approach is to develop several simpler, indicative questions (e.g. using the Yes/No format instead of real values) such that their answers can be compiled into a numerical value for the belief.
Notes
1 Please note that displaying the listing does not count as a dialogue move in this approach. It is merely a way to facilitate the user move.
2 When there are more than 2 active dialogue lines, the number of arguments can be quite large. So we limited the amount of information presented to the user so that it was not overwhelming. We made an exception for the reply to the users first move because the user is more likely to understand and appreciate the system’s response to each of the user’s arguments. This limit and the exception for the first move are assumptions and alternative assumptions could be investigated.
3 The Data Appendix containing the arguments, argument graphs, assignment of concerns to arguments, preferences over concerns, and assignment of beliefs to arguments, is available at the link http://www0.cs.ucl.ac.uk/staff/a.hunter/papers/unistudydata.zip.
5 Please note that the total number of participants was greater, but many of the submissions were rejected due to failed attention checks, which are a standard tool for rejecting dishonest participants.
7 Please note that the total number of participants was greater, but many of the submissions were rejected due to failed attention checks. Due to minor platform issues, certain arguments received between 41 and 43 responses rather than 40.
8 Similarly as in the previous tasks, we used an attention checks to discard dishonest submissions.
10 The code is available at https://github.com/ComputationalPersuasion/MCCP.
11 Some of the submissions had to be filtered out due to technical issues.
12 All calculations have been carried out in R, detailed statistics can be found in the appendix at the end of this paper.
Appendices
Appendix
Fig. 12.
Boxplots concerning the number of arguments exchanged/dialogue turns and the belief change in dialogues conducted by the systems.
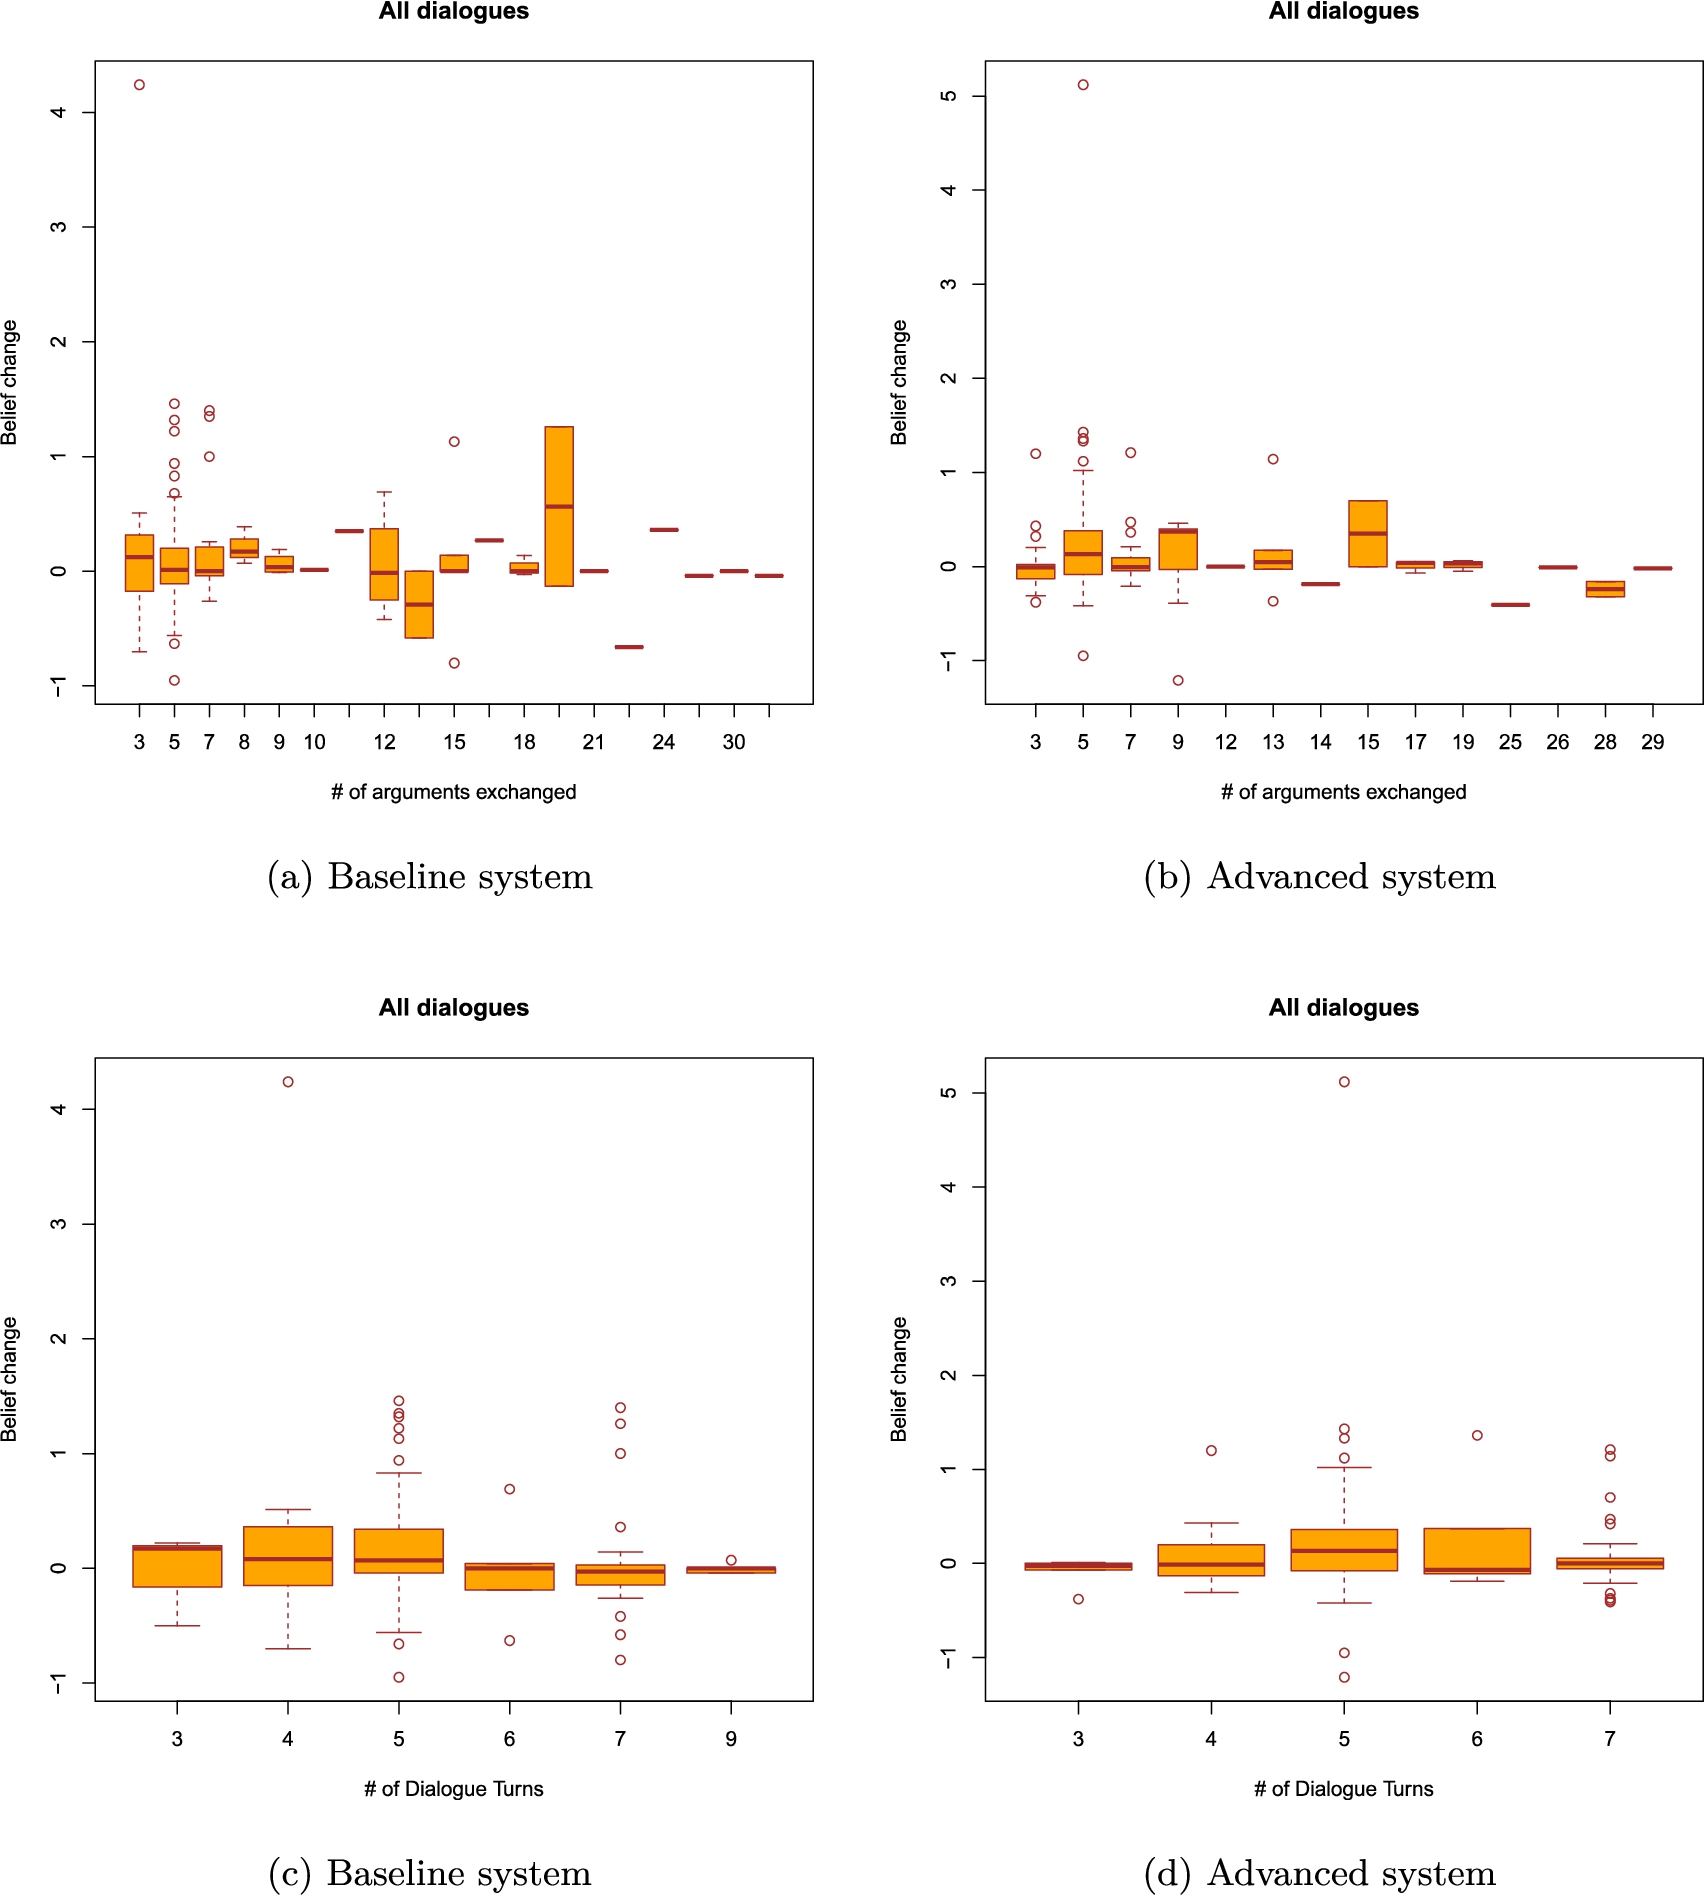
Fig. 13.
Boxplots concerning the number of arguments exchanged and the belief change in dialogues conducted by the baseline system.
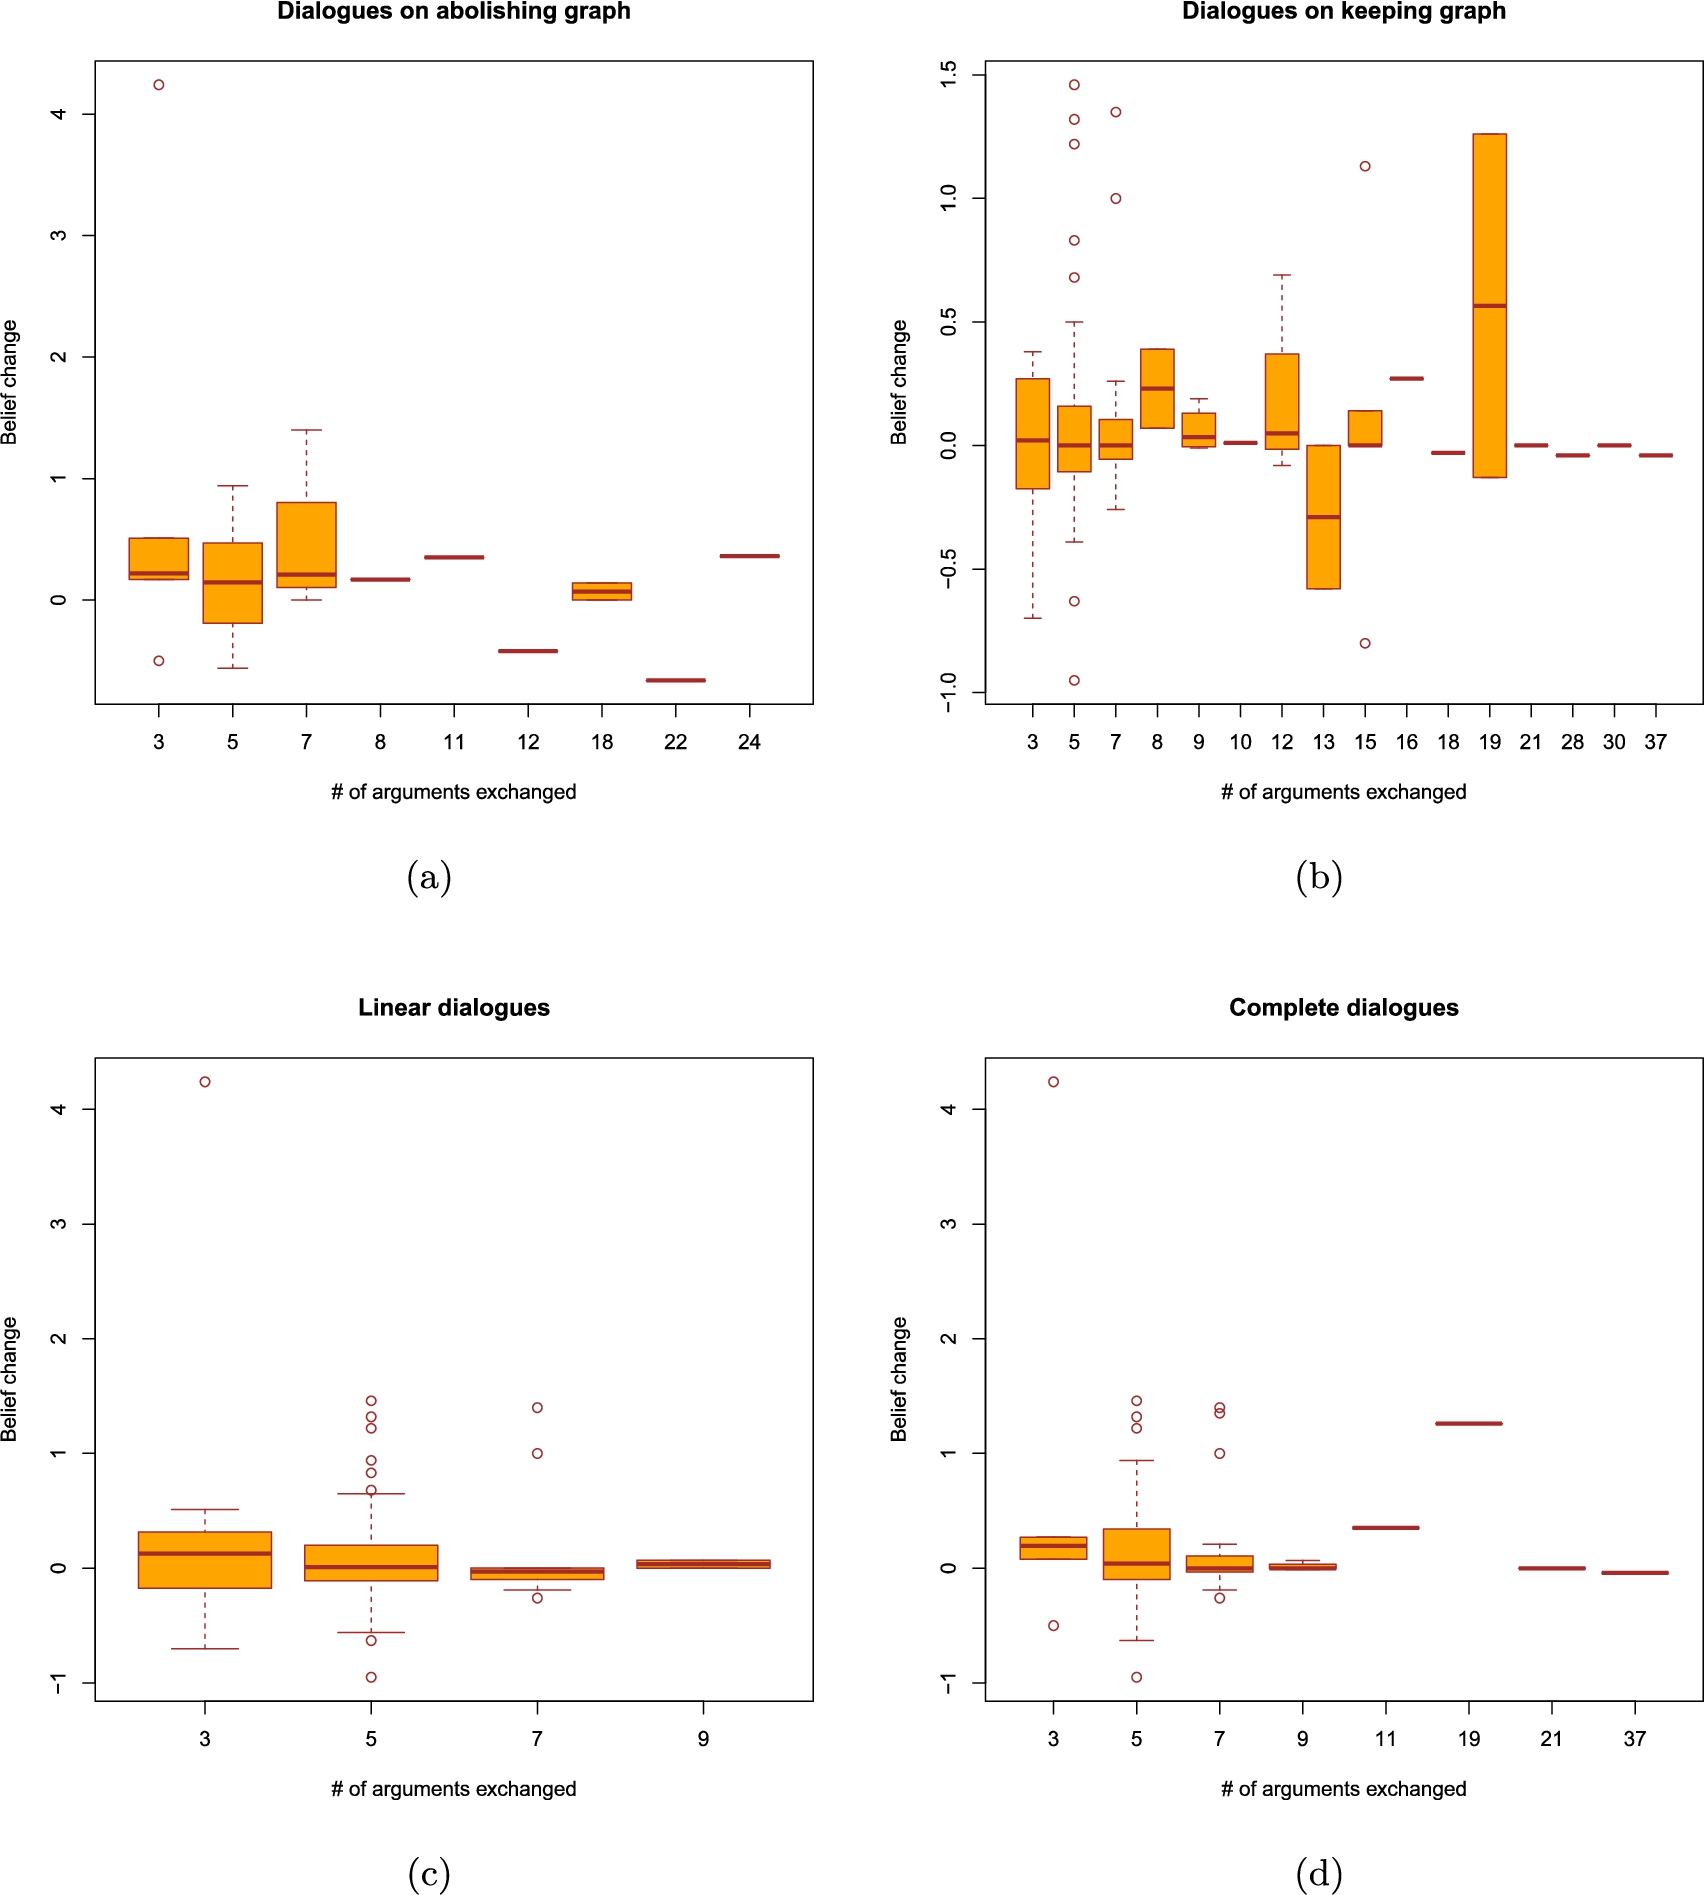
Fig. 14.
Boxplots concerning the number of arguments exchanged and the belief change in dialogues conducted by the advanced system.
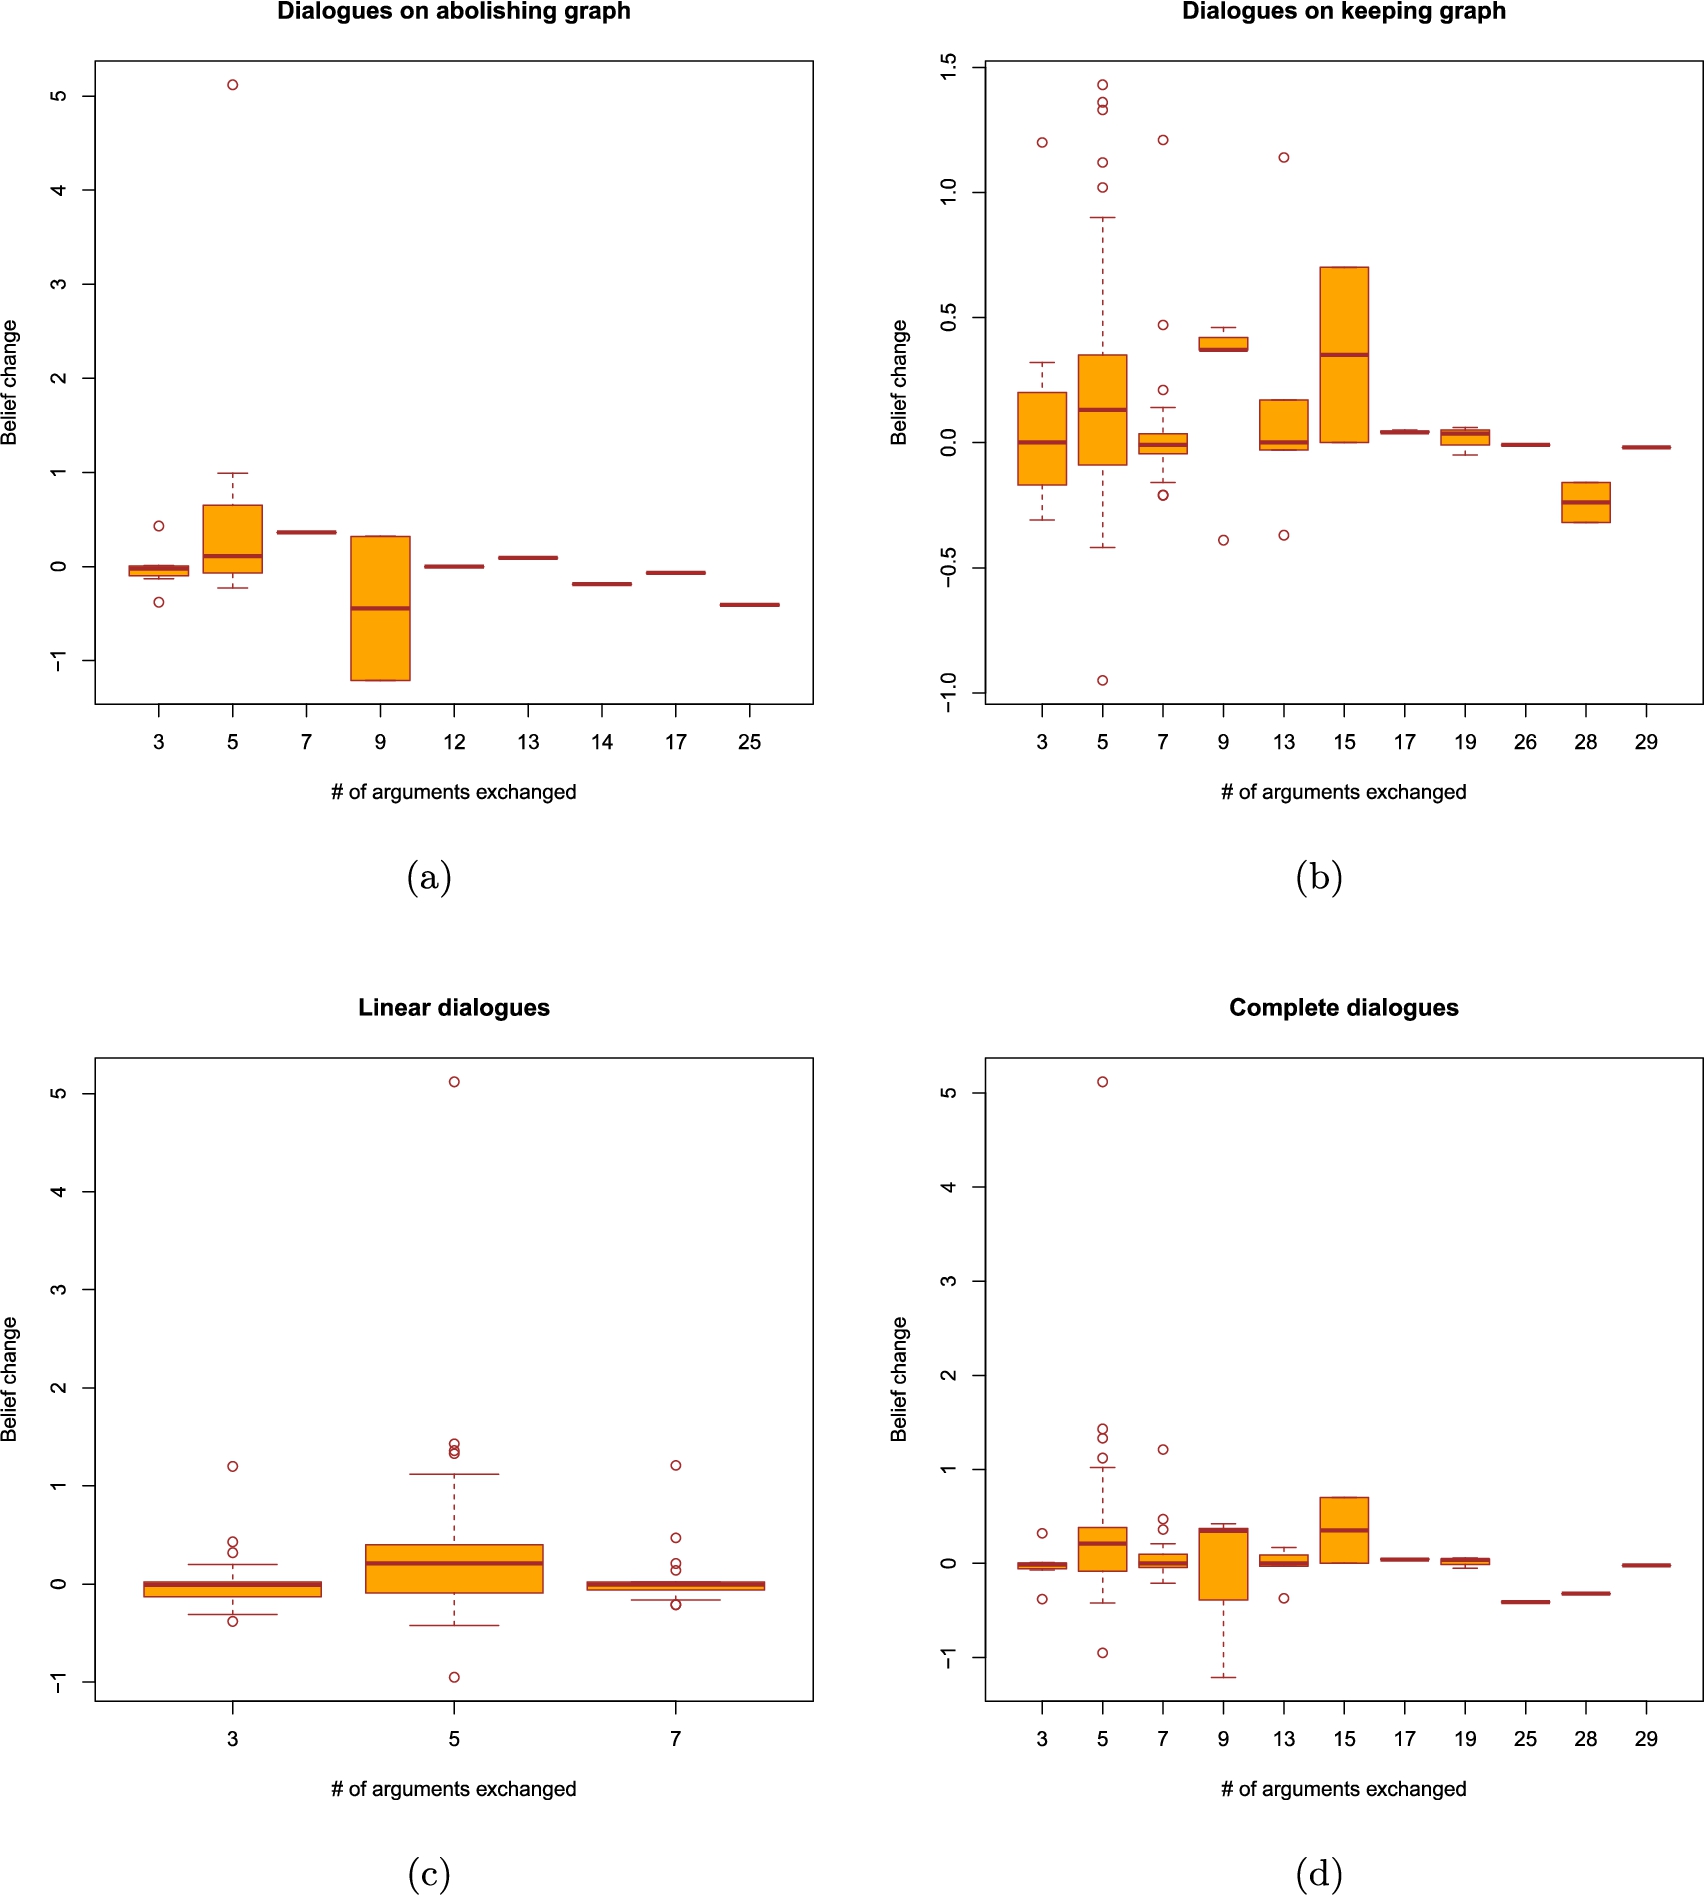
Fig. 15.
Boxplots concerning the number of dialogue turns and the belief change in dialogues conducted by the baseline system.
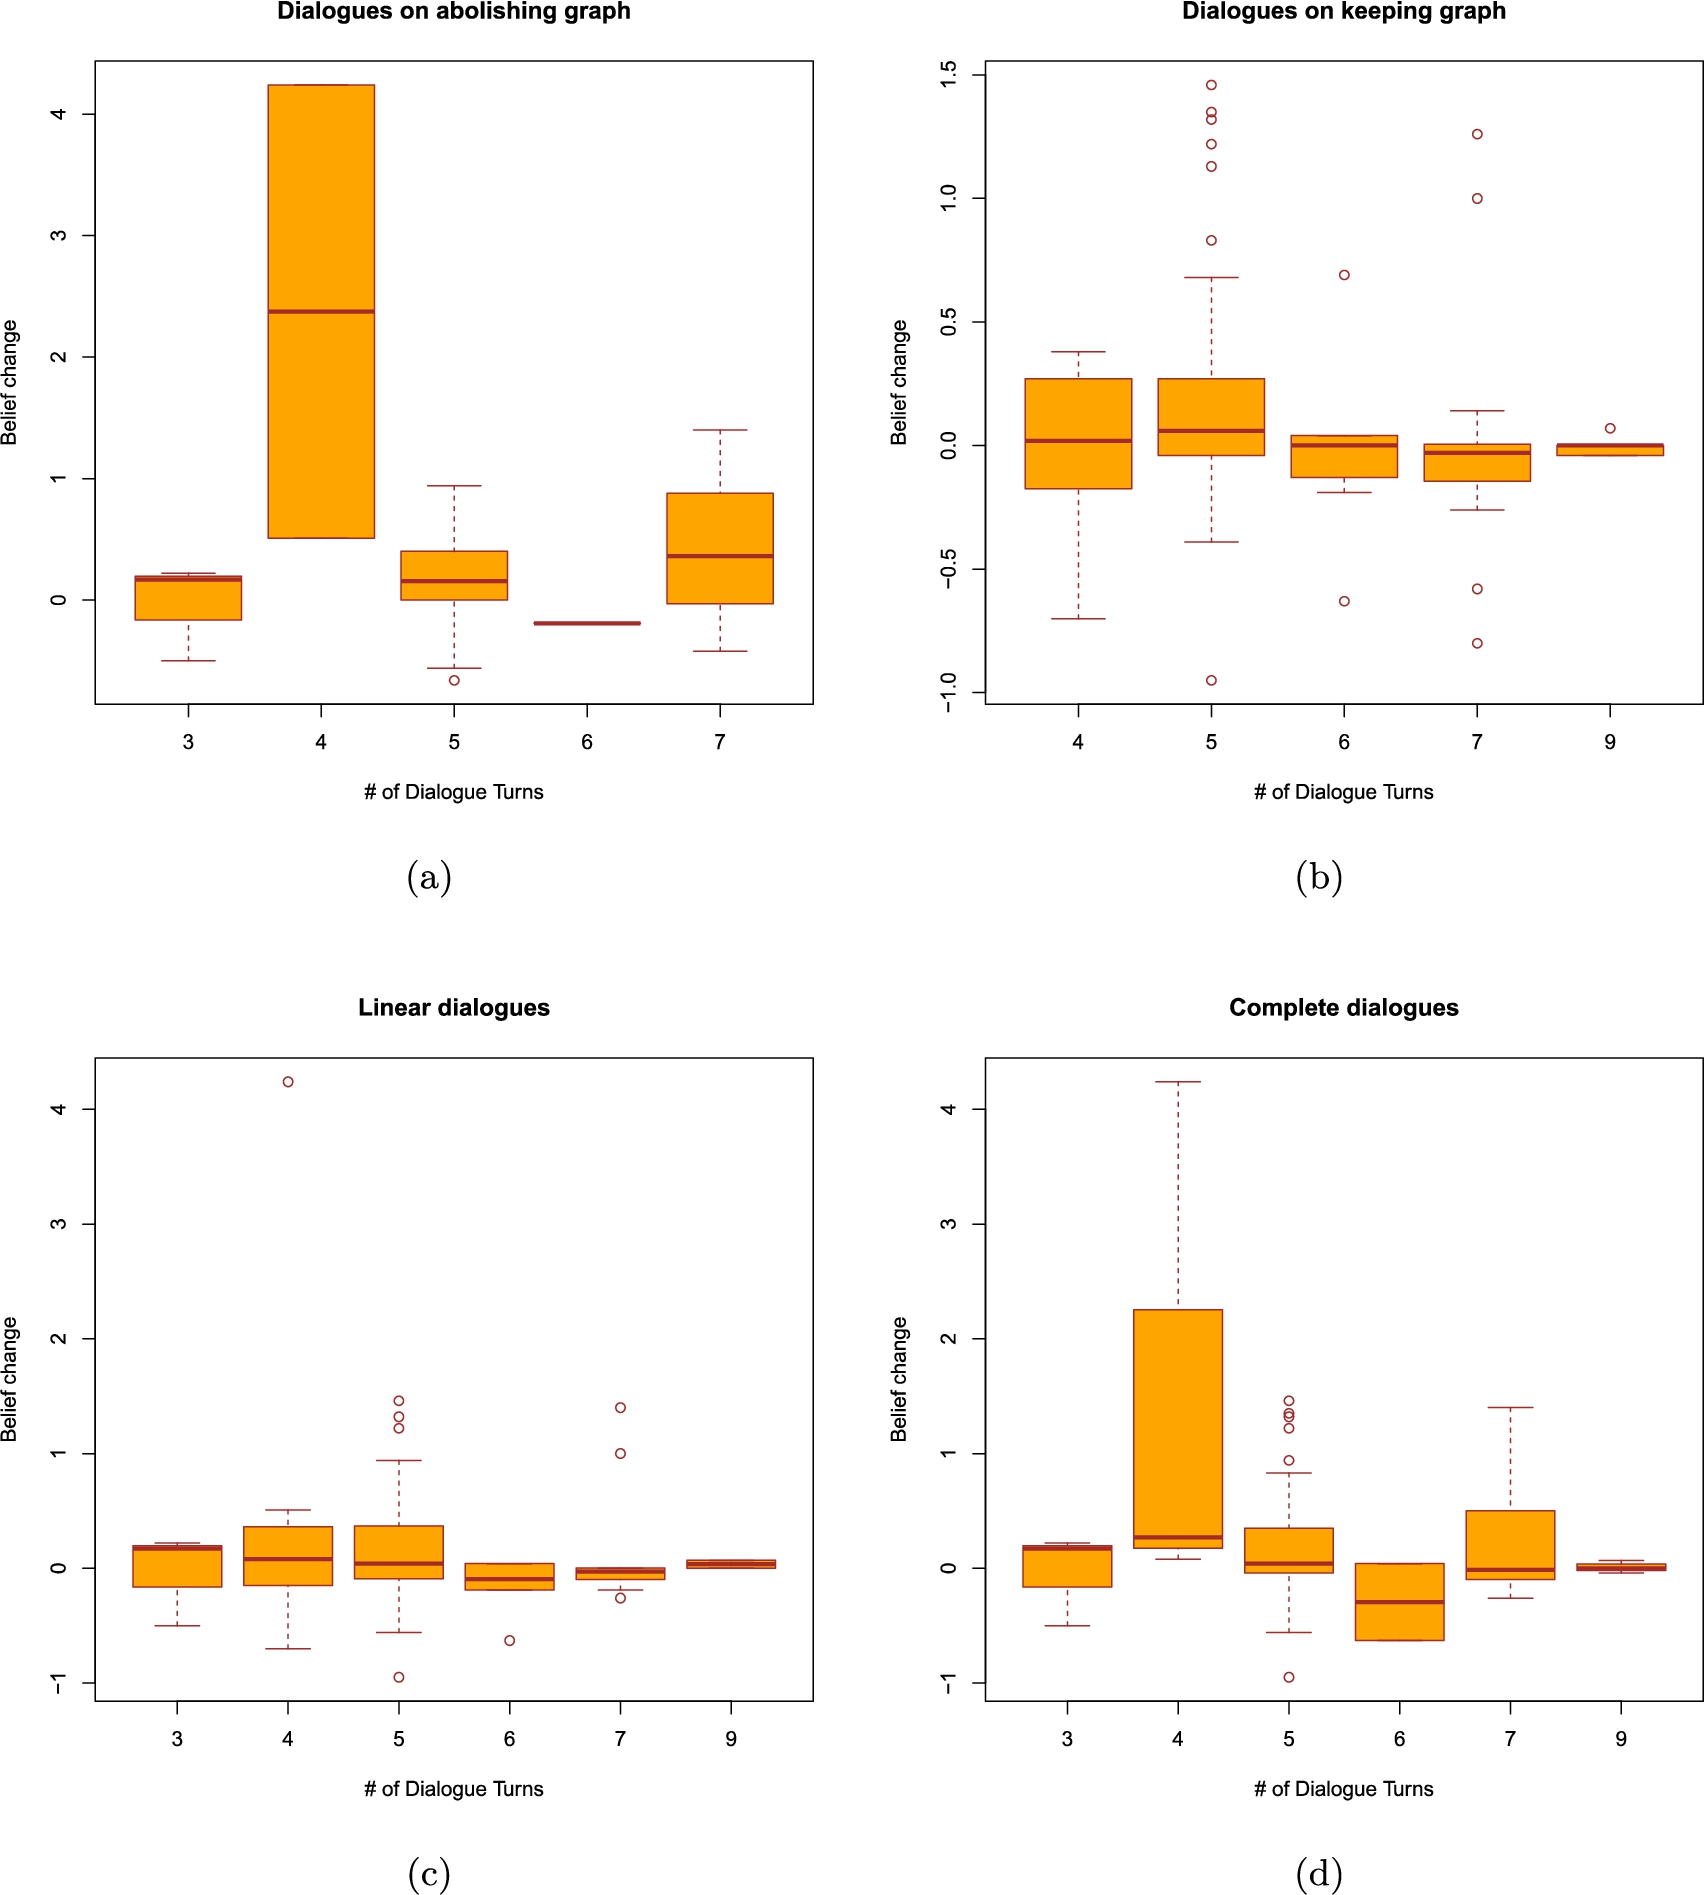
Fig. 16.
Boxplots concerning the number of dialogue turns and the belief change in dialogues conducted by the advanced system.
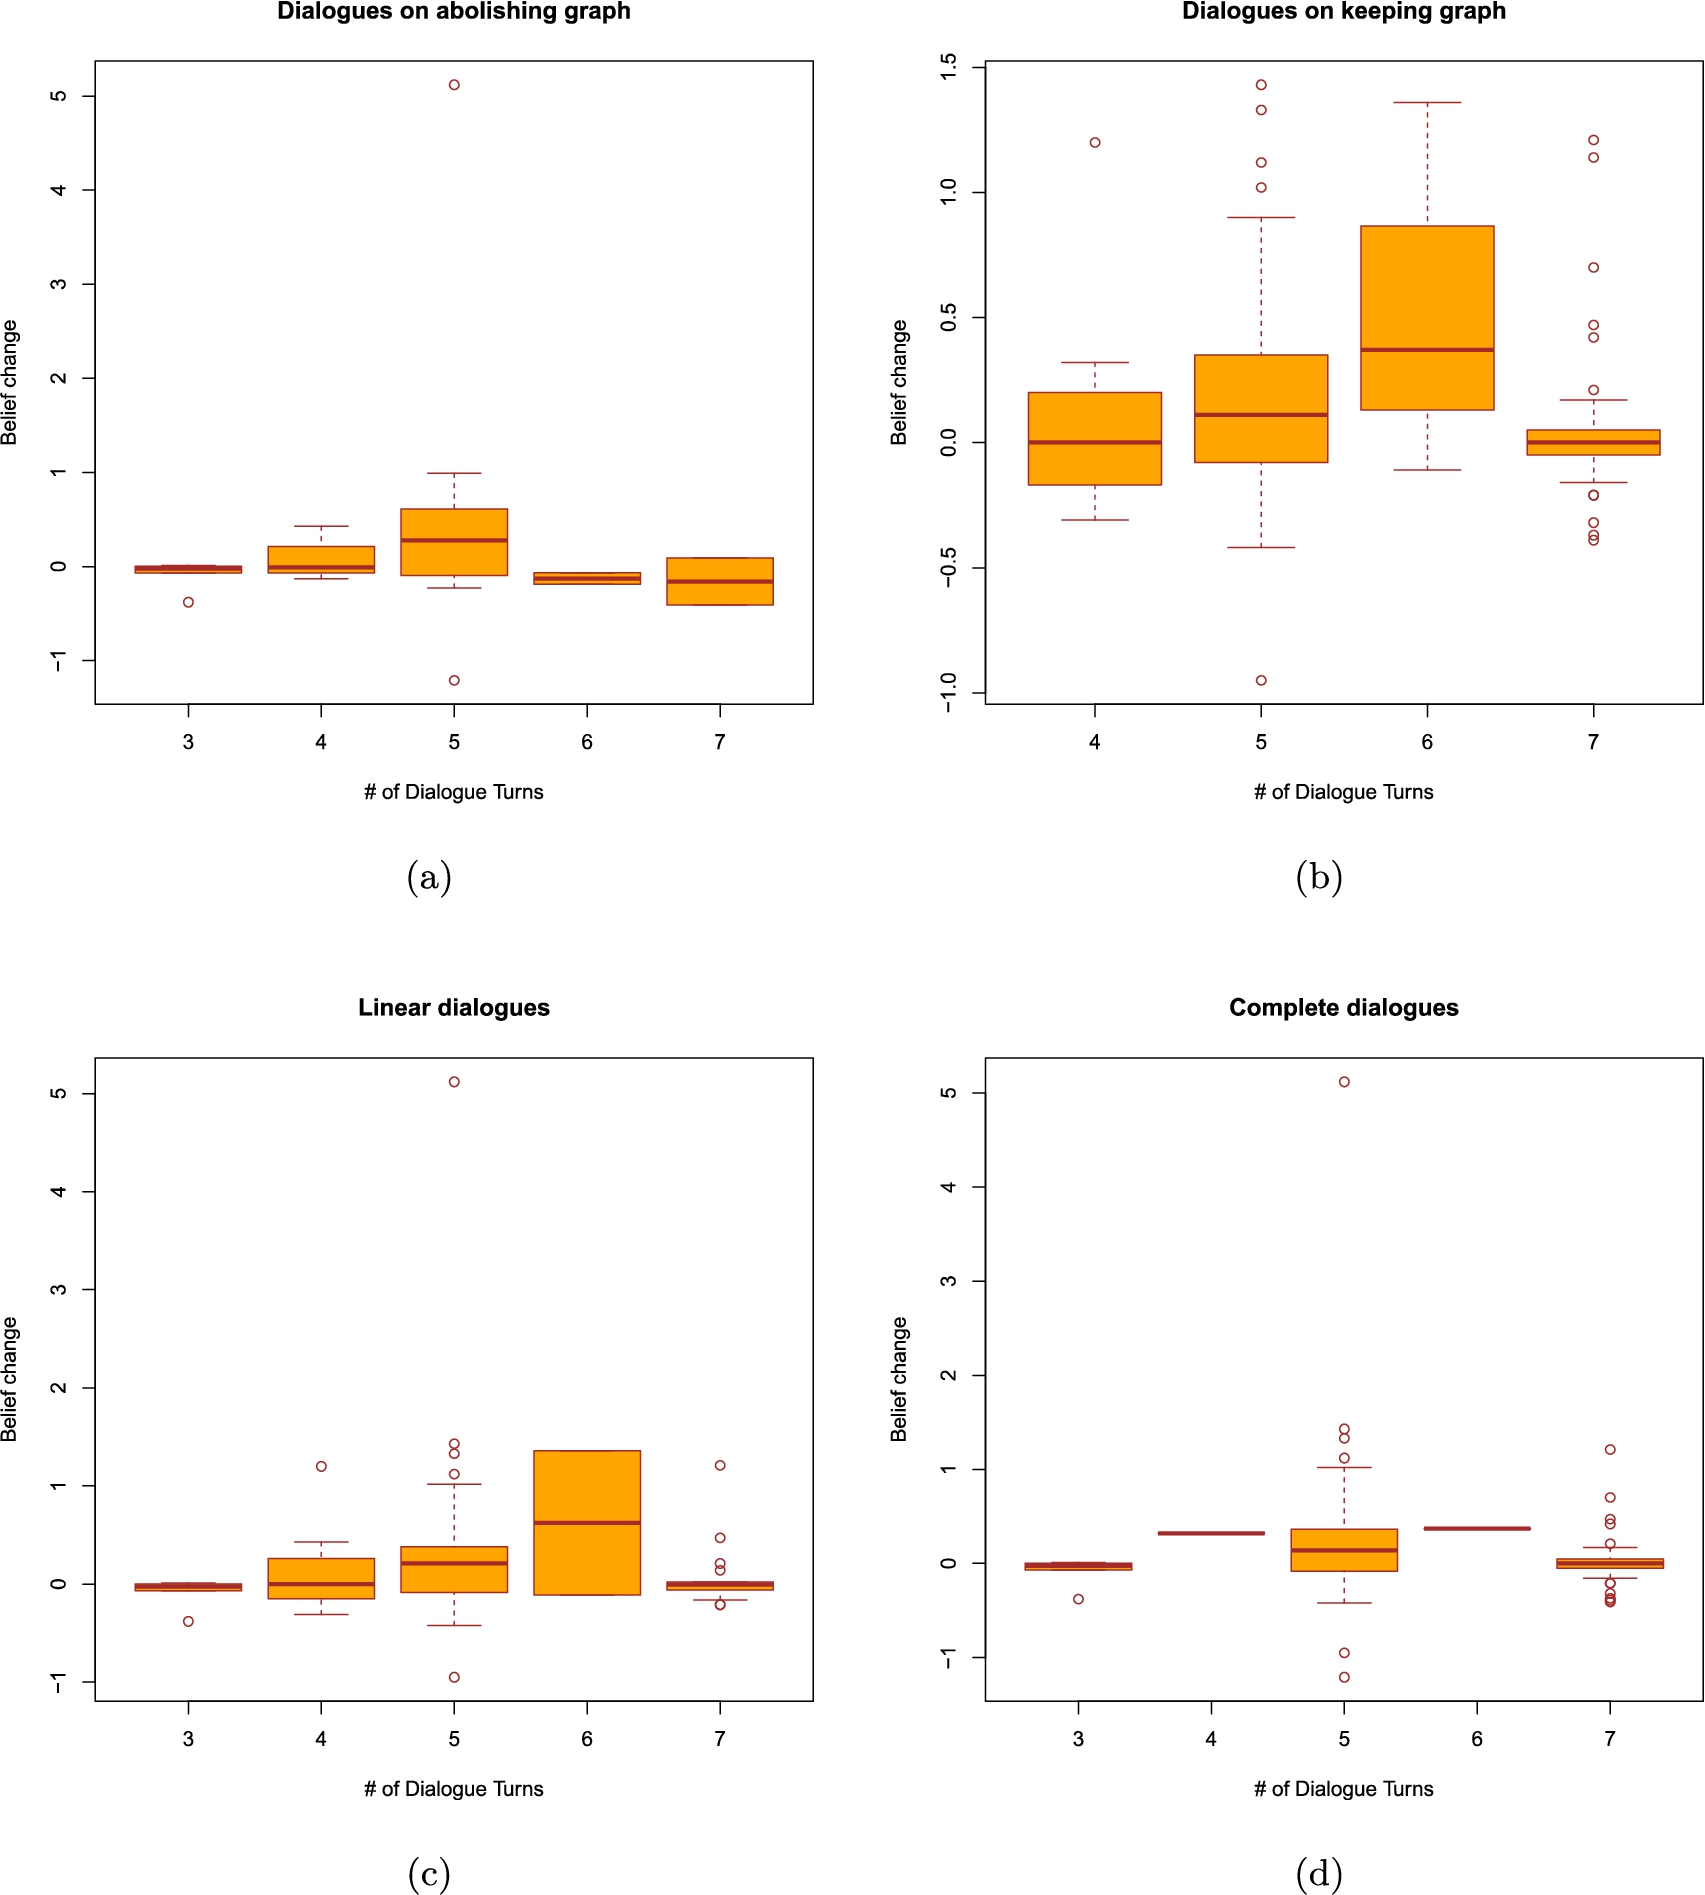
Table 11
Results of Wilcoxon rank sum test used to determine if the before and after beliefs for a given dialogue system are likely to be drawn from the same population. By “−” we understand that due to the nature of the data, exact p-value could not have been computed, and we make no claims about the significance
| Dialogue type | Advanced system | Baseline system |
| All | ||
| p-value | p-value | |
| Keeping Graph | ||
| p-value | p-value | |
| Abolishing Graph | – | – |
| Complete | ||
| p-value | p-value | |
| Incomplete | – | – |
| Linear | ||
| p-value | p-value | |
| Nonlinear | – | – |
Table 12
Results of Wilcoxon rank sum test used to determine if the before beliefs and the after beliefs between the dialogue system are likely to be drawn from the same population. By “−” we understand that due to the nature of the data, exact p-value could not have been computed, and we make no claims about the significance
| Dialogue type | Belief before dialogue | Belief after dialogue |
| All | ||
| p-value | p-value | |
| Keeping Graph | ||
| p-value | p-value | |
| Abolishing Graph | – | – |
| Complete | ||
| p-value | p-value | |
| Incomplete | – | – |
| Linear | ||
| p-value | p-value | |
| Nonlinear | – | – |
Table 13
Results of analysis of statistical significance of belief changes caused by the APSs on different types of dialogues. Shapiro–Wilk test was used to determine whether the “before” beliefs were normally distributed. If they were, t-test was used to determine significance of belief changes; otherwise, Wilcoxon signed-rank test was used. By “−” we understand that due to the nature of the data, exact p-value could not have been computed, and we make no claims about the significance
| Advanced system | Baseline system | |||
| Dialogue type | Normality | Significance | Normality | Significance |
| All | ||||
| p-value = 4.79e-10 | p-value = 0.01803 | p-value = 2.36e-10 | p-value = 0.83603 | |
| Keeping Graph | ||||
| p-value = 3.96e-08 | p-value = 0.003792 | p-value = 9.58e-07 | p-value = 0.16493 | |
| Abolishing Graph | ||||
| p-value = 0.060208 | p-value = 0.85018 | p-value = 0.37979 | p-value = 0.94239 | |
| Complete | ||||
| p-value = 5.21e-09 | p-value = 0.024625 | p-value = 1.00e-07 | p-value = 0.88823 | |
| Incomplete | – | – | ||
| p-value = 0.005446 | p-value = 1.2e-05 | |||
| Linear | ||||
| p-value = 3.42e-07 | p-value = 0.048107 | p-value = 1.14e-07 | p-value = 0.67004 | |
| Nonlinear | – | – | ||
| p-value = 5.64e-06 | p-value = 6.85e-06 | |||
Acknowledgements
This research was funded by EPSRC Project EP/N008294/1 Framework for Computational Persuasion. We thank Dr Andreas Artemiou for his valuable assistance. We also thank the reviewers for their valuable comments for improving the paper.
References
[1] | L. Amgoud and J. Ben-Naim, Ranking-based semantics for argumentation frameworks, in: Proceedings of SUM’13, W. Liu, V.S. Subrahmanian and J. Wijsen, eds, LNCS, Vol. 8078: , Springer, (2013) , pp. 134–147. |
[2] | K. Atkinson, P. Bench-Capon and T. Bench-Capon, Efficiency in persuasion dialogues, in: Joaquim Filipe and Ana, L.N. Fred, ed., Proceedings of ICAART’12, SciTePress, (2012) , pp. 23–32. |
[3] | L. Amgoud, J. Ben-Naim and D. Doder, Ranking arguments with comppensation-based semantics, in: Proceedings of KR’16, C. Baral, J. Delgrande and F. Wolter, eds, AAAI Press, (2016) , pp. 12–21. |
[4] | P. Auer, N. Cesa-Bianchi and P. Fischer, Finite-time analysis of the multiarmed bandit problem, Machine Learning 47: (2–3) ((2002) ), 235–256. doi:10.1023/A:1013689704352. |
[5] | S. Alahmari, Reinforcement Learning for Argumentation, PhD thesis, University of York, York, UK, 2020. |
[6] | P. Andrews, S. Manandhar and M. De Boni, Argumentative human computer dialogue for automated persuasion, in: Proceedings of SIGdial’08, D. Schlangen and B.A. Hockey, eds, ACL, (2008) , pp. 138–147. doi:10.3115/1622064.1622093. |
[7] | L. Amgoud, N. Maudet and S. Parsons, Arguments, dialogue and negotiation, in: Proceedings of ECAI’00, W. Horn, ed., FAIA, Vol. 54: , IOS Press, (2000) , pp. 338–342. |
[8] | L. Amgoud, N. Maudet and S. Parsons, Modelling dialogues using argumentation, in: Proceedings of ICMAS’00, B. Werner, ed., IEEE, (2000) , pp. 31–38. |
[9] | K. Atkinson, Value-based argumentation for democratic decision support, in: Proceedings of COMMA’06, P.E. Dunne and T.J.M. Bench-Capon, eds, FAIA, Vol. 144: , IOS Press, (2006) , pp. 47–58. |
[10] | K. Atkinson and A. Wyner, The value of values in computational argumentation, in: From Knowledge Representation to Argumentation in AI, Law and Policy Making: A Festschrift in Honour of Trevor Bench-Capon on the Occasion of His 60th Birthday, College Publications, (2013) , pp. 39–62. |
[11] | S. Alahmari, T. Yuan and D. Kudenko, Reinforcement learning for abstract argumentation: A q-learning approach, in: Proceedings of CMNA@ICAIL’17, CEUR Workshop Proceedings, Vol. 2048: , F. Bex, F. Grasso and N. Green, eds, CEUR-WS.org, (2017) , pp. 76–78. |
[12] | T. Bench-Capon, Persuasion in practical argument using value-based argumentation frameworks, Journal of Logic and Computation 13: (3) ((2003) ), 429–448. doi:10.1093/logcom/13.3.429. |
[13] | T. Bench-Capon and K. Atkinson, Abstract argumentation and values, in: Argumentation in Artificial Intelligence, Springer, (2009) , pp. 45–64. doi:10.1007/978-0-387-98197-0_3. |
[14] | T. Bench-Capon, K. Atkinson and A. Chorley, Persuasion and value in legal argument, Journal of Logic and Computation 15: (6) ((2005) ), 1075–1097. doi:10.1093/logcom/exi058. |
[15] | E. Black, A. Coles and S. Bernardini, Automated planning of simple persuasion dialogues, in: Proceedings of CLIMA’14, N. Bulling, L. van der Torre, S. Villata, W. Jamroga and W. Vasconcelos, eds, LNCS, Vol. 8624: , Springer, (2014) , pp. 87–104. |
[16] | E. Black, A. Coles and C. Hampson, Planning for persuasion, in: Proceedings of AAMAS’17, K. Larson, M. Winikoff, S. Das and E.H. Durfee, eds, ACM, (2017) , pp. 933–942. |
[17] | E. Bonzon, J. Delobelle, S. Konieczny and N. Maudet, A comparative study of ranking-based semantics for abstract argumentation, in: Proceedings of AAAI’16, S. Dale and M.P. Wellman, eds, AAAI Press, (2016) , pp. 914–920. |
[18] | E. Bonzon, J. Delobelle, S. Konieczny and N. Maudet, Argumentation ranking semantics based on propagation, in: Proceedings of COMMA’16, P. Baroni, T.F. Gordon, T. Scheffler and M. Stede, eds, FAIA, Vol. 287: , IOS Press, (2016) , pp. 139–150. |
[19] | T. Bench-Capon, Agreeeing to differ: Modelling persuasive dialogue between parties with different values, Informal Logic 22: (3) ((2002) ), 231–246. |
[20] | P. Baroni, D. Gabbay, M. Giacomin and L. van der Torre (eds), Handbook of Formal Argumentation, College Publications, (2018) . |
[21] | P. Baroni, M. Giacomin and P. Vicig, On rationality conditions for epistemic probabilities in abstract argumentation, in: Proceedings of COMMA’14, S. Parsons, N. Oren, C. Reed and F. Cerutti, eds, FAIA, Vol. 266: , IOS Press, (2014) , pp. 121–132. |
[22] | E. Black and A. Hunter, An inquiry dialogue system, Autonomous Agents and Multi-Agent Systems 19: (2) ((2009) ), 173–209. doi:10.1007/s10458-008-9074-5. |
[23] | C. Browne, E. Powley, D. Whitehouse, S. Lucas, P. Cowling, P. Rohlfshagen, S. Taverner, D. Perez, S. Samonthrakis and S. Colton, A survey of Monte Carlo tree search methods, IEEE Transactions on Computational Intelligence and AI in Games 4: (1) ((2012) ), 1–49. doi:10.1109/TCIAIG.2012.2186810. |
[24] | P. Baroni, A. Rago and F. Toni, From fine-grained properties to broad principles for gradual argumentation: A principled spectrum, International Journal of Approximate Reasoning 105: ((2019) ), 252–286. doi:10.1016/j.ijar.2018.11.019. |
[25] | T. Bickmore, D. Schulman and C. Sidner, Automated interventions for multiple health behviours using conversational agents, Patient Education and Counseling 92: ((2013) ), 142–148. doi:10.1016/j.pec.2013.05.011. |
[26] | F. Cerutti, M. Cramer, M. Guillaume, E. Hadoux, A. Hunter and S. Polberg, Empirical cognitive studies about formal argumentation, 2021, in press. |
[27] | M. Cramer and M. Guillaume, Empirical cognitive study on abstract argumentation semantics, in: Proceedings of COMMA’18, S. Modgil, K. Budzynska and J. Lawrence, eds, FAIA, Vol. 305: , IOS Press, (2018) , pp. 413–424. |
[28] | A. Cawsey, F. Grasso and R. Jones, A conversational model for health promotion on the world wide web, in: Proceedings of AIMDM’99, W. Horn, Y. Shahar, G. Lindberg, S. Andreassen and J. Wyatt, eds, LNAI, Vol. 1620: , Springer, (1999) , pp. 379–388. |
[29] | L. Chalaguine and A. Hunter, A persuasive chatbot using a crowd-sourced argument graph and concerns, in: Proceedings of COMMA’20, H. Prakken, S. Bistarelli and C. Taticchi, eds, FAIA, Vol. 326: , IOS Press, (2020) , pp. 9–20. |
[30] | L. Chalaguine, E. Hadoux, F. Hamilton, A. Hayward, A. Hunter, S. Polberg and H. Potts, Domain modelling in computational persuasion for behaviour change in healthcare, (2018) , arXiv:1802.10054 [cs.AI]. |
[31] | L. Chalaguine, F. Hamilton, A. Hunter and H. Potts, Argument harvesting using chatbots, in: Proceedings of COMMA’18, S. Modgil, K. Budzynska and J. Lawrence, eds, FAIA, Vol. 305: , IOS Press, (2018) , pp. 149–160. |
[32] | L. Chalaguine, F. Hamilton, A. Hunter and H. Potts, Impact of argument type and concerns in argumentation with a chatbot, in: Proceedings of ICTAI’19, IEEE Press, (2019) , pp. 1549–1554. |
[33] | R. Coulom, Efficient selectivity and backup operators in Monte-Carlo tree search, in: Proceedings of CG’06, H. Jaap van den Herik, P. Ciancarini and H.H.L.M. Donkers, eds, LNCS, Vol. 4630: , Springer, (2007) , pp. 72–83. |
[34] | L. Chen and P. Pu, Survey of preference elicitation methods, Technical Report IC/2004/67, EPFL, 2004. |
[35] | M. Caminada and M. Podlaszewski, Grounded semantics as persuasion dialogue, in: Proceedings of COMMA’12, B. Verheij, S. Szeider and S. Woltran, eds, FAIA, Vol. 245: , IOS Press, (2012) , pp. 478–485. |
[36] | F. Cerutti, N. Tintarev and N. Oren, Formal arguments, preferences, and natural language interfaces to humans: An empirical evaluation, in: Proceedings of ECAI’14, T. Schaub, G. Friedrich and B. O’Sullivan, eds, FAIA, Vol. 263: , IOS Press, (2014) , pp. 1033–1034. |
[37] | F. Dignum, B. Dunin-Keplicz and R. Verbrugge, Dialogue in team formation, in: Issues in Agent Communication, LNCS, Vol. 1916: , Springer, (2000) , pp. 264–280. doi:10.1007/10722777_18. |
[38] | P. Dung, On the acceptability of arguments and its fundamental role in nonmonotonic reasoning, logic programming, and n-person games, Artificial Intelligence 77: ((1995) ), 321–357. doi:10.1016/0004-3702(94)00041-X. |
[39] | X. Fan and F. Toni, Assumption-based argumentation dialogues, in: Proceedings of IJCAI’11, T. Walsh, ed., AAAI Press, (2011) , pp. 198–203. |
[40] | X. Fan and F. Toni, Mechanism design for argumentation-based persuasion, in: Proceedings of COMMA’12, B. Verheij, S. Szeider and S. Woltran, eds, FAIA, Vol. 245: , IOS Press, (2012) , pp. 322–333. |
[41] | R. Fisher and W. Ury, Getting to Yes: Negotiating Agreement Without Giving in, Penguin, (1981) . |
[42] | F. Grasso, A. Cawsey and R. Jones, Dialectical argumentation to solve conflicts in advice giving: A case study in the promotion of healthy nutrition, International Journal of Human-Computer Studies 53: (6) ((2000) ), 1077–1115. doi:10.1006/ijhc.2000.0429. |
[43] | E. Guerrero, J. Nieves and H. Lindgren, An activity-centric argumentation framework for assistive technology aimed at improving health, Argument & Computation 7: ((2016) ), 5–33. doi:10.3233/AAC-160004. |
[44] | F. Grasso, Exciting avocados and dull pears – combining behavioural and argumentative theory for producing effective advice, in: Proceedings of the 20th Annual Meeting of the Cognitive Science Society, M. Gernsbacher and S. Derry, eds, Lawrence Erlbaum Associates, (1998) , pp. 436–441. |
[45] | F. Grasso, Rhetorical coding of health promotion dialogues, in: Proceedings of AIME’03, M. Dojat, E.T. Keravnou and P. Barahona, eds, LNCS, Vol. 2780: , Springer, (2003) , pp. 179–188. |
[46] | S. Gosling, D. Samuel, P. Rentfrow and W. Swann, A very brief measure of the big-five personality domains, Journal of Research in Personality 37: (6) ((2003) ), 504–528. doi:10.1016/S0092-6566(03)00046-1. |
[47] | C. Hamblin, Mathematical models of dialogue, Theoria 37: ((1971) ), 567–583. |
[48] | E. Hadoux, A. Beynier, N. Maudet, P. Weng and A. Hunter, Optimization of probabilistic argumentation with Markov decision models, in: Proceedings of IJCAI’15, Q. Yang and M.J. Wooldridge, eds, AAAI Press, (2015) , pp. 2004–2010. |
[49] | E. Hadoux and A. Hunter, Computationally viable handling of beliefs in arguments for persuasion, in: Proceedings of ICTAI’16, N. Bourbakis, A. Esposito, A. Mali and M. Alamaniotis, eds, IEEE, (2016) , pp. 319–326. |
[50] | E. Hadoux and A. Hunter, Strategic sequences of arguments for persuasion using decision trees, in: Proceedings of AAAI’17, S.P. Singh and S. Markovitch, eds, AAAI Press, (2017) , pp. 1128–1134. |
[51] | E. Hadoux and A. Hunter, Learning and updating user models for subpopulations in persuasive argumentation using beta distributions, in: Proceedings of AAMAS’18, E. André, S. Koenig, M. Dastani and G. Sukthankar, eds, IFAAMAS, (2018) , pp. 1141–1149. |
[52] | E. Hadoux and A. Hunter, Comfort or safety? Gathering and using the concerns of a participant for better persuasion, Argument & Computation ((2019) ), 1–35. |
[53] | E. Hadoux, A. Hunter and J.-B. Corrégé, Strategic dialogical argumentation using multi-criteria decision making with application to epistemic and emotional aspects of arguments, in: Proceedings of FoIKS’18, F. Ferrarotti and S. Woltran, eds, LNCS, Vol. 10833: , Springer, (2018) , pp. 207–224. |
[54] | S. Huang and F. Lin, The design and evaluation of an intelligent sales agent for online persuasion and negotiation, Electronic Commerce Research and Applications 6: ((2007) ), 285–296. doi:10.1016/j.elerap.2006.06.001. |
[55] | D. Hitchcock, P. McBurney and S. Parsons, A framework for deliberation dialogues, in: Proceedings of OSSA’01: Argumentation and Its Applications, H.V. Hansen, R.C. Pinto, C.W. Tindale, J.A. Blair and R.H. Johnson, eds, OSSA, (2001) . |
[56] | A. Hunter and S. Polberg, Empirical methods for modelling persuadees in dialogical argumentation, in: Proceedings of ICTAI’17, J. Guerrero, ed., IEEE, (2017) , pp. 382–389. |
[57] | A. Hunter and N. Potyka, Updating probabilistic epistemic states in persuasion dialogue, in: Proceedings of ECSQARU’17, LNCS, Vol. 10369: , Springer, (2017) , pp. 46–56. |
[58] | A. Hunter, S. Potyka and S. Polberg, Delegated updates in epistemic graphs for opponent modelling, International Journal of Approximate Reasoning 113: ((2019) ), 207–244. doi:10.1016/j.ijar.2019.07.006. |
[59] | A. Hunter, S. Polberg and M. Thimm, Epistemic graphs for representing and reasoning with positive and negative influences of arguments, Artificial Intelligence 281: ((2020) ), 103236. doi:10.1016/j.artint.2020.103236. |
[60] | C. Hadjinikolis, Y. Siantos, S. Modgil, E. Black and P. McBurney, Opponent modelling in persuasion dialogues, in: Proceedings of IJCAI’15, Q. Yang and M.J. Wooldridge, eds, AAAI Press, (2013) , pp. 164–170. |
[61] | A. Hunter and M. Thimm, On partial information and contradictions in probabilistic abstract argumentation, in: Proceedings of KR’16, C. Baral, J.P. Delgrande and F. Wolter, eds, AAAI Press, (2016) , pp. 53–62. |
[62] | A. Hunter and M. Thimm, Optimization of dialectical outcomes in dialogical argumentation, International Journal of Approximate Reasoning 78: ((2016) ), 73–102. doi:10.1016/j.ijar.2016.06.014. |
[63] | A. Hunter and M. Thimm, Probabilistic reasoning with abstract argumentation frameworks, Journal of Artificial Intelligence Research 59: ((2017) ), 565–611. doi:10.1613/jair.5393. |
[64] | A. Hunter, A probabilistic approach to modelling uncertain logical arguments, International Journal of Approximate Reasoning 54: (1) ((2013) ), 47–81. doi:10.1016/j.ijar.2012.08.003. |
[65] | A. Hunter, Probabilistic strategies in dialogical argumentation, in: Proceedings of SUM’14, U. Straccia and A. Calì, eds, LNCS, Vol. 8720: , Springer, (2014) , pp. 190–202. |
[66] | A. Hunter, Modelling the persuadee in asymmetric argumentation dialogues for persuasion, in: Proceedings of IJCAI’15, Q. Yang and M.J. Wooldridge, eds, AAAI Press, (2015) , pp. 3055–3061. |
[67] | A. Hunter, Computational persuasion with applications in behaviour change, in: Proceedings of COMMA’16, P. Baroni, T.F. Gordon, T. Scheffler and M. Stede, eds, FAIA, Vol. 287: , IOS Press, (2016) , pp. 5–18. |
[68] | A. Hunter, Persuasion dialogues via restricted interfaces using probabilistic argumentation, in: Proceedings of SUM’16, S. Schockaert and P. Senellart, eds, LNCS, Vol. 9858: , Springer, (2016) , pp. 184–198. |
[69] | A. Hunter, Two dimensional uncertainty in persuadee modelling in argumentation, in: Proceedings of ECAI’16, G.A. Kaminka, M. Fox, P. Bouquet, E. Hüllermeier, V. Dignum, F. Dignum and F. van Harmelen, eds, FAIA, Vol. 285: , IOS Press, (2016) , pp. 150–157. |
[70] | E. Johnson, J. Hershey, J. Meszaros and H. Kunreuther, Framing, probability distortions, and insurance decisions, Journal of Risk and Uncertainty 7: (1) ((1993) ), 35–51. doi:10.1007/BF01065313. |
[71] | H. Katsumi, T. Hiraoka, K. Yoshino, K. Yamamoto, S. Motoura, K. Sadamasa and S. Nakamura, Optimization of information-seeking dialogue strategy for argumentation-based dialogue system, in: Proceedings of DEEP-DIAL@AAAI’19, (2018) , arXiv:1811.10728. |
[72] | S. Lukin, P. Anand, M. Walker and S. Whittaker, Argument strength is in the eye of the beholder: Audience effects in persuasion, in: Proceedings of EACL’17, M. Lapata, P. Blunsom and A. Koller, eds, ACL, (2017) , pp. 742–753. |
[73] | A. Monteserin and A. Amandi, A reinforcement learning approach to improve the argument selection effectiveness in argumentation-based negotiation, Expert Systems with Applications 40: ((2013) ), 2182–2188. doi:10.1016/j.eswa.2012.10.045. |
[74] | J. Mackenzie, Question begging in non-cumulative systems, Journal of Philosophical Logic 8: ((1979) ), 117–133. |
[75] | J. Murphy, E. Black and M. Luck, Heuristic trategy for persuasion, in: Proceedings of COMMA’16, P. Baroni, T.F. Gordon, T. Scheffler and M. Stede, eds, FAIA, Vol. 287: , IOS Press, (2016) , pp. 411–418. |
[76] | J. Murphy, A. Burdusel, M. Luck, S. Zschaler and E. Black, Deriving persuasion strategies using search-based model engineering, in: Proceedings of COMMA’18, S. Modgil, K. Budzynska and J. Lawrence, eds, FAIA, Vol. 305: , IOS Press, (2018) , pp. 221–232. |
[77] | R. McCrae and P. Costa, Validation of the five-factor model of personality across instruments and observers, Journal of Personality and Social Psychology 52: (1) ((1987) ), 81. doi:10.1037/0022-3514.52.1.81. |
[78] | N. Maudet and F. Evrard, A generic framework for dialogue game implementation, in: Proceedings of SEMDIAL’98, J. Hulstijn and A. Nijholt, eds, University of Twente, (1998) , pp. 185–198. |
[79] | P. McBurney and S. Parsons, Dialogue games in multi-agent systems, Informal Logic 22: ((2002) ), 257–274. |
[80] | P. McBurney and S. Parsons, Games that agents play: A formal framework for dialogues between autonomous agents, Journal of Logic, Language and Information 11: ((2002) ), 315–334. doi:10.1023/A:1015586128739. |
[81] | P. McBurney, R. van Eijk, S. Parsons and L. Amgoud, A dialogue-game protocol for agent purchase negotiations, Journal of Autonomous Agents and Multi-Agent Systems 7: ((2003) ), 235–273. doi:10.1023/A:1024787301515. |
[82] | H. Nguyen, J. Masthoff and P. Edwards, Persuasive effects of embodied conversational agent teams, in: Proceedings of HCI’07, J.A. Jacko, ed., LNCS, Vol. 4552: , Springer, (2007) , pp. 176–185. |
[83] | J. Ogden, Health Psychology: A Textbook, 5th edn, Open University Press, (2012) . |
[84] | F. Paglieri, Ruinous arguments: Escalation of disagreement and the dangers of arguing, in: Proceedings of OSSA’09: Argument Cultures, J. Ritola, ed., OSSA, (2009) , pp. 1–15. |
[85] | F. Paglieri and C. Castelfranchi, Why argue? Towards a cost–benefit analysis of argumentation, Argument & Computation 1: (1) ((2010) ), 71–91. doi:10.1080/19462160903494584. |
[86] | S. Polberg and A. Hunter, Empirical evaluation of abstract argumentation: Supporting the need for bipolar and probabilistic approaches, International Journal of Approximate Reasoning 93: ((2018) ), 487–543. doi:10.1016/j.ijar.2017.11.009. |
[87] | S. Polberg, A. Hunter and M. Thimm, Belief in attacks in epistemic probabilistic argumentation, in: Proceedings of SUM’17, S. Moral, O. Pivert, D. Sánchez and N. Marín, eds, LNCS, Vol. 10564: , Springer, (2017) , pp. 223–236. |
[88] | N. Potyka, A polynomial-time fragment of epistemic probabilistic argumentation, in: Proceedings of AAMAS’19, E. Elkind, M. Veloso, N. Agmon and M.E. Taylor, eds, IFAAMAS, (2019) , pp. 2165–2167. |
[89] | N. Potyka, S. Polberg and A. Hunter, Polynomial-time updates of epistemic states in a fragment of probabilistic epistemic argumentation, in: Proceedings of ECSQARU’19, LNCS, Vol. 11726: , Springer, (2019) , pp. 74–86. |
[90] | H. Prakken, Coherence and flexibility in dialogue games for argumentation, Journal of Logic and Computation 15: (6) ((2005) ), 1009–1040. doi:10.1093/logcom/exi046. |
[91] | H. Prakken, Formal sytems for persuasion dialogue, Knowledge Engineering Review 21: (2) ((2006) ), 163–188. doi:10.1017/S0269888906000865. |
[92] | R. Riveret, Y. Gao, G. Governatori, A. Rotolo, J. Pitt and G. Sartor, A probabilistic argumentation framework for reinforcement learning agents: Towards a mentalistic approach to agent profiles, Autonomous Agents and Multi-Agent Systems 33: ((2019) ), 216–274. doi:10.1007/s10458-019-09404-2. |
[93] | A. Rosenfeld and S. Kraus, Providing arguments in discussions on the basis of the prediction of human argumentative behavior, ACM Transactions on Interactive Intelligent Systems 6: (4) ((2016) ), 30:1–30:33. doi:10.1145/2983925. |
[94] | A. Rosenfeld and S. Kraus, Strategical argumentative agent for human persuasion, in: Proceedings of ECAI’16, G.A. Kaminka, M. Fox, P. Bouquet, E. Hüllermeier, V. Dignum, F. Dignum and F. van Harmelen, eds, FAIA, Vol. 285: , IOS Press, (2016) , pp. 320–328. |
[95] | I. Rahwan and K. Larson, Pareto optimality in abstract argumentation, in: Proceedings of AAAI’08, D. Fox and C.P. Gomes, eds, AAAI Press, (2008) , pp. 150–155. |
[96] | I. Rahwan, K. Larson and F. Tohmé, A characterisation of strategy-proofness for grounded argumentation semantics, in: Proceedings of IJCAI’09, C. Boutilier, ed., AAAI Press, (2009) , pp. 251–256. |
[97] | I. Rahwan, M. Madakkatel, J. Bonnefon, R. Awan and S. Abdallah, Behavioural experiments for assessing the abstract argumentation semantics of reinstatement, Cognitive Science 34: (8) ((2010) ), 1483–1502. doi:10.1111/j.1551-6709.2010.01123.x. |
[98] | N. Rach, W. Minker and S. Ultes, Markov games for persuasive dialogue, in: Proceedings of COMMA’18, S. Modgil, K. Budzynska and J. Lawrence, eds, FAIA, Vol. 305: , IOS Press, (2018) , pp. 213–220. |
[99] | N. Rach, W. Minker and S. Ultes, Increasing the naturalness of an argumentative dialogue system through argument chains, in: Proceedings of COMMA’20, IOS Press, (2020) , pp. 331–338. |
[100] | I. Rahwan, P. Pasquier, L. Sonenberg and F. Dignum, A formal analysis of interest-based negotiation, Annuals of Mathematics and Artificial Intelligence 55: ((2009) ), 253–276. doi:10.1007/s10472-009-9145-6. |
[101] | T. Rienstra, M. Thimm and N. Oren, Opponent models with uncertainty for strategic argumentation, in: Proceedings of IJCAI’13, F. Rossi, ed., AAAI Press, (2013) , pp. 332–338. |
[102] | D. Silver, A. Huang, C. Maddison, A. Guez, L. Sifre, G. Van Den Driessche, J. Schrittwieser, I. Antonoglou, V. Panneershelvam, M. Lanctot et al., Mastering the game of go with deep neural networks and tree search, Nature 529: (7587) ((2016) ), 484. doi:10.1038/nature16961. |
[103] | R. Siegler and J. Opfer, The development of numerical estimation, Psychological Science 14: (3) ((2003) ), 237–250. doi:10.1111/1467-9280.02438. |
[104] | D. Silver and J. Veness, Monte-Carlo planning in large POMDPs, in: Proceedings of NIPS’10, J.D. Lafferty, C.K.I. Williams, J. Shawe-Taylor, R.S. Zemel and A. Culotta, eds, Curran Associates, Inc., (2010) , pp. 2164–2172. |
[105] | M. Thimm, A probabilistic semantics for abstract argumentation, in: Proceedings of ECAI’12, L. De Raedt, C. Bessière, D. Dubois, P. Doherty, P. Frasconi, F. Heintz and P.J.F. Lucas, eds, FAIA, Vol. 242: , IOS Press, (2012) , pp. 750–755. |
[106] | M. Thimm, Strategic argumentation in multi-agent systems, Künstliche Intelligenz 28: ((2014) ), 159–168. doi:10.1007/s13218-014-0307-2. |
[107] | R.J. Thomas, J. Masthoff and N. Oren, Adapting healthy eating messages to personality, in: Proceedings of PERSUASIVE’17, P.W. de Vries, H. Oinas-Kukkonen, L. Siemons, N. Beerlage-de Jong and L. van Gemert-Pijnen, eds, LNCS, Vol. 10171: , Springer, (2017) , pp. 119–132. |
[108] | C. Tan, V. Niculae, C. Danescu-Niculescu-Mizil and L. Lee, Winning arguments: Interaction dynamics and persuasion strategies in good-faith online discussions, in: Proceedings of WWW’16, J. Bourdeau, J. Hendler, R. Nkambou, I. Horrocks and Y. Ben Zhao, eds, ACM, (2016) , pp. 613–624. |
[109] | S. Villata, E. Cabrio, I. Jraidi, S. Benlamine, M. Chaouachi, C. Frasson and F. Gandon, Emotions and personality traits in argumentation: An empirical evaluation, Argument & Computation 8: (1) ((2017) ), 61–87. doi:10.3233/AAC-170015. |
[110] | J. Vargheese, S. Sripada, J. Masthoff, N. Oren, P. Schofield and V. Hanson, Persuasive dialogue for older adults: Promoting and encouraging social interaction, in: Proceedings of CHI’13, W.E. Mackay, S.A. Brewster and S. Bødker, eds, ACM Press, (2013) , pp. 877–882. |
[111] | J. Vargheese, S. Sripada, J. Masthoff and N. Oren, Persuasive strategies for encouraging social interaction for older adults, International Journal of Human Computer Interaction 32: (3) ((2016) ), 190–214. doi:10.1080/10447318.2016.1136176. |
[112] | D. Walton and Krabbe, Commitment in Dialogue: Basic Concepts in Interpersonal Reasoning, State University of New York Press, (1995) . |
[113] | E. Zaal, G. Mills, A. Hagen, C. Huisman and J. Hoeks, Convincing conversations: Using a computer-based dialogue system to promote a plant-based diet, in: Proceedings of CogSci’17, G. Gunzelmann, A. Howes, T. Tenbrink and E.J. Davelaar, eds, Cognitive Science Society, (2017) , pp. 3627–3632. |


