
Applying argumentation to structure and visualize multi-dimensional opinion spaces
Abstract
This paper presents OpMAP: a tool for visualizing large scale, multi-dimensional opinion spaces as geographic maps. OpMAP represents opinions as labelings on a structured deductive argumentation framework. It uses probabilistic degrees of justification and Bayesian coherence measures to calculate how strongly any two opinions cohere with each other. The opinion sample is, accordingly, represented as a weighted graph, a so-called opinion graph, with opinion vectors serving as nodes and coherence values as edge weights. OpMAP partitions the nodes of the opinion graph by using clustering methods. Finally, the graph is visualized as a geographic map using a method based on a particular (e.g., force-directed) layout.
1.Introduction
This paper presents OpMAP: a tool which applies formal argumentation theory to structure and visualize large scale, multi-dimensional opinion spaces as geographic maps. The purpose of this paper is to provide a proof of concept. It describes the design of the tool and applies it to a simple illustrative example.
To understand how people judge a policy proposal, it is important to know what they think about other related issues. For example, one’s stance towards brexit will typically depend on one’s views about immigration, globalization, assessment of Britain’s economy, international cooperation, and a variety of further matters. Taking such dependencies into account, different persons’ views about brexit can be construed as high-dimensional opinion vectors. OpMAP visualizes high-dimensional opinion samples as 2D maps. This visualization is supposed to provide structural insights into the opinion sample, to help individual persons to locate themselves in the opinion landscape, and to serve as base layer for visualizing additional information, e.g. as overlays.
The theoretical background and basic outline of OpMAP can be summarized in five steps:
A simplified structured argumentation framework is used to represent the relations between the various issues which are considered in the policy survey, resp. in the opinion data.
An opinion vector is modeled as a labeling on the structured argumentation framework.
The structured argumentation framework allows one to calculate the extent to which any two opinion vectors, i.e. labelings, cohere with each other. The opinion sample is represented as a weighted graph, with opinion vectors serving as nodes and coherence values as edge weights.
The nodes of the opinion graph are partitioned by using clustering methods.
The graph is visualized as a map using a method based on a particular (e.g., force-directed) layout.
The paper proceeds as follows: The remainder of this introductory section reviews related work on argument visualization, visualization of opinion data, as well as formal argumentation theory and graph drawing. Section 2 describes the main theoretical components of OpMAP, it is organized in accordance with the five steps specified above. Following the same structure, Section 3 develops the proof of concept by means of a simple case – a stylized reconstruction of the debate about eating meat – which serves to illustrate OpMAP’s different components as well as the theoretical framework it builds upon. Finally, Section 4 identifies challenges for future research; it concludes this paper by setting forth a list of general criteria for evaluating OpMAP and assessing the quality of visualizations generated with this tool.
1.1.Visualization tools for argument analysis
Visualizing argumentative reasoning nearly always aims at depicting the structure of argumentation [31]. Visual devices such as debate graphs, argument maps, and inference diagrams lay out the structure of arguments or debates with varying degrees of detail and scope. Software tools such as Lasad [24], OVA [22], Rationale [33], Carneades [16], Debategraph.org [8], or Argunet [39] allow one to display, or to collaboratively construct such a map.
Argument maps, which are the state-of-the-art for presenting the results of complex argumentative analyses, are no doubt useful visual devices for experts, argument analysts and critical thinking instructors [18,43]. But there is more to a debate than its arguments and their interrelations – namely the way proponents, stakeholders, or citizens assess the arguments and claims. What a debate’s proponents believe is no less important for decision-making than the debate’s argumentative structure. Against this background, this paper suggests to explore a visualization tool that complements argument maps: opinion maps. Rather than visualizing the argumentative structure (of a debate) itself; opinion maps visualize the argumentatively structured opinion landscape of a debate. OpMAP can hence be understood as a novel species in the “ecosystem of argumentation technologies” [28,34].
1.2.Visualization tools for opinion analysis
While charts (timelines, pie charts, bar charts etc.) seem to be the standard device for visualizing opinion data, three more specific visualization methods that are related to the OpMAP concept can be identified: (1) geographic mapping of regional opinion data; (2) mapping opinions in a topic space; (3) social network visualization.
Re (1): If a survey yields opinion data for different geographic regions (for example, in the U.S., counties or states), this data can be visualized by coloring an actual geographic map accordingly. Presenting the degree of public ascent to key findings of climate science across the U.S. (different map for each finding), the Yale Climate Opinion Maps [20] illustrate this approach. Unlike these visualizations, however, OpMAP does not color a real map; it rather constructs a geographic-like map fully on its own; moreover, OpMAP visualizes not only one belief dimension but complex opinion vectors.
Re (2): ConToVi is a digital research instrument for policy and discourse analysis [10]. One of its central features is the so-called topic space, a radial representation of all topics that are touched upon in a discussion. Speakers and their individual utterances can be mapped into that topic space according to how strongly they relate to the different topics. So, the topic space from ConToVi is a 2D representation of the opinion landscape of a debate. However, unlike OpMAP, this opinion space is not argumentatively structured at all; it is merely based on results from topic analysis.
Re (3): It is standard to represent social networks as graphs, to carry out cluster analysis on these graphs and to draw these graphs (typically by means of force-directed methods) [36]. OpMAP builds on a particular kind of social network, which represent agents only in terms of their complex belief states and which determines the relations between agents just with regard to argumentative relations between their belief states. OpMAP therefore uses methods from social network analysis to study and visualize argumentative networks and epistemic communities [46].
1.3.Theoretical background
OpMAP builds on a variety of well-studied formal models and algorithms. In particular, it construes policy debates as deductive argumentation [2–4,6], i.e., as arguments whose inferences are necessarily truth-preserving. This requires that arguments which instantiate standard, non-deductive schemes for practical reasoning [29,45] are reconstructed as deductively valid, e.g. by adding a corresponding general principle as connecting premiss [25]. Likewise, defeasible arguments can be represented as deductive inferences by adding the defeasible inference principle as premiss. Yet, formally speaking, deductive argumentation frameworks are a special case of structured argumentation frameworks such as ASPIC+ [32]. There are seemingly no principal reasons why the tool presented in this article shouldn’t be generalizable to structured argumentation frameworks, which allow for deductive as well as defeasible arguments.
Moreover, OpMAP adapts and uses Bayesian measures of coherence [9,12,38] in conjunction with probabilistic degrees of justification defined on complex deductive argumentation [5].
Finally, OpMAP relies upon – and might ultimately have to improve – the so-called GMap algorithm [15] in order to cluster and draw the weighted opinion graphs.
2.Opinion map
This section describes the main theoretical components of OpMAP.
2.1.Simple structured argumentation framework
The sentence pool S is supposed to contain all natural-language sentences that are relevant to a debate. We assume that two natural-language sentences can contradict each other or be equivalent – relations which we represent in our simple model. Formally, S is a set of sentences which is closed under negation (i.e.,
Arguments are inferences from premisses to a conclusion, where both premisses and conclusions are sentences in S. Formally, an argument a on a sentence pool S is a tuple
A set of arguments A constructed on a sentence pool S represents a simple structured argumentation framework (SSAF),
2.2.Multi-dimensional opinions in the structured AF
The opinions of an agent in a debate – i.e., her position – is modeled as a partial truth-value assignment to the sentences that appear in the debate.
Definition 1
Definition 1(Position).
Let
A position
A position
complete iff
partial iff
atomic iff
tautological iff
Equivalently, a position can be expressed as a two-valued index-function over S or a three-valued index function over
Definition 2
Definition 2(Minimally consistent position).
Let
A partial position
A consistent position, besides being minimally consistent, accounts for the inferential relations between sentences that are established by the various arguments in the SSAF.
Definition 3
Definition 3(Consistent position).
Let
A partial position
Finally, we define:
Definition 4
Definition 4(Mutually consistent position).
Let
2.3.Mutual agreement between belief states
An opinion landscape is given through a set of positions plus information about how strongly any two positions agree / disagree with each other. But how can one measure mutual agreement / disagreement? Such a formal measure should meet the following desiderata:
(ArgAgre) | It represents how well two positions fit together given the arguments of the debate. |
(IncoDis) | It is able to distinguish different degrees of disagreement for mutually inconsistent positions. |
(EquiMax) | It assigns maximal degree of mutual agreement to two identical positions. |
Desideratum (ArgAgre) excludes standard distance measures – such as, e.g., Hamming distance, or edit distance, which work on vector representations of positions only – as suitable measures of mutual agreement. That is because such standard distance measures ignore argumentative relations between the sentences.
Bayesian epistemology is arguably the most influential and advanced research program in contemporary epistemology [41]. It therefore seems promising to rely on Bayesian epistemology in constructing a measure of argumentative agreement between positions. This requires one, however, to introduce a probabilistic measure of degree of justification in the first place, which the following three definitions accomplish [5].
Definition 5
Definition 5(Set of all complete positions which extend a position).
Let
The spread of a single position
Definition 6
Definition 6(Spread of positions).
Let
The degree of justification of a position is simply its spread, divided by the tautological position’s spread.
Definition 7
Definition 7(Degree of justification).
Let
As degrees of justification are probabilities (i.e., satisfy the probability axioms), they enable one to import the formal concepts and mathematical results of Bayesian epistemology into the deductive argumentative framework [5]. In particular, a range of Bayesian coherence measures [9,12,38] are now available for setting up an argumentative measure of mutual agreement/disagreement between any two positions.
Desideratum (IncoDis), according to which a suitable agreement measure is able to assign different degrees of disagreement to pairs of mutually inconsistent positions, rules out simple coherence measures, such as the naive Shogenji measure [38]. The question which Bayesian coherence measures are best equipped to deal with inconsistent sets of statements has been discussed extensively in the literature [38,40]. For the purpose of this article, a particular so-called mutual support measure is chosen as starting point [12]; this measure, in turn, relies on the Kemeny–Oppenheim measure of confirmation (see below). These choices seem to account for desideratum (ArgAgre) in a natural way, because mutual support measures assume that coherence depends on the degree to which various parts of a position support each other, which in turn is a function of the given arguments in the debate. Yet, the use of alternative coherence measures should be explored and assessed in future research.
Now, standard Bayesian coherence measures are supposed to assess the internal coherence of a set of statements, whereas, in this context, a measure of mutual coherence (mutual agreement) between two sets of statements (i.e., two positions) is needed. The following definitions adapt a mutual support measure of coherence for these purposes.
Definition 8
Definition 8(Mutual coherence).
Let
In calculating mutual coherence, the following confirmation measure is relied upon.
Definition 9
Definition 9(Kemeny–Oppenheim confirmation).
Let
Note that, according to these definitions,
The mutual coherence measure can be applied either to original positions in the opinion sample or to their deductive closures (which include all sentences implied by an original position).
Definition 10
Definition 10(Deductive closure).
Let
This means that MutCoh can spell out mutual agreement in at least two different ways (i.e., with respect to the original or the deductively closed positions). It is up to future research to figure out how this choice affects the analysis and visualization of the opinion landscape. As far as the proof of concept in Section 3 is concerned, MutCoh will be applied to the original positions.
The concept of an opinion graph explicates the metaphor of an opinion landscape and fuses the results of this subsection.
Definition 11
Definition 11(Opinion graph).
Let
2.4.Network analysis
In order to understand how the opinion landscape is structured – i.e., which belief states form clusters, and how big these clusters are, or how influential these belief states are – , network analysis methods are applied to the opinion graph.
When applying network analysis methods to the opinion graph, two basic challenges arise:
(1) The opinion graph contains edges with negative weight.
(2) The opinion graph is complete.
Most network analysis and clustering methods are per se not able to cope with negative edge weights. Moreover, the internal structure of complete graphs is comparatively hard to discover, and most network analysis algorithms primarily consider sparse graphs.
Both challenges can be addressed by transforming edge weights and filtering edges. In principle, this can be done in many different ways. And it would be worthwhile to investigate these alternatives in the future. In order to come up with a proof of concept, this paper relies on a simple linear transformation of edge weights (namely: add 1); as regards filtering, all edges with a transformed edge weight below 0.2 are removed.
2.5.Graph drawing
Network visualization methods can further enhance one’s understanding of the structure of the opinion graph. The most straight-forward network visualization metaphor represents nodes of the graph as points on the plane and edges as curves connecting the corresponding nodes. So-called force-directed algorithms construct such visualizations; these methods aim at placing connected nodes close to each other (see e.g. [23]). This complies with an intuitive depiction of relation among objects. (Thus, within Gestalt theory of human perception, it has been verified numerous times that humans tend to think about objects as related when the distance between them is relatively small.)
While force-directed methods are very popular in practice, since they produce fairly readable drawings for sparse graphs, dense graphs represent a challenge for these methods. Also, the methods do not allow for negative edge weights. Thus, in order to make standard force-directed algorithms applicable, the edge weights are transformed so that all values are positive, and the low-weighted edges are filtered, as already discussed.
A simple and classical way to show the results of the clustering algorithm on the visualization is to color the nodes according to the cluster they belong to. To emphasize the clustering even more and to explore the human familiarity with geographic maps, Gansner et al. [14] have introduced the algorithm GMap, which extends force-directed algorithms and constructs visualizations resembling a geographic map. In this visualization each cluster is depicted by a polygon (country), the nodes that belong to the cluster are represented by points lying within this polygon, and two polygons that contain many pairs of connected edges share a boundary (i.e., are neighboring countries). It has been verified empirically that humans perform better with this map-resembling type of visualization than with simple colored visualizations when it comes to so-called group-based tasks, which are tasks that can be performed by considering nodes, edges, and clusters. Additionally, the performance for other types of tasks, where only nodes or only nodes and edges have to be considered, does not deteriorate [35]. These findings suggest using the GMap method for visualizing the clustered opinion graph.
Applying the GMap algorithm to the opinion graph poses new challenges for the method which stem from the semantic structure of the data. They will be outlined in Section 4.
3.Proof of concept
This section illustrates the formal components of OpMAP by means of a stylized reconstruction of the debate about eating meat – in short: the veggie debate. It develops, in structural analogy to Section 2, a simple case study, which establishes the proof of concept.
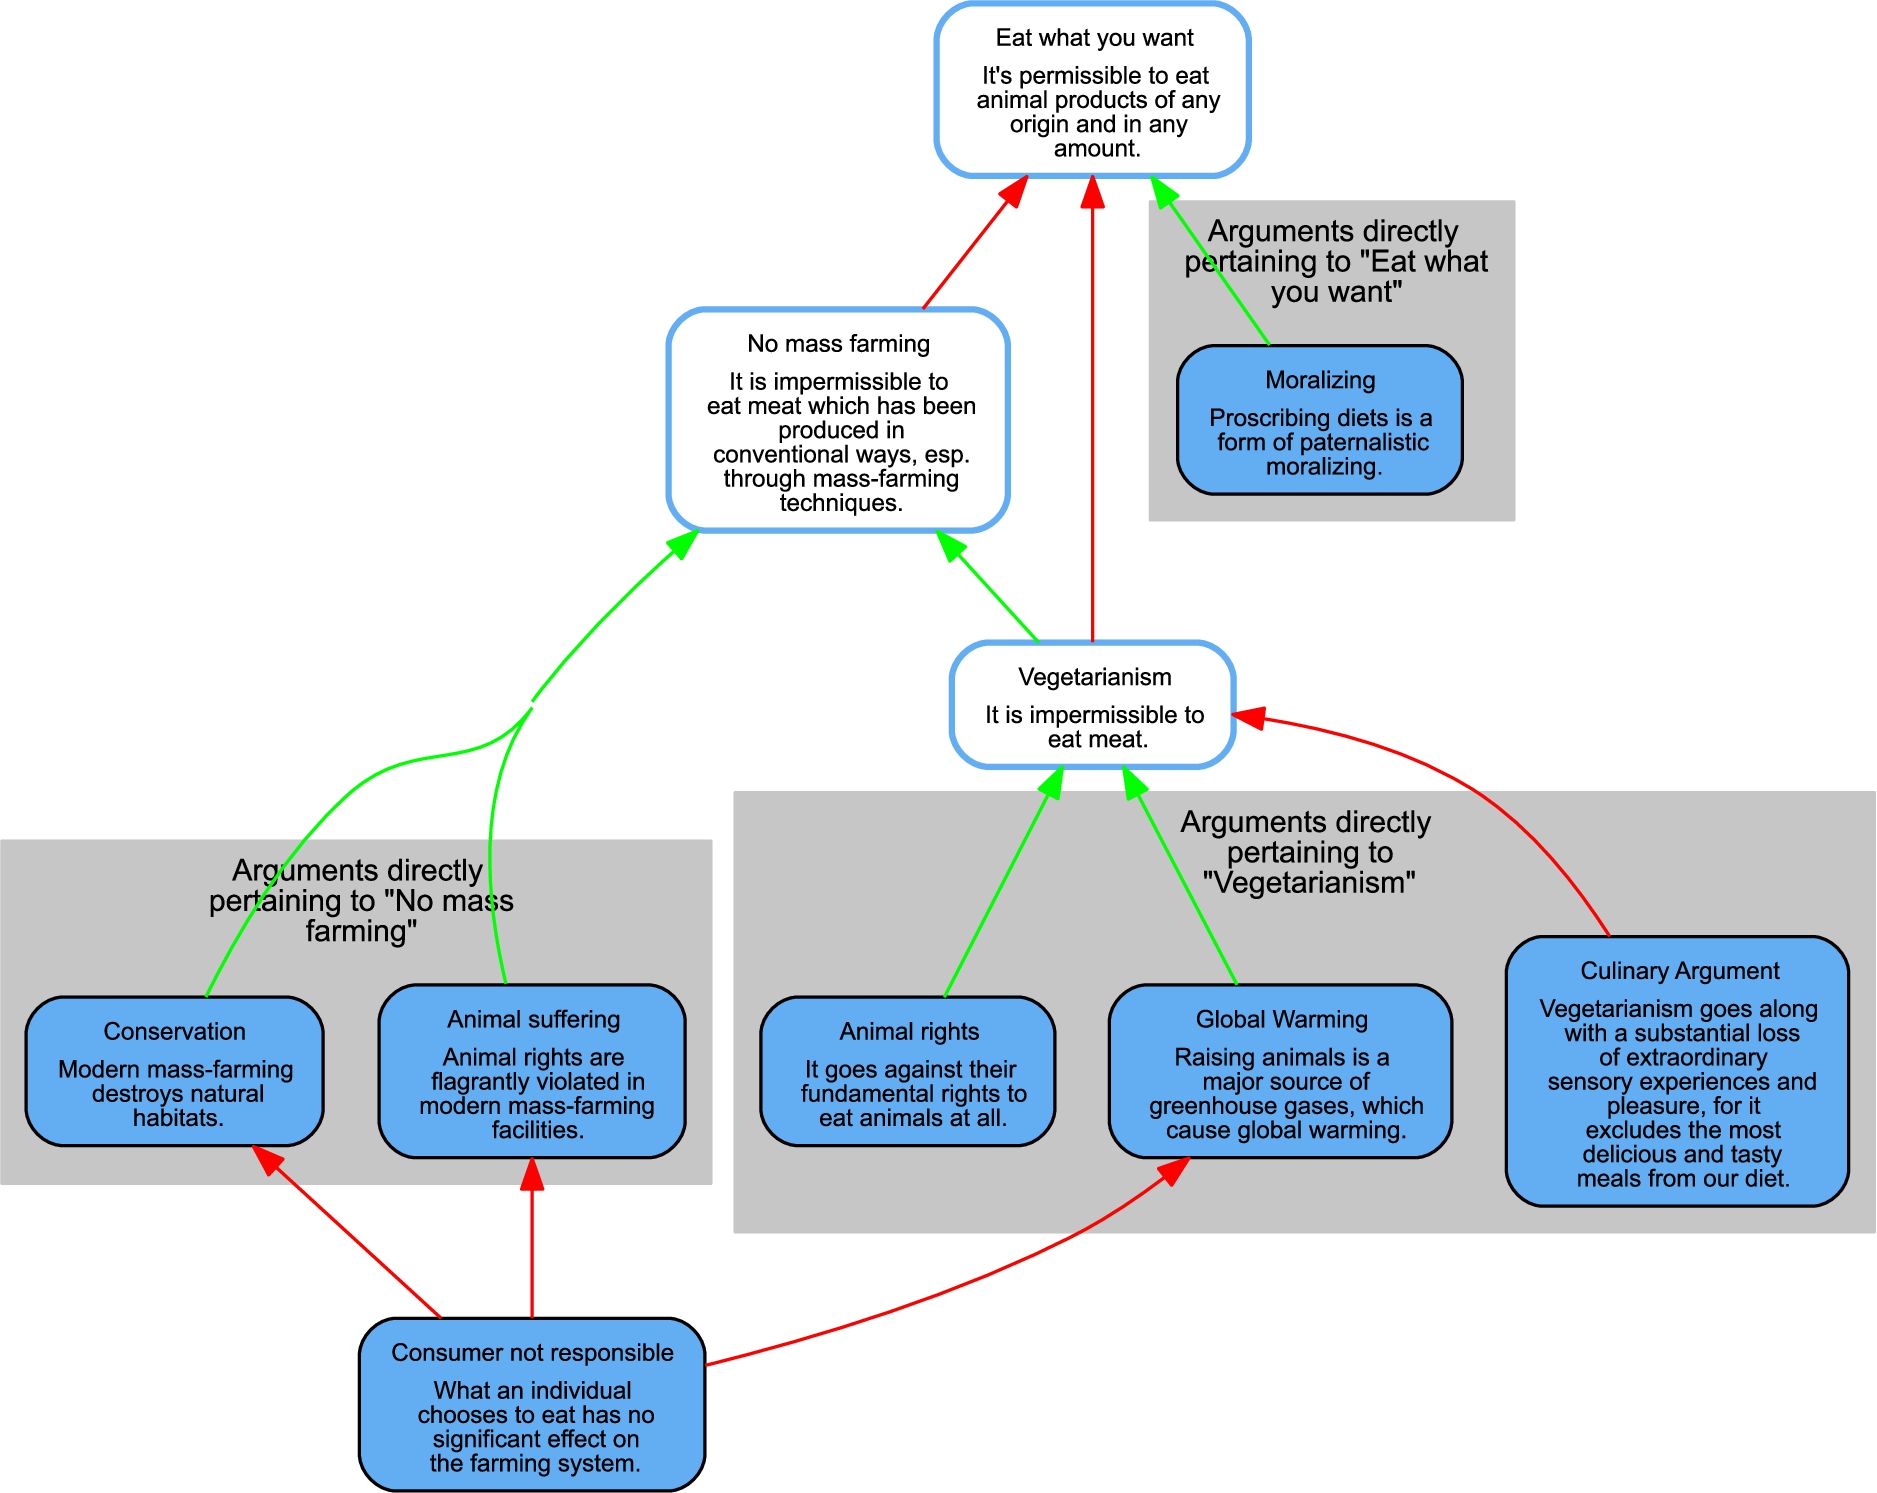
Fig. 1.
Visualization of the stylized reconstruction of the veggie debate as argument map. Besides arguments (filled boxes), the three core claims are also shown.
3.1.Simple structured argumentation framework
In the given simplified argumentative analysis of the veggie debate, three propositions take center stage:
[Eat what you want]: It is permissible to eat animal products of any origin and in any amount.
[No mass farming]: It is impermissible to eat meat which has been produced in conventional ways, esp. through mass-farming techniques.
[Vegetarianism]: It is impermissible to eat meat.
The proposition [Eat what you want] is supported by the argument <Moralizing>. The proposition [No mass farming] is supported by the arguments <Conservation> and <Animal suffering>. The proposition [Vegetarianism] is supported by the arguments <Animal rights> and <Global warming>, it is attacked by the <Culinary argument>. Finally, the argument <Consumer not responsible> attacks a common premiss of the arguments <Conservation>, <Animal suffering>, and <Global warming>. Figure 1 displays the macro structure of the debate as an argument map.
All arguments are reconstructed as premiss-conclusion structures with deductively valid inferences. For instance, the detailed reconstruction of the <Culinary argument> reads,
(P1) The most delicious meals involve meat.
(P2) It is permissible to eat the most delicious meals.
(P3) If it is permissible to eat some meal, then it is permissible to eat whatever is included in that meal.
(C4) Thus (from 1-3): One may eat meat.
The number of premisses per argument varies, in the debate, from 2 to 6; in total, the sentence pool contains
3.2.Multi-dimensional opinions in the structured AF
In future applications of OpMAP, opinions of participants, stakeholders and citizens will be elicited by means of a survey, will be manually reconstructed from a discussion [1], or could possibly be identified by means of stance detection and opinion mining algorithms [7]. In order to demonstrate the feasibility of OpMAP, this subsection, however, simply sets up a small fictitious opinion sample. Table 1 defines and describes seven consistent partial positions in the veggie debate’s SSAF. In terms of core claims, positions 1 and 2 accept [Eat what you want], positions 3, 4 and 5 accept [No mass farming], and positions 6 and 7 accept both [Vegetarianism] and [No mass farming]. In the following, these positions will serve as an illustrative opinion sample.
Table 1
Seven consistent partial positions defined on the veggie debate SSAF. “T”, “F” and blank space stand for true, false and judgement suspension, respectively. Sentences in the sentence pool are referenced and arranged row-wise in accordance with their function (premiss/conclusion) in the various arguments; in case one sentence appears in several arguments, different rows will represent one and the same sentence
| Consistent partial positions | ||||||||
| No. 1 | No. 2 | No. 3 | No. 4 | No. 5 | No. 6 | No. 7 | ||
| Core claims | ||||||||
| [Eat what you want] | T | T | ||||||
| [No mass farming] | T | T | T | T | T | |||
| [Vegetarianism] | T | T | ||||||
| Arguments | ||||||||
| <Moralizing> | (P1) | T | F | |||||
| (P2) | T | |||||||
| (C) | T | T | ||||||
| <Conservation> | (P1) | T | T | |||||
| (P2) | T | T | ||||||
| (P3) | T | T | ||||||
| (C) | T | T | T | T | T | |||
| <Animal suffering> | (P1) | T | T | T | ||||
| (P2) | T | T | T | |||||
| (P3) | T | T | T | |||||
| (C) | T | T | T | T | T | |||
| <Animal rights> | (P1) | T | T | |||||
| (P2) | F | T | ||||||
| (C) | T | T | ||||||
| <Global warming> | (P1) | T | ||||||
| (P2) | T | |||||||
| (P3) | T | |||||||
| (C1) | T | |||||||
| (P4) | T | |||||||
| (P5) | T | |||||||
| (C2) | T | T | ||||||
| <Culinary argument> | (P1) | T | T | |||||
| (P2) | T | T | ||||||
| (P3) | T | T | ||||||
| (C) | T | T | ||||||
| <Consumer not resp.> | (P1) | T | F | |||||
| (P2) | T | |||||||
| (C) | T | |||||||
3.3.Mutual agreement between belief states
Mutual coherence, as defined in the Section 2.3, can be calculated for every pair of positions in the opinion sample (Table 1). This yields the edge weights of the corresponding opinion graph. Figure 2 displays the weighted adjacency matrix – visualized as a heat map – of this opinion graph.
3.4.Network analysis
As explained above, the original opinion graph includes edges with negative weights; hence the edge weights are transformed (simply by adding 1); and the graph is optionally filtered by removing all edges with a transformed edge weight below 0.2. For illustrative purposes, different clustering methods available in Mathematica are applied to both the unfiltered as well as the filtered transformed opinion graph. As Table 2 shows, filtering affects the results and tends to improve the ability to find clusters, as expected. Especially the clusters obtained with modularity and centrality make sense in view of the design of the opinion sample.
3.5.Graph drawing
Figure 3 displays the opinion graph and two clusterings found by modularity (with and without filtering). Clusters are highlighted through the use of colors and curves that surround each cluster.
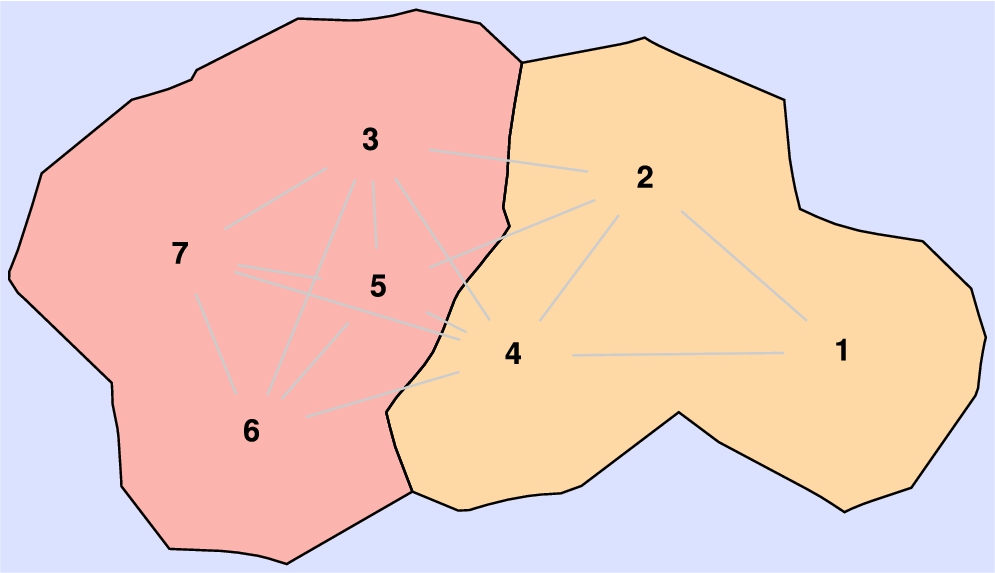
Figure 4 shows the result of the application of the GMap algorithm to the filtered opinion graph with the clustering found by modularity. As can be seen, the small illustrative opinion graph yields a plain and simple visualization, by far more clear and intuitive than the visualization of Fig. 3. In addition, the layout seems to reflect the structure of the opinion landscape in a sensible way. Thus, for example, the far-right position “1” is the only position in the sample which accepts [Eat what you want] because of the <Moralizing> and the <Consumer not responsible> arguments, which are not accepted by any other position in the sample, as can be seen from Table 1.
4.Discussion
This concluding section highlights challenges and directions of future research; it suggests, in particular, criteria for assessing opinion graph drawings which may be used in future investigations.
Fig. 2.
Heatmap representation of the weighted adjacency matrix of the illustrative opinion graph. Shading corresponds, in accordance with the right-hand legend, to the degree of mutual coherence between a given pair of positions.
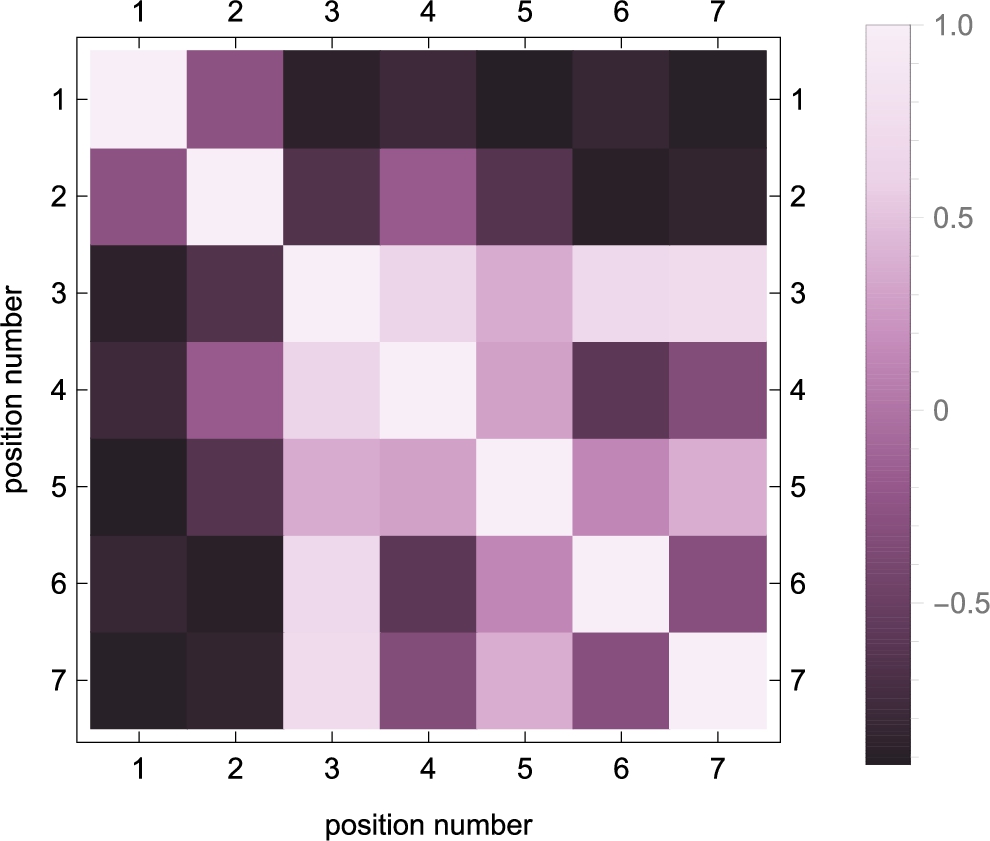
Table 2
Different clustering methods (modularity, hierarchical, centrality) applied to the unfiltered and filtered illustrative opinion graph. All original edge weights are increased by 1. In the filtered graph, edges with weight below 0.2 are removed. Default MathematicaTM implementations of the clustering methods are used (version 11.0.1.0)
| modularity | hierarchical | centrality | |
| unfiltered | |||
| filtered |
Fig. 3.
Visualization of the clustered unfiltered (left) and filtered (right) illustrative opinion graph. Communities are identified with modularity clustering. The clusters are depicted by the color of the nodes and additionally by a curve around each cluster. Edge colors correspond to edge weights. The visualization is constructed by the Community Layout algorithm of Mathematica.
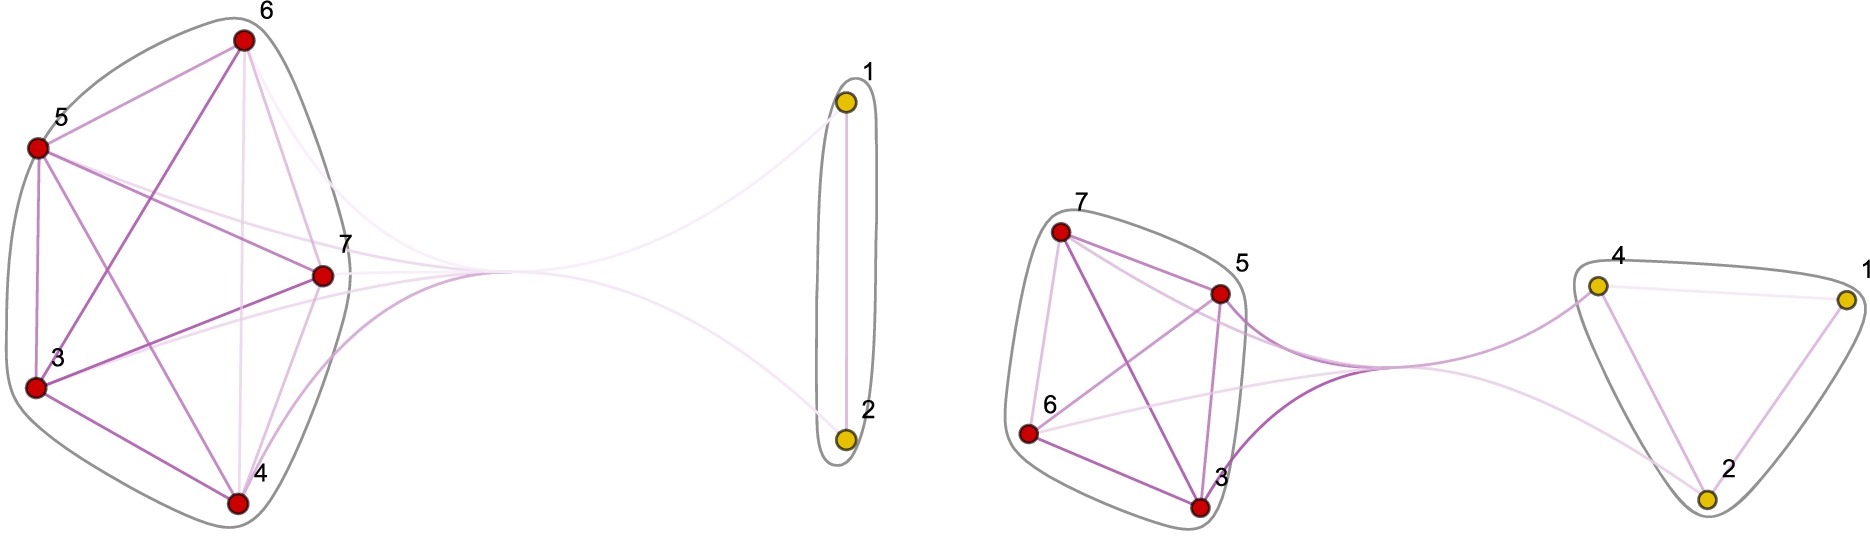
Fig. 4.
Geographic visualization of the filtered illustrative opinion graph; generated with the GMap implementation from http://gmap.cs.arizona.edu/ (date 07/11/17).
The simple case study presented in Section 3 establishes the feasibility of OpMAP and constitutes, accordingly, a proof of concept. A basic follow-up question is, obviously, whether OpMAP scales to larger debates and larger opinion samples.
Large debates and opinion samples pose specific problems for OpMAP’s different components:
The calculation of mutual coherence values is computationally demanding: To start with, determining a single degree of justification requires the solution of a specific #SAT problem (model counting). When mutual coherence between two positions is calculated, ever new degrees of justification have to be determined for all subsets of the two positions at hand. So, it is an important question for OpMAP whether mutual coherence values can be reliably determined by stochastic algorithms (e.g., Markov Chain Monte Carlo), by heuristics (which may, e.g., explore the structure of the SSAF), or by machine learning methods.
Under the assumption that opinion graphs are relatively dense, large opinion graphs will be difficult to draw in a meaningful way; especially force-directed layouts, which lie at heart of the GMap algorithm, are prone to yield mere “hair-ball” plots. Future research has to investigate how this issue can be overcome [26].
Clustering, too, will become more difficult for large opinion graphs. That is because, in large graphs, one may expect more so-called hub nodes. These hub nodes are generated by ‘small’ partial positions, which suspend judgement vis-à-vis most of the sentences of the debate. These positions will cohere strongly with many other positions, which translates, in terms of the graph, into many heavily-weighted edges. Tailored filtering methods or other techniques might be needed to handle such hubs [37].
Preliminary evidence from an ongoing exhibition project suggests that the scalability issues can be overcome [27]. It is left to future work to analyze this large-scale implementation of OpMAP in detail.
Two further challenges do not relate directly to scalability. First, a useful opinion map of a debate will have to display meaningful labels – both for individual positions but also, and more importantly, for the different clusters, or “countries”, in the map. It should be investigated whether existing techniques, e.g. from topic labeling [21], can be applied and adapted to generate opinion cluster labels. Second, some foreseen applications of OpMAP involve dynamic updates of the opinion map. This poses novel challenges for clustering and drawing in terms of stability, i.e., neither the clusters nor the drawing should change completely once a new opinion is inserted into the sample [17,19].
Future research will have to study how OpMAP must be extended or modified in order to cope with the aforementioned challenges. For this sort of investigation, it is important to have explicit normative standards against which different versions and implementations of the OpMAP concept are evaluated.
The analogy between opinion maps and geographic maps suggests the following criteria:
(Meaningful Countries) | Opinions in one “country” (cluster) should cohere with one another much more strongly than with opinions outside that “country”. |
(Country Size) | The size (area) of a “country” in the map should correspond to the number of agents whose opinions are located in that “country”. |
(Distance) | The Euclidean distance between the locations of any two opinions in the drawing should correspond to the degree of mutual coherence between the two opinions. |
The informal description of these criteria allows for different mathematical explications (e.g., rank correlation versus standard correlation). (Meaningful Countries), (Country Size) and (Distance) should be seen as umbrella criteria that organize a broad range of different statistical measures. Such precise statistical measures should be applied, in future research, in a context-sensitive way and in function of the corresponding investigation’s purpose.
Appendices
Appendix A.
Appendix A.Proof that MutCoh satisfies desideratum (EquiMax)
As function MutCoh is the average of multiple confirmation-terms, it is maximal (equals 1) iff each confirmation term is maximal (equals 1), which is in turn the case iff both positions entail each other. More precisely, the following statements are, in view of Definitions 8 and 9, pairwise equivalent.
Appendix B.
Appendix B.Theses and arguments of the illustrative debate (“veggie debate”)
The following argdown-snippet [44] contains all theses (introduced by square brackets) and arguments (introduced by angle brackets) of the debate about eating meat, which is used for illustrative purposes in this paper.
/*** Central Theses ***/
[Eat what you want]: It’s permissible to eat animal products of any origin
and in any amount.
[No mass farming]: It is impermissible to eat meat which has been produced
in conventional ways, esp. through mass-farming techniques.
-> [Eat what you want]
[Vegetarianism]: It is impermissible to eat meat.
-> [Eat what you want]
+> [No mass farming]
/*** Arguments directly pertaining to "Eat what you want" ***/
<Moralizing>: Proscribing diets is a form of paternalistic moralizing.
(1) Proscribing diets is a form of paternalistic moralizing.
(2) If proscribing diets is a form of paternalistic moralizing, then one
may eat whatever one likes.
----
(3) [Eat what you want]
/*** Arguments directly pertaining to "No mass farming" ***/
<Conservation>: Modern mass-farming destroys natural habitats.
(1) Modern mass-farming industry causes the destruction of natural
habitats at a large scale.
(2) By eating food that has been produced in conventional ways, esp.
through mass-farming techniques, one supports the modern mass-
farming industry.
- <Consumer not responsible>
(3) One must not support an industry which is responsible for the
large-scale destruction of natural habitats.
----
(4) [No mass farming]
<Consumer not responsible>: What an individual chooses to eat has no
significant effect on the farming system.
(1) Decisions by individual consumers don’t causally effect the
farming industry.
(2) One supports -- in a morally relevant way -- a farming industry
by eating its products only if decisions by individual consumers
do causally effect the farming industry.
----
(3) It’s not the case that, by eating some food products, one supports
the farming and food industry which has produced these very
products.
<Animal suffering>: Animal rights are flagrantly violated in modern
mass-farming facilities.
(1) Animal rights are flagrantly violated in modern mass-farming
facilities.
(2) By eating food that has been produced in conventional ways,
esp. through mass-farming techniques, one supports the modern
mass-farming industry.
- <Consumer not responsible>
(3) One must not support an industry which is responsible for systematic
violations of animal rights.
----
(4) [No mass farming]
/*** Arguments directly pertaining to "Vegetarianism" ***/
<Culinary Argument>: Vegetarianism goes along with a substantial loss of
extraordinary sensory experiences and pleasure, for it excludes the most
delicious and tasty meals from our diet.
(1) The most delicious meals include meat.
(2) It’s permissible to eat the most delicious meals.
(3) If it’s permissible to eat some meal, then it’s permissible to eat
whatever is included in that meal.
----
(4) One may eat meat.
>< [Vegetarianism]
<Global Warming>: Raising animals is a major source of greenhouse gases,
which cause global warming.
(1) We must realize the 2-degree-aim.
(2) We can only limit global warming to at most 2 degree if we virtually
reduce anthropogenic greenhouse gas emissions to zero.
(3) We can only reduce anthropogenic greenhouse gas emissions to zero if
we stop farming animals.
----
(4) We ought to stop farming animals.
(5) By eating animal products, one supports the animal farming industry.
- <Consumer not responsible>
(6) If we ought stop farming animals, one must not support animal farming
industry.
----
(7) [Vegan diet]: One must not eat animal products.
+> [Vegetarianism]
<Animal rights>: It goes against their fundamental rights to eat animals
at all.
(1) Animals have the right to live.
(2) If animals have a right to live, one must not eat them.
----
(3) [Vegetarianism]
References
[1] | A.A. Berger, Media Analysis Techniques, SAGE Publications, Los Angeles, London et al., (2014) . |
[2] | P. Besnard and A. Hunter, Elements of Argumentation, MIT Press, Cambridge, MA, (2008) . doi:10.7551/mitpress/9780262026437.001.0001. |
[3] | G. Betz, Theorie Dialektischer Strukturen, Klostermann, Frankfurt am Main, (2010) . |
[4] | G. Betz, Debate Dynamics: How Controversy Improves Our Beliefs, Synthese Library, Springer, Dordrecht, (2012) . |
[5] | G. Betz, On degrees of justification, Erkenntnis 77: (2) ((2012) ), 237–272. doi:10.1007/s10670-011-9314-y. |
[6] | G. Brun and G. Betz, Analysing practical argumentation, in: The Argumentative Turn in Policy Analysis. Reasoning About Uncertainty, S.O. Hansson and G. Hirsch-Hadorn, eds, Springer, Cham, (2016) , pp. 39–77. |
[7] | E. Cambria, B. Schuller, Y. Xia and C. Havasi, New avenues in opinion mining and sentiment analysis, IEEE Intelligent Systems 28: (2) ((2013) ), 15–21, ISSN 1541-1672. doi:10.1109/MIS.2013.30. |
[8] | DeabteGraph application, https://debategraph.org/. |
[9] | I. Douven and W. Meijs, Measuring coherence, Synthese 156: ((2007) ), 405–425. doi:10.1007/s11229-006-9131-z. |
[10] | M. El-Assady, V. Gold, C. Acevedo, C. Collins and D. Keim, ConToVi: Multi-party conversation exploration using topic-space views, Computer Graphics Forum 35: (3) ((2016) ), 431–440. doi:10.1111/cgf.12919. |
[11] | D. Eppstein and E.R. Gansner (eds), Graph Drawing, 17th International Symposium, GD 2009, Chicago, IL, USA, September 22–25, 2009. Revised Papers, Lecture Notes in Computer Science, Vol. 5849: , Springer, (2010) , https://doi.org/10.1007/978-3-642-11805-0. ISBN 978-3-642-11804-3. doi:10.1007/978-3-642-11805-0. |
[12] | B. Fitelson, A probabilistic theory of coherence, Analysis 63: (279) ((2003) ), 194–199, http://dx.doi.org/10.1111/1467-8284.00420. ISSN 1467-8284. doi:10.1111/1467-8284.00420. |
[13] | E. Francesconi and B. Verheij (eds), International Conference on Artificial Intelligence and Law, ICAIL ’13, Rome, Italy, June 10–14, 2013, ACM, (2013) , http://doi.acm.org/10.1145/2514601. ISBN 978-1-4503-2080-1. doi:10.1145/2514601. |
[14] | E.R. Gansner, Y. Hu and S.G. Kobourov, GMap: Drawing graphs as maps, in: Graph Drawing, 17th International Symposium, GD 2009, Chicago, IL, USA, September 22–25, 2009. Revised Papers, (2009) , pp. 405–407. |
[15] | E.R. Gansner, Y. Hu and S.G. Kobourov, GMap: Drawing graphs as maps, D. Eppstein and E.R. Gansner, eds, Springer Berlin Heidelberg, Berlin, Heidelberg, (2010) , pp. 405–407. ISBN 978-3-642-11805-0. doi:10.1007/978-3-642-11805-0_38. |
[16] | T.F. Gordon, Introducing the Carneades web application, in: International Conference on Artificial Intelligence and Law, ICAIL ’13, Rome, Italy, June 10–14, 2013, (2013) , pp. 243–244, http://doi.acm.org/10.1145/2514601.2514637. doi:10.1145/2514601.2514637. |
[17] | R. Görke, P. Maillard, A. Schumm, C. Staudt and D. Wagner, Dynamic graph clustering combining modularity and smoothness, ACM Journal of Experimental Algorithmics 18: (1) ((2013) ), 1.5:1.1–1.5:1.29, http://dl.acm.org/citation.cfm?doid=2444016.2444021. |
[18] | A. Gürkan, L. Iandoli, M. Klein and G. Zollo, Mediating debate through on-line large-scale argumentation: Evidence from the field, Information Sciences 180: (19) ((2010) ), 3686–3702, http://www.sciencedirect.com/science/article/pii/S0020025510002616. ISSN 0020-0255. doi:10.1016/j.ins.2010.06.011. |
[19] | T. Hartmann, A. Kappes and D. Wagner, Clustering evolving networks, in: Algorithm Engineering – Selected Results and Surveys, L. Kliemann and P. Sanders, eds, Lecture Notes in Computer Science, Vol. 9220: , Springer, (2016) , pp. 280–329, http://dx.doi.org/10.1007/978-3-319-49487-6_9. doi:10.1007/978-3-319-49487-6_9. |
[20] | P.D. Howe, M. Mildenberger, J.R. Marlon and A. Leiserowitz, Geographic variation in opinions on climate change at state and local scales in the USA, Nature Climate Change 5: ((2015) ), 596–603. doi:10.1038/nclimate2583. |
[21] | I. Hulpus, C. Hayes, M. Karnstedt and D. Greene, Unsupervised graph-based topic labelling using Dbpedia, in: Proceedings of the Sixth ACM International Conference on Web Search and Data Mining, WSDM ’13, ACM, New York, NY, USA, (2013) , pp. 465–474, http://doi.acm.org/10.1145/2433396.2433454. ISBN 978-1-4503-1869-3. doi:10.1145/2433396.2433454. |
[22] | M. Janier, J. Lawrence and C. Reed, OVA+: An argument analysis interface, in: Computational Models of Argument – Proceedings of COMMA 2014, Atholl Palace Hotel, Scottish Highlands, UK, September 9–12, 2014, (2014) , pp. 463–464, https://doi.org/10.3233/978-1-61499-436-7-463. doi:10.3233/978-1-61499-436-7-463. |
[23] | S.G. Kobourov, Force-directed drawing algorithms, in: Handbook on Graph Drawing and Visualization, (2013) , pp. 383–408. |
[24] | F. Loll and N. Pinkwart, LASAD: Flexible representations for computer-based collaborative argumentation, Int. J. Hum.-Comput. Stud. 71: (1) ((2013) ), 91–109, https://doi.org/10.1016/j.ijhcs.2012.04.002. doi:10.1016/j.ijhcs.2012.04.002. |
[25] | C. Lumer, Argument schemes – An epistemological approach, in: Argumentation: Cognition and Community. Proceedings of the 9th International Conference of the Ontario Society for the Study of Argumentation (OSSA), May 18–21, 2011, OSSA, Windsor, ON, (2005) , pp. 1–32. |
[26] | A. Nocaj, M. Ortmann and U. Brandes, Untangling the hairballs of multi-centered, small-world online social media networks, Journal of Graph Algorithms and Applications 19: (2) ((2015) ), 595–618, http://dx.doi.org/10.7155/jgaa.00370. doi:10.7155/jgaa.00370. |
[27] | OpMAP goes to open codes, https://opmap.github.io/journal/Open-Codes.html. |
[28] | F. Paglieri, A plea for ecological argument technologies, Philosophy & Technology 30: (2) ((2017) ), 209–238, https://doi.org/10.1007/s13347-016-0222-6. ISSN 2210-5441. doi:10.1007/s13347-016-0222-6. |
[29] | S. Parsons, K. Atkinson, Z. Li, P. McBurney, E. Sklar, M. Singh, K. Haigh, K. Levitt and J. Rowe, Argument schemes for reasoning about trust, Argument & Computation 5: (2–3) ((2014) ), 160–190, http://dx.doi.org/10.1080/19462166.2014.913075. doi:10.1080/19462166.2014.913075. |
[30] | S. Parsons, N. Oren, C. Reed and F. Cerutti (eds), Computational Models of Argument – Proceedings of COMMA 2014, Atholl Palace Hotel, Scottish Highlands, UK, September 9–12, 2014, Frontiers in Artificial Intelligence and Applications, Vol. 266: , IOS Press, (2014) . ISBN 978-1-61499-435-0. |
[31] | C.S.C. Paul, A. Kirschner Simon, J. Buckingham Shum (ed.), Visualizing Argumentation, Springer, London, (2003) . |
[32] | H. Prakken, An abstract framework for argumentation with structured arguments, Argument and Computation 1: (2) ((2011) ), 93–124. doi:10.1080/19462160903564592. |
[33] | Rationale argument mapping software, https://www.rationaleonline.com/. |
[34] | C. Reed, K. Budzynska, R. Duthie, M. Janier, B. Konat, J. Lawrence, A. Pease and M. Snaith, The argument web: An online ecosystem of tools, systems and services for argumentation, Philosophy & Technology 30: (2) ((2017) ), 137–160, https://doi.org/10.1007/s13347-017-0260-8. ISSN 2210-5441. doi:10.1007/s13347-017-0260-8. |
[35] | B. Saket, P. Simonetto, S.G. Kobourov and K. Börner, Node, node-link, and node-link-group diagrams: An evaluation, IEEE Trans. Vis. Comput. Graph. 20: (12) ((2014) ), 2231–2240, https://doi.org/10.1109/TVCG.2014.2346422. doi:10.1109/TVCG.2014.2346422. |
[36] | M. Salter-Townshend, A. White, I. Gollini and T.B. Murphy, Review of statistical network analysis: Models, algorithms, and software, Statistical Analysis and Data Mining 5: (4) ((2012) ), 243–264, http://dx.doi.org/10.1002/sam.11146. ISSN 1932-1872. doi:10.1002/sam.11146. |
[37] | V. Satuluri, S. Parthasarathy and Y. Ruan, Local graph sparsification for scalable clustering, in: Proceedings of the 2011 ACM SIGMOD International Conference on Management of Data (SIGMOD’11), ACM Press, (2011) , pp. 721–732, http://doi.acm.org/10.1145/1989323.1989399. doi:10.1145/1989323.1989399. |
[38] | M. Schippers and M. Siebel, Inconsistency as a touchstone for coherence measures, Theoria 30: (1) ((2015) ). |
[39] | D.C. Schneider, G. Betz and C. Voigt, Argunet – A software tool for collaborative argumentation analysis and research, in: 7th Workshop on Computational Models of Natural Argument (CMNA VII), F. Grasso, R. Kibble and C. Reed, eds, (2007) , pp. 57–61. |
[40] | J.N. Schupbach, New hope for Shogenji’s coherence measure, The British Journal for the Philosophy of Science 62: (1) ((2011) ), 125–142, http://www.jstor.org/stable/41241810. ISSN 00070882, 14643537. doi:10.1093/bjps/axq031. |
[41] | W. Talbott, Bayesian epistemology, in: The Stanford Encyclopedia of Philosophy, E.N. Zalta, ed., Summer 2011 edn, (2011) , http://plato.stanford.edu/archives/sum2011/entries/epistemology-bayesian/. |
[42] | R. Tamassia (ed.), Handbook on Graph Drawing and Visualization, Chapman and Hall/CRC, (2013) , https://www.crcpress.com/Handbook-of-Graph-Drawing-and-Visualization/Tamassia/9781584884125. ISBN 978-1-5848-8412-5. |
[43] | T. van Gelder, Using argument mapping to improve critical thinking, in: The Palgrave Handbook of Critical Thinking in Higher Education, M. Davies and R. Barnett, eds, Palgrave Macmillan US, New York, (2015) , pp. 183–192. |
[44] | C. Voigt, Argdown and the stacked masonry layout: Two user interfaces for non-expert users, in: Computational Models of Argument, S. Parsons, N. Oren, C. Reed and F. Cerutti, eds, IOS Press, Amsterdam et al., (2014) , pp. 483–484. |
[45] | D.N. Walton, C. Reed and F. Macagno, Argumentation Schemes, Cambridge University Press, Cambridge; New York, (2008) . doi:10.1017/CBO9780511802034. |
[46] | K.J.S. Zollman, Network epistemology: Communication in epistemic communities, Philosophy Compass 8: (1) ((2013) ), 15–27, http://dx.doi.org/10.1111/j.1747-9991.2012.00534.x. ISSN 1747-9991. doi:10.1111/j.1747-9991.2012.00534.x. |


