
Impact of global financial crisis on network of Asian stock markets
Abstract
This study examines the network dynamics of fourteen Asian Stock Markets (ASMs) in three phases (pre, during, and post) of financial crisis of 2008. Based on network statistics, I find that ASMs network is more interconnected during the crisis period than pre-and post-crisis period. Furthermore, using the Minimum Spanning Tree (MST) diagram, I find that the stock markets of Hong Kong, Japan, Korea, and India play a significant role in these networks and any shock to these markets can lead to contagion. The trade and the interest rate differential are the major driving forces behind these linkages. This work has practical implications as it provides insight on portfolio diversification during the crisis period and can also be used in anticipating the route of crisis.
1Introduction
The impact of the financial crisis of 2008 has continued with years of high unemployment, depressed housing market, declining growth, and inflated budgetary deficits in the advanced economics. Though Asia somehow escaped the crisis due to relatively limited exposure to subprime related financial instruments but the deleveraging process in advanced economies led to a substantial liquidation of assets and capital outflows in the region. This further caused a sharp decline in the equity markets, widening of sovereign bond spreads, depreciation of regional exchange rates and a decline in the offshore bank lending. The various economists agreed that the impact of the crisis was immense due to integration among the financial institutions at the global level. Therefore, it is essential to understand the level of integration (or interconnectedness) among the institutions in different part of the world because failure of one institution can lead to a cascading effect (Haldane, 2011). This study investigates how the Asian Stock Markets (ASMs) got affected due to interconnectedness by the crisis originated in the US.
Ansari (2009) states that the synchronization among the stock markets has changed after the globalization. But the past literature has divided view on this. Joe et al. (2012) studies the contemporaneous co-movements and lead/lag linkages between thirteen Asian stock markets from 2001– 2011 and find that the synchronization among the markets is declined during this period. On the other hand, Wang (2014) examined the impact of US stock market on six east Asian stock markets and conclude that the crisis of 2008 has strengthened the linkages among these markets. Using network analysis of fourteen Asian stock markets, I find that stock markets interconnectedness increases during the crisis period than the pre-crisis and post crisis period.
As the stock market integration develops due to the factors like bilateral trade, differential interest rates, Foreign Direct Investment (FDI) etc. Therefore, it is important to uncover those factors so that precautionary action can be taken during the events like crisis. Johnson and Soenen (2002) investigates the reasons for synchronization between Japan’s equity market and twelve other equity markets in Asia, and finds that the higher share of Japan in Asian economies’ imports and high inflation rate, real interest rates, and Gross Domestic Product (GDP) growth rate in these markets are negatively associated with the market co-movements. Instead, the increased share of Japan in Asian economies’ exports and larger foreign direct investment from Japan to other Asian countries contributes to greater co-movements. Walti (2005) finds that co-movements among the markets can be explained by the intensity of trade relations, the degree of financial integration, and the nature of the exchange rate regime. To confirm the factors driving the integration among the Asian stock markets, I use the panel data regression and find that trade and interest rate differential are the factors behind the stock markets interconnectedness in this region.
The integration among the stock markets can vary over time due to the changes in the underlying factors. And, it is important to understand this phenomenon because there are both pros and cons of integration of financial markets. On one side, the financial integration provides an opportunity for risk diversification but, on the other side, it also attenuates the potential risk of contagion. Iwatsubo and Inagaki (2007) investigates the stock market contagion between US and Asian markets using NYSE traded stocks issued by the Asian firms, and finds significant bilateral contagion effects in returns and return volatility. The contagion effects are stronger from the US market to the direction of the Asian market than in the reverse direction. This indicates the importance of US in information transmission to the foreign countries. Considering this, I apply the Kruskal algorithm on the network of ASMs during the crisis period and find the probable route of crisis from US stock market to ASMs. This route exhibits that crisis spread from US to ASMs through the Systemically Important Markets (SIMs). The stock markets of Japan, India, Korea, and Hong Kong are SIMs in this region and any shock to these markets can lead to contagion. The finding of SIMs is one of the significant contribution of this paper other than providing the insight on route of crisis.
This work has practical implications for the global investors especially in executing the investment strategy based on the network statistics and in showcasing how to diversify portfolio during the events like crisis. It can also benefit the policy makers in anticipating the route of crisis and by knowing the underlying factors in stock markets integration the impact of crisis can be controlled.
2Data
The daily values of closing indices for fourteen Asian stock markets are gathered from Global Financial Database for the sample period January, 2000 to September 2013. All index prices are expressed in local currencies.
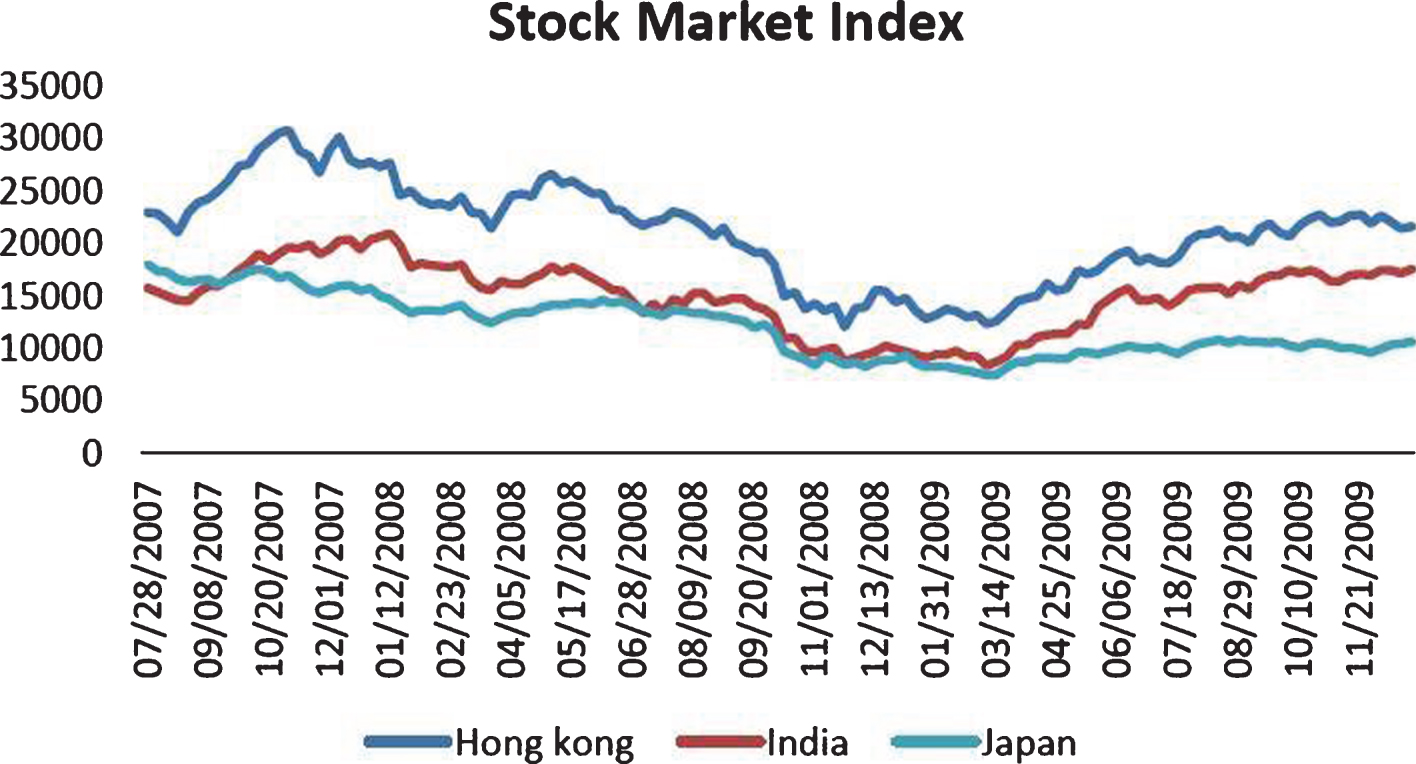
The graph of closing values for the major stock markets in Asian region shows the V-shape recovery after the decline from 2007– 2009. Therefore, to understand the dynamics of interconnections between these markets, I divide the sample into three sub-samples: pre-crisis (2000– 2006), during crisis (2007– 2009), and post-crisis (2010– 2013) based on V-shape recovery as shown in Fig. 1.
Fig.1
V-Shape Recovery of Asian Stock Markets.
If there is any missing point in any of the series, then that observation is replaced with the last available observation. This assumption would not cause any problem in calculations because missing value could be due to the “no trading” in that market on that day. Although the techniques like Kalman filter or Newton-Raphson could be employed to fill the missing values but these methods would also provide the approximate values and not the exact ones.
The stock market capitalization as a percentage of GDP (Table 1) is used as weights in computing the returns and the volatility at the network level. Annual data on this variable is collected from the Federal Reserve Bank (St Louis) database. Finally, to find out which parameters are driving these interconnections, panel data technique is used. For that, the bilateral data on independent variables- total trade, portfolio investment, interest rate differential, and Foreign Direct Investment (FDI) is gathered from the Asian Development Bank (ADB) database.
Table 1
Market Capitalization to GDP (in % )
| Year | Malaysia | India | Singapore | China | Hong Kong | Bangladesh | Srilanka | Japan |
| 2000 | 139.7 | 34.3 | 182.0 | 38.3 | 356.9 | 2.1 | 7.8 | 84.1 |
| 2001 | 127.4 | 25.7 | 147.5 | 42.3 | 335.8 | 2.4 | 7.3 | 60.7 |
| 2002 | 121.4 | 23.0 | 118.7 | 34.4 | 291.5 | 2.4 | 8.6 | 54.1 |
| 2003 | 132.8 | 33.7 | 177.0 | 35.0 | 313.8 | 2.7 | 11.5 | 62.1 |
| 2004 | 143.8 | 46.8 | 235.9 | 34.9 | 358.6 | 4.3 | 14.6 | 74.5 |
| 2005 | 132.5 | 56.6 | 242.8 | 32.2 | 374.1 | 5.2 | 19.1 | 91.3 |
| 2006 | 130.2 | 71.2 | 214.2 | 59.7 | 408.8 | 5.2 | 23.3 | 106.0 |
| 2007 | 148.4 | 109.8 | 189.1 | 125.2 | 480.2 | 7.5 | 23.0 | 104.5 |
| 2008 | 116.1 | 94.2 | 169.4 | 110.0 | 569.5 | 8.6 | 15.9 | 86.1 |
| 2009 | 107.1 | 64.8 | 142.5 | 79.2 | 524.4 | 7.6 | 14.3 | 68.8 |
| 2010 | 138.9 | 83.6 | 158.2 | 83.7 | 431.3 | 11.1 | 28.0 | 70.3 |
| 2011 | 144.1 | 69.7 | 148.1 | 58.8 | 396.8 | 17.3 | 33.8 | 68.8 |
3Methodology
In the literature on financial contagion, different research articles have proposed different methodologies but there is no single theoretical or empirical model for identifying contagion which is universally acceptable. Latent factor model (Bekaert et al., 2005), correlation analysis (Forbes & Rigobon, 2002), VAR frameworks (Favero & Giavazzi, 2002), and probability theory (Eichengreen et al., 1995) are few such techniques which researchers have discussed. Limitation of such techniques is that these evaluate only the direct linkages between the connected markets. On the other hand, network science and its related algorithms helps in exploring not only the direct connections but also the indirect ones.
Using the network theory, Setiwan (2011) investigated the stock market integration using the Minimum Spanning Tree (MST) diagram. Cupal et al. (2013) examines the changing topological characteristics of the correlation based network of European stock markets on both national and supranational levels. Roy and Sarkar (2013) developed a network based index to compute the change in the level and pattern of co-movement in the global stock markets.
In graph theory or in network science, a graph G = (V, E) consists of a finite nonempty set V and a collection E of unordered pairs from V (i.e. two element subsets of V). Every element in V is called a vertex or node of the graph and each unordered pair in E is called an edge of the graph. A graph without any parallel edges is a simple graph and if one or more real numbers are associated with each edge of a graph, the resulting structure is known as a weighted graph or a network.
Suppose G(n,k) is the graph with n number of nodes and k number of edges. For a better understanding, imagine a simple triangular figure which has 3 nodes and 3 edges. In this paper, nodes are the various stock market indices covered in the sample. Without assuming any shape of the network, let V and E be vectors of vertices and edges, which can be shown as
i.e viεV, i = 1, 2....n
Similarly,
i.e lmεE, m = 1, 2…k
Also eij is the edge from i to j, wherei ≤ n and j ≤ n ∀ i ≠ j
<Ri >represents the average return of the index i over a specified time period T consisting of say n days and it is given as
The condition for making the edge between the two nodes:
(1)
That means edge between any two nodes can be constructed if its weight is greater than or equal to some optimal threshold limit (φop) of correlation coefficient.
Computation of φop:
Let φs be any threshold limit,
Where, 0 < φs <1, s = 1,2,3...
Theorem: For every φs, there exists a graph G(t,u).
Proof of this theorem is provided in Appendix A.
Suppose a graph is formed from t stock markets indices and having u linkages. The average returns and standard deviation for this graph weighted by stock market capitalization to GDP ratio can be computed as follows:
(2)
(3)
E (R) and E (σ2) are the average return and the average volatility of a network and these values would vary with φ because network dimension (i.e. no of indices in particular network) changes with it. The equation for risk-return model can be showed as,
(4)
From the investor’s perspective, above equation can be exercised in maximising his utility function, which is given as
(5)
3.1Network statistics: Terminology and Definitions
a) Degree of Node: It is an integer count or the number of other nodes with which a given node has direct contact.
b) Density of Network: It is a proportion that is calculated as the number of all ties occurring in the matrix divided by the number of the possible ties. It is given as,
c) Centrality of Node: The centrality of the node can be calculated as the ratio of aggregate relations for a node by overall relations in a network i.e. centrality of node can be understood as the proportion of all network relations that involve node i
d) Clustering Coefficient: The clustering coefficient measures the average probability that two neighbours of a vertex are also neighbours to each other.
The overall level of clustering in a network is measured as the average of the local clustering coefficients of all the n vertices, Global clustering coefficient (or overall clustering coefficient) is computed as,
3.2Kruskal algorithm
The shortest path algorithm is widely used in the field of internet routeing and navigation apps like Google map. For this study, single source version of the algorithm is used. For a given source node in the graph, the algorithm finds the shortest path between that source node and all other nodes. It picks the unvisited vertex with the lowest distance, calculates the distance from it to each unvisited neighbour, and updates the neighbour’s distance if smaller. The U.S. is used as the source node to know how the crisis spread from there to ASM’s. A graph in which there is no sub-graph is called an acyclic graph, and the connected acyclic graph is known as tree.
Theorem 1
A graph is a tree if and only if there is a unique simple path between every pair of vertices in the graph.
Theorem 2
A graph is a tree if and only if every edge in it is a bridge.
Theorem 3
A connected graph with n vertices is a tree if and only if it has n-1 edges.
An acyclic graph with n vertices is a tree if and if it has n-1 edges.
A spanning tree is a set of paths that link vertices or nodes (in this case stock markets) in such a way that there is one and only one path between any pair of vertices. The Minimum Spanning Tree (MST) is obtained by iterating such processes so that total distance of paths in the tree is minimal.
Theorem 4
A spanning tree T in a graph G is a minimal spanning tree if and only if every chord of the tree is a maximum weight edge in the unique fundamental cycle defined by that edge. MST can be drawn using any one of the greedy algorithms like Prims, Kruskal or Boruvka, for this study Kruskal algorithm is used. The advantage of the MST is that it forms the cluster of the markets under investigation, and by examining the length of the trees over fixed time intervals we can judge the degree of integration throughout the observation period. To apply the Kruskal algorithm, firstly cross-market correlation coefficients are transformed into ultrametricity distance using the formula given by the Kruskal,
Theorem 5
Let G be an undirected connected graph. Kruskal’s algorithm generates a minimum cost spanning tree.
To provide causation for correlations on which network is constructed, the panel data regression is computed using the total trade, portfolio investment, interest rate differential, and Foreign Direct Investment (FDI) as the explanatory variables. The panel model is given below:
4Results and discussion
4.1Changing synchronization among the Asian stock markets
Network analysis of ASMs shows that the interdependence of these stock markets increases during the crisis period than the pre-crisis and the post-crisis period. This happened due to either financial integration or due to a change in trade intensity. The proof of the first premise of the paper that the network of stock markets becomes denser during the crisis than pre-crisis or post-crisis can be inferred from the network diagrams in Figs. 2, 3 and 4, network density metric for these network diagrams is provided in Table 2. The network density is 0.69 during the crisis period, which is higher than that of pre-crisis and post-crisis values of 0.55 and 0.53 respectively. This proves the first premise that during the crisis interconnectedness from the stock markets in Asian region increased as compared to pre-and post crisis period.
Fig.2
Network of Asian Stock Markets in Pre-Crisis Period.
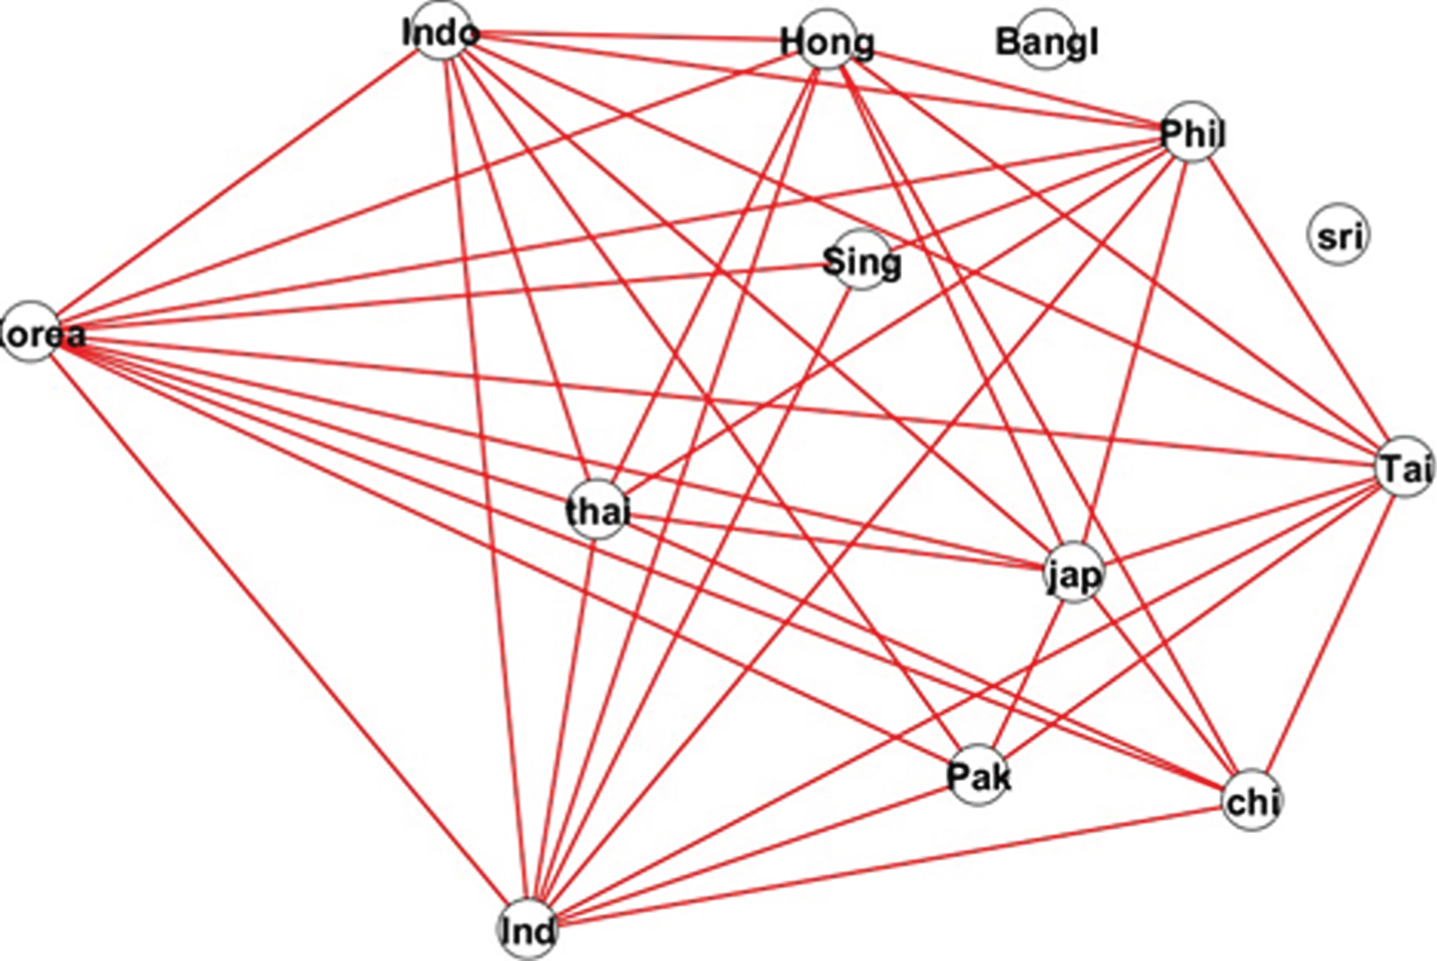
Fig.3
Network of Asian Stock Markets in Crisis Period.
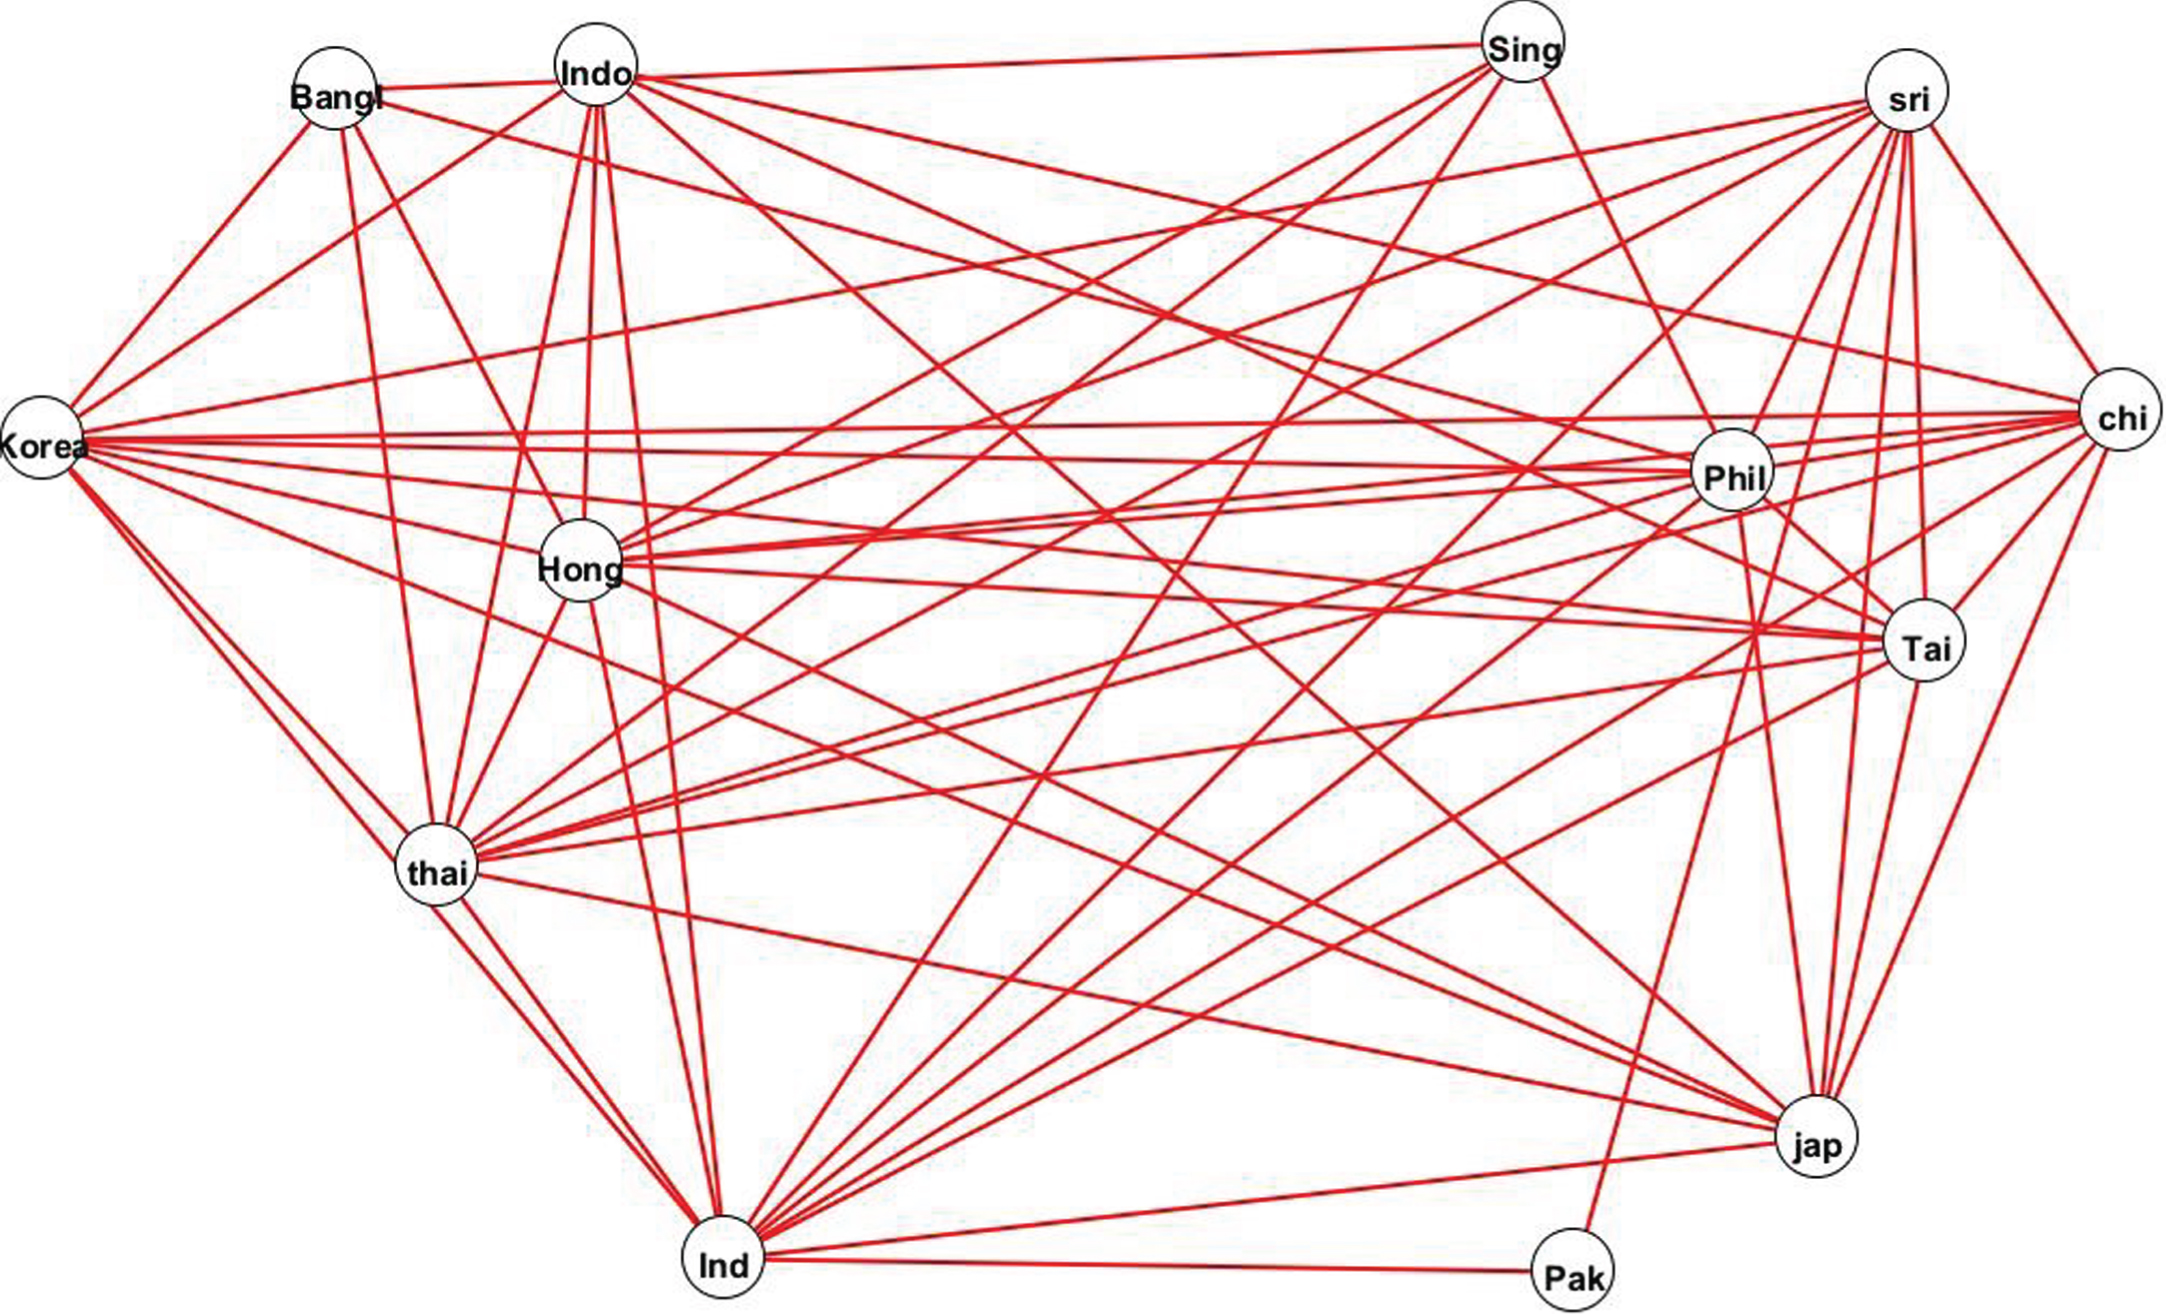
Fig.4
Network of Asian Stock Markets in Post-Crisis Period.
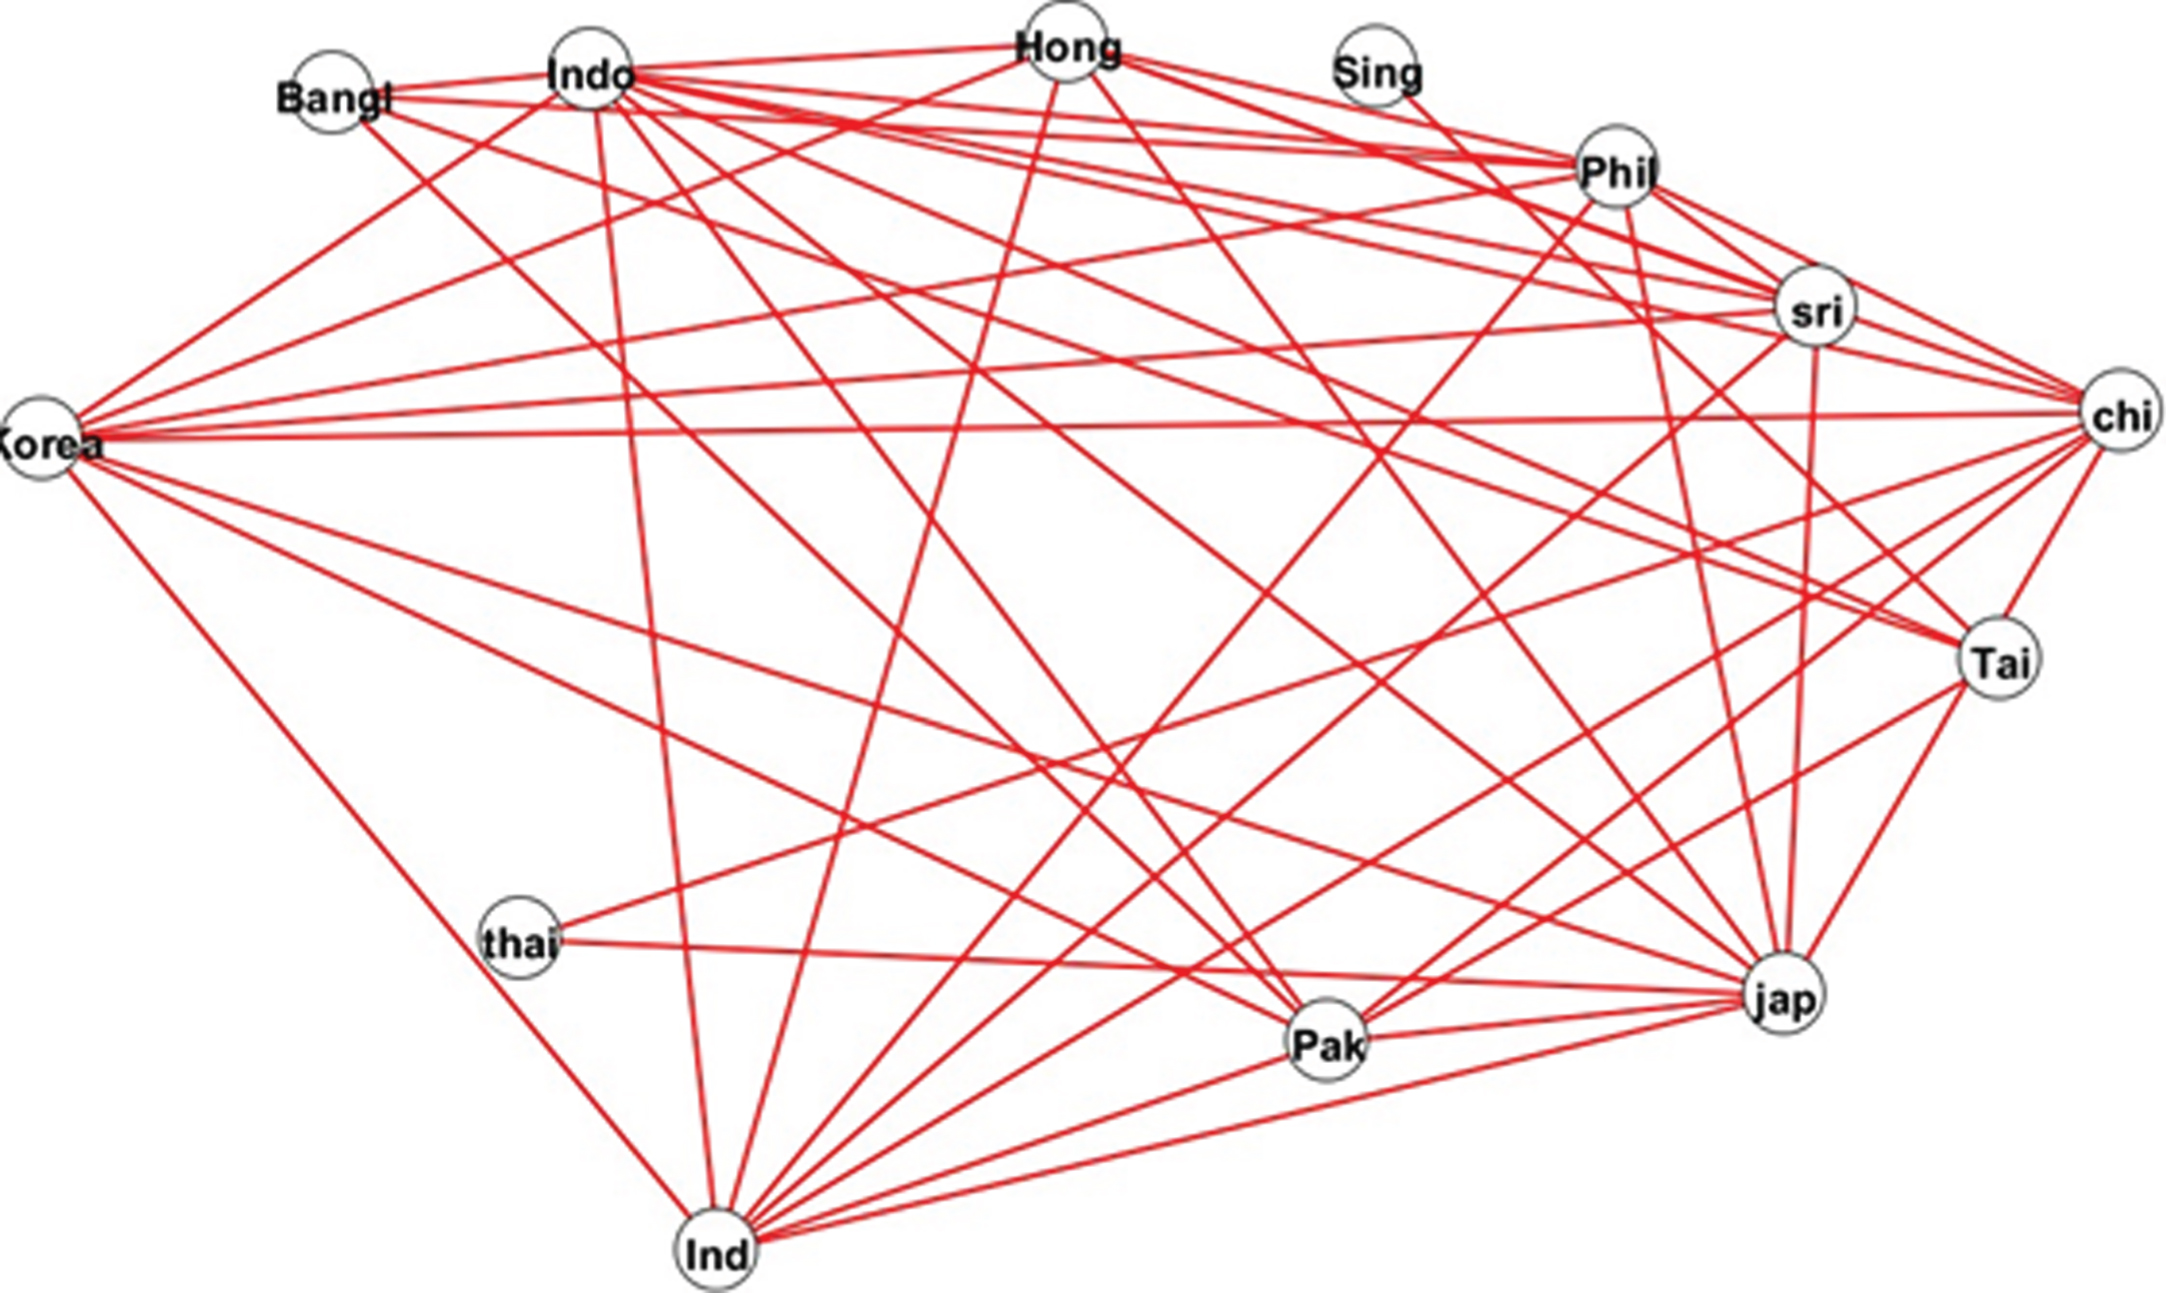
Table 2
Network Density is a proportion that is calculated as the number of all ties occurring in the matrix divided by the number of the possible ties
| Pre-Crisis | 0.54 |
| During Crisis | 0.69 |
| Post-Crisis | 0.53 |
4.2Country-wise interpretation of network statistics
Bangladesh, Sri Lanka, and Singapore: Figure 2 displays the unusual behavior of two stock markets, Dhaka Stock Exchange (DSE) and Colombo Stock Exchange (CSE). In the network of pre-crisis period, these two are not connected with other stock markets in the region which could be due to low stock market capitalization to GDP ratio during that period for these indices. As market capitalization improved in the post-crisis period, these indices joined the network. Even in the during-crisis network (Fig. 3) these two stock exchanges seem well connected with other members which is evident from the fact that their degree of node increased from 0 to 4 for DSE and from 0 to 8 for CSE.
As per risk-return theory, investors always look for an opportunity to diversify their portfolio. For them, secluded stock markets like DSE and CSE would be preferable for diversifying their portfolio because these markets are less connected, therefore, would be less risky. On the other side, more interlinked stock markets carry high risk as number of interlinkages increases the probability of domino effect and also, these markets provide the same kind of return if they are highly correlated. But it is not certain that the isolated stock markets would provide better returns all the time. This can be the case when such markets would be suffering from political instability, currency crisis, closed economy, limited financial openness and similar other problems. In fact, CSE and DSE stock markets are not connected in the pre-crisis period network due to the same reasons. During this period, Sri Lanka faced a civil war and Bangladesh suffered from an energy crisis and poor infrastructure which prevented the flourishing of foreign investment in these countries.
Another stock market which preferred to delink itself from the network is Singapore’s stock market. It is loosely connected in the post-crisis network which can be explained by its degree of nodes which is 3 in pre-crisis and 1 in post-crisis. The rationale behind this could be strict financial regulation and other controls which the central bank of Singapore put on the commercial banks during the crisis.
From 2008 onwards (refer Fig. 4), on the onset of the global recession, these economies became well synchronized with other Asian countries and the relative impact of the crisis in the form of currency depreciation, interest rate change, decline in FDI, reduction in remittances and similar other factors begun to hit these Asian countries almost equally.
Hong Kong: This stock exchange is one of the SIMs. But this should not be surprising as it has a high financial and trade openness with 92% contribution from the service industry. Its financial industry covers all aspects of financial business-like stock and shares companies, commodity futures, gold bullion, and foreign exchange brokers/dealers, fund management companies and firms providing other financial services. In 2006, its financial businesses provide the value addition of roughly 4.1% of GDP, but the same number made this index vulnerable to crisis.
India: Another SIM is Indian stock exchange, BSE. It is the oldest stock market in Asia; world’s third largest stock market on the basis of investor base and has a collective pool of about 20 million investors. There are over 9,000 companies listed on the stock exchanges of the country. This stock market started showing signs of integration with other stock markets of Asia and abroad after the year 2000 due to its robust growth, relaxed regulations, and a deluge of cross-border capital flows. Its connectivity can be seen in its degree of nodes and clustering coefficient which are high throughout the period. These consistently high network metrics for this stock exchange could be explained by the fact that the Indian central bank never allowed the Non-Banking Finance Companies (NBFCs) to be used by the commercial banks as arbitrage for the delivery vehicle. It means commercial banks could not able to benefit by less regulated NBFCs in selling the risky loans.
Other factors for such high network statistics can be the Reserve Bank of India (RBI) rule on loosening the collateral requirement to promote short-term liquidity and other measures to manage liquidity by controlling cash reserve ratio, statutory liquidity ratio and through open market operations. RBI has always taken the calibrated approach towards opening the capital account and this conservatism reflects in the BSE market as it is less impacted by the crisis.
South Korea and Philippines: Countries like South Korea and Philippines not affected by the 2007 crisis as much as they affected by the 1997 crisis; possibly due to financial reforms, accumulated international reserves and less exposure to sub-prime related instruments. This is one of the reasons that these stock markets appeared as major nodes in the during-crisis network, as the degree of nodes rose from 9 to 12 for the PSI (Philippines stock market) supporting the notion of integration. The reforms like aggregate credit ceiling, currency swap of 30 billion USD with Federal Reserve and 100 billion Yuan with People Bank of China, reducing the interest rate on six occasions, and injecting liquidity worth 18.5 trillion Won helped in the growth of the economy. Thus, not only this stock market remained unaffected by the crisis but also the exchange commission took positive initiatives for its development. Because of all this, it emerged as the systemically important stock market.
Thailand: Thailand Stock Exchange Index (TSEi) is another important market in the region. During the crisis, the index was highly fluctuating and declined as foreign funds worth more than 2 billion US dollars retreated from the market in a space of a few months. But, the manner in which the authorities tackled the banking problems is highly appreciable. The government embarked on a comprehensive restructuring of the financial sector, intervened in weak banks and focused on recapitalization, debt restructuring, reform of the regulatory and supervisory framework, strengthening corporate governance of banks, and introducing initiatives to deepen and broaden the capital market.
Due to this robust financial structure before the crisis, TSEi developed as a major player in the network with a high degree of node and clustering coefficient of 8 and 0.87 respectively. Due to the increase in integration of stock markets during the crisis period, its degree of node and clustering coefficient increased to 11 and 0.976 respectively. But after the crisis, degree of node reduced to 2 and clustering coefficient plummeted to 0.136. This could be due to the impact of capital flight or dormant export sector or might be due to the civil war between supporters of Thaksin Shinawatra, former prime minister, and loyalists of Abhijit Vejjajiva, newly throne prime minister. In the civil war, Thailand lost around 5 billion USD which reduced the confidence of investors on this economy in the post-crisis period.
Japan: Nikkei 225 index sky-rocketed to 18,621 on July 9, 2007, but due to capital reversal by the developed countries, the index came down to a dismal four-digit number. However, according to the IMF, the financial crisis did not affect Japan much because it has household savings of 14 trillion USD from trade surpluses and frugal lifestyles to finance its immense 8.1 trillion USD fiscal deficit. Even after repaying debt, it still has enough money left to be the world’s largest creditor nation.
Nonetheless, Japan did its endeavor to save South Asia from the crisis so that it could protect its own export market from drowning due to dwindling global demand. To escape the crisis effects, it swapped currency with Korea worth 39 billion USD and invested in logistic systems and created new shipment links with ASEAN, China, India, South Korea, Australia and New Zealand (World Bank, 2008, Kawai & Takaji, 2010). This might be the probable reason that its degree of node maintained at 9 and its clustering coefficient, on average, is 0.9 implying that this index would be well connected to the Asian stock markets in the future too.
China: Shanghai Stock Market index of China suffered a capital reversal when the stock market crashed in October 2007, wiping out two-thirds of its market value but foreign capital flows rebounded as soon as FDI touched 124.93 billion USD after falling to 121.68 billion USD in 2008 itself (Zhang & Willet, 2012). As FDI and equity investment are positively correlated, we can state that Shanghai stock market became more significant after the crisis period which can be understood by the increase in the degree of nodes from pre-crisis to post-crisis by 2 and increase in clustering coefficient from 0.672 to 0.87 (Das, 2010).
Indonesia: Jakarta Stock Exchange Index (JSE) of Indonesia dropped from 2,746 in the fourth quarter of 2007 to 1,326 in December 2008 showing the signs of arrival of the financial crisis in the country. Furthermore, sub-manufacturing exports like vegetable oils and fats, spinning, textiles, refined petroleum, paper products, chemicals and chemical products, rubber and plastic products, non-iron metal products, machinery and equipment, and furniture showed sign of decline (Djaja, 2010). All this is captured by the decline in the degree of nodes during the crisis. But Japan and multilateral financial institutions such as World Bank and Asian Development Bank (ADB) supported its financial markets by providing development policy loans. Its stock market gained systemic importance in the network in post-crisis period and its degree of node and clustering coefficient increased.
Pakistan: Karachi Stock Exchange, KSE-100, plummeted around 60% from 2007 to 2009; however, the outflow of portfolio investment from Pakistan does not impacted much, only $510 million, given the magnitude of its market capitalization. This is an indication of the non-integration of the domestic market with international markets during the crisis. Another possible reason for the low degree of the node could be the amount of remittances from US, UAE, Saudi Arabia and the UK. Even though during the crisis, capital inflow from the US went down but from the other regions remittances remained intact, 7.8 billion USD in 2008-09 (Din & Khawaja, 2010); this steady stream of inflows can be explained with the help of life cycle hypothesis of Modigliani (1954).
Singapore: The most surprising result is the low nodal degree of Singapore’s stock exchange (SGX) in the pre-crisis network and linkages only to major stock markets like BSE, PSEi and KOSPI Composite index. The financial regulations adopted by its central bank like the effective use of exchange rate and wage instruments, the introduction of the Job Credit Scheme, and the Special Risk-Sharing Initiative, and liberalization of Singapore dollar kept the economy safe and sound. Because of all these initiatives, it behaved differently from other economies and less connected in the during-crisis network. Though its integration with other stock markets increased during the crisis but relative to other markets it stayed loosely connected.
All the above case studies of different countries show that, on average, network of Asian Stock Markets became concentrated during the crisis and start spreading after the crisis. It can be understood by the values of Degree of Nodes and Clustering Coefficient in Tables 3 and 4. Thus, a policy maker can use these networks and MST to draw outlines for financial regulations so that the stock market of the country can be shielded from the economies which are more vulnerable during the time of crisis.
Table 3
Degree of Node is an integer count or a number of other nodes with which a given node has direct contact
| Pre-Crises | Crises period | Post Crises | |
| Bangladesh | 0 | 5 | 4 |
| Philippines | 8 | 10 | 8 |
| Thailand | 8 | 11 | 2 |
| Pakistan | 5 | 2 | 7 |
| Hong Kong | 8 | 11 | 7 |
| India | 10 | 11 | 8 |
| Singapore | 3 | 5 | 1 |
| Korea | 10 | 10 | 8 |
| Japan | 9 | 9 | 9 |
| Srilanka | 0 | 9 | 6 |
| Taiwan | 9 | 9 | 4 |
| China | 6 | 9 | 8 |
| Indonesia | 8 | 7 | 10 |
Table 4
The Clustering Coefficient measures the average probability that two neighbours of a vertex are themselves, neighbours
| Pre-Crises | Crises Period | Post Crises | |
| Bangladesh | 0.000 | 0.429 | 0.320 |
| Philippines | 0.807 | 0.886 | 0.808 |
| Thailand | 0.867 | 0.976 | 0.133 |
| Pakistan | 0.488 | 0.111 | 0.591 |
| Hong Kong | 0.867 | 0.976 | 0.800 |
| India | 1.000 | 0.938 | 0.873 |
| Singapore | 0.240 | 0.419 | 0.000 |
| Korea | 1.000 | 0.914 | 0.873 |
| Japan | 0.952 | 0.872 | 0.909 |
| Srilanka | 0.000 | 0.795 | 0.682 |
| Taiwan | 0.952 | 0.872 | 0.333 |
| China | 0.625 | 0.872 | 0.784 |
| Indonesia | 0.847 | 0.667 | 0.949 |
4.3Spread of crisis from the US to Asian stock markets
The world enjoyed the period of boom since the beginning of the twenty-first century and the same is true for global equity and financial markets. Not only the Wall Street but equity markets in other parts of the world too touched new heights. Asian equity markets are no different. Rising defaults in the US sub-prime mortgage markets begun during the latter part of July 2007, sparking a sell-off in the equity markets. This raised a question mark regarding the health of the US economy and failings and limitations in its financial markets, in particular, came to light. As global leverage and risk appetite declined, Asian equity markets also start losing its charm.
For the Asian equity markets, later half of 2007 became a period of volatility. This could be regarded as the contagion effect of the market turmoil in the US. As global equity investors exited, all major Asian markets turned negative. In September and in October 2007, the downward movement of the stock indexes in Asia accentuated. In the third quarter of 2007, the contagion effect begun to affect Asian financial markets more widely. The US-led slowdown upraised the serious concerns. Market players commence surmising about the severity and length of the slowdown and its future impact.
Falling equity markets in emerging Asia broke the myth that Asia has decoupled from the advanced industrial economies. Akin and Kose (2008) and He et al. (2007) established that the business cycles in the Asian EME’s and the advanced industrial economies are interdependent. By the end of the first quarter of 2008, most stock indices dropped significantly. Their decline ranged between 15 percent and 25 percent, and investors sentiments turned negative internationally. In such scenario, only two equity markets in emerging Asia performed well by recording relatively smaller declines, Taiwan and Thailand. In these markets, indices fell less than 10 percent.
To study the spread of crisis, US stock market (Dow Jones Industrial Average, DJAE) is introduced in the pre-crisis network shown in Fig. 1. This network diagram (Fig. 5) illustrates the position of US stock market in the network and shows how DJAE is connected to all the SIM’s as well as to the markets of Thailand, Philippines, Malaysia and Taiwan. An application of Kruskal algorithm on this network generates the Minimum Spanning Tree (MST) shown in Fig. 6.
Fig.5
US in Network of ASMs in Pre-Crisis Period.
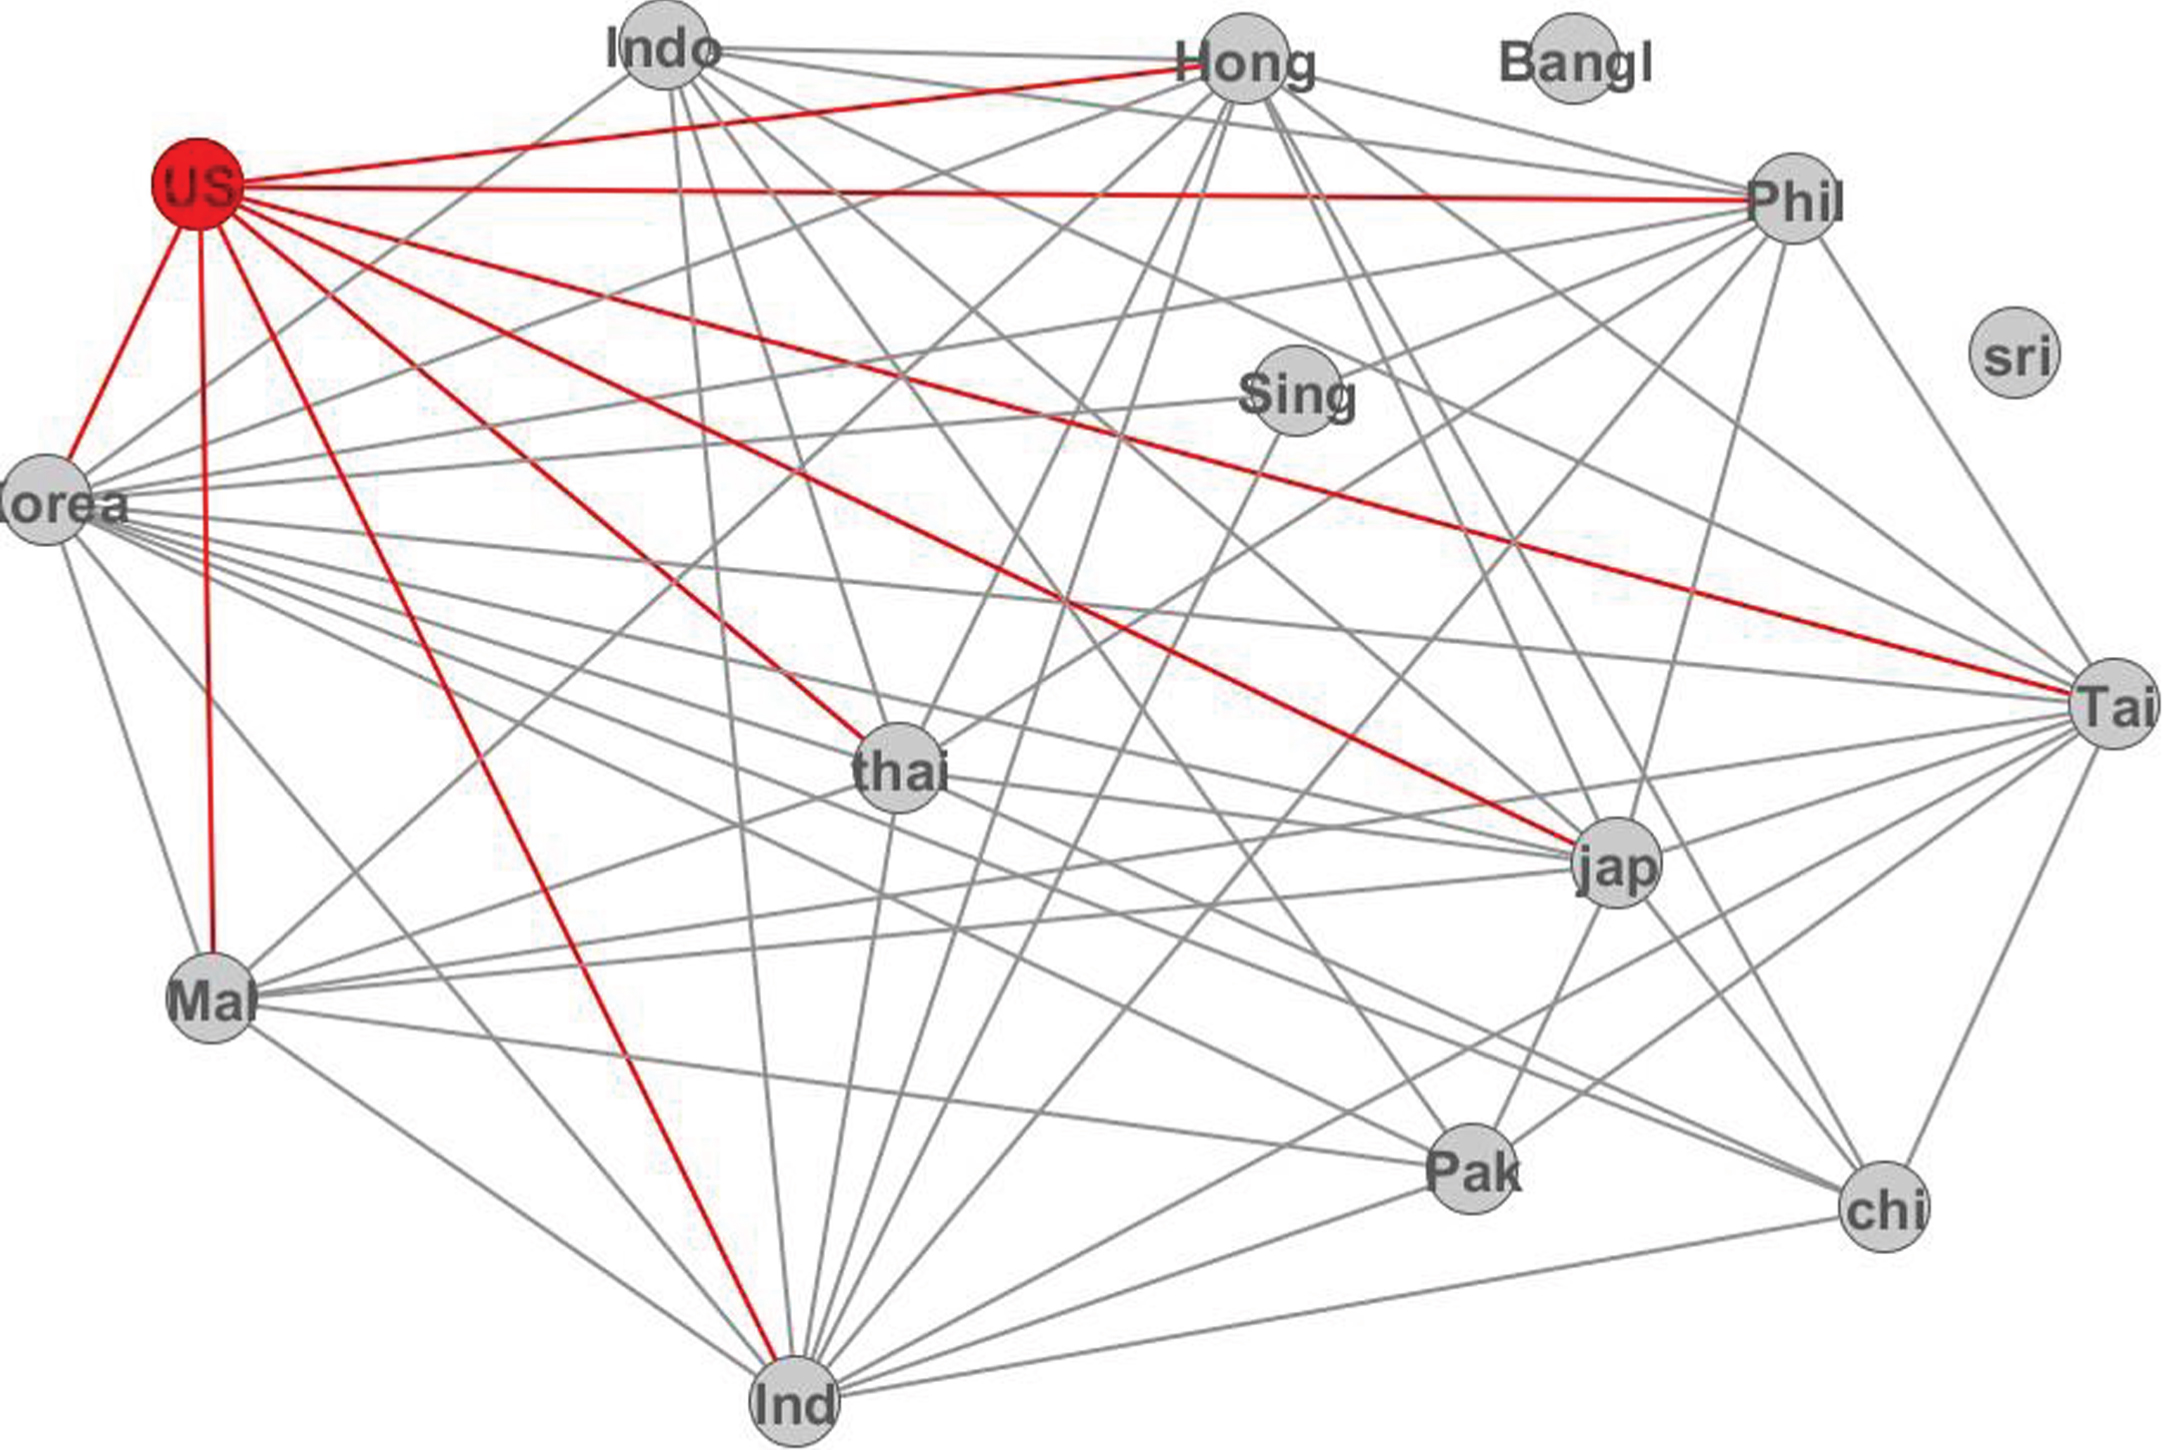
Fig.6
Spread of Crisis from US stock market to Network of ASMs.
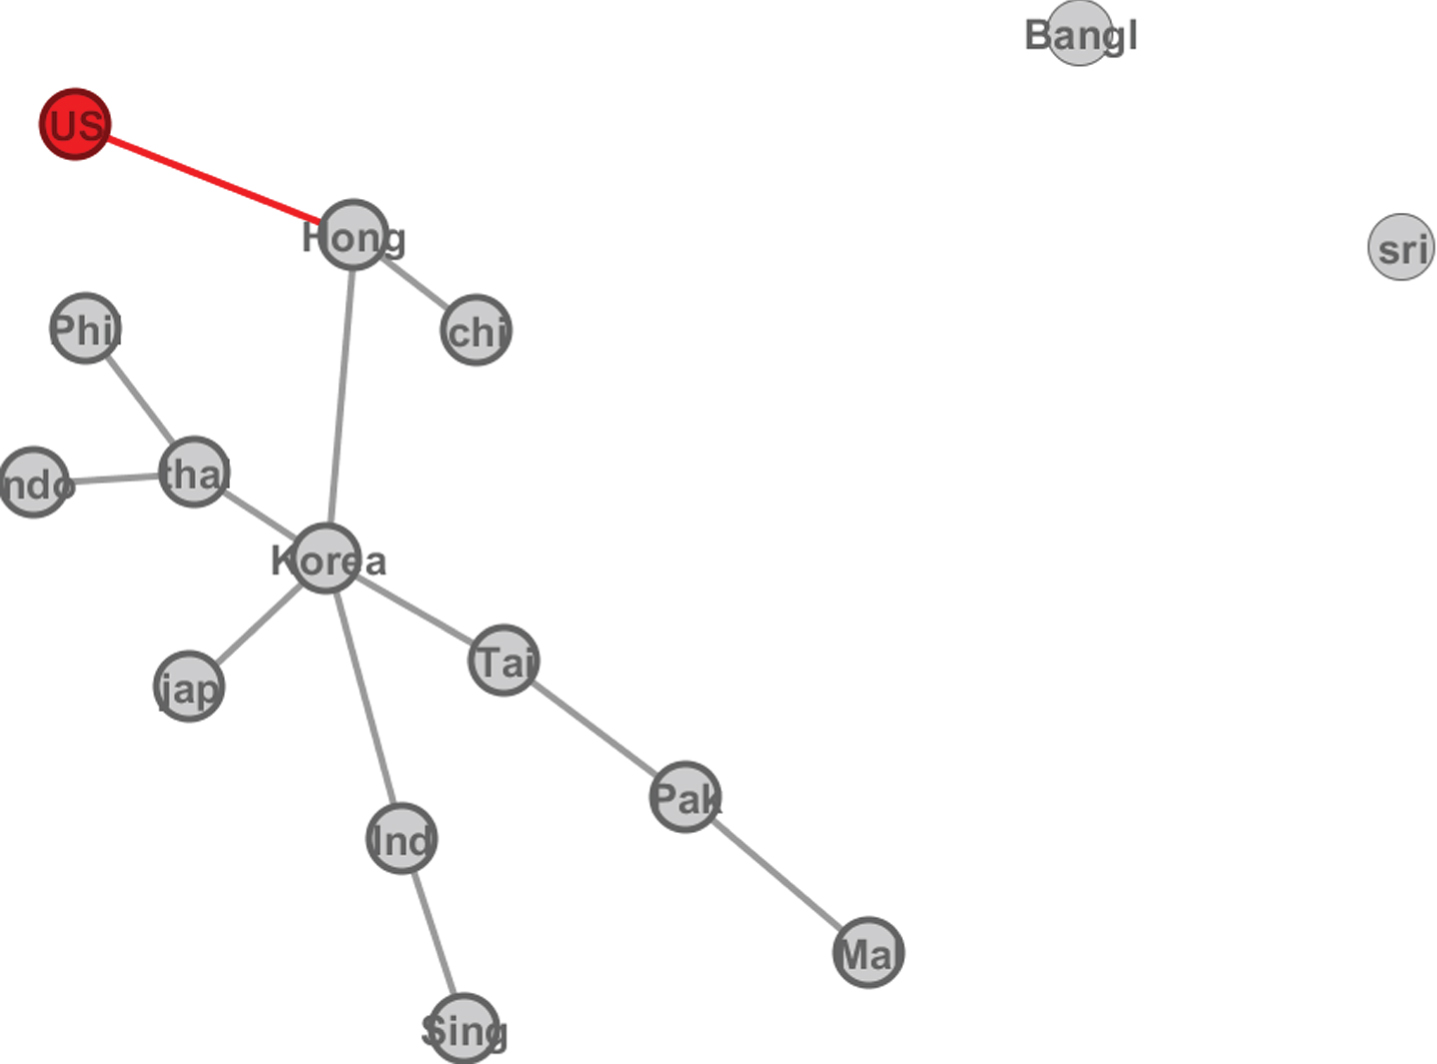
This tree diagram shows that the crisis which originated in the US hit the Hong Kong stock market first, this result seems intuitively correct as Hong Kong is one of the most active and liberal debt markets, a leading asset management center in Asia and this country has the presence of 152 out of the 500 largest banks in the world. Hence, when the crisis hit this stock exchange, its index fell by 15% in September 2007 and then plummeted by 22% in October. The Shanghai Stock Market index affected due to high correlation with Hang Sang index which could be easily understoodk by the fact that since July 1933 when the first Chinese state-owned company listed on the Hang Sang index through issuance of H shares, Hong Kong emerged as a major fund-raising center for the mainland China and has become increasingly important to the Chinese business and by the end of 2007, 146 H shares has listed on the Hang Sang exchange, with market capitalization of $ 5,080 billion.
After the Hong Kong stock market, contagion reach the KOSPI composite index of Korea. From the MST of pre-crisis, it is not hard to acknowledge that as Korean stock market hit by the crisis, its impact on this stock market provide the route to contagion in other systemic important stock markets like India and Japan and other smaller stock markets like Thailand and Philippines. There are couple of reasons for Korean stock market to act as a central node, firstly, by reducing the interest rate at 6 occasions, it managed the economy well at the time of crisis and secondly, it put the stimulus of 18.5 trillion KRW in the market to boost the investment. This stimulus is equivalent to 28.5% of revenue generated at the end of 2008. The currency depreciation by 20– 25% also does not affect the Korea much as it already had taken precautionary measure like the currency swap arrangements with the US and with the China of 30 billion USD and 180 billion Yuan respectively which emanated as a saving grace at the right time.
In the end, a panel data analysis provides the insight on the factors affecting the relationship between the stock markets in the Asian region. The result of panel regression in Table 5 shows that for linkages between stock markets in the Asian region, interest rate differential and trade are the significant factors which drive the relation between these stock markets. The results are perceptive as it shows that when interest rate differential is high, the correlation between the markets reduces and vice versa. Similarly, when trade increases between these countries, correlation coefficient increases. In short, trade between the countries impacts the correlation between the stock market returns of the indices.
Table 5
Interest Rate Differential is as the difference between the interest rate of two countries. Foreign Direct Investment (FDI) is direct investment by one country into another. Portfolio Investment is investment by one country into the stock market of another country. Trade is total trade between the two countries. FDI, Portfolio Investment, and Trade is measured in millions USD
| Variable | Fixed | Random |
| Interest Rate Differential | – 0.1124* (0.0504) | – 0.1124* (0.0482) |
| FDI | 0.0391 (0.864) | 0.0391 (0.850) |
| Portfolio Investment | – 0.0571 (0.801) | – 0.0517 (0.781) |
| Trade | 0.1109* (0.0498) | 0.1109* (0.0502) |
Hausman Result: Random (P value: 0.08). *Significant at 5%.
Although panel data analysis in the pre, during and post-crisis period would have helped us to know which factor has prime importance in which period; but unavailability of sub-sample wise observations restricted the analysis. But for future research, more variables like exchange rate and news related to these stock markets can also be used as the explanatory variable in the regression analysis.
5Conclusion and implications
Using network analysis of Asian stock markets, I show that these markets are more interconnected during the crisis period in comparison to the pre-crisis and post-crisis period. Further, on the introduction of the US stock market in the pre-crisis network provides the insight on connections of US market with Systemically Important Markets (SIMs). As per the analysis, SIMs decide the probable route of the crisis in the Asian region and this I find out using the Kruskal algorithm. In the end, using the panel data regression, I illustrate that the interest rate differential and the trade are the factors which govern the interconnectedness of Asian stock markets.
This study contributes in the area of portfolio diversification and financial contagion literature. It can be useful for global investors in optimizing their equity portfolio by understanding the systemic risk in the Asian Stock Markets (ASM) and by keeping an eye on the route by which shocks can spread in the ASM network. Secondly, this would also help them to take the speculative position like taking a long position in the markets which are at the periphery and a short position in the markets which are at the core especially at the time of recession. For future work, this area can be explored further for constructing the portfolios based on the network position of the stock markets. The results of spanning tree diagram can help the policy maker in introducing reforms and take precautionary measures which can protect the financial institutions from any shock or crisis which originated somewhere in the region or in an advanced country like the US and spread to their country.
Appendices
Appendix A
Theorem: For every threshold limit, φop, there exists a graph,
Solution: As φop is nothing just a correlation coefficient. Therefore,
Now, suppose φop = 0.5
That implies a network (or graph, G) can be formed using the edges, eij and in that network each edge’s weight is less than equal to 0.5.
Where, i = 1, 2, 3, 4... 14 and j = 1, 2, 3, 4... 14 but i ≠ j.
Here, i and j are vertices or nodes.
Similar exercise can be done for, φop= 0.1, 0.2, 0.3... 1 and corresponding networks can be drawn.
This proves that there is one to one mapping between φop and G, or ∃φop : G.
| Node Symbol | Stock Index of Country |
| Indo | Indonesia |
| Korea | Korea |
| Hong | Hong Kong |
| Bangl | Bangladesh |
| Sri | Sri Lanka |
| Sing | Singapore |
| Tai | Taiwan |
| Pak | Pakistan |
| chi | China |
| Ind | India |
| Thai | Thailand |
| Jap | Japanese |
| Phil | Philippines |
| US | United States |
Notes
* Newman (2009) and Knoke (2012).
Acknowledgments
I wish to express my sincere thanks to my M.Phil. supervisor, Assistant Professor Rajeswari Sengupta, IGIDR, for her valuable guidance and endless encouragement at all stages of this study. Addition to that, I am also indebted to Dr Guruswamy Babu (IGIDR), Dr Rajeeva Karandikar (Director, CMI), Dr Alex Teytelboym (Oxford University) and Dr Michael Bykhovsky (Center for Open Economics, Columbia University) for reviewing the work and providing the useful comments.
References
1 | Cupal M. , Deev O. , Dagmar L. , (2013) . Network structures of the European stock markets, Proceedings of 30th International Conference Mathematical Methods in Economics. |
2 | Roy Babu R. , Sarkar Kumar U. , (2011) . Network Approach to capture co-movements of Global Stock Returns, IIMC Working Paper, 2011. |
3 | Kruskal J.B. , (1956) . On the shortest spanning subtree of a graph and the travelling salesman problem, Proceedings of the American Mathematical Society 2: , 48–50. |
4 | Sharma P. , (2011) . Asian Emerging Economics and the United States of America: Do they offer a Diversification Benefit? Australian Journal of Business and Management Research 1: , 85–92. |
5 | Wang L. , (2014) . Who moves East Asian stock markets? The Role of the 2007-2009 global financial crisis, Journal of International Financial Markets, Institute and Money 28: , 182–203. |
6 | Mohan R. , (2008) . Global Financial Crisis and Key Risks: Impact on India and Asia, Remarks prepared for IMF-FSF High-level Meeting on the Recent Financial Turmoil and Policy Responses at Washington D.C. |
7 | Daly K. , Thao P.T. , (2012) . The impacts of the global financial crisis on southeast asian equity markets integration, International Journal of Trade, Economics and Finance 3. |
8 | Tori H. , Sriyalatha K. , (2013) . Interdependence of the Stock Markets, Before and During the Economic Crisis: The case of East and South Asia. |
9 | Walti S. , (2005) . The macroeconomic determination of stock markets synchronisation, Trinity College, Dublin. |
10 | Newman M. , (2008) . The Physics of Networks, Physics Today 33–38. |
11 | Haldane A.G. , (2009) . Rethinking the Financial Network, A speech delivered at the Financial Student Association, 1–41, Amsterdam. |
12 | Setiawan K. , (2011) . On the dynamics of stock market integration: A minimum spanning tree analysis, The International Journal of Economic Policy Studies 6: , 3. |
13 | Forbes K.J. , Rigobon R. , (2002) . No contagion, only interdependence: Measuring stock market co-movements, The Journal of Finance 57: , 2223–2261. |
14 | Barbasi A.L. , Albert R. , (2002) . Statistical mechanics of complex networks, Reviews of Modern Physics 74. |
15 | Bessler D. , Yang J. , (2003) . The structure of interdependence in international stock markets, Journal of International Money and Finance 22: (2), 261–287. |
16 | Karolyi G.A. , Stulz R.M. , (1996) . Why do markets move together? An investigation of U.S.- Japan stock return co-movements, Journal of Finance 51: (3), 951–986. |
17 | Kose M. , Prasad E. , Terrones M. , (2003) . How does globalization affect the synchronisation of business cycles? American Economic Review 93: , 57–62. |
18 | Knoke D. , (2012) . Economic Networks, Polity Press, Cambridge, UK. |
19 | Balakrishnan V.K. , Network Optimization, Chapman and Hall Publication, UK, London. |
20 | Hongliu C. , An Analysis of the Hong Kong Economy after the Financial Crisis, Proceedings of the 7th International Conference on Innovation and Management. |
21 | Das D. , (2010) . The Asian Economics and The Global Financial Crisis”, Research Paper No 2010-01, September. |
22 | Knoke D. , Kolinsky J.H. , Network Analysis, Quantitative Applications in the Social Sciences, Sage University Paper. |
23 | Newman M.J. , (2009) . Networks: An Introduction, Oxford University Press, US. |
24 | Hesse H. , Frank N. , (2009) . Financial Spillover to Emerging Markets During the Global Financial Crisis, IMF Working Paper, Monetary and Capital Markets Department, WP/09/104. |
25 | Khwaja I. , Din M. , Ejah G. , (2010) . Global Financial Crisis Policy Implication for Pakistan. |
26 | World Bank, (2008) . Impact of Global Financial Crisis on South Asia, Washington, DC: The World Bank. |
27 | Ansari M. , (2009) . Impact of globalisation on stock market synchronisation: Some empirical evidence, International Journal of Commerce and Management 19: (3), 208–221. |
28 | Kawai M. , Takaji S. , (2010) . Why was Japan Hit so Hard by the Global Financial Crisis, ADB Working Paper no 159, October. |
29 | Djaja K. , (2010) . Impact of Global and Economic Financial Crisis on Indonesia, A Rapid Assessment Report by ILO. |
30 | Zhang N. , Li L. , Willett D.T. , (2012) . The Effects of the Global Financial Crisis on China’s Financial Market and Macroeconomy, Review Article, Hindawi Publishing Corporation, Economics Research International, Volume 2012: . |


