
Ischemic stroke subtyping method combining convolutional neural network and radiomics
Abstract
BACKGROUND:
Cardiogenic embolism (CE) and large-artery atherosclerosis embolism (LAA) are the two most common ischemic stroke (IS) subtypes.
OBJECTIVE:
In order to assist doctors in the precise diagnosis and treatment of patients, this study proposed an IS subtyping method combining convolutional neural networks (CNN) and radiomics.
METHODS:
Firstly, brain embolism regions were segmented from the computed tomography angiography (CTA) images, and radiomics features were extracted; Secondly, the extracted radiomics features were optimized with the L2 norm, and the feature selection was performed by combining random forest; then, the CNN Cap-UNet was built to extract the deep learning features of the last layer of the network; Finally, combining the selected radiomics features and deep learning features, 9 small-sample classifiers were trained respectively to build and select the optimal IS subtyping classification model.
RESULTS:
The experimental data include CTA images of 82 IS patients diagnosed and treated in Shanghai Sixth People’s Hospital. The AUC value and accuracy of the optimal subtyping model based on the Adaboost classifier are 0.9018 and 0.8929, respectively.
CONCLUSION:
The experimental results show that the proposed method can effectively predict the subtype of IS and has potential to assist doctors in making timely and accurate diagnoses of IS patients.
1Introduction
Stroke causes severe loss of health function and is the leading cause of death worldwide [1]. Stroke has high mortality and morbidity rates. The disease seriously endangers the quality of patients’ life. Ischemic stroke (IS) is the most common type of stroke, IS can be divided into 5 subtypes according to the etiology. Trial of Org 10172 in acute stroke treatment (TOAST) subtyping is the commonly used IS subtyping method. Cardiogenic embolism (CE) and large-artery atherosclerosis embolism (LAA) are the two most common subtypes of IS [2]: worldwide, CE accounts for 20% to 30% of all IS cases, and the prevalence of the atherosclerotic type is about 23% [3]. Asians have the highest prevalence of LAA, and a retrospective review of IS by Ornello et al. [4] found that the incidence of LAA remains on the rise. The above two IS subtypes have different causes and emboli components, so the treatment methods are also different. The thrombus of CE originates from the heart, and the thrombus may be caused by atrial fibrillation and other reasons, after the thrombus is formed. It will follow the blood circulation to the blood vessels of the brain, causing blockage of the blood vessels in the brain [5]. The emboli of LAA originate from the plaques produced by atherosclerosis of the large arteries of the head and neck [6]. Therefore, the construction of IS subtype identification model can perform early diagnosis and accurate subtyping of different IS subtypes, so as to provide a reasonable and targeted treatment plan and prognosis method for the clinic, improve the treatment effect of patients with these two IS subtypes, and effectively improve the disease, which has important clinical research significance.
The current early detection techniques for IS include computed tomography angiography (CTA), magnetic resonance imaging (MRI), digital subtraction angiography (DSA), and transcranial Doppler ultrasound (TCD). The gold standard for cerebrovascular disease examination is DSA, but as an invasive examination, DSA is difficult to recommend as a scheme for early diagnosis in clinical practice [7]. At present, researchers are using radiomics to study the subtyping of IS under the premise of non-invasive examination. In 2012, Lambin et al. [8] proposed the radiomics technology. The basic principle is to mine the deep features of specific diseases in medical images and convert the images into quantitative data. The key technologies can be divided into data acquisition and preprocessing, image segmentation, feature extraction, feature selection, and model building. Rafael et al. [9] extract two-dimensional texture features from three-dimensional MRI image slices and use the Mann-Whitney U test to count these texture features for feature screening. Finally, the author uses support vector machines and random forest classifiers to construct an IS subtyping model. Satisfactory results were obtained for the subtyping of IS subtypes, proving that the texture features of MRI can be used to detect the subtypes of IS patients. Ona et al. [10] extracted the emboli features based on MRI images and analyzed them using statistical methods. They pointed out that the volume features of the emboli region were statistically different, and this feature also had a good effect on the subtyping of IS. However, this study only used statistical methods for analysis and did not use a classifier to build an IS subtyping model to verify the above conclusions, lacking experimental verification results. At present, most of the IS subtyping studies based on radiomics use MRI images.
However, MRI examinations have the disadvantages of many contraindications and a long examination time. IS patients suffer from an acute onset, and the treatment time is strictly limited by the time window. It may affect the treatment effect, so doctors generally do not recommend the use of MRI as an early diagnosis method for IS in emergency situations. CTA examination has the advantages of short time and few contraindications, and it can provide doctors with a diagnosis basis in time. At present, there are few studies using CTA images for IS subtyping. Therefore, it is very important and urgent to study the IS subtyping method based on CTA.
Deep learning has also made significant progress in the field of medical image recognition. Compared with traditional radiomics, deep learning can directly use the original medical image as input, complete the learning of image features in the network, and directly use the subtyping result as the output. CNN is a classic deep learning network, especially widely used in image recognition and subtyping [11–13]. The network can obtain image features by learning large sample data to process and identify unknown images [14].
At present, most of the IS subtyping based on medical images only carries out the extraction and subtyping of radiomics alone. However, combining deep learning model-generated features and radiomics features has attracted research interest in medical image analysis field (i.e., to classify between malignant and benign breast lesions [15]). For this reason, this study proposed an IS subtyping method that combines the CNN-generated automated features and radiomics features. This method combined CNN features with radiomics features. On the one hand, it can made up for the shortcomings of deep learning subtyping accuracy in the case of insufficient data. On the other hand, the extracted high-level features can supplement low-level features, fully reflect the information of the embolic area. After the radiomics features were selected by the random forest and sequence backward algorithms, 9 different classifiers were used for IS subtyping. The results show that the proposed method can effectively predict the subtypes of IS.
2Materials and methods
2.1Experimental data
Data used in this study are CTA images of 82 patients with IS from Shanghai Sixth People’s Hospital (36 cases of CE and 46 cases of LAA). The image bit depth is 16, and each patient’s CTA data contains about 350 images, all of which have a pixel size of 512×512 and a layer thickness of 0.8mm∼1 mm. All the included data were collected from 2016 to 2021. The conditions for data screening were: each patient underwent surgical treatment of thrombectomy, the patient’s IS type was obtained through pathological diagnosis and cases with other treatment methods such as thrombolysis were excluded; CTA are no artifacts in the image samples and the images are clear and not blurred; in order to control variables, only a single IS subtype patient is selected, the patient does not include LAA and CE at the same time; too small and blurred emboli are excluded unclear cases.
The experimental platform used in this stud is a 64-bit Windows 10 operating system, i5-8400-2.80 GHz processor, 16GB memory, and the software used is 3D Slicer 4.10.2 and SPSS 25.0.
2.2Experimental framework
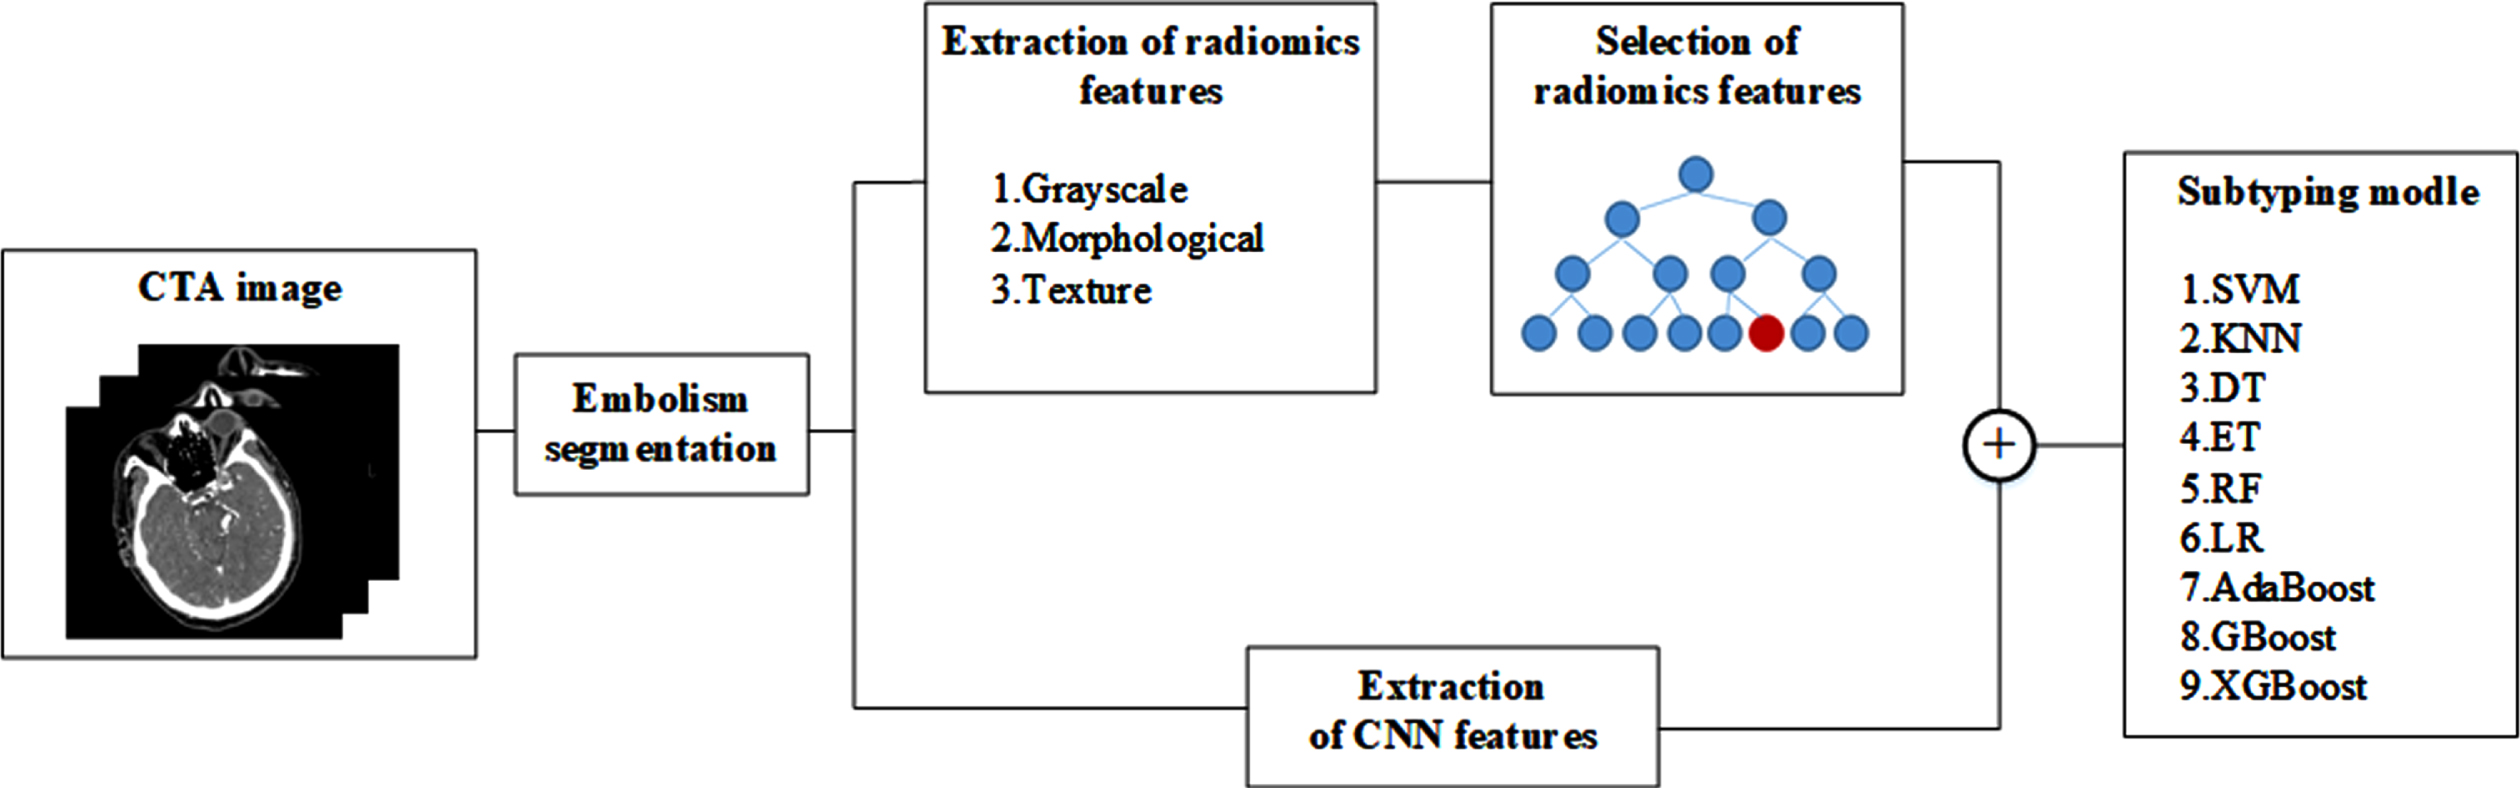
In this study, an IS subtyping model is constructed based on CNN and radiomics features. The specific process is as follows: Firstly, the cerebral embolism region was segmented from the CTA image of the patient’s head. The radiomics features of the extracted embolic regions include grayscale, morphological, and texture features; The extracted radiomics features are optimized for L2 norm, and the features are selected by combining random forest and sequence backward algorithms; at the same time, the CNN Cap-UNet is built to extract the deep learning features of the last layer of the network; finally, the selected radiomics features and deep learning features are combined, and 9 small-sample classifiers are used to train the combined features, respectively. The IS subtyping model is constructed, and the classifier with the best results is obtained to construct the IS subtyping model. The experimental process is shown in Fig. 1.
Fig. 1
Overview of the proposed method.
2.3Extraction of radiomics features
In order to highlight the information of brain emboli region, the method of window width and level adjustment was used to preprocess the image. The CT value of the cerebral embolus is about 45 HU, so in this paper, the window level of the CTA image is set to 45 HU, and the window width is set to 300 HU, the CT value ranges from –105 HU to 195 HU. After setting the window width and window level, the image can display the structural information of the brain tissue more clearly, which is conducive to the marking and feature extraction of the subsequent embolization part.
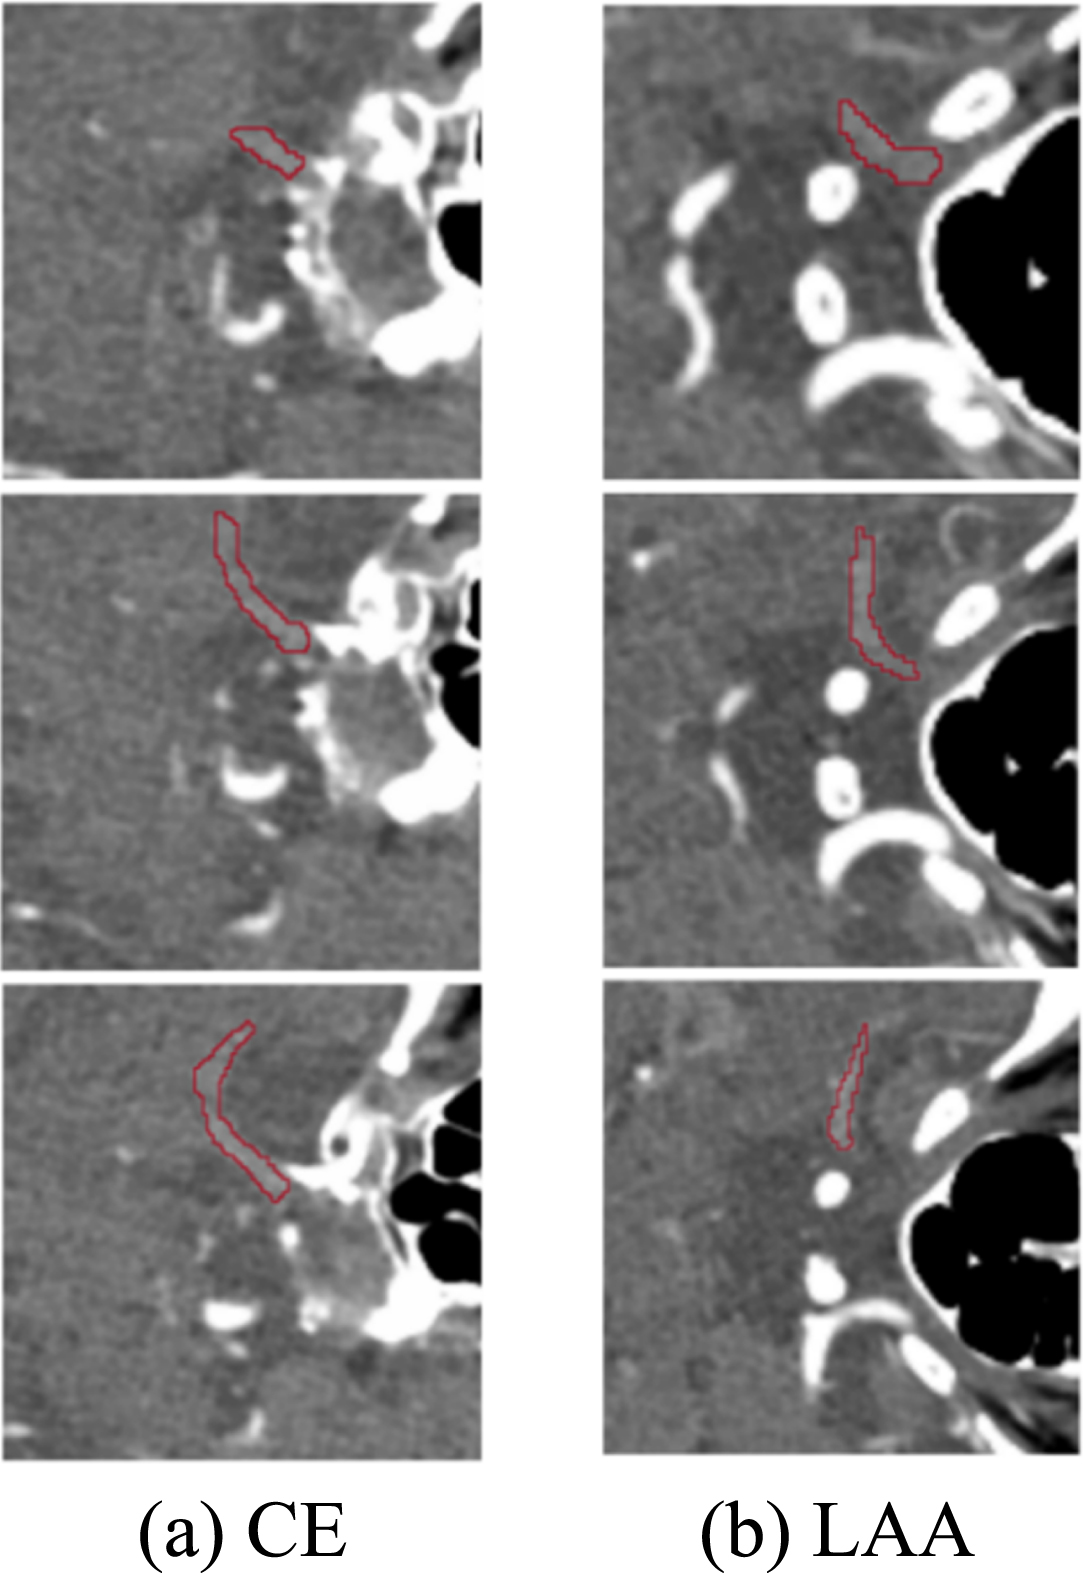
At present, there is no accurate automatic or semi-automatic segmentation method for IS embolism segmentation of CTA images, so manually delineating the region of interest (ROI) is still the standard segmentation method. The embolization area labeling in this paper was manually labelled by three experienced interventional radiologists from the Sixth People’s Hospital at the same time, and the labeling results are shown in Fig. 2. After the marking of the IS embolization part is completed, the consistency of the marking results of the three doctors needs to be judged. The intraclass correlation coefficient (ICC) [16] was used to test the three sets of labels, and the final ICC value was greater than 0.75, which shows that the same sample drawn by three doctors has high repeatability and good reliability.
Fig. 2
The result of marking the embolized area.
Feature extraction is used to extract large number of quantitative descriptions from medical image data and reflect the potential diseases of organs or tissues at the microscopic level from the quantitative image features. In this paper, the features of the emboli were extracted based on the embolic region after segmentation of the CTA image. The final extracted radiomics features were divided into three categories: grayscale features, morphological features, and texture features, for a total of 116 radiomics features.
Morphological features are mainly used to describe the geometric shape of the marked area, reflect the morphological structure of the embolus in two-dimensional and three-dimensional, and abstract the morphological structure of the embolus from the head CTA image, which is a very important feature. The morphological features have nothing to do with the gray intensity distribution of the ROI, and they are only calculated on the original image and mask during calculation, so the morphological structure of the obtained emboli will not be changed by the previous preprocessing method. The extraction of grayscale features is based on the properties of the first-order histogram, which reflects the grayscale distribution of pixels inside the emboli in three dimensions, which is the most intuitive feature of IS emboli images, including the mean, median, maximum, and minimum values of voxel intensity values. The texture feature is a second-order statistical feature that reflects the relationship between voxels in the three-dimensional emboli. Generally, this relationship is represented in structure by a repetitive or slowly changing arrangement relationship. Texture features are obtained through the gray level co-occurrence matrix (GLCM) [17], the gray level run length matrix (GLRLM) [18], the gray level size zone matrix (GLSZM) [19], the neighboring gray tone difference matrix (NGTDM) [20] and the gray level dependence matrix (GLDM) [21] five ways to calculate these. In the feature extraction process, the image types used are all unfiltered original images, the bin width is set to 25, the label is set to 1, the interpolator is set to ‘sitkBSpline’, and the resampled pixel spacing and weighting norm are both set to ‘None.’
2.4Radiomics feature selection
There are often outliers and noise in the extracted features, so that it is necessary to normalize the features to optimize the features. In this study, L2 norm normalization is used to process the data. L2 norm normalization is to divide each data in the vector by the norm of the vector to obtain a new vector.
In order to solve the high-dimensional problem caused by too many features, the feature selection method needs to be used to reduce the dimension of the radiomics feature matrix. In this study, the random forest algorithm is used to rank the importance of the features, and the sequence backward search method is added on this basis. The lowest feature is removed, resulting in a new feature subset. Specific steps are as follows:
1) There is an original data set with D samples, and d samples are randomly selected from the original samples to construct a new data subset. Denote the number of features in the new data subset as H, extract h (h < H) features from the features to form a new feature matrix, select an optimal feature from the feature matrix for splitting, and finally generate a decision tree.
2) Repeat step (1) several times to form a random forest model, and then use the Gini index to calculate the Variable Importance Measures (VIM) value of each feature.
3) Sort all the features in descending order according to the calculated VIM value and delete the feature with the smallest VIM value to obtain a new feature subset.
4) Repeat the above steps until the number of features is reduced to the set value.
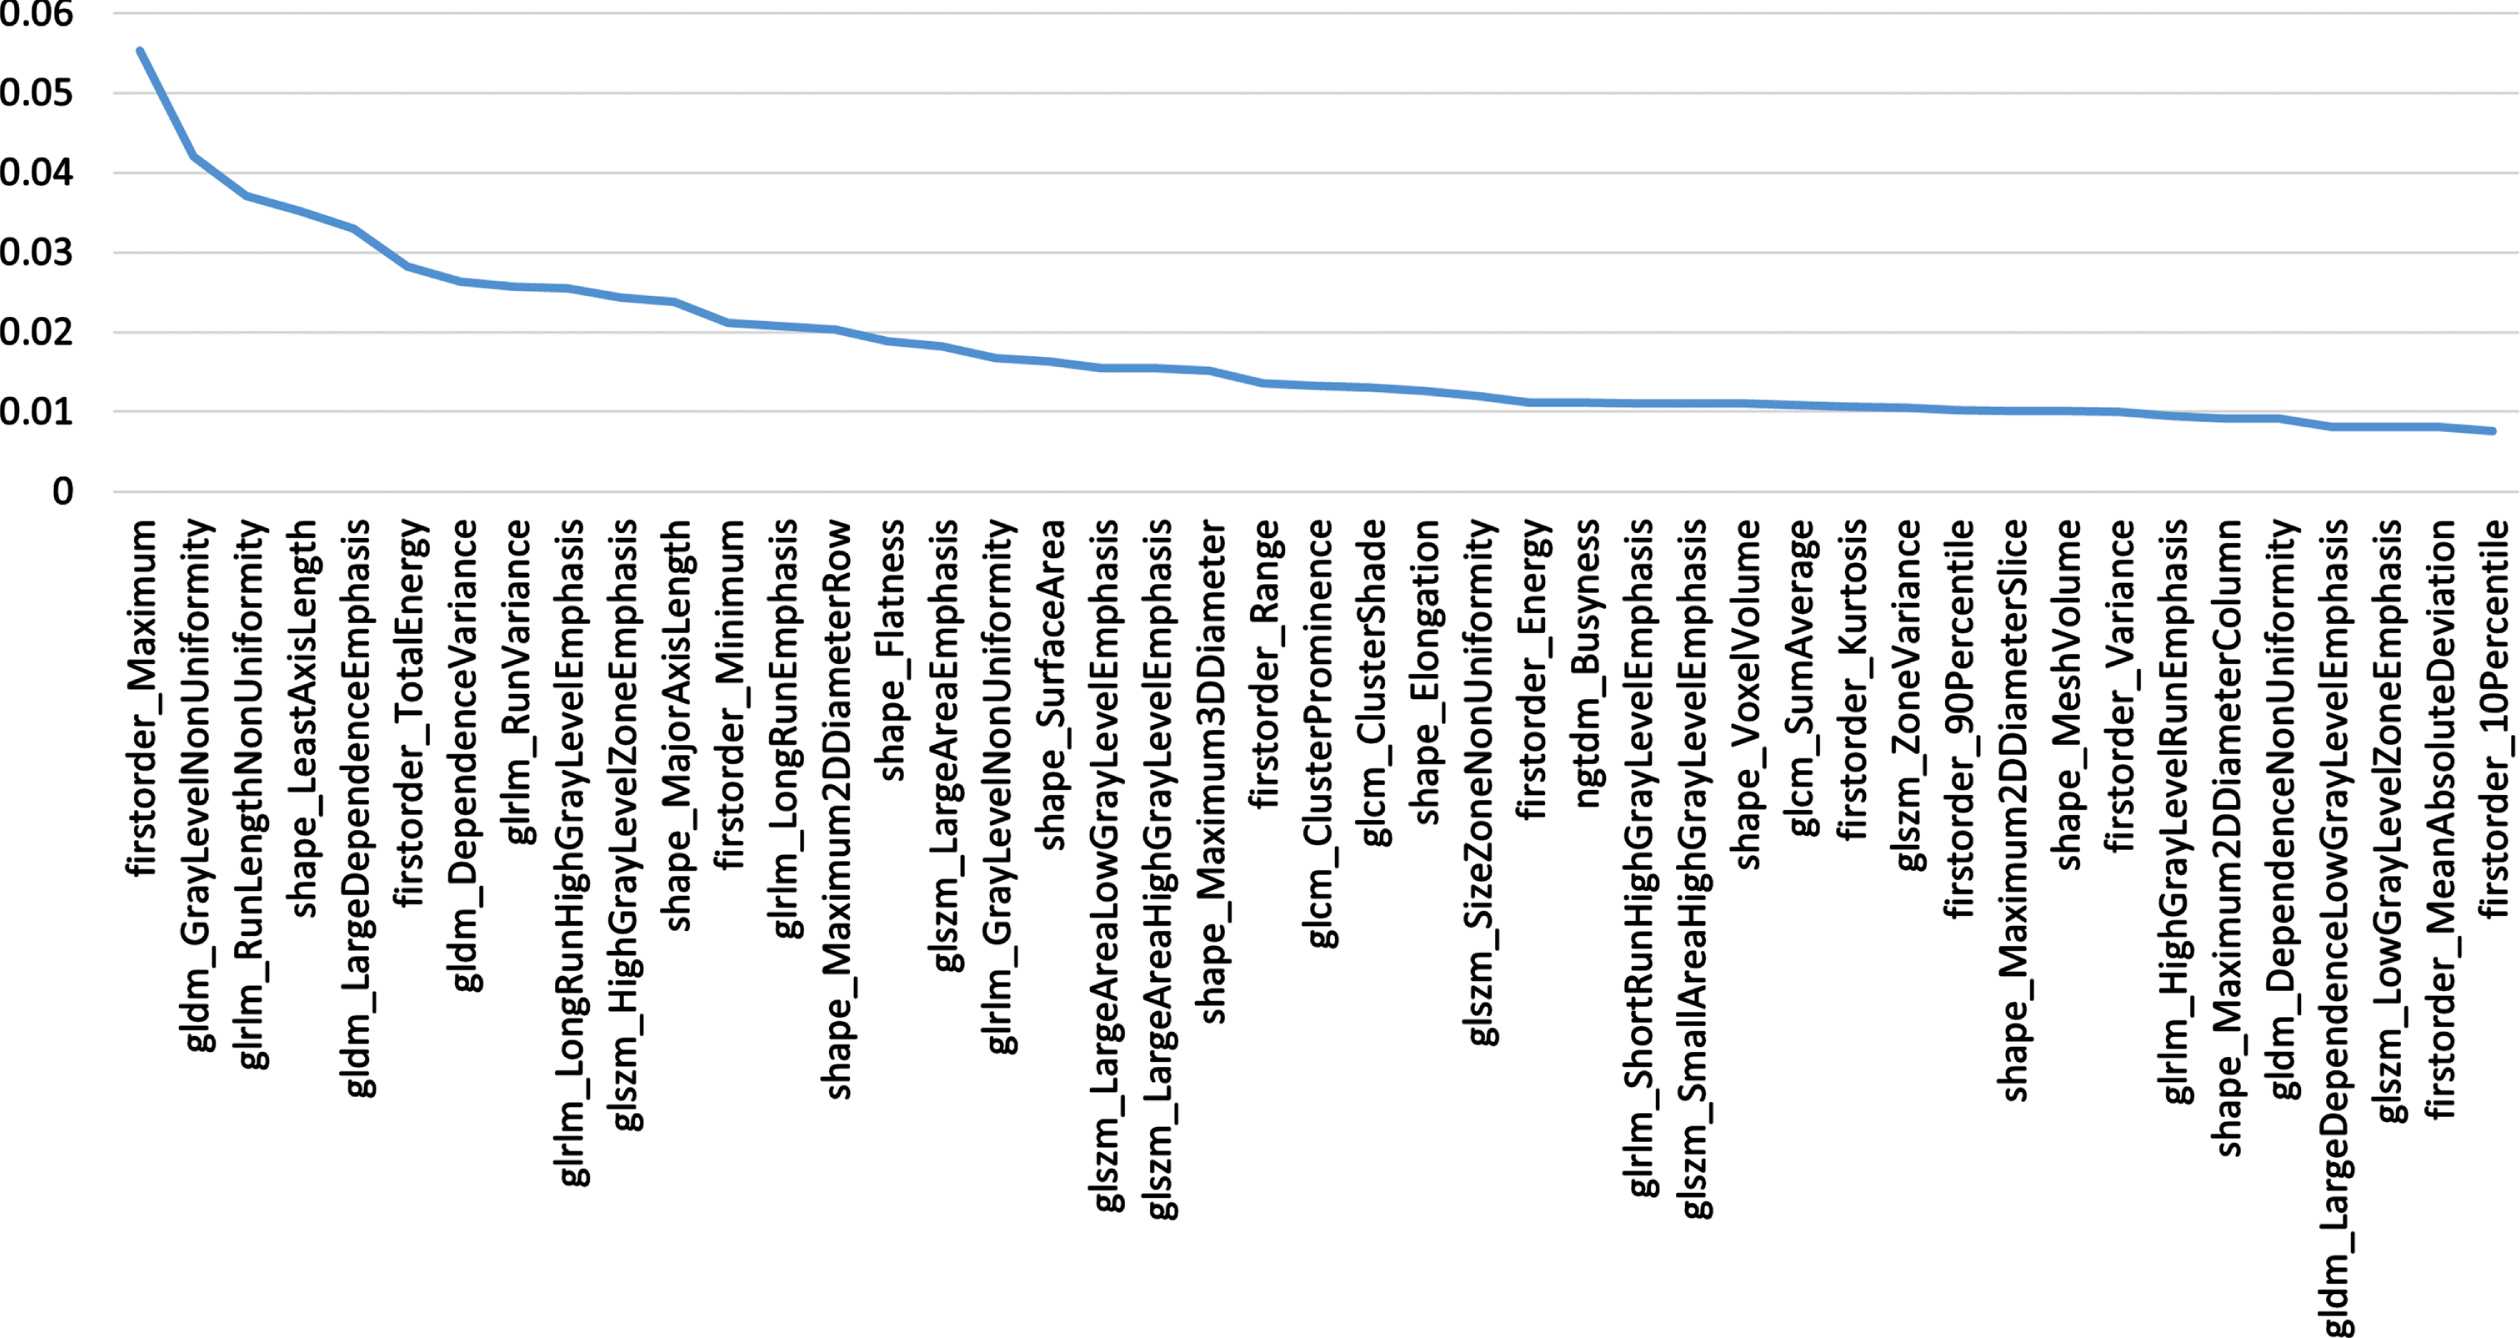
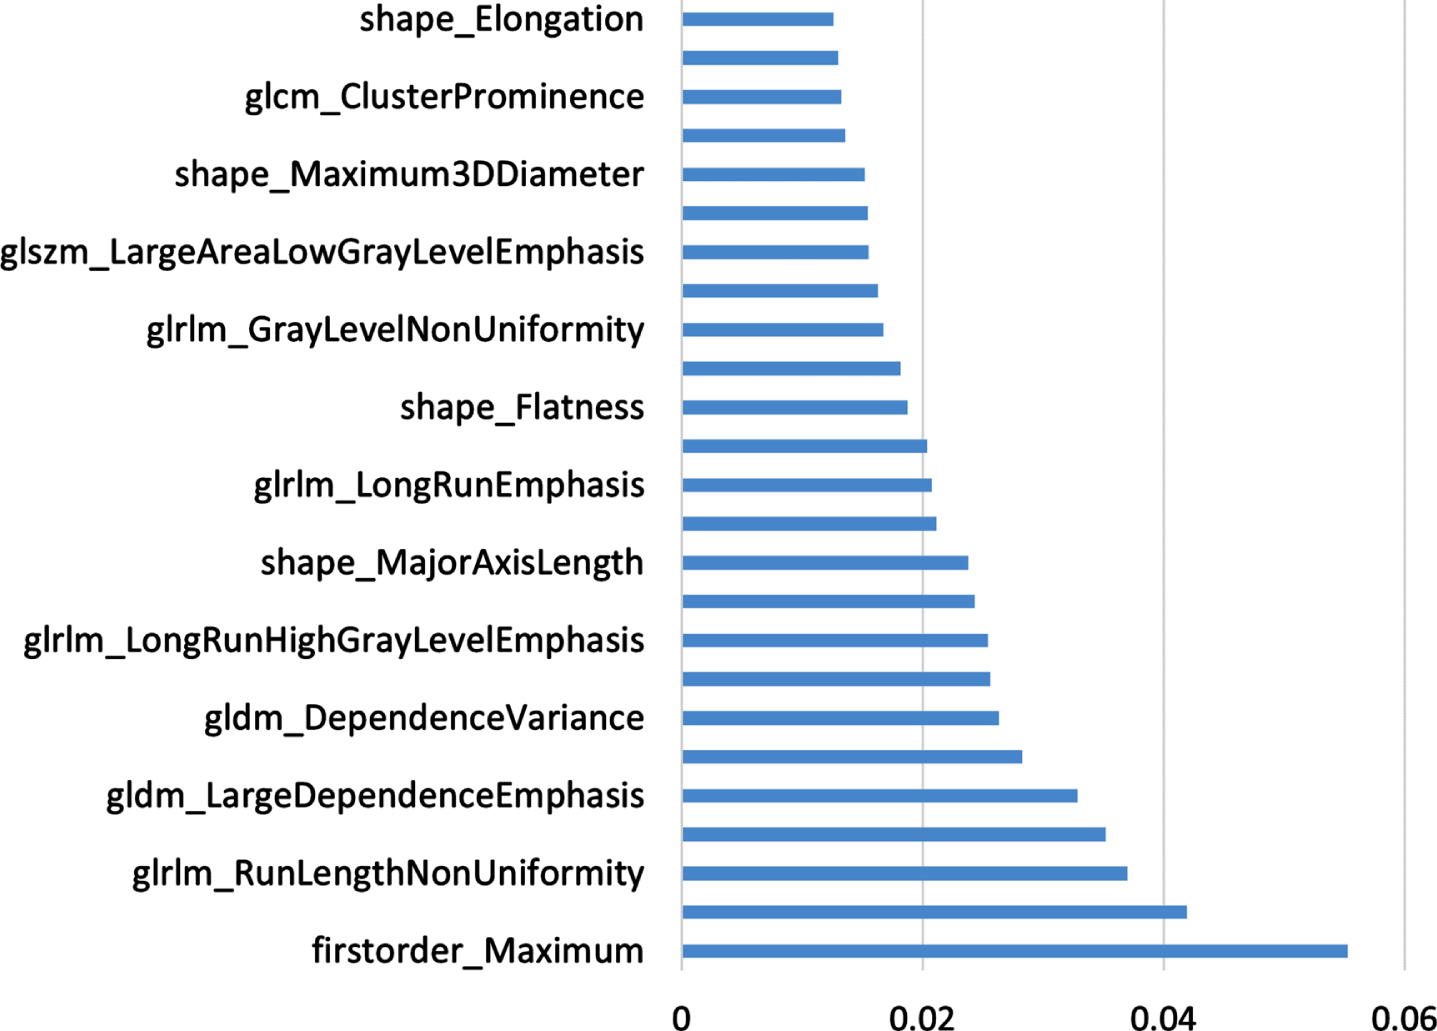
The ten-fold cross-validation method was used to split the data into training dataset and test dataset for experiments. The feature selection step is performed only on the training dataset. The value of n is set to 45, the procedure is aborted when there are only 45 radiomics features left. At the same time, the feature VIM value obtained by the last random forest calculation is saved, and the features are arranged in descending order according to the VIM value to prepare for the subsequent construction of the subtyping model. The 45 features are screened, and their corresponding VIM values are shown in Fig. 3.
Fig. 3
Filtered Features.
2.5Extraction of CNN features
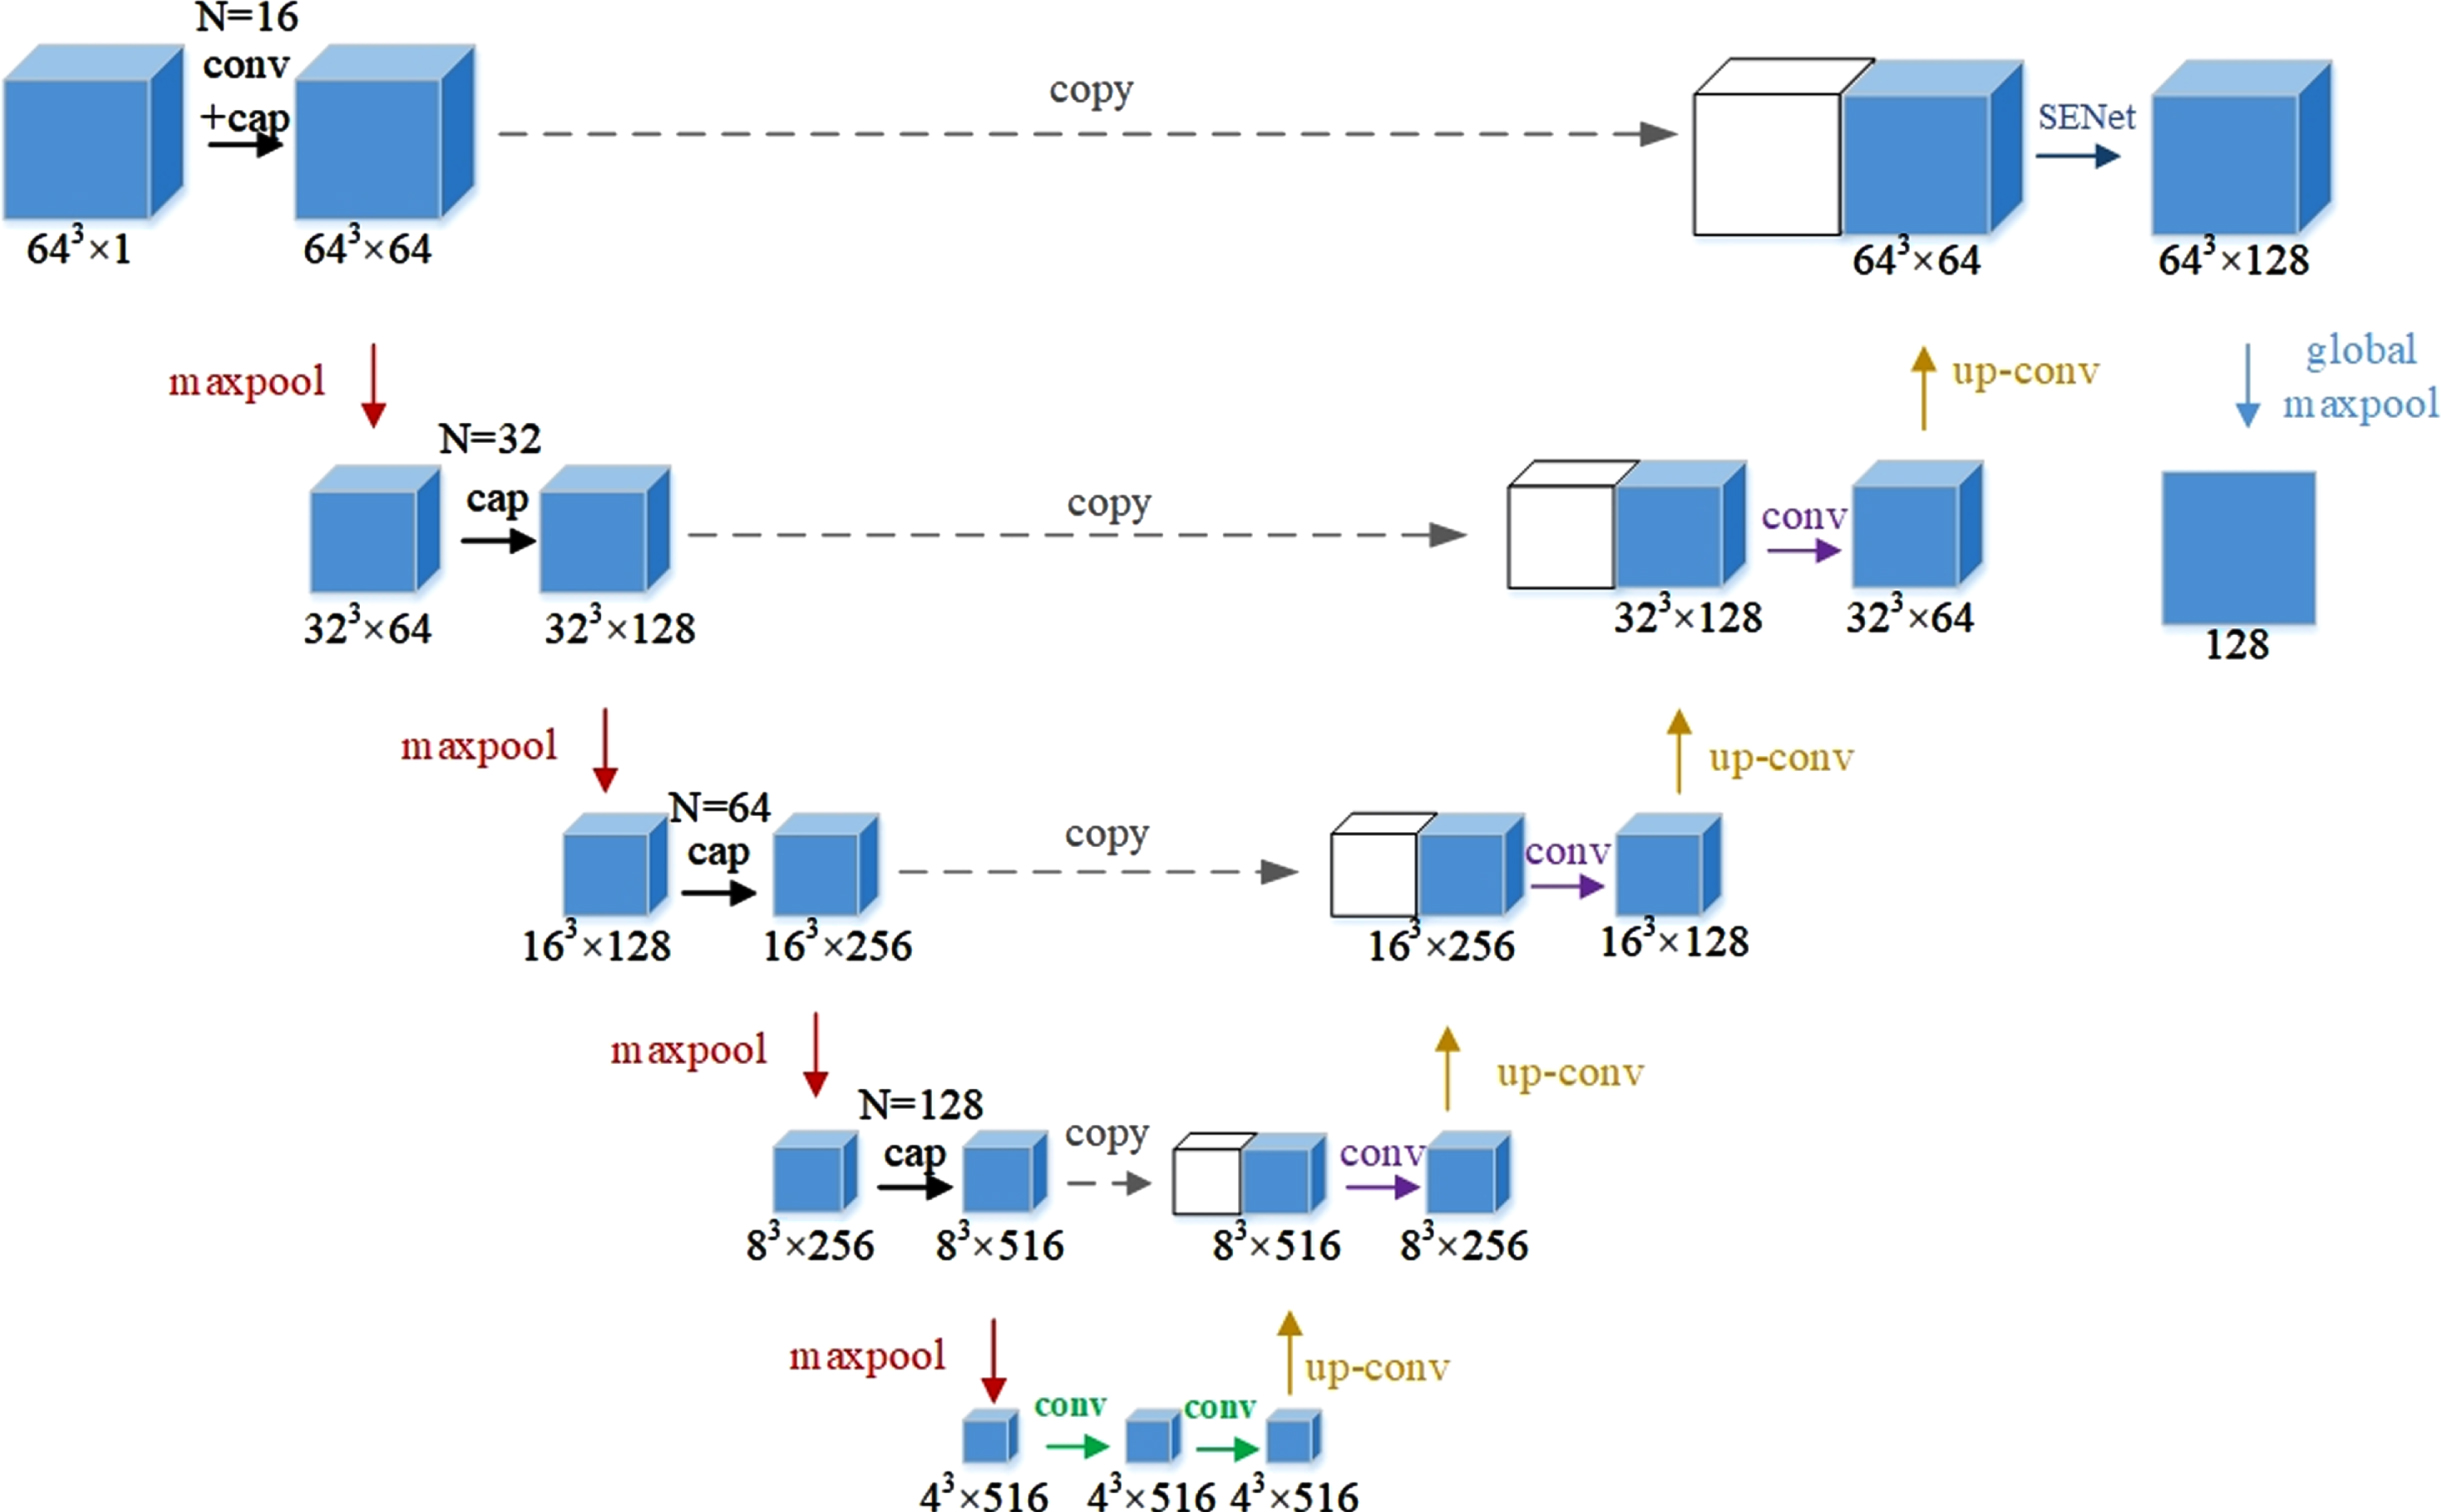
In this study, Cap-UNet was built to extract CNN features, and the network structure is shown in Fig. 4. Firstly, according to the position of the embolus on the CTA image, a 64×64×64×1 pixel block that can contain all the information of the embolus is cropped, and then the cropped data samples are input into Cap-UNet for training. The overall design of the network refers to the symmetrical design of UNet, divides the overall network into an encoding part and a decoding part, and draws on the idea of Inception, replaces the convolutional part of the encoder with a capsule layer consisting of four different convolutional layers and a concatenated layer, and the SENet module [22] is embedded in the previous layer of the output feature, so that the model can pay more attention to the relationship between the channel features, the feature map after the SENet module, and the global maximum After the pooling layer, 128 CNN features are finally extracted.
Fig. 4
Cap-UNet structure.
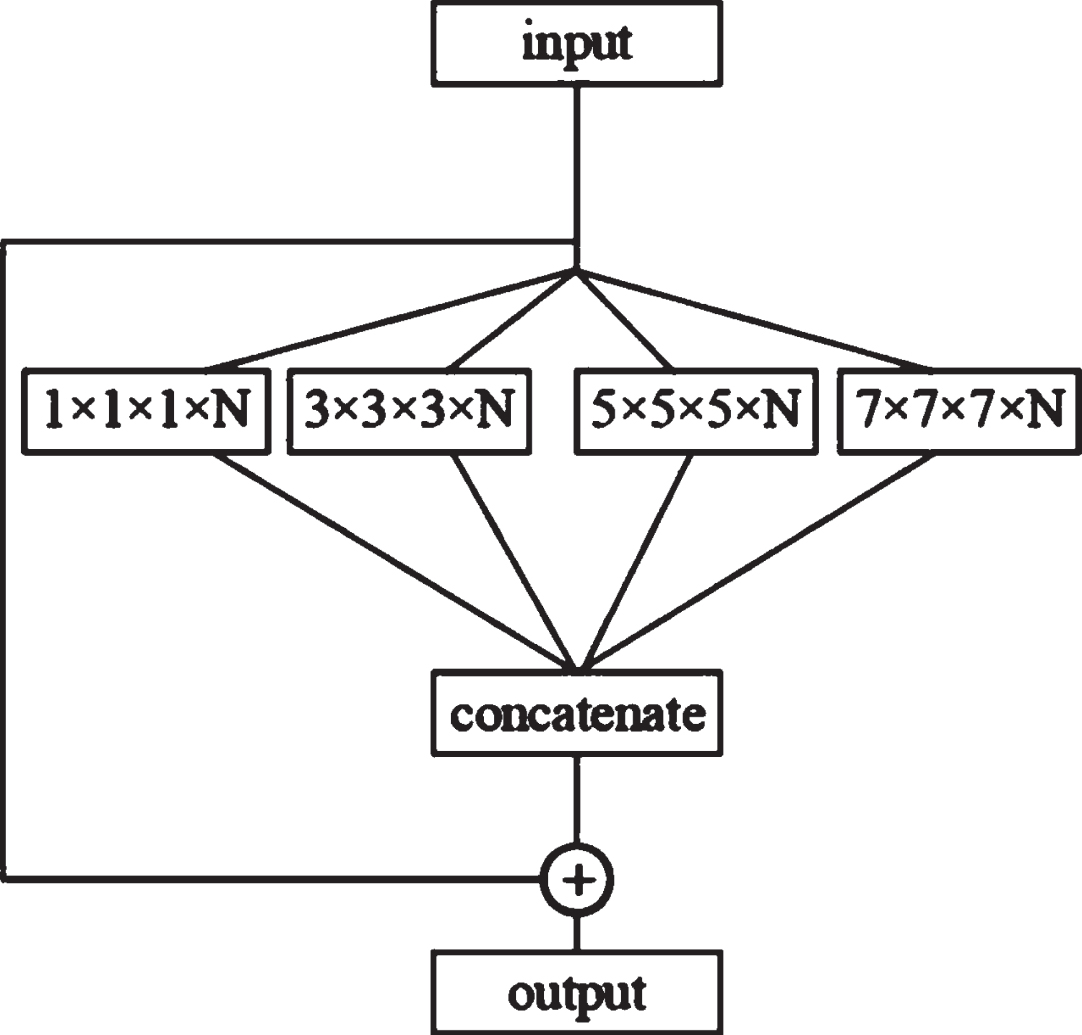
The structure of the capsule layer is shown in Fig. 5. Each capsule layer contains four convolutional layers with convolution kernel sizes of 1×1×1, 3×3×3, 5×5×5 and 7×7×7, respectively. This study selects four convolutional layers with different scales to simulate the receptive fields of different sizes, respectively. In the figure, N is the number of channels of the convolutional layer. After four different convolutions, a connection layer will be used to obtain the features. The graph is spliced, and finally, the result of the connection layer splicing is added to the input to obtain the output.
Fig. 5
Capsule layer structure.
2.6Construction of the subtyping model
In IS subtyping, the construction of the classifier is the most important part, and the typing model directly determines the typing performance. This study uses a variety of machine learning classifiers to build models, namely support vector machine (SVM), K-nearest neighbor (KNN), decision tree (DT), extremely randomized trees (ET), random forest (RF), logistic regression (LR), adaptive boosting (AdaBoost), gradient boosting (GBoost), and the extreme gradient boosting (XGBoost) classifier. The above 9 classifiers have their own advantages and disadvantages, and their algorithm complexity, computational cost, sensitivity to noise, and interpretability have different characteristics, as well as different requirements for the size of the sample, object attributes, and sample balance problems. In this study, the selected classifier was used to train the extracted features, and the classifier with the best subtyping results was selected according to the experimental results to realize the prediction of IS subtypes.
The hyperparameters of each classifier are optimized by grid search technique, and the hyperparameter with the highest score on the training set was taken. In this study, the SVM classifier was based on RBF kernel and the regularization parameter (C) and the kernel coefficient (gamma) are respectively 0.01 and 0.001. For KNN classifier, the number of n-neighbors is 5. The min-leaf for DT is 3. The trees of ET and RF are 300, and other parameters are default. The regularization parameter of LR classifier with L2 regularization is 0.01. For AdaBoost, the base estimator used in this experiment is DT, and the algorithm is set to ‘SAMME.R’. For GBoost and XGBoost, the number of estimators is 100, and the learning rate is set as 0.001. In addition, the L2 regularization coefficient in XGBoost is set to 0.01 to avoid overfitting.
The experiment evaluates the performance of the IS subtyping model from two aspects, namely the evaluation index and verification method of the model. The evaluation indicators of the experiment are accuracy (ACC), sensitivity (SEN), specificity (SPE), receiver operating characteristic curve (ROC), area under the ROC curve (AUC), and 95% confidence interval (CI). ACC is the ratio of the number of IS subtypes correctly predicted by the model to the total number of samples, SEN represents the ratio of the number of correctly predicted cardiac types to the total number of CE types, and SPE represents the correct number of LAA types predicted by the model Ratio of the number of sclerosing types to total LAA types.
The experimental verification method is ten-fold cross-validation, which can eliminate the bias effect caused by data imbalance. In the verification process, the samples of each fold are randomly selected, and after the verification is completed, the mean value of the evaluation indicators is taken to reduce the difference caused by different sample divisions.
3Results
3.1Influence of the number of radiomics features on the model
In the experiment, 5 different numbers of radiomics features were selected for comparative experiments, and the top 5, top 15, top 25, top 35 and top 45 features were selected, respectively, and 9 subtyping models were used to train the selected features. For the experimental evaluation indicators of different feature number models, the average value of 9 subtyping models is taken.
The experimental results are shown in Table 1. When the number of radiomics features is 25, the model obtains the best subtyping results, the AUC value is 0.8092, and the ACC value is 0.7683. The smaller or larger the number of features used, the worse the classification result of the model. Using too many features for typing does not achieve the expected effect. It may be that there are some redundant features in the feature set, which leads to a decrease in the accuracy rate, which also proves the necessity of feature selection before building a model. Using too few features for typing achieves a good typing effect, but too few features cannot reflect all the information of the data, and the loss of some data information leads to a lower accuracy than that of using 25 features. Using too many features for typing does not achieve the expected effect, and there may be some redundant features in the feature set, resulting in a decrease in the accuracy rate. This also proves the necessity of feature selection before building the model, and the optimal feature subset required for typing the model is obtained experimentally. The 25 features finally selected through experiments and the corresponding VIM values of the features are shown in Fig. 6, sorted in ascending order according to their importance.
Table 1
Subtyping results of different eigenvalues
| Number of features | AUC | 95% CIs | ACC | SEN | SPE |
| 5 | 0.7138 | [0.5921–0.8077] | 0.6951 | 0.5556 | 0.8043 |
| 15 | 0.7452 | [0.6322–0.8472] | 0.7317 | 0.6111 | 0.8261 |
| 25 | 0.8092 | [0.7067–0.8998] | 0.7683 | 0.5833 | 0.913 |
| 35 | 0.7585 | [0.6539–0.8524] | 0.7195 | 0.6389 | 0.7826 |
| 45 | 0.7077 | [0.5895–0.8152] | 0.6829 | 0.7222 | 0.6522 |
Fig. 6
Feature Selection Sort.
3.2The influence of different feature configurations on the model
In order to explore the influence of different features on the subtyping effect, 5 different feature combination configurations were selected in this experiment, namely single radiomics feature, single UNet feature, single Cap-UNet feature, combination of radiomics features with UNet and Cap-UNet features, respectively. the radiomics features are the 25 features selected in the previous experiment. The comparison of the results is shown in Table 2. The subtyping accuracy obtained by using the UNet feature and Cap-UNet feature alone is poor, and the ACC values are only 0.5976 and 0.622. After combining radiomics with UNet and Cap-UNet features, respectively, each indicator has a certain improvement compared with single features. The experimental results show that the combination of traditional radiomics features and deep learning features can more effectively reflect the information of the embolic region and improve the accuracy of IS classification. In addition, the features learned by the proposed Cap-UNet in this paper achieves better evaluation results than that of based on UNet model, which derived from that the addition of the residual module, SENet module and Capsule layer makes the network more focus on the target embolism region and effectively extract feature the information of the embolism, thus realizing the higher IS typing accuracy.
Table 2
Results of subtyping experiment
| Feature | AUC | 95% CIs | ACC | SEN | SPE |
| Tradition | 0.8092 | [0.7067–0.8998] | 0.7683 | 0.5833 | 0.913 |
| Unet | 0.5598 | [0.4318–0.6827] | 0.5976 | 0.5278 | 0.6522 |
| Cap-Unet | 0.6486 | [0.5137–0.7685] | 0.622 | 0.7778 | 0.5 |
| Traditional+Unet | 0.8442 | [0.7575–0.9286] | 0.8049 | 0.8056 | 0.8043 |
| Traditional+Cap-Unet | 0.8593 | [0.7684–0.9351] | 0.8293 | 0.7778 | 0.8696 |
In order to further evaluate the effectiveness of the Cap-UNet features proposed in this paper, three classic CNNs, Vgg16, AlexNet, and DenseNet, were selected in this experiment to extract their deep learning features, and these three sets of features were compared with the obtained 25 radiomics features. After the combination, 9 subtyping algorithms are used for training, and the average of the evaluation results is obtained. The experimental results are shown in Table 3. The Cap-UNet feature subtyping performance proposed in this paper is better than other CNN features, and combined with the radiomics features, it can classify IS more accurately.
Table 3
Comparison of different CNN features
| Feature | AUC | 95% CIs | ACC | SEN | SPE |
| Traditional+Cap-Unet | 0.8593 | [0.7684–0.9351] | 0.8293 | 0.7778 | 0.8696 |
| Traditional+Vgg16 | 0.7597 | [0.6407–0.8637] | 0.7439 | 0.6944 | 0.7826 |
| Traditional+AlexNet | 0.7717 | [0.6594–0.8628] | 0.7073 | 0.8611 | 0.587 |
| Traditional+DenseNet | 0.7699 | [0.6669–0.8619] | 0.7195 | 0.7778 | 0.6739 |
3.3Results of the best IS subtyping model
It can be seen from the above experiments that the combination of radiomics features and Cap-UNet features achieves the best results in the comparative experiments. In this experiment, the combination of 25 radiomics features and 128 Cap-UNet features obtained is used as the input of the model, and 9 different IS subtyping models are constructed using the 9 classifiers selected. The experimental results are shown in Table 4, Fig. 7 shows the ROC curves for each subtyping model.
Table 4
Comparison of subtyping model results
| Classifier | AUC | 95% CIs | ACC | SEN | SPE |
| SVM | 0.7016 | [0.6763–0.8721] | 0.7433 | 0.5952 | 0.8545 |
| KNN | 0.7994 | [0.7018–0.8965] | 0.7534 | 0.7571 | 0.7013 |
| DT | 0.7549 | [0.6599–0.8660] | 0.7216 | 0.6145 | 0.8712 |
| ET | 0.7989 | [0.6856–0.8811] | 0.7563 | 0.6667 | 0.8474 |
| RF | 0.7993 | [0.6821–0.8762] | 0.7676 | 0.7886 | 0.7195 |
| LR | 0.7951 | [0.6936–0.8770] | 0.7567 | 0.6353 | 0.8546 |
| AdaBoost | 0.9018 | [0.8045–0.9604] | 0.8929 | 0.9707 | 0.8654 |
| GBoost | 0.8293 | [0.7246–0.8936] | 0.8182 | 0.7972 | 0.8718 |
| XGBoost | 0.8613 | [0.7634–0.9232] | 0.8048 | 0.6751 | 0.9152 |
Fig. 7
ROC curve of the subtyping model.
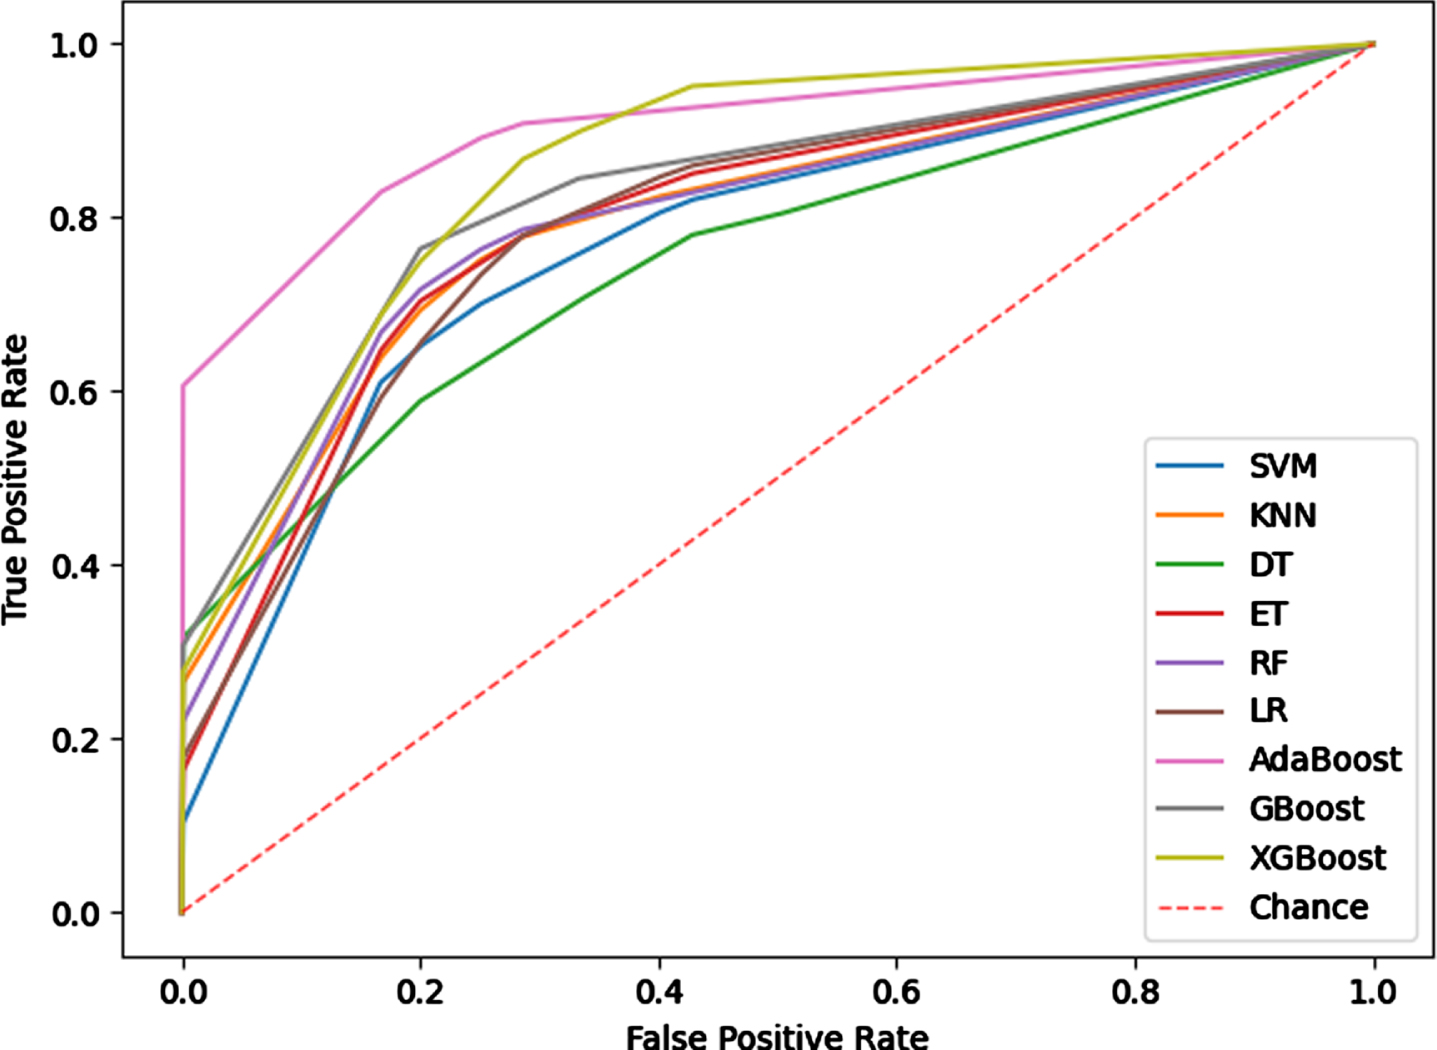
The experimental results show that the subtyping effect of the model based on the Boosting method is significantly better than other classifiers, and the subtyping model based on the Adaboost algorithm has achieved the best results among the 9 machine learning models. The AUC value and ACC value of the model are 0.9018 and 0.8929, the SEN value and SPE value were also higher than other typing methods, indicating that the typing model based on Adaboost has better typing ability and can more stably predict IS subtypes. The Adaboost algorithm trains different weak classifiers for the same training set, and then aggregates these weak classifiers to form a strong classifier to obtain higher prediction accuracy. For this classifier, the predicted probability of the sample set classification as the weight of the weak learner to obtain faster iteration speed and improved the generalization ability of the model.
4Discussion
Most of the existing researches on the classification of IS using machine learning methods were based on a single radiomics feature. Rafael et al. [9] extracted only texture features from MRI scans and trained SVM classifier, which achieved accuracies ranging from 0.7 < AUC < 0.83 to identify the presence of ischaemic stroke lesions. Wu et al. [10] analyzed MRI features using statistical methods and pointed out that there were statistical differences in the volume characteristics of the IS region and had a good effect on the classification of IS, however, lacking the related IS typing experiment to support. In this study, a stable and effective IS subtyping model was constructed by deep mining CTA images of IS patients, and the subtypes classification of IS patients were realized. The proposed model combined the deep features learned by CNN model with traditional radiomics features. The experimental results show that radiomics features can quantitatively evaluate emboli characteristics, and CNN learning features can describe the deep semantic information of IS. The extracted high-level features can complement the low-level features, thus enriching the information of the IS area and improving the accuracy of IS typing. The IS subtyping model could help doctors diagnose and target patients in a timely manner, which greatly improves the patient’s physical condition.
Additionally, there are still limitations in this experiment that should be addressed in future work.
1) All the experimental data in this experiment are CTA images of IS patients without other clinical data such as blood reports or gene reports. Combining multimodal data, such as clinical information, could capture the rich information of IS disease and thereby contribute to improving diagnostic performance. It is hoped that a more complete IS clinical database can be established in the future to provide relevant data support for IS research.
2) The classification accuracy of the IS classification method not only depends on the performance of the classifier, but also on the segmentation accuracy of the embolized part, which also affect the IS classification effect. This study used the gold standard for segmenting emboli manually delineated by doctors and did not achieve full automation of emboli segmentation. Li et al. [23] proposed a novel unified algorithm for glioma segmentation in multimodal MRI images. The method first passes spatial fuzzy c-mean clustering to estimate region-of-interest in multimodal MRI images. The glioma boundaries are then refined by region merging and an improved distance regularization level set method. This method can achieve the segmentation of glioma without relying on the gold standard. Inspired by this study, subsequent research works can attempt to design an automatic segmentation program that can be applied to high-accuracy segmentation of IS embolized location, thereby improving the recognition accuracy of IS and IS subtypes.
3) At present, there are more and more applications of deep learning in the research of medical classification tasks. Compared with radiomics methods, deep learning can automatically extract image features and achieve end-to-end classification work. However, deep learning requires a large sample to train the network, and the data of IS patients enrolled in this study needed to be strictly screened, and only 82 cases were enrolled. Therefore, in the follow-up research, it is necessary to continuously collect experimental data and design a deep learning network model suitable for IS classification.
Acknowledgments
This research was supported by the National Natural Science Foundation of China (Grant No. 81830052), the Science and Technology Innovation Action Plan of Shanghai (Grant No. 18441900500), the Natural Science Foundation of Shanghai (Grant No. 20ZR1438300), and Shanghai Key Laboratory of Molecular Imaging (18DZ2260400).
Conflict of interest
The authors declare that they have no conflict of interest.
References
[1] | Campbell B.C.V. and Khatri P. , Stroke, The Lancet 396: (10244) ((2020) ), 129–142. |
[2] | Lopes M. , Oliveira G.M.M. , Ribeiro A.L.P. , et al., Guideline of the Brazilian Society of Cardiology on Telemedicine in Cardiology-, Arquivos Brasileiros de Cardiologia 113: (5) ((2019) ), 1006–1056. |
[3] | Wang Y.J. , Li Z.X. , Gu H.Q. , et al., China Stroke Statistics: A Report From the National Center for Healthcare Quality Management in Neurological Diseases, China National Clinical Research Center for Neurological Diseases, the Chinese Stroke Association, National Center for Chronic and Non-communicable Disease Control and Prevention, Chinese Center for Disease Control and Prevention and Institute for Global Neuroscience and Stroke Collaborations, Stroke and Vascular Neurology 5: (3) ((2020) ), 211–239. |
[4] | Ornello R. , Degan D. , Tiseo C. , et al., Distribution and temporal trends from to of ischemic stroke subtypes: A systematic review and meta-analysis, Stroke 49: (4) ((2018) ), 814–819. |
[5] | Wang Y. , Haddad Y. , Patel R. , et al., Factors influencing the outcome of cardiogenic cerebral embolism: a literature review, Neurological Research 44: (3) ((2022) ), 187–195. |
[6] | Trivedi R.A. , Jm U.K.I. , Graves M.J. , et al., Non-stenotic ruptured atherosclerotic plaque causing thrombo-embolic stroke, Cerebrovascular Diseases 20: (1) ((2005) ), 53–55. |
[7] | Hu T. , Yang H. , Ni W. , et al., Automatic detection of intracranial aneurysms in 3D-DSA based on a Bayesian optimized filter, Biomedical Engineering Online 19: (1) ((2020) ), 73. |
[8] | Lambin , Rios-Velazquez , Leijenaar , et al., Radiomics: extracting more information from medical images using advanced feature analysis, Eur J Cancer 48: (4) ((2012) ), 441–446. |
[9] | Rafael O.R. , Maria d C. , Valdés H. , et al., Identification of the presence of ischaemic stroke lesions by means of texture analysis on brain magnetic resonance images, Computerized Medical Imaging and Graphics 74: ((2019) ), 12–24. |
[10] | Wu O. , Winzeck S. , Giese A.K. , et al., Big data approaches to phenotyping acute ischemic stroke using automated lesion segmentation of multi-center magnetic resonance imaging data, Stroke 50: (7) ((2019) ), 1734–1741. |
[11] | Yang Y. and Guan C. , Classification of histopathological images of breast cancer using an improved convolutional neural network model, Journal of X-Ray Science and Technology 30: (1) ((2022) ), 33–44. |
[12] | Taspinar Y.S. , Cinar I. and Koklu M. , Classification by a stacking model using CNN features for COVID-19 infection diagnosis, Journal of X-Ray Science and Technology 30: (1) ((2022) ), 73–88. |
[13] | Islam W. , Jones M.A. , Faiz R. , et al., Improving performance of breast lesion classification using a ResNet50 model optimized with a novel attention mechanism, Tomography 8: (5) ((2022) ), 2411–2425. |
[14] | Sarigul M. , Ozyildirim B.M. , Avci M. and Differential C.N.N. , Neural Networks 116: ((2019) ), 279–287. |
[15] | Jones M.A. , Faiz R. , Qiu Y. , et al., Improving mammography lesion classification by optimal fusion of handcrafted and deep learning features, Physics in Medicine and Biology 67: (5) ((2022) ), 054001. |
[16] | Ochs R. , Kim H.J. , Angel E. , et al., Forming a reference standard from LIDC data: impact of reader agreement on reported CAD performance, Proceedings of SPIE 6514: ((2007) ), 65142A. |
[17] | Pi P. and Lima D. , Gray level co-occurrence matrix and extreme learning machine for Covid-19 diagnosis, International Journal of Cognitive Computing in Engineering 2: ((2021) ), 93–103. |
[18] | Dash S. and Senapati M.R. , Gray level run length matrix based on various illumination normalization techniques for texture subtyping, Evolutionary Intelligence 14: (2) ((2018) ), 217–226. |
[19] | Pantic I. , Pantic S. and Basta-Jovanovic G. , Gray level co-occurrence matrix texture analysis of germinal center light zone lymphocyte nuclei: physiology viewpoint with focus on apoptosis, Microscopy and Microanalysis 18: (3) ((2012) ), 470–475. |
[20] | Chen S. , Harmon S. , Perk T. , et al., Using neighborhood gray tone difference matrix texture features on dual time point PET/CT images to differentiate malignant from benign FDG-avid solitary pulmonary nodules, Cancer Imaging 19: ((2019) ), 56. |
[21] | Son Y. , Son H. , Kim Y. , et al., A gray-level dependent pre-emphasis column driver with fast settling for active-matrix LCD applications, IEEE Transactions on Circuits and Systems II: Express Briefs 54: (12) ((2007) ), 1057–1061. |
[22] | Li W. , Liu K. , Zhang L. , et al., Object detection based on an adaptive attention mechanism, Scientific Reports 10: (1) ((2020) ), 11307. |
[23] | Li Q. , Gao Z. , Wang Q. , et al., Glioma segmentation using a novel unified algorithm in multimodal MRI images, IEEE Access 6: ((2018) ), 9543–9553. |

