
Automatic detection of COVID-19 in chest radiographs using serially concatenated deep and handcrafted features
Abstract
Since the infectious disease occurrence rate in the human community is gradually rising due to varied reasons, appropriate diagnosis and treatments are essential to control its spread. The recently discovered COVID-19 is one of the contagious diseases, which infected numerous people globally. This contagious disease is arrested by several diagnoses and handling actions. Medical image-supported diagnosis of COVID-19 infection is an approved clinical practice. This research aims to develop a new Deep Learning Method (DLM) to detect the COVID-19 infection using the chest X-ray. The proposed work implemented two methods namely, detection of COVID-19 infection using (i) a Firefly Algorithm (FA) optimized deep-features and (ii) the combined deep and machine features optimized with FA. In this work, a 5-fold cross-validation method is engaged to train and test detection methods. The performance of this system is analyzed individually resulting in the confirmation that the deep feature-based technique helps to achieve a detection accuracy of > 92% with SVM-RBF classifier and combining deep and machine features achieves > 96% accuracy with Fine KNN classifier. In the future, this technique may have potential to play a vital role in testing and validating the X-ray images collected from patients suffering from the infection diseases.
1Introduction
The rapid development in modern life-saving facilities helped the human community to get a better medical facility through multi-speciality hospitals. Even though sufficient diagnostic and treatment facilities are easily accessible, the happening rate of life-threatening diseases is steadily rising [1, 3, 5, 6].
The infectious disease caused by viruses and Bacterium affects the human community rapidly, and detection and treatment is the only remedy to control the spread of the disease to a large population. Recently, the infectious disease; COVID-19 affected a large number of the human group globally, and because of its harshness and spread rate, the World Health Organization (WHO) declared it a pandemic [2, 4, 37]. The SARS-CoV-2 virus causes this disease that initiates mild to severe pneumonia in patients based on their immunity level. Even though the patient vaccinates with the appropriate drug, the spread of COVID-19 is still uncontrollable, due to the rapid mutation in the virus.
The COVID-19 infection in a human is commonly diagnosed using the following clinical methods. (i) Reverse transcription-polymerase Chain Reaction (RT-PCR), in which the collected samples from the patient are examined using the approved clinical protocol, and (ii) Radiological image supported detection of the infection rate. In this technique, either the chest radiograph (X-ray) or the Computed-Tomography (CT) was collected from the patient. Finally, the collected X-ray/CT images were examined by the doctor to implement and to recommend treatment to cure the disease [8–12].
When the COVID-19 rapidly spread person to person, hospitals filled with patients and reduced the doctor to patient ratio. This situation causes a heavy diagnostic burden in hospitals. Therefore, computerized screening is always adopted to support the prescreening of the patient to generate the First Information Report (FIR) about the disease and its infection rate. The generated FIR is then examined by the doctors, and based on the report and doctor’s observation, the treatment is planned and implemented to recover the patient to reduce the disease impact [18–21].
This research aims to develop an automatic system to detect the COVID-19 infection in chest X-rays with better accuracy. This scheme implemented a Deep-Learning-Method (DLM) using the following stages; (i) Image collection and pre-processing, (ii) Pre-trained DLM implementation and performance evaluation, (iii) Combining the deep and machine features, (iv) Feature optimization with Firefly-Algorithm (FA) and (v) Feature integration and classification.
In this work, initially, the performance of the chosen DLM is verified using the SoftMax classifier. After selecting the DLM with the best performance, its features are then combined with the machine features to verify the performance of COVID-19 detection. During this work, along with the SoftMax classifier, other two-class classifiers from the literature are considered. The detection performance of the system is verified using a 5-fold cross-validation process. In this research, the SVM-RBF classifier helped to get a better COVID-19 with the deep features (> 92%) and, Fine KNN provided improved accuracy (> 96%) for combined optimal features.
The main contributions of this research work are;
(i) Implementation of FA based feature optimization to avoid the over-fitting problem.
(ii) Improving the accuracy of COVID-19 detection with combined deep and handcrafted features.
The remaining parts of this study are as follows. Section 2 presents the context, section 3 presents the various phases existing in the proposed scheme, and sections 4 and 5 depict the results and conclusion of the present work, respectively.
2Context
The detection of lung infection using chest X-ray is a commonly approved technique and, several previous works can be found in the literature using conventional machine learning and advanced deep learning to detect the virus cases [1, 3, 23]. COVID-19 is a deadly disease, which causes severe lung infection. Due to its rapid spread nature, it affected a large human community globally and, several studies are proposed to diagnose this infection with better accuracy. The detection of COVID-19 using X-ray is a commonly adopted scheme and several earlier research works existing in the literature are summarized in Table 1.
Table 1
Summarized literature works
| Reference | Implemented method |
| Alyasseri et al. [3] | This research demonstrated a detailed review on the detection of COVID-19 with various machine and deep learning techniques. |
| Houssein et al. [8] | Implementation of improved Convolutional Neural Network (CNN) technique is presented to diagnose the infection from X-ray pictures. |
| Hussain et al. [9] | This study developed a novel DLM called “CoroDet” to categorize the clinical grade chest radiographs into normal/disease class. |
| Ismael et al. [10] | Implemented DLM to detect the infection level and discussed. |
| Jacobi et al. [11] | This work demonstrated a comprehensive review with various existing methods to detect the infection from the chosen X-ray images. |
| Jain et al. [12] | Employed a pre-trained DLM to detect the disease infection rate with better accuracy. |
| Karbhari et al. [13] | DLM supported detection of the lung infection with real and synthetic chest X-ray is presented. |
| Kumar et al. [16] | A comprehensive review of different existing schemes to identify with improved accuracy is presented. |
| Mohammad-Rahimi et al. [17] | The role of Machine-Learning technique in detecting the COVID-19 using x-ray/CT is presented. |
| Sahlol et al. [25] | The marine predators algorithm optimized deep-features based disease detection is presented using the lung images collected from a benchmark database. |
| Tuncer et al. [31] | Implementation of the Local Binary Pattern (LBP) based disease detection using X-ray pictures is presented. |
The earlier work presented in the above table either uses a new deep learning method (DLM) or a conventional machine learning method (MLM) to detect the COVID-19. The former study in the literature authenticates the combination of the features of DLM and MLM, which helps to get better disease detection in various modality medical images [26]. The proposed work tests the value of the developed structure using DLM first, then the features of the DLM and MLM are optimized with FA. After reducing the feature vector to a lower level, a serial concatenation is then implemented to get a new feature vector, which is then considered to train and validate the disease detection performance of the proposed scheme. The main merit of the proposed scheme compared to the other methods of Table 1 is the integration of features and FA based feature optimization. This approach helps to get a better result compared to other methods considered in this work.
3Method
This part of the work presents the various methods integrated to form the proposed scheme. Figure 1 presents the implementation of the DLM to classify X-ray images into normal/COVID-19 section. In this work, the well-known DLM, which uses an image dimension of 224×224×1 pixels, is considered in the investigation. Based on the attained accuracy, the appropriate DLM for the chosen database examination is confirmed. The considered classification task is implemented using the traditional deep features extracted using the DLM. The SoftMax based classification is employed and based on its result, the VGG16 model is selected.
Fig. 1
Pre-trained DLM based chest X-ray classification.
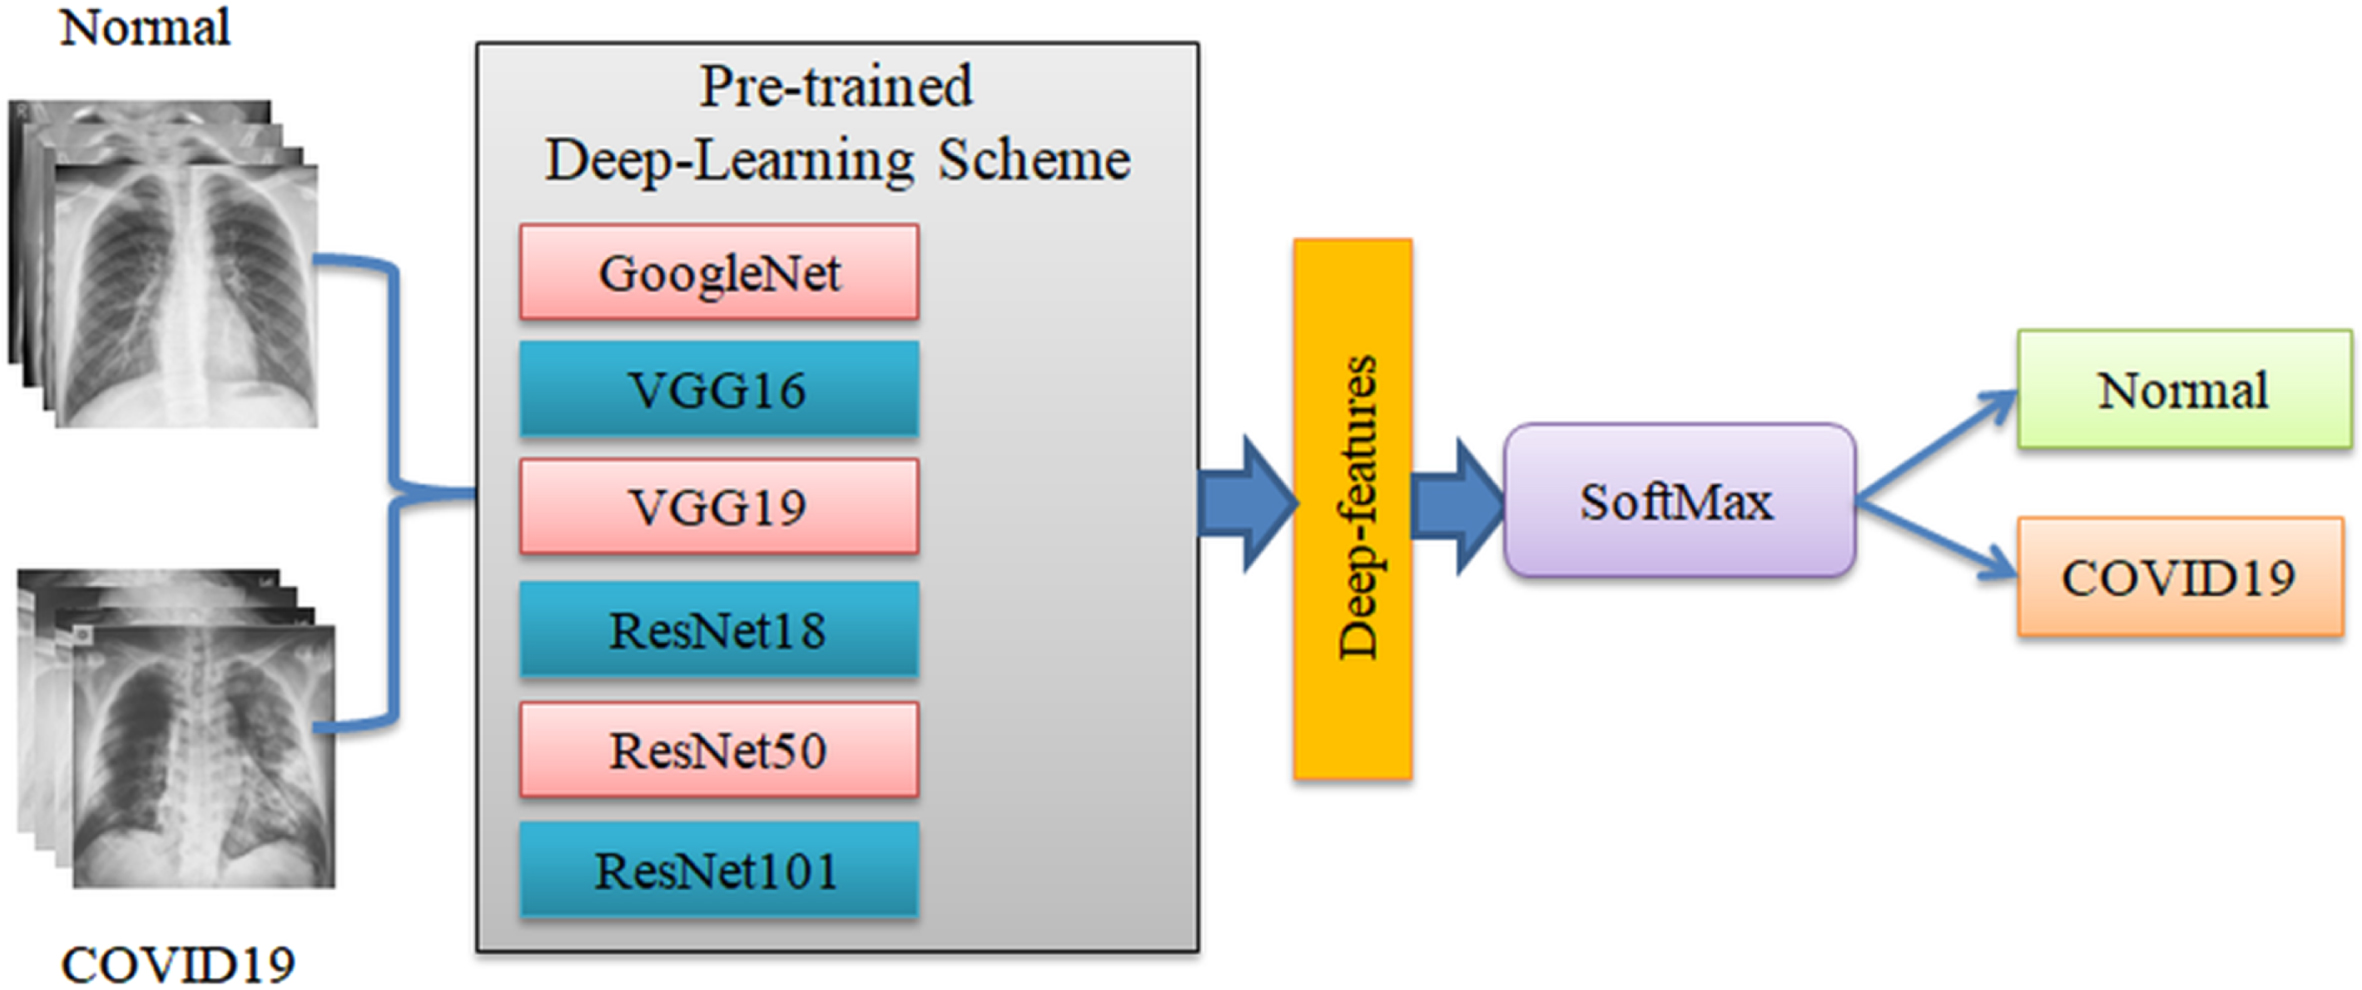
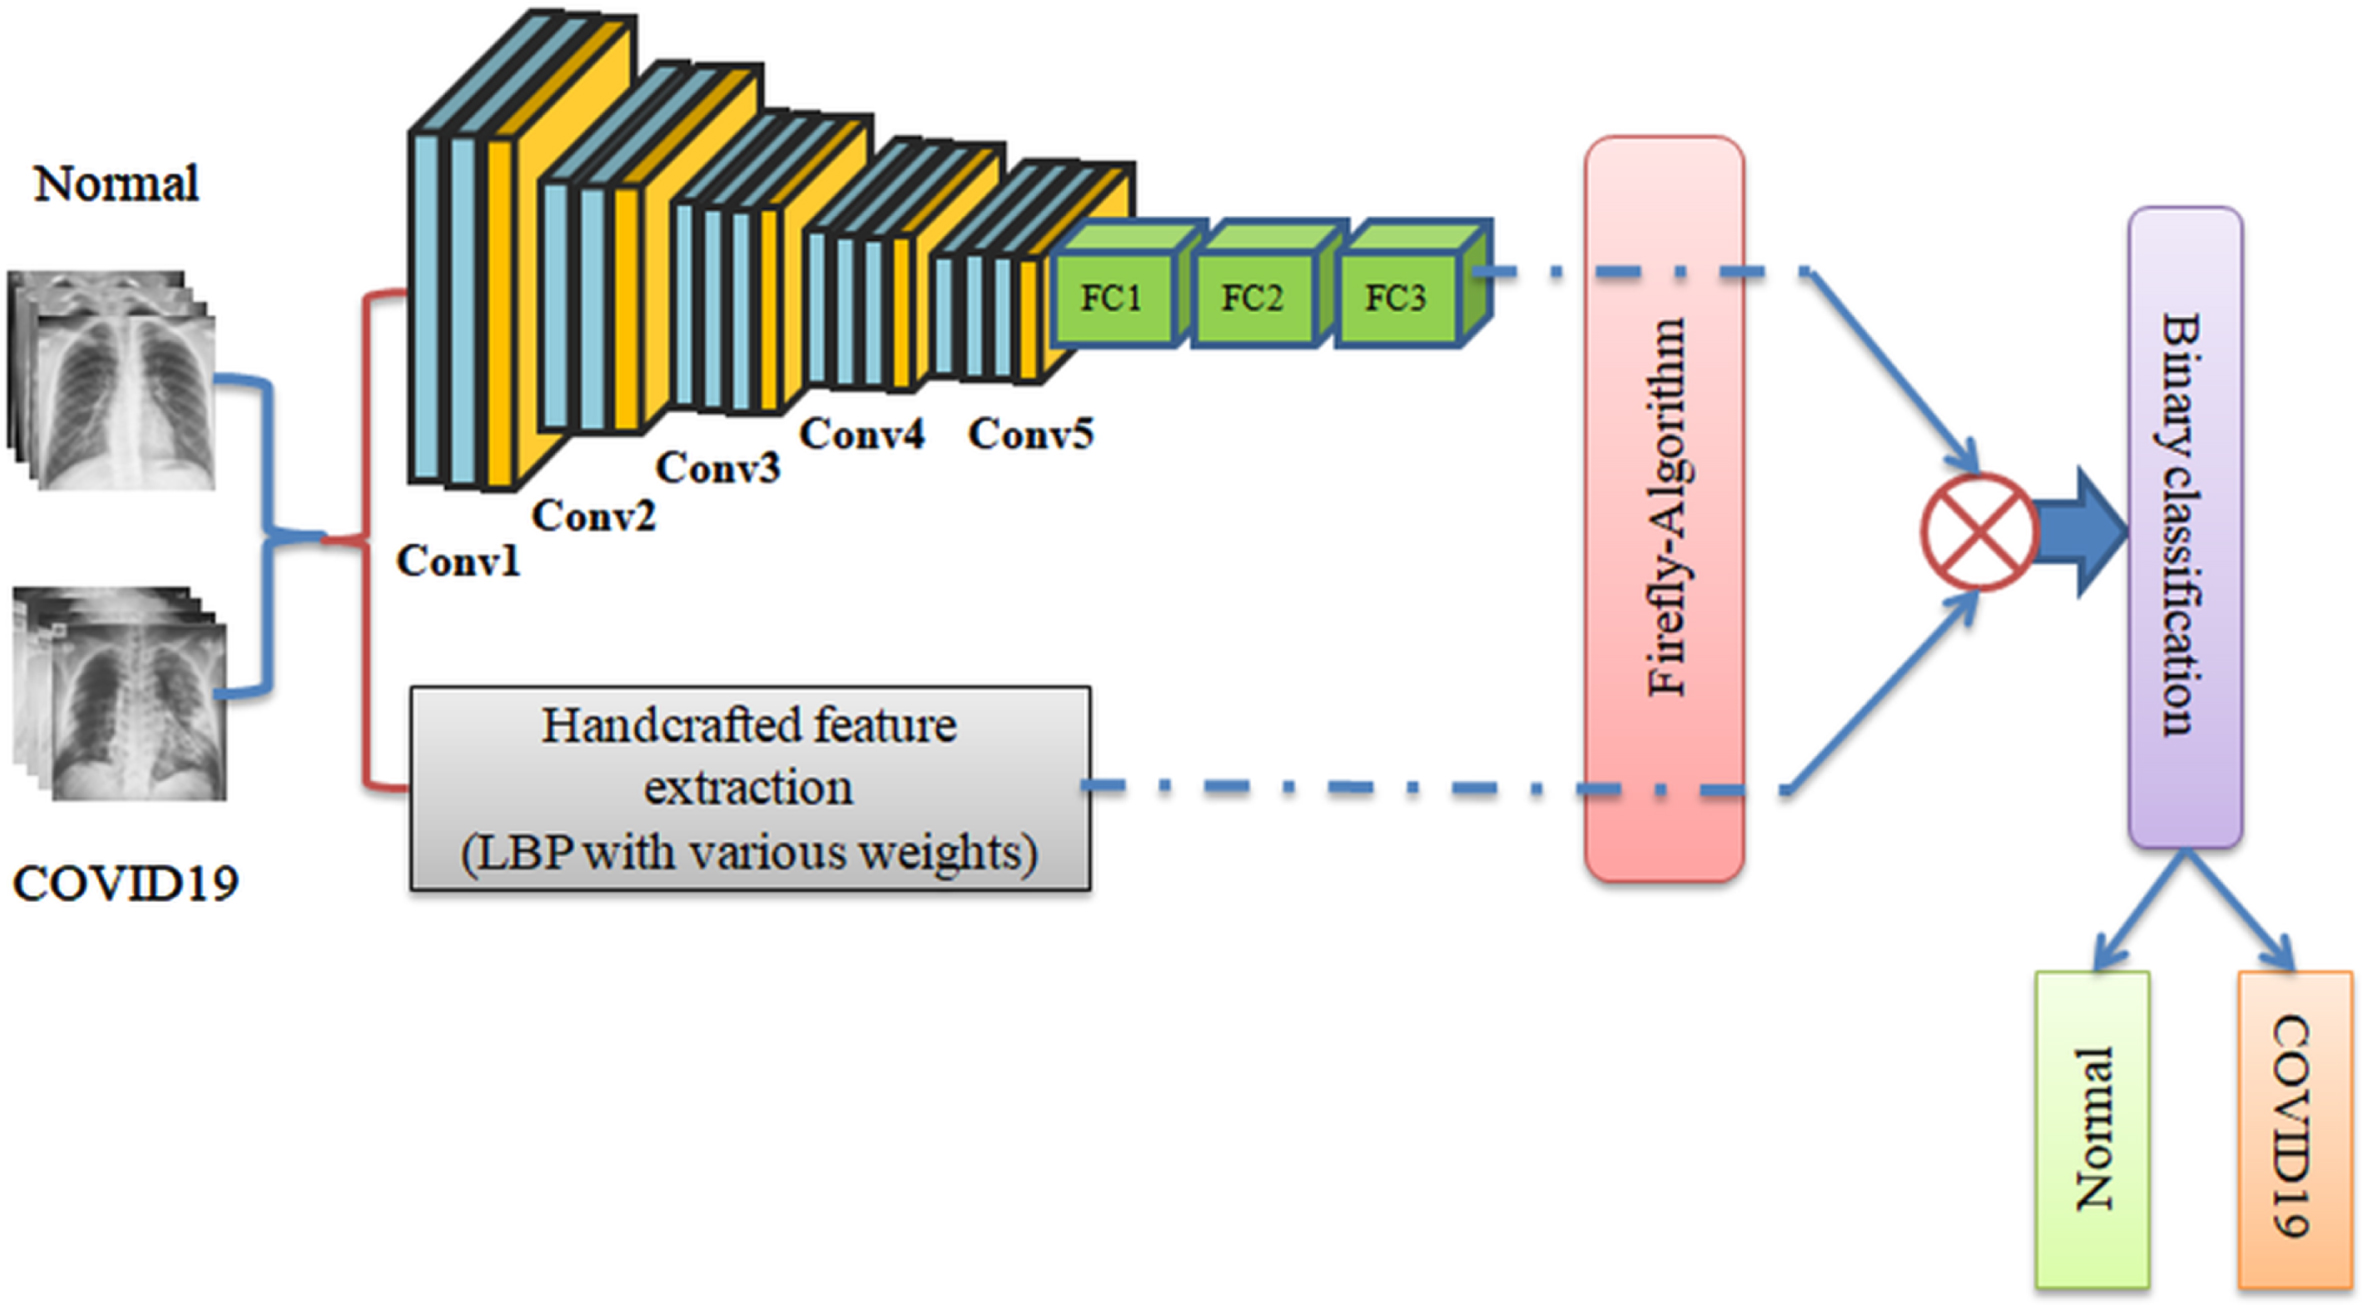
Figure 2 presents the proposed scheme, which integrates the FA optimized deep and machine features. The necessary machine-learning features were extracted using the Local Binary Pattern (LBP) of various weights as discussed [7]. The FA optimized deep and LBP features are serially integrated, and this feature vector is then considered to train and validate the two-class classifier. In this work, 5-fold cross-validation is employed and based on the achieved result, the performance of the proposed scheme is confirmed.
Fig. 2
Structure of the proposed COVID-19 detection system.
3.1Image database
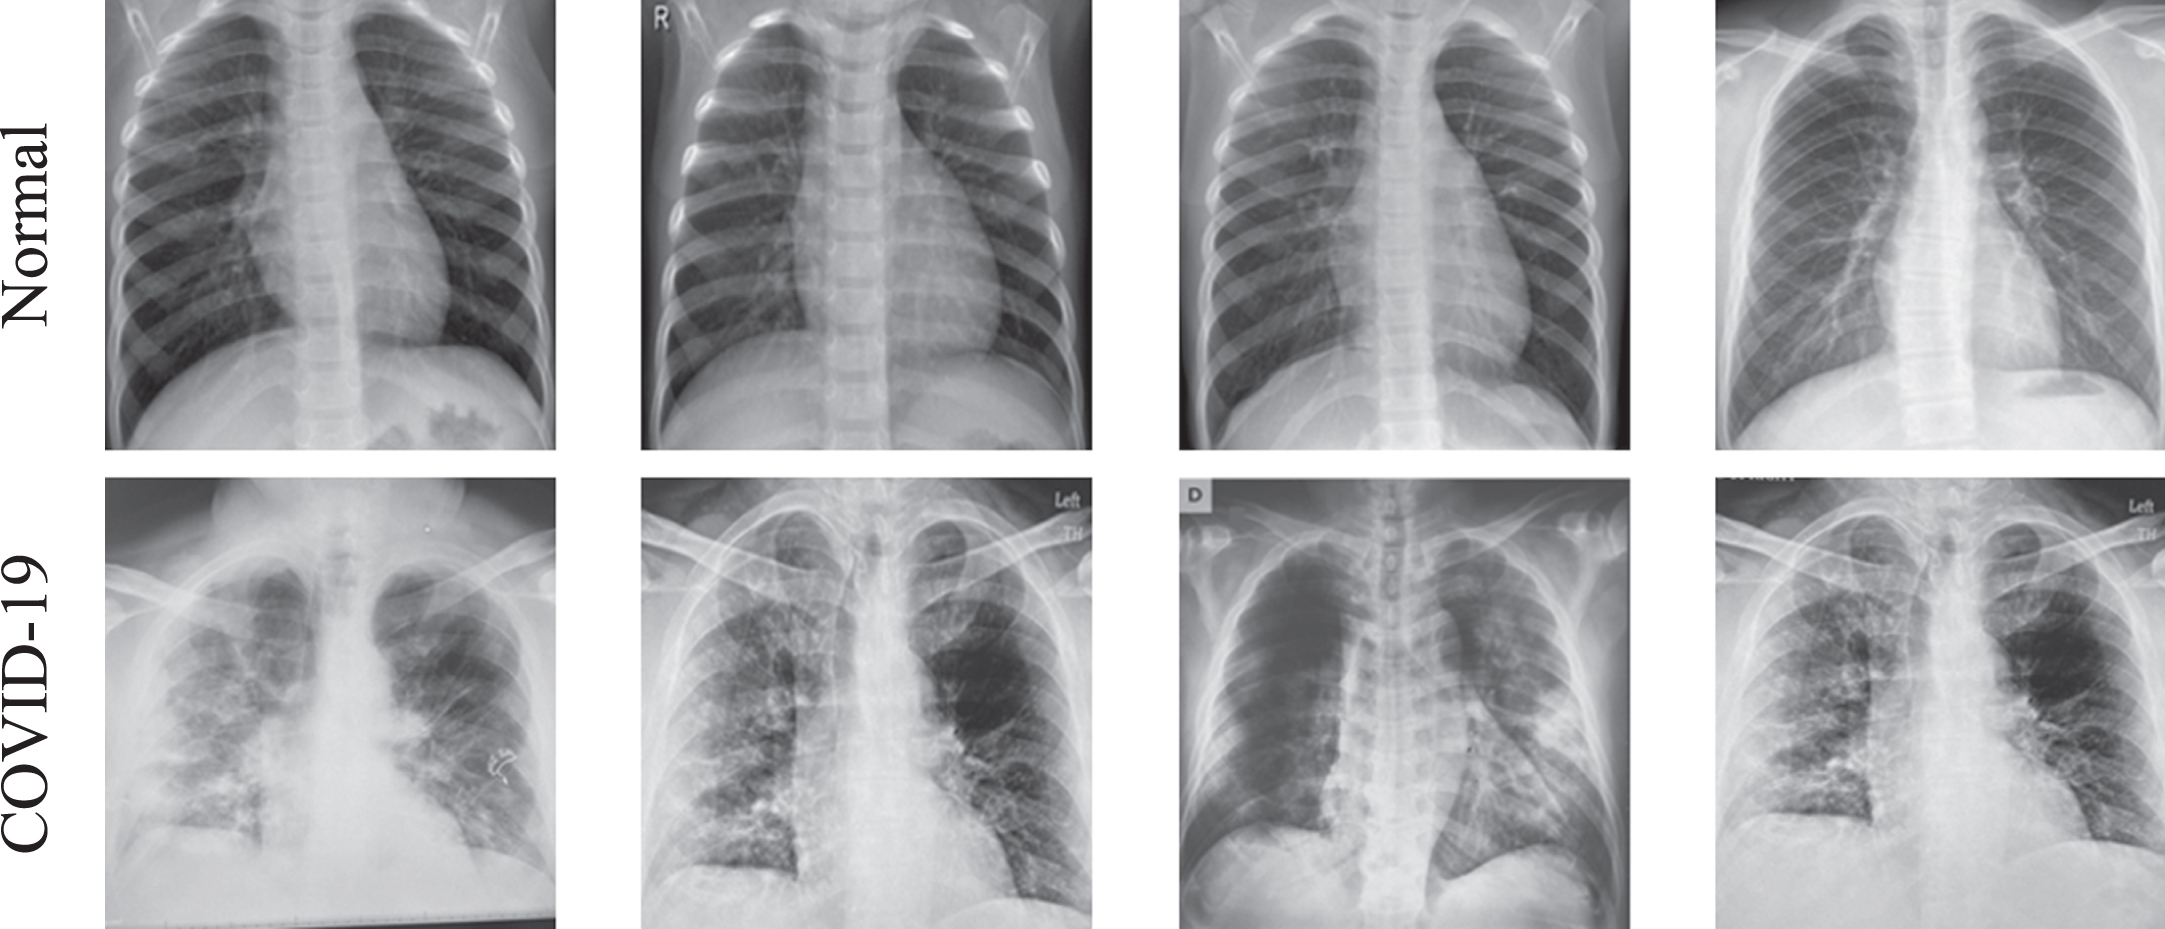
The performance of the computerised disease assessment scheme mainly depends on the medical database considered to train the system. In this work, the available chest x-ray database [38] is considered for the assessment. From this dataset 3600 greyscale images (1800 disinfected and 1800 COVID-19) are taken for the experiment. The number of training (70% of the total images) and validation (30%) adopted in this study is presented in Table 2 and, the sample test images of this database are presented in Fig. 3. Each depiction is resized to pixels, before the assessment with the DLM.
Table 2
Test imagery considered for investigation
| Image type | Dimension | Images | ||
| Total | Training | Testing | ||
| Healthy | 224 × 224 × 1 | 1800 | 1260 | 540 |
| COVID-19 | 224 × 224 × 1 | 1800 | 1260 | 540 |
Fig. 3
Sample X-ray images of the chosen database.
During the 5-fold cross-validation process, the sample test images are shuffled arbitrarily and, the new dataset consists of 1080 images (540 disinfected and 540 COVID-19 class) to get a dataset of 5-groups. In each class, 540 images are considered during the cross-validation, and the performance of the classifier is tested and verified.
3.2Feature extraction
In this work, two different features such as deep and LBP are extracted. The deep features are extracted from the chosen DLM, like GoogleNet, VGG16, VGG19, ResnEt18, ResNEt50 and ResNet101 [14, 19, 24, 27, 29, 32]. After getting the necessary features, the LBP features with various weights presented in [7] are adopted, and the extracted features are then reduced to avoid the overfitting problem.
The number of deep features after the possible drop out is 1×1×1024, the LBP based features with various weights, like W = 1 to 4 is achieved. This scheme helped to get a feature vector of dimension 1×1×236; from these features, the optimal values are selected with FA, and the selected features are serially combined and, this new feature vector is considered to get the necessary results.
3.3Feature optimization
This work consists of the deep and machine features obtained using a chosen procedure. The deepfeatures are initially extracted using the chosen pre-trained DLM. Initially, an experimental investigation is conducted with the chosen DLM and the classification outcome of SoftMax is then verified. This outcome confirms that the result of VGG16 is better compared to other DLMs considered in this research.
The complete information about the VGG16 can be found in [5, 24] and in this work, the following parameters are assigned for the VGG16; conventional image augmentation technique.It is assigned during the learning. The learning rate is fixed as 1e-5, Linear-Dropout-Rate (LDR) based training with and Adam optimization. The numbers of iterations are assigned as 2000 with 50 epochs and SoftMax classifier with 5-fold cross-validation. This DLM helped to get a total feature of 1 × 1 ×4096 from the final Convolutional + Maxpool layer. These features are then passed through three fully connected layers having a dropout value of 50% and after this dropout, the original deep features are then reduced to 1 × 1 ×1024. These features are the prime deepfeatures to check the merit of the proposed system. Equation (1) presents the deep-feature of VGG16;
(1)
The necessary machine-features are then obtained using the Local-Binary-Patterns (LBP) developed using varying weights (W = 1 to 4) as discussed in [7]. Every pattern provides a feature vector of dimension 1 × 1 ×59 and, the total features obtained from these images is 1 × 1 ×236 and this information is depicted in the Equations (2) to (6);
(2)
(3)
(4)
(5)
(6)
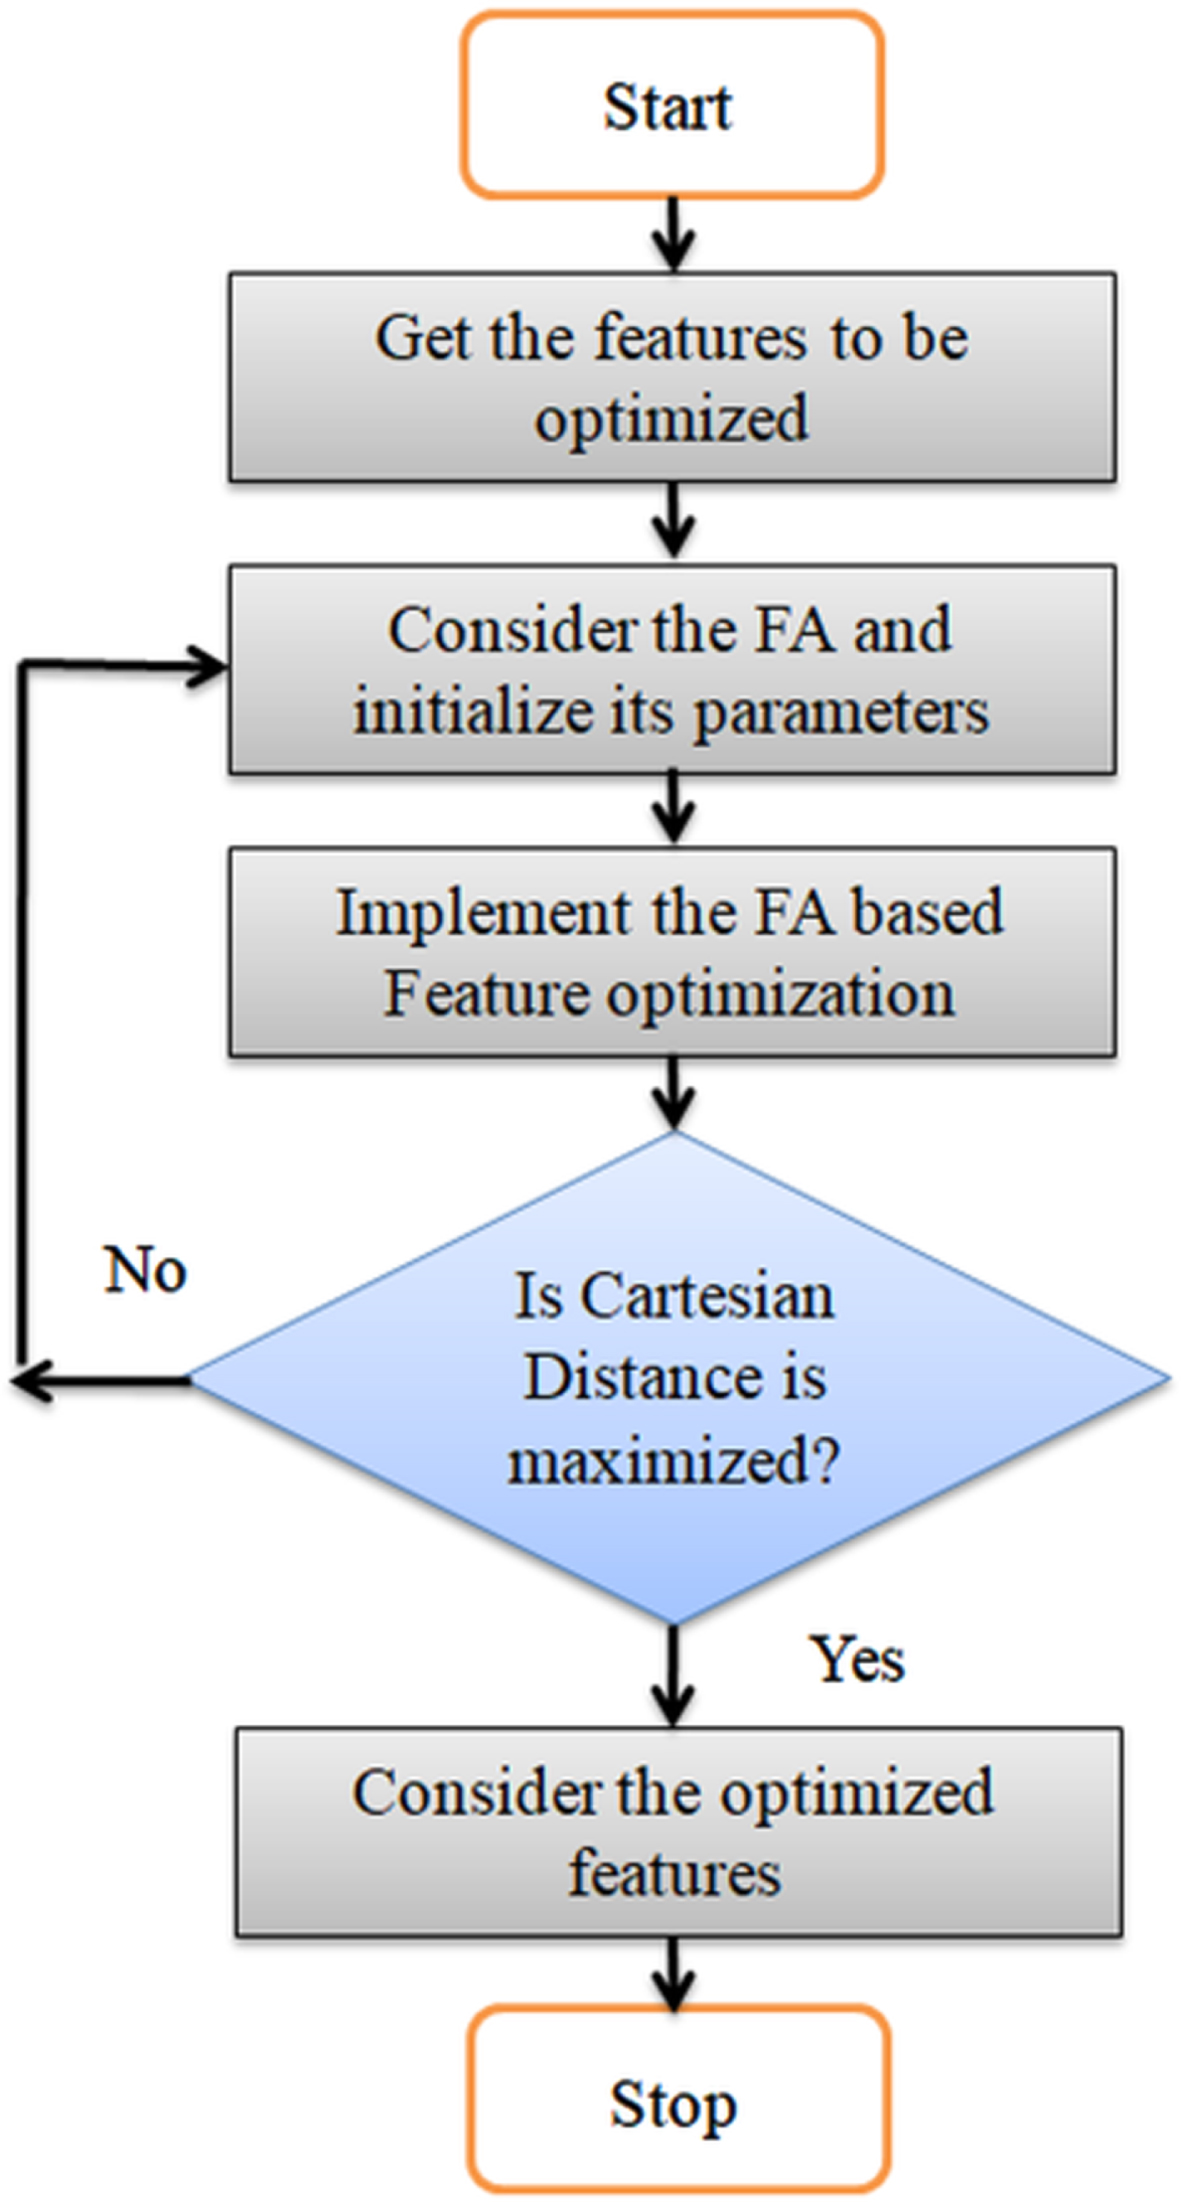
The FA based feature optimization is then employed to reduce the features of Equations (1) and (6). The necessary information about the heuristic algorithm-based feature selection is available in [8] and in this work, the maximization of the Cartesian distance is chosen as the objective value. The features whose values are more is selected and the features whose values information is less are discarded. In this work, 1 × 1 ×611 number of deep features and 1 × 1 ×117 machine features are selected by the FA and a serial concatenation is then implemented to integrate these features.
The FA is initially invented by Yang in 2009 [34, 35] based on the mimic of the Firefly’s foraging strategy and due to its merit, the traditional and modified form of FA is widely adopted to solve a variety of optimization tasks [15, 22, 30]. The traditional FA consist a Lévy flight operator, which helps to move the flies towards the optimal solution with better accuracy. In the proposed work, the FA is employed to optimize the features by maximizing the Cartesian Distance (CD) among the features. This process can be depicted as in Equation (7);
Let us consider, there exist two fireflies; i and j located in di and dj in a D-dimensional search location. Mathematically, this CD can be expressed as;
(7)
During the optimization task, the FA is allowed to find the feature subset whose
The movement of a Firefly towards another Firefly is monitored. It is based on the Cartesian distance and this concept is utilized in this work to find the optimal features. The FA is allowed to compare the feature value of normal and COVID-19 class and, if the distance between the features is more, it is selected as the optimal features. Other information in relation to the FA- based feature selection can be found in [28, 33, 36].
(8)
The feature vector in Equation (8) is then considered to train and validate the system.
The feature optimization process is depicted in Fig. 4. The FA based optimization is continued till the optimal features are identified from the considered feature set.
Fig. 4
FA based feature selection procedure.
3.4Performance evaluation
The proposed system is initially tested using SoftMax classifier and, after getting the necessary outcome, other classifiers, such as Naive Bayes, Random Forest, Decision Tree, Fine KNN, Course KNN, SVM-Linear and SVM-RBF available in the literature [14]. The merit of the proposed system is to be established by calculating the essential performance measures. This research adapts the measures obtained and these measures include; True-Positive (T+ve), False-Negative (F–ve), True-Negative (T–ve), and False-Positive (F+ve), Accuracy (ACC), Precision (PRE), Sensitivity (SEN), Specificity (SPE) and Negative-Predictive-Value (NPV) are obtained from these values and the mathematical expressions are presented in Equations (9) to (13) [5, 6, 20, 23].
(9)
(10)
(11)
(12)
(13)
4Results and discussion
This the part of research reveals the outcome attained with the workstation; Intel i5 processor with 20GB RAM and 2GB VRAM operational with MATLAB®.
During the experimental investigation, the necessary images are collected from the database, and then every image is resized to 224 × 224 × 1. The resized image is then considered for the experimental investigation. In this work, 1800 numbers of the test images of Normal/COVID-19 class are considered for the examination. Initially, the performance of pre-trained DLM is established by this image database and the classification accuracy achieved with SoftMax is then considered to choose the appropriate DLM for the COVID-19 detection with X-ray.
The heat map obtained from the chosen test image of disinfected/COVID-19 class during the VGG16 implementation is depicted in Fig. 5. This image confirms the existing dissimilarity between the images and the visibility of the lung section in disease infected section is less compared to the normal section. The results obtained for the pre-trained DLM is depicted in Table 3 and this result confirms that the classification accuracy achieved using the VGG16 is better than other methods. Hence, in this work, the VGG16 scheme is considered to examine the chest X-ray with the proposed method.
Fig. 5
Heat map of the X-ray image for normal and disease class.
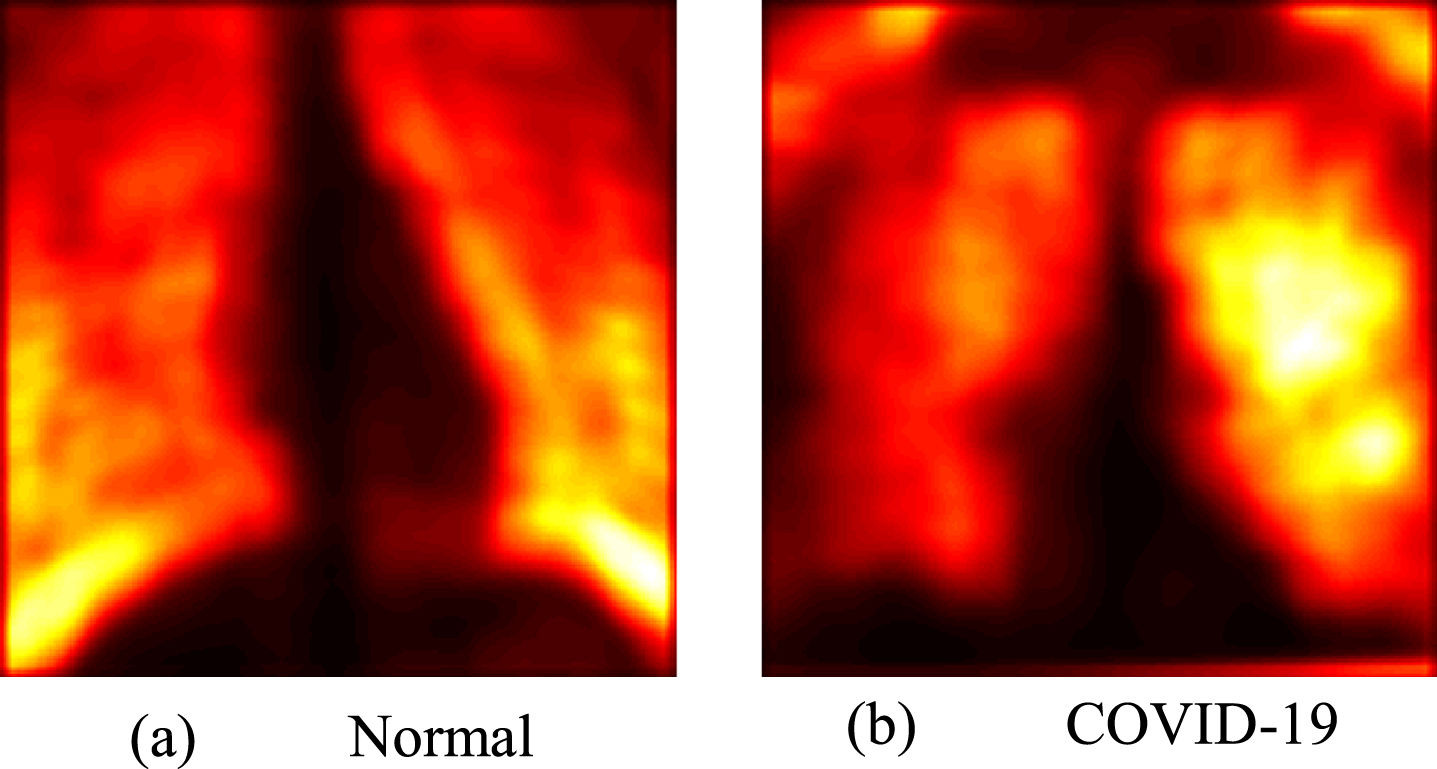
Table 3
Performance evaluation of pre-trained DLM with X-ray images
| Deep learning scheme | T+ve | F-ve | T-ve | F+ve | ACC | PRE | SEN | SPE | NPV |
| GoogleNet | 477 | 63 | 461 | 79 | 86.85 | 85.79 | 88.33 | 85.37 | 87.97 |
| VGG16 | 488 | 52 | 494 | 46 | 90.92 | 91.38 | 90.37 | 91.48 | 90.47 |
| VGG19 | 491 | 49 | 482 | 58 | 90.09 | 89.43 | 90.92 | 89.25 | 90.77 |
| ResNet18 | 479 | 61 | 483 | 57 | 89.07 | 89.36 | 88.70 | 89.44 | 88.78 |
| ResNet50 | 475 | 65 | 486 | 54 | 88.98 | 89.79 | 87.96 | 90.00 | 88.20 |
| ResNet101 | 474 | 66 | 481 | 59 | 88.42 | 88.93 | 87.78 | 89.07 | 87.93 |
The performance of VGG16 is depicted in Fig. 6, in which Fig. 6(a) presents the search convergence along with obtained values of accuracy and error rate. The confusion achieved during the classification is presented in Fig. 6(b). From this result, it can be noted that the VGG16 scheme with traditional deep feature helped to achieve a categorization accuracy of > 90%.
Fig. 6
Performance achieved with the VGG16 scheme.
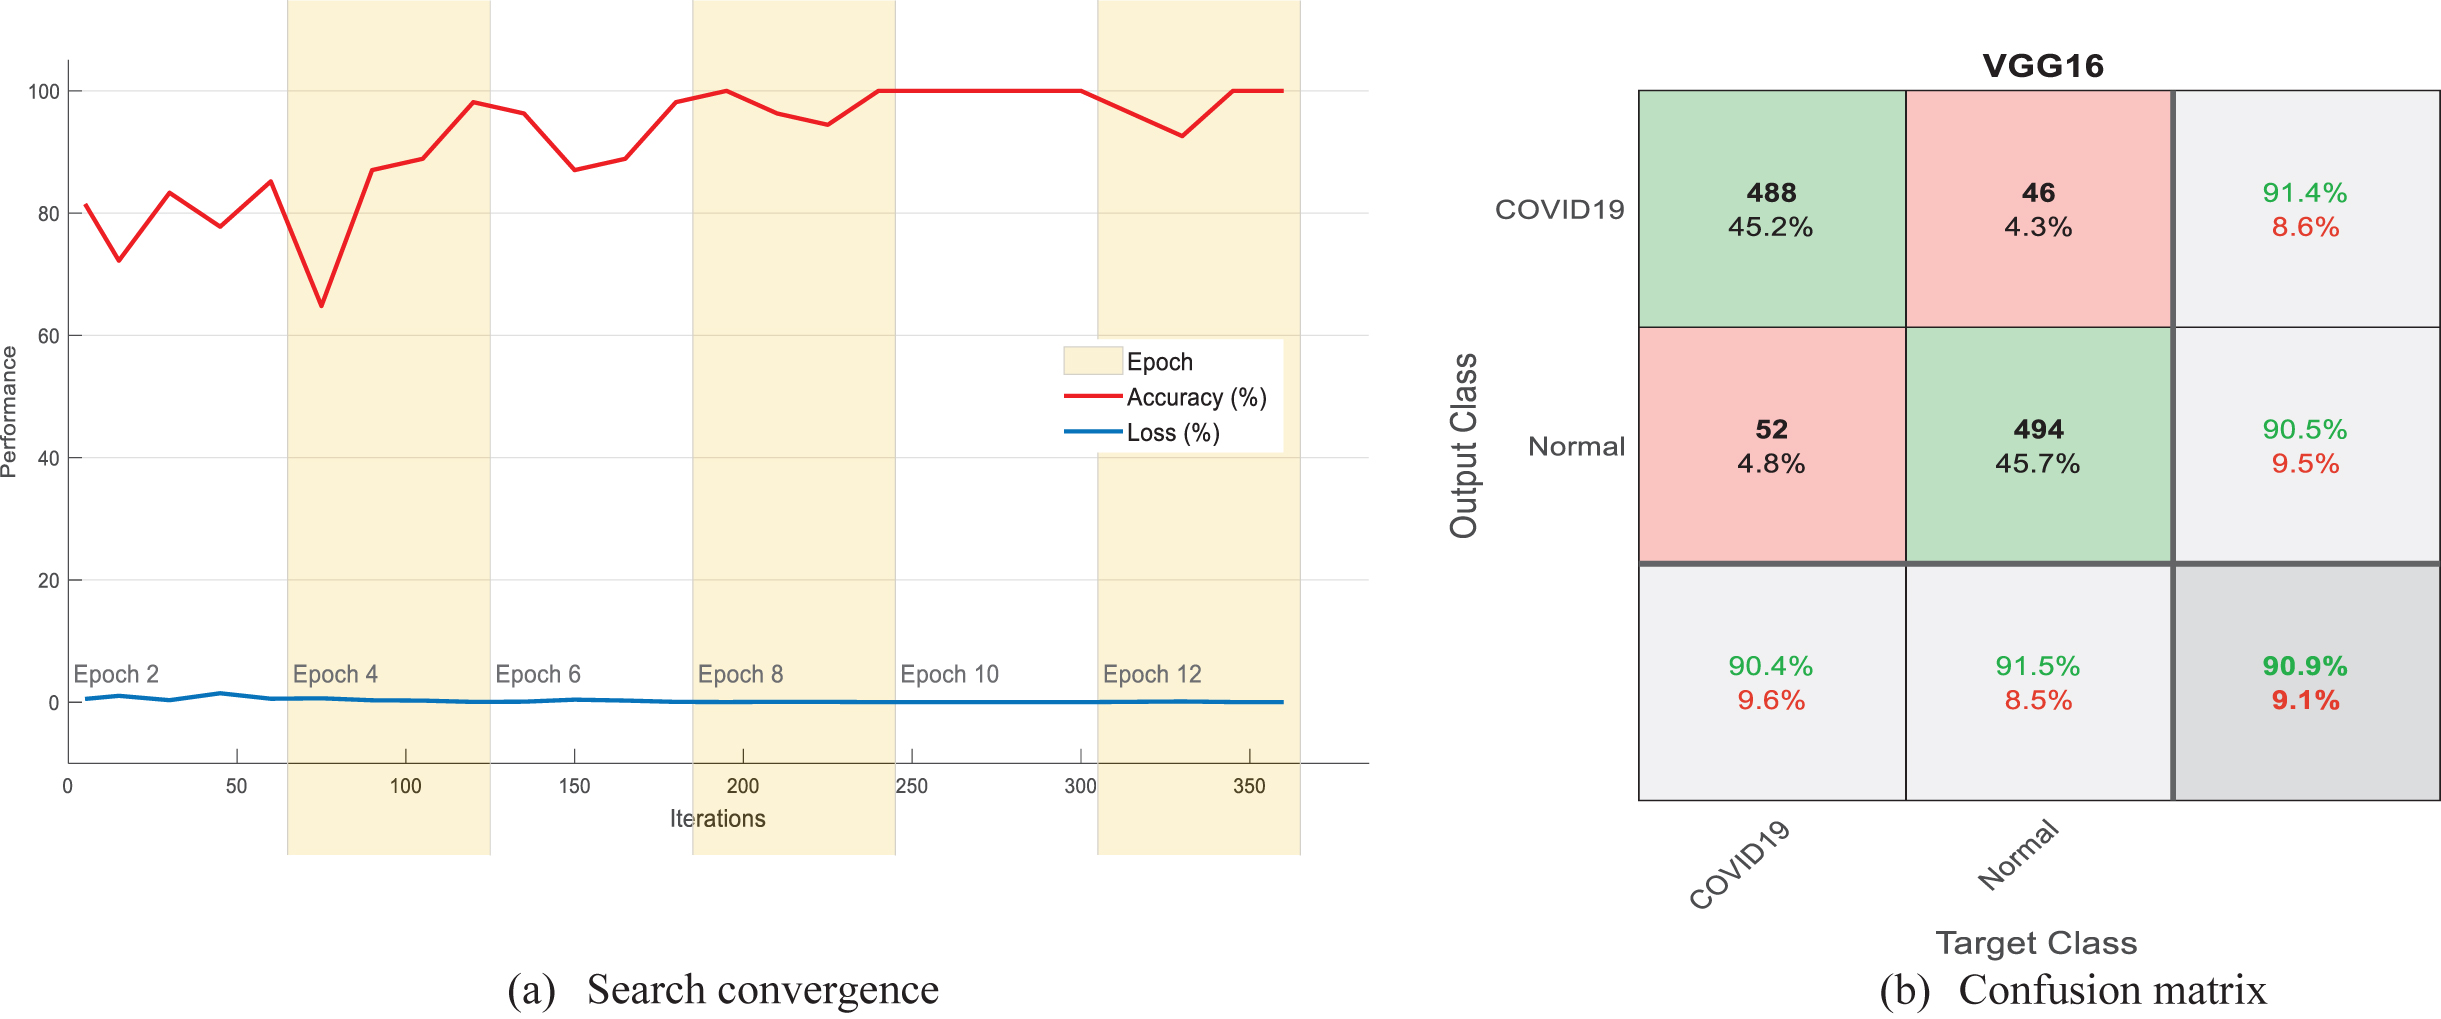
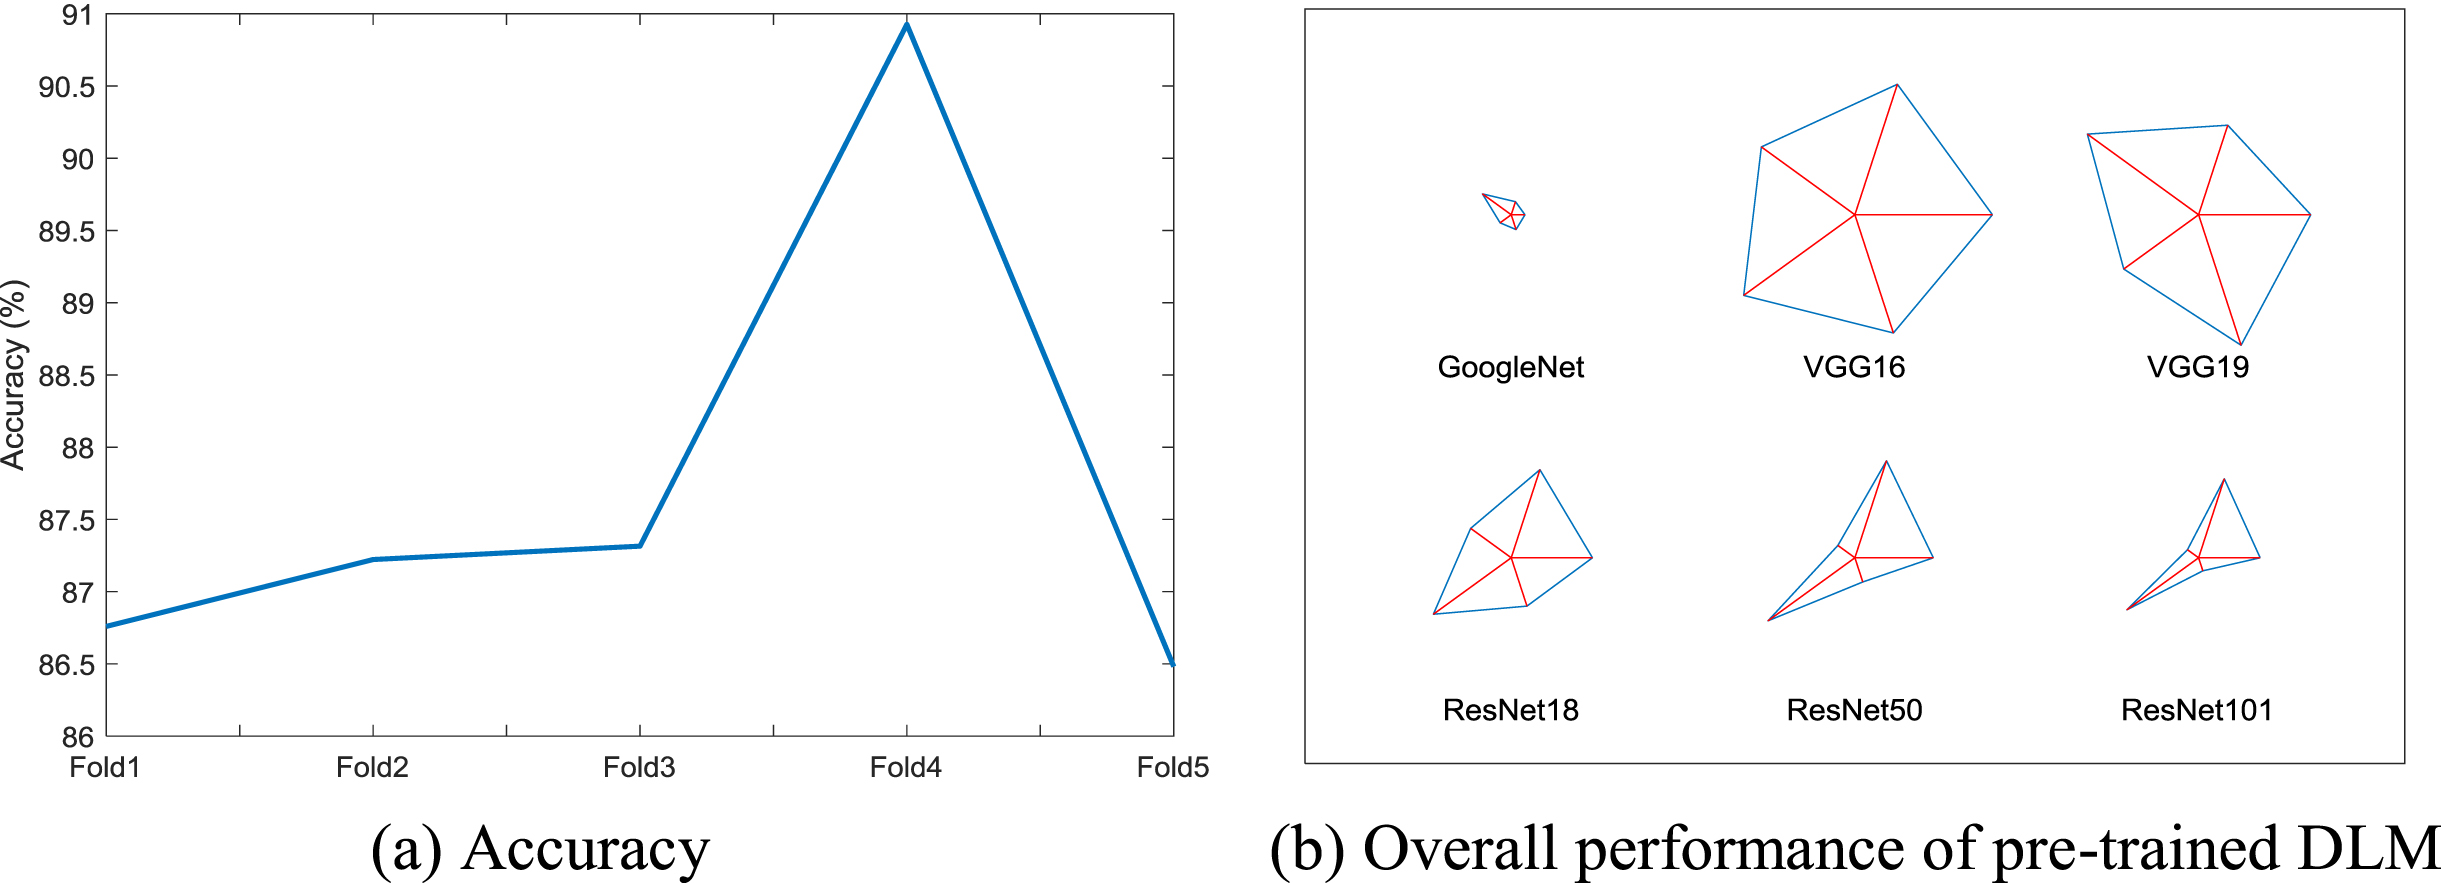
Table 4 presents the outcomes during the 5-fold cross validation process and the achieved accuracy variation is depicted in the Fig. 7(a) and (b), presents the overall performance of the pre-trained DLM, which confirms that the Glyph-pattern developed for VGG16 is bigger (superior) compared to other schemes.
Table 4
Outcome of the 5-fold cross validation achieved with VGG16 and SoftMax classifier
| Validation | T+ve | F-ve | T-ve | F+ve | ACC | PRE | SEN | SPE | NPV |
| Fold1 | 467 | 73 | 470 | 70 | 86.75 | 86.96 | 86.48 | 87.03 | 86.56 |
| Fold2 | 472 | 68 | 470 | 70 | 87.22 | 87.08 | 87.41 | 87.03 | 87.36 |
| Fold3 | 469 | 71 | 474 | 66 | 87.31 | 87.66 | 86.85 | 87.78 | 86.97 |
| Fold4 | 488 | 52 | 494 | 46 | 90.92 | 91.38 | 90.37 | 91.48 | 90.47 |
| Fold5 | 466 | 74 | 469 | 72 | 86.48 | 86.61 | 86.29 | 86.67 | 86.34 |
Fig. 7
Performance assessment of the DLM.
After selecting the appropriate DLM for evaluating he X-ray database, the FA based feature optimization is selected. It is then employed to reduce the deep features and machine features.
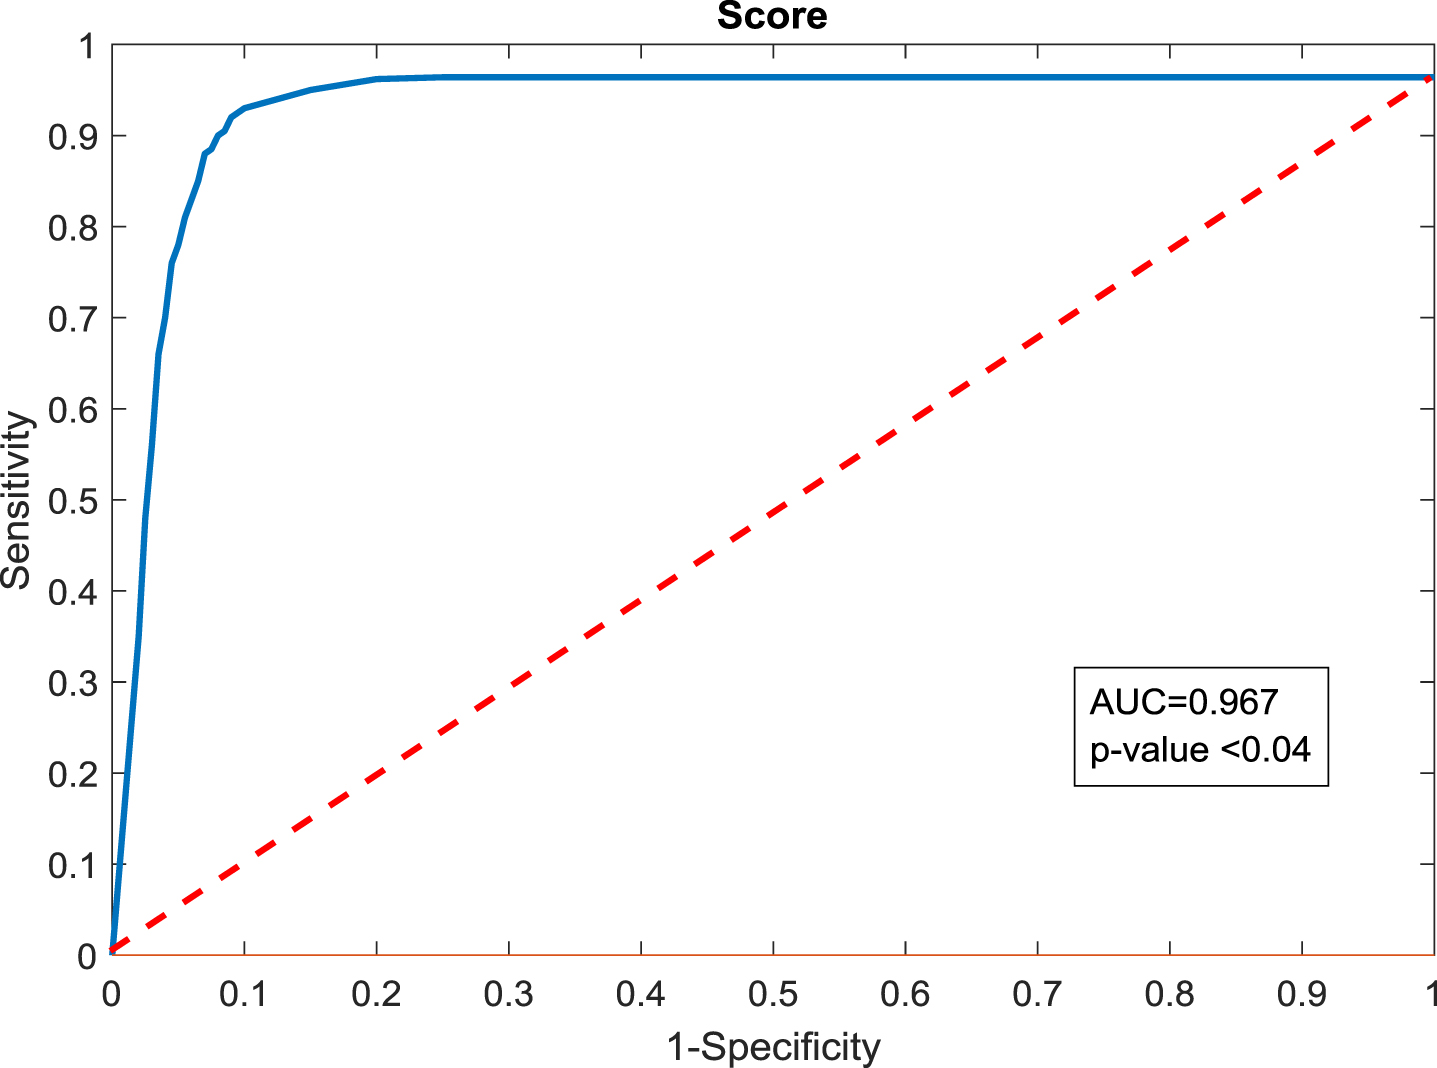
Figure 8 depicts the LBP pattern generated with weights (4) with a value of 1 to 4 and the number of features obtained with these images is 1 × 1 ×236. It is then reduced to 1 × 1 ×117. This feature is then reduced with the optimal deep features and the classification task is implemented with the classifiers considered in this work. The result achieved during the experimental investigation is presented in Table 5. This table separately presents the outcome with optimal deep-features and combined deep and machine features. This table confirms that the proposed work helps to get the better result with deep and integrated features. Figure 9 depicts the confusion matrix achieved with SVM-RBF and Fine KNN classifier. This confirms the merit of this work. Figure 10 presents the Receiver Operating Characteristic Curve (ROC) achieved for Fine KNN classifier with Deep + Handcrafted features.This confirms the merit of the proposed scheme,which helped to get better values of Area Under Curve (AUC) and p-value.
Fig. 8
LBP generated using weights W = 1 to 4.
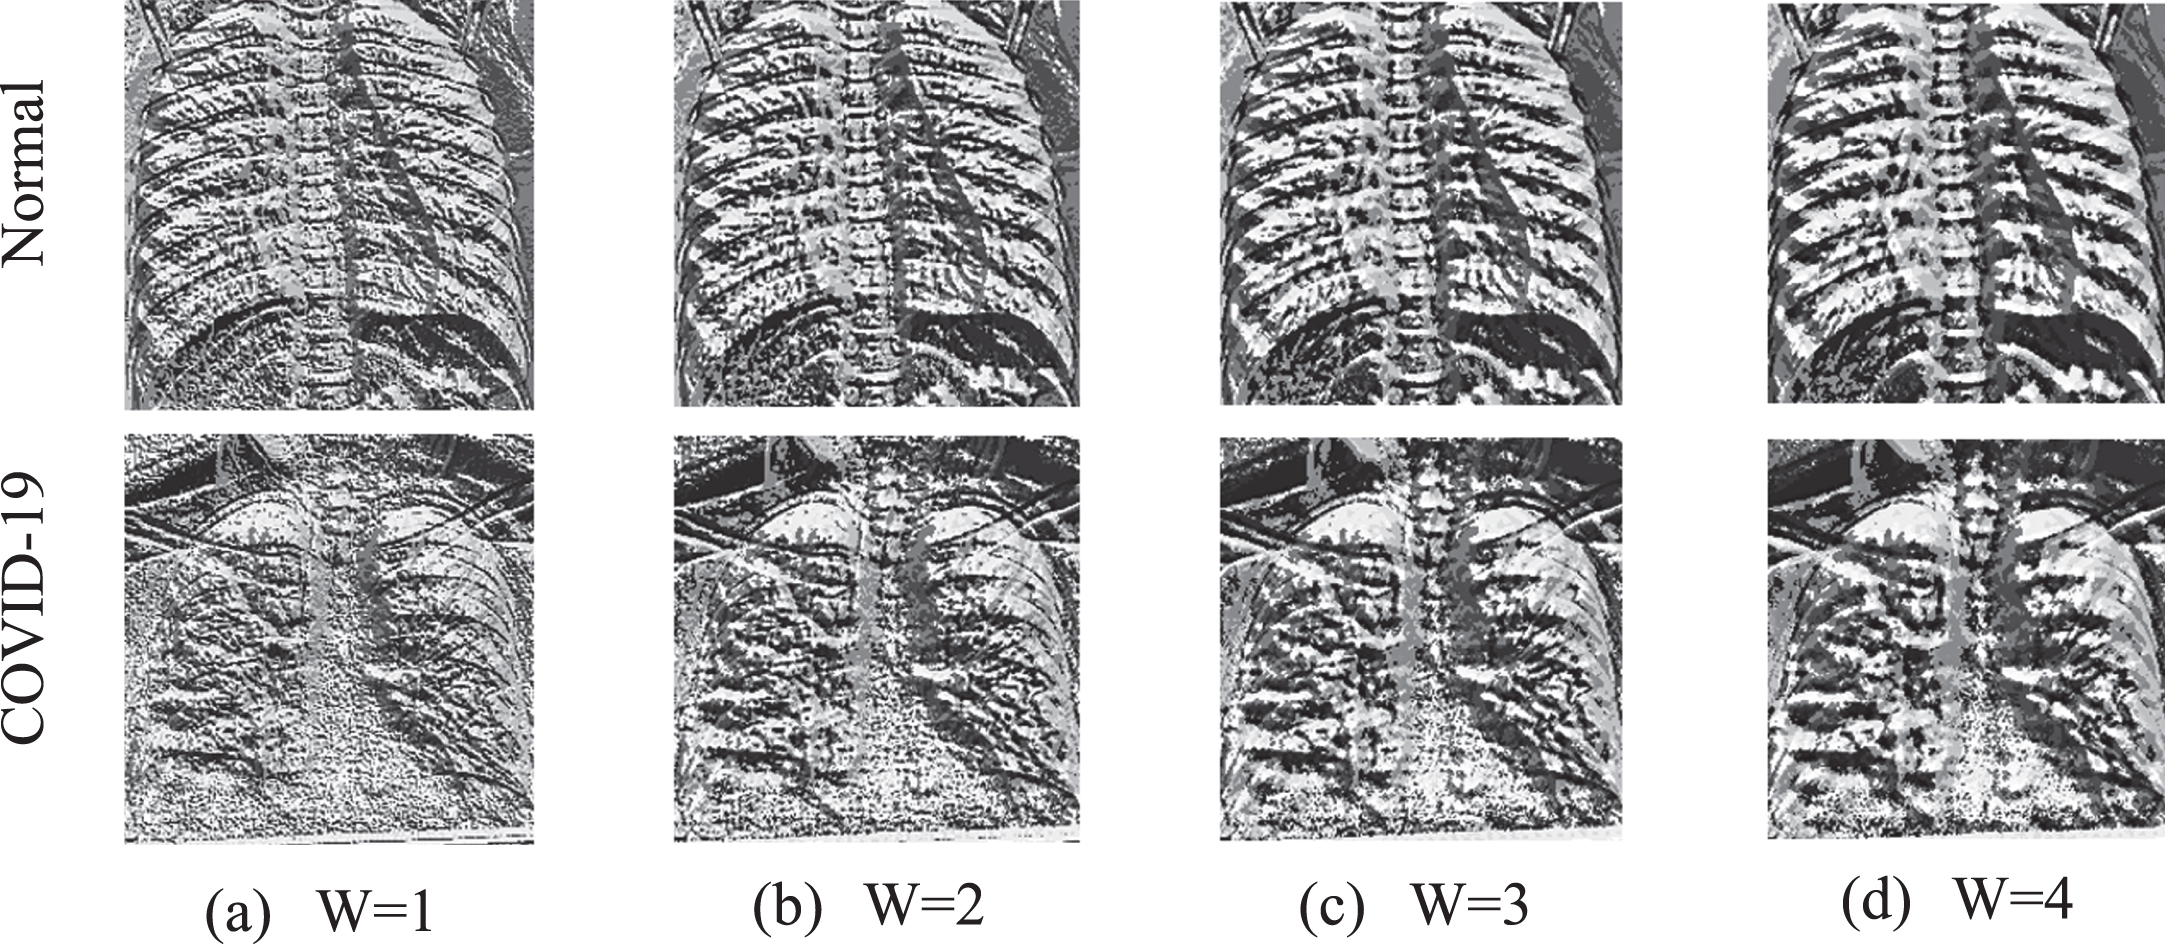
Table 5
Experimental outcome achieved with the optimal features
| Feature | Classifier | T+ve | F-ve | T-ve | F+ve | ACC | PRE | SEN | SPE | NPV |
| Optimized deep features | SoftMax | 491 | 49 | 495 | 45 | 91.29 | 91.60 | 90.92 | 91.67 | 90.99 |
| Naive Bayes | 492 | 48 | 487 | 53 | 90.64 | 90.27 | 91.11 | 90.18 | 91.02 | |
| Random Forest | 496 | 44 | 498 | 42 | 92.03 | 92.19 | 91.85 | 92.22 | 91.88 | |
| Decision Tree | 491 | 49 | 503 | 37 | 92.03 | 92.99 | 90.92 | 93.14 | 91.12 | |
| Fine KNN | 501 | 39 | 495 | 45 | 92.22 | 91.75 | 92.78 | 91.67 | 92.69 | |
| Coarse KNN | 491 | 49 | 504 | 36 | 92.13 | 93.17 | 90.92 | 93.33 | 91.14 | |
| SVM-Linear | 489 | 51 | 493 | 47 | 90.92 | 91.23 | 90.56 | 91.29 | 90.62 | |
| SVM-RBF | 502 | 38 | 497 | 43 | 92.50 | 92.11 | 92.96 | 92.03 | 92.89 | |
| Optimized Deep + Machine features | SoftMax | 519 | 21 | 513 | 27 | 95.56 | 95.05 | 96.11 | 95.00 | 96.07 |
| Naive Bayes | 522 | 18 | 517 | 23 | 96.20 | 95.78 | 96.67 | 95.74 | 96.63 | |
| Random Forest | 519 | 21 | 520 | 20 | 96.20 | 96.29 | 96.11 | 96.29 | 96.12 | |
| Decision Tree | 514 | 26 | 508 | 32 | 94.63 | 94.14 | 95.18 | 94.07 | 95.13 | |
| Fine KNN | 522 | 18 | 520 | 20 | 96.48 | 96.31 | 96.67 | 96.29 | 96.65 | |
| Coarse KNN | 516 | 24 | 515 | 25 | 95.46 | 95.38 | 95.56 | 95.37 | 95.54 | |
| SVM-Linear | 518 | 22 | 519 | 21 | 96.01 | 96.10 | 95.92 | 96.11 | 95.93 | |
| SVM-RBF | 521 | 19 | 518 | 22 | 96.20 | 95.94 | 96.48 | 95.92 | 96.46 |
Fig. 9
Confusion matrix obtained with SVM-RBF and Fine KNN.
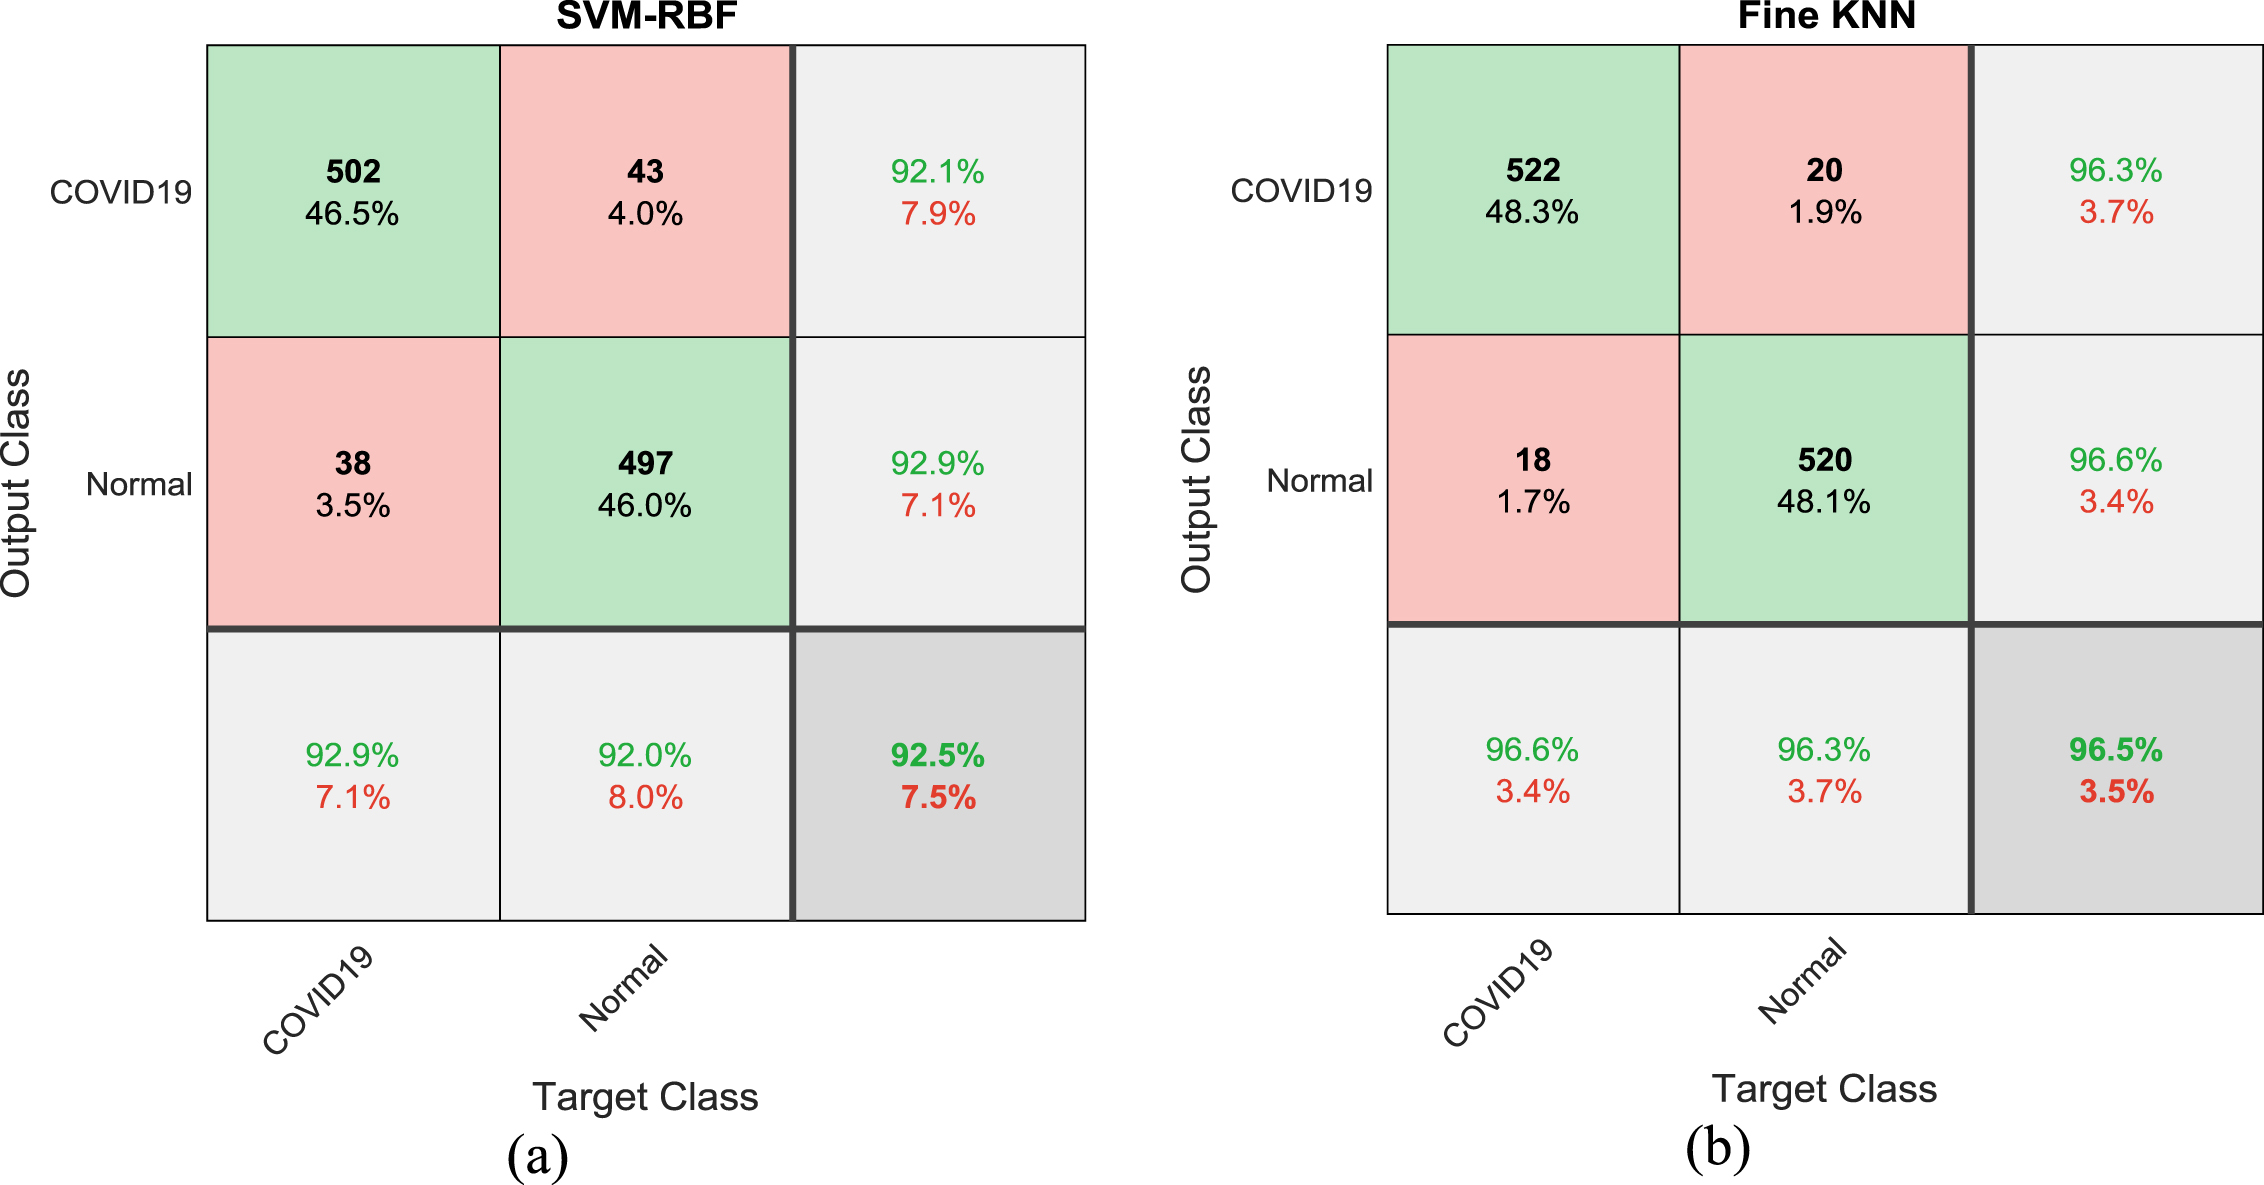
Fig. 10
Performance evaluation of proposed technique with Fine KNN classifier.
The overall performance depicted in Fig. 11 also considers the superiority of proposed scheme. Figure 11(a) and (b) presents the Glyph-Plot, constructed using ACC, PRE, SEN, SPE and NPV of Table 5. Every pattern in this plot is the combination of these features and every feature forms a straight line in this pattern. For example, this pattern consist of 5 lines starts from the origin of the pattern, which represents the 5 parameters, such as ACC, PRE, SEN, SPE and NPV. When the value of the considered parameters is more, the dimension of the pattern is also more. By simply, observing the pattern dimension, the merit of a particular classifier can be measured.
Fig. 11
Glyph-plot to demonstrate the overall performance of deep features and integrated features based COVID-19 detection.
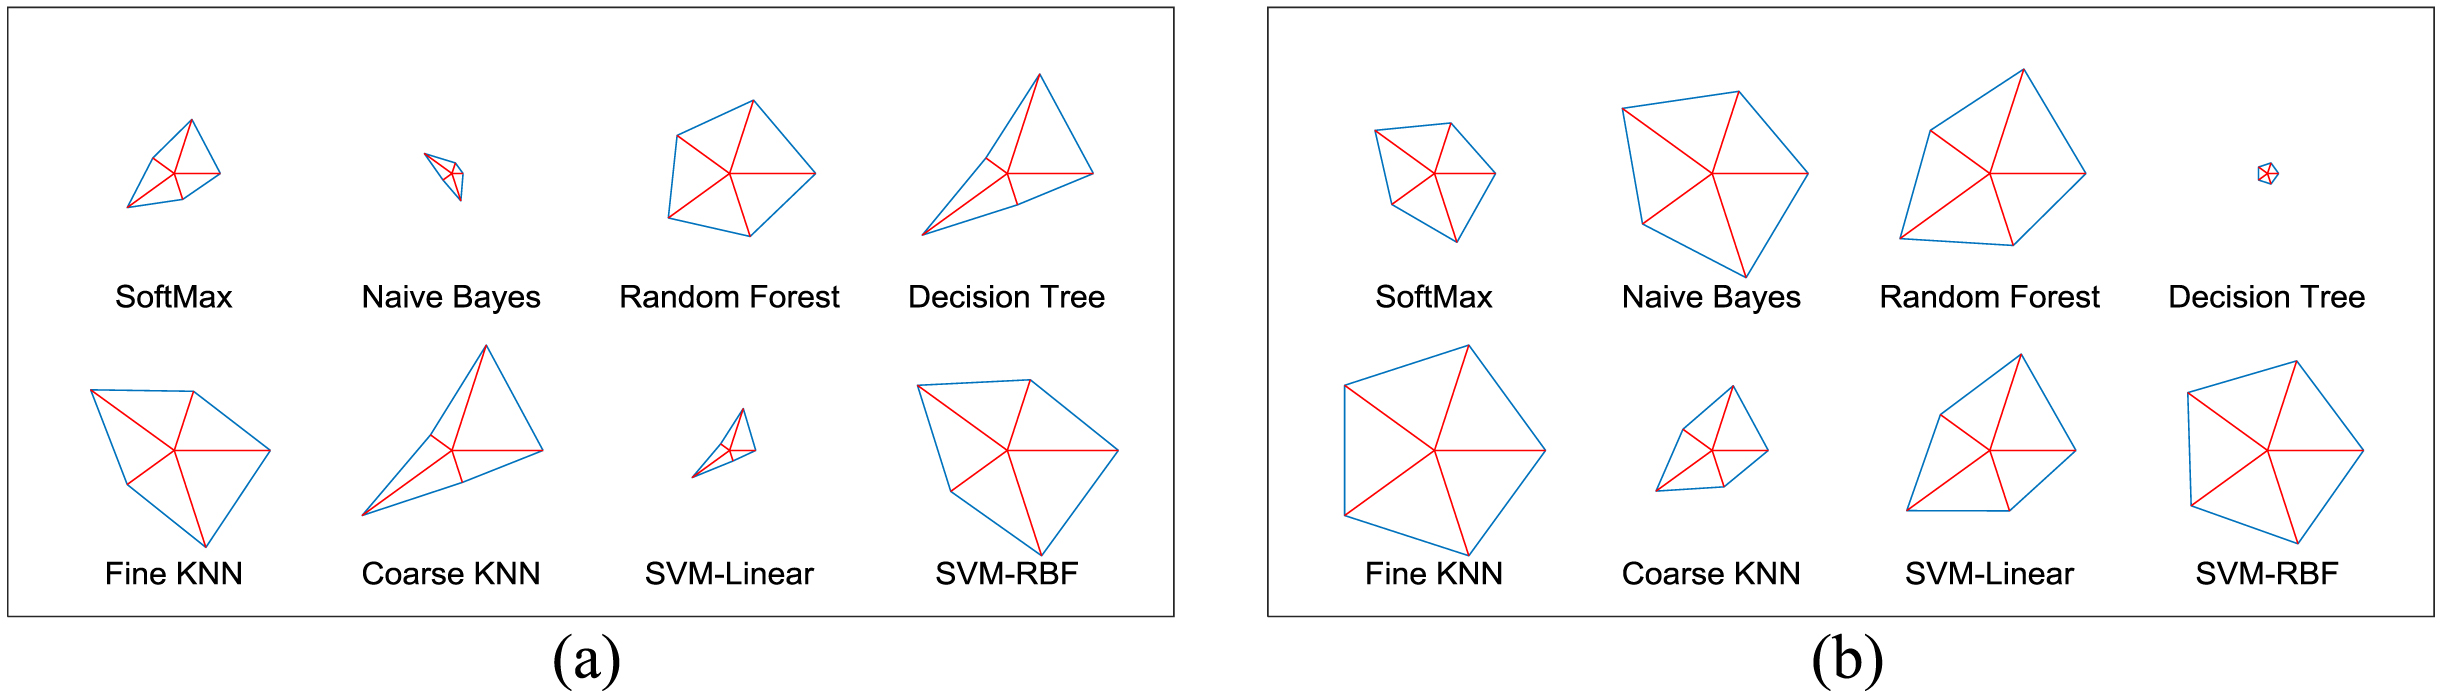
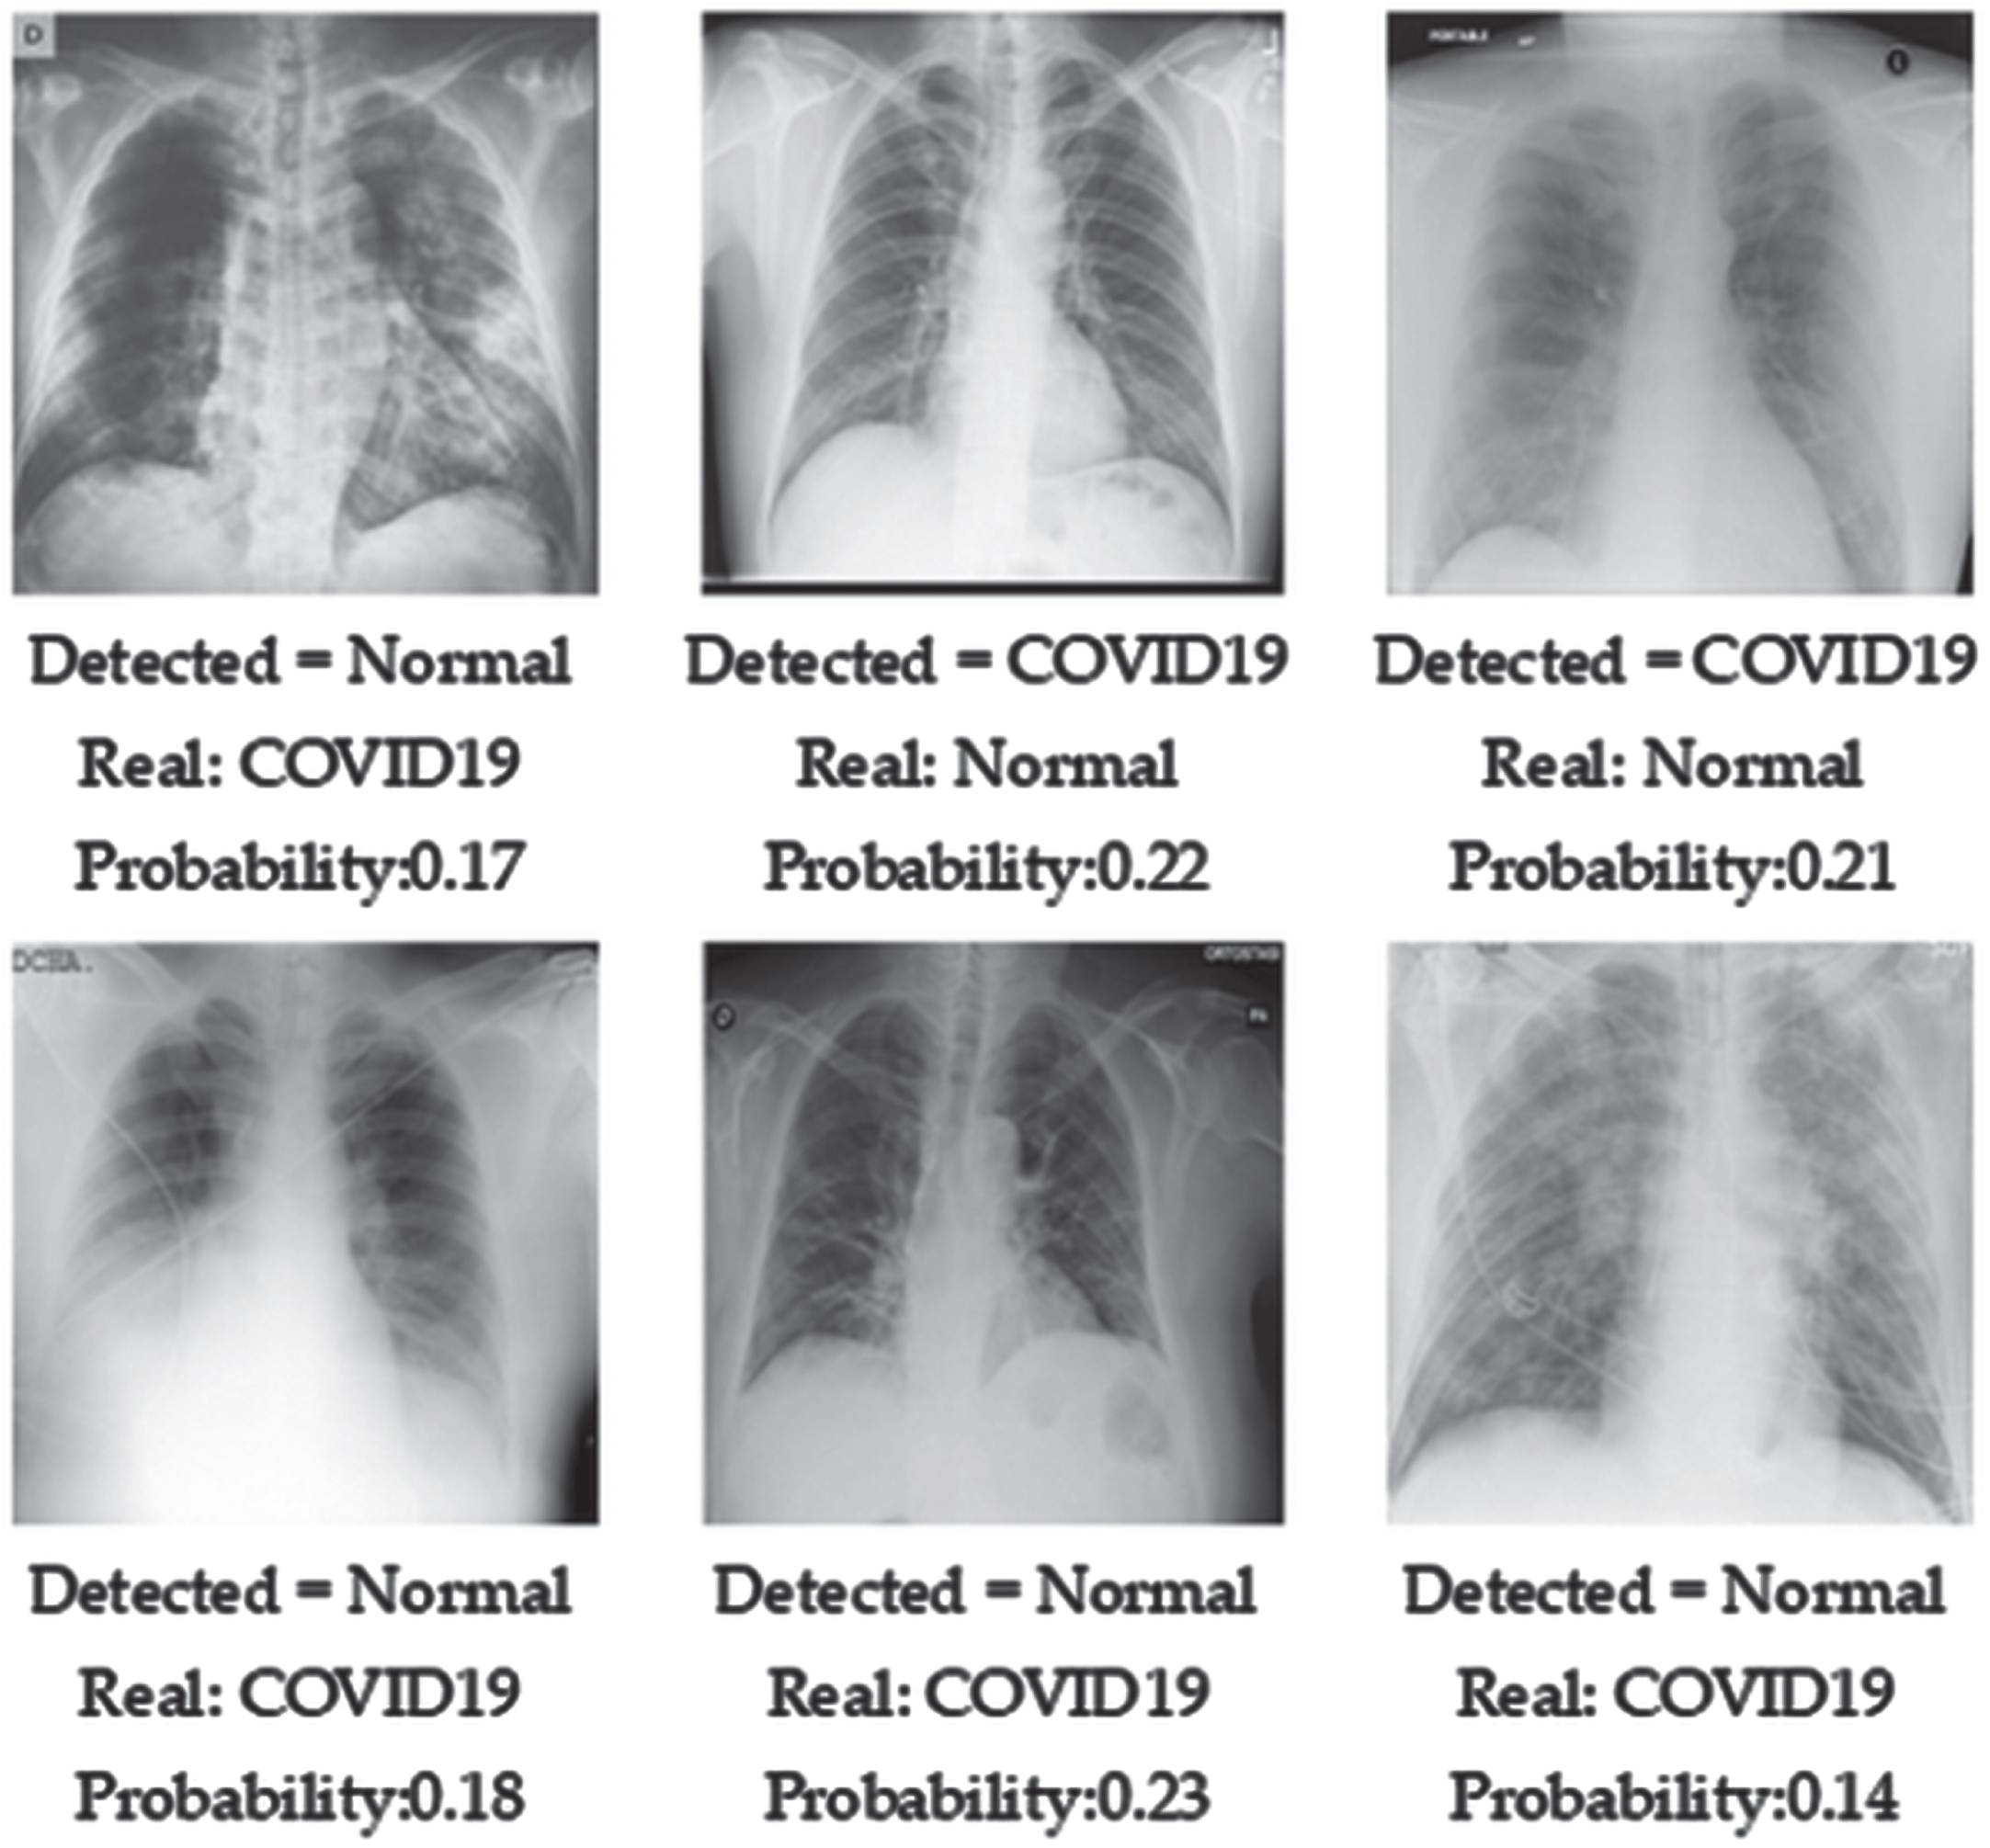
Table 5 also confirms that the classification accuracy in Deep + Handcrafted features is good compared to the investigation implemented only with the Deep features. The proposed scheme helped to improve the detection accuracy. Figure 12 presents the disease detection performance of the Fine KNN with Deep + Handcrafted features and this result confirms that the images are detected without the overfitting.
Fig. 12
Probability of detected image with its real class.
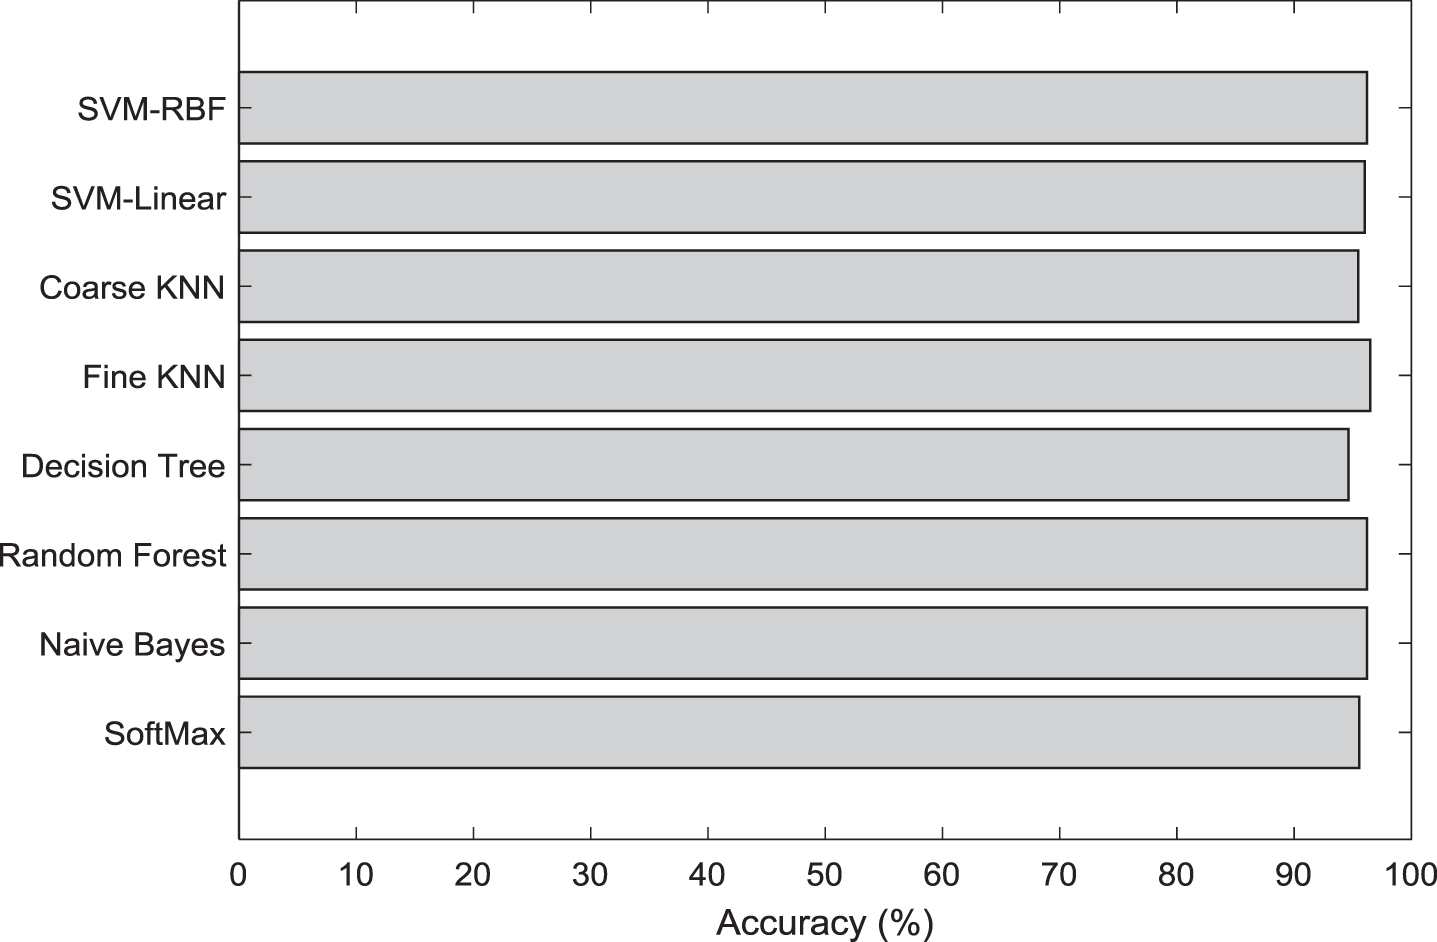
The outcome of the proposed scheme’s classifiers accuracy is then compared as presented in Fig. 13. This confirms that the classification accuracy of proposed technique is good in all the considered two-class classifiers.
Fig. 13
Classification accuracy of proposed technique.
The proposed work implemented integrated feature based classification of the X-ray and in future, the proposed technique can be improved by considering other handcrafted features available in the literature.
5Conclusion
COVID-19 is one of the fast-spreading infectious diseases in humans and the timely detection and treatment helps to treat the patient with appropriate procedure. Accurate detection of the COVID-19 is necessary to treat the patient with suitable medication. DLM based detection of the COVID-19 infection using X-ray images are demonstrated in this work. This work implements; (i) Detection of the lung infection using the optimized deep features and (ii) Infection detection using the combined features. In this work, the FA based feature optimization is employed to select the dominant and reduced feature vector, which helps to get better disease detection with a better accuracy. This investigation is executed using 1800 images of normal/COVID-19 using the VGG16 extracted features and LBP-based features. During this investigation, 70% of test pictures are considered for training the scheme and remaining 30% images are considered for the validation. The classification task is executed using binary classifiers with a 5-fold cross validation. The outcome of the present research confirms that this research offered an accuracy of > 92% with SVM-RBF and > 96% with Fine KNN. In future, this technique can be tested and confirmed with the real patient images collected from hospitals.
References
[1] | Ahuja S. , Panigrahi B.K. , Dey N. , et al., Deep transfer learning-based automated detection of COVID-19 from lung CT scan slices, Applied Intelligence 51: ((2021) ), 571–585. |
[2] | Alyasseri Z.A.A. , Al-Betar M.A. , Doush I.A. , et al., Reviewon COVID-19 diagnosis models based on machine learning and deep learning approaches, Expert Systems (2021), e12759. |
[3] | Arunmozhi S. , Rajinikanth V. and Rajakumar M.P. , Deep-Learning based Automated Detection of Pneumonia in Chest Radiographs, in: International Conference on System, Computation, Automation and Networking (ICSCAN), IEEE, 2021, 1–4. |
[4] | Chakkaravarthy A.P. , Pugalenthi R. , Ramya J. and Dhanalakshmi J. , An Automatic Classification of COVID with J48 and Simple K-Means using Weka, International Journal of Future Generation Communication and Networking 13: ((2020) ), 490–500. |
[5] | Dey N. , Zhang Y.D. , Rajinikanth V. , et al., Customized VGG19 architecture for pneumonia detection in chest X-rays, Pattern Recognition Letters 143: ((2021) ), 67–74. |
[6] | Fernandes S.L. , Tanik U.J. , Rajinikanth V. and Karthik K.A. , A reliable framework for accurate brain image examination and treatment planning based on early diagnosis support for clinicians, Neural Computing and Applications 32: ((2020) ), 15897–15908. |
[7] | Gudigar A. , Raghavendra U. , Devasia T. , et al., Global weighted LBP based entropy features for the assessment of pulmonary hypertension, Pattern Recognition Letters 125: ((2019) ), 35–41. |
[8] | Houssein E.H. , Abohashima Z. , Elhoseny M. and Mohamed W.M. , Hybrid quantum convolutional neural networks model for COVID-19 prediction using chest X-Ray images (2021), arXiv preprint arXiv:2102.06535. |
[9] | Hussain E. , Hasan M. , Rahman M.A. , et al., CoroDet: A deep learningbased classification for COVID-19 detection using chest X-rayimages, Chaos, Solitons & Fractals 142: ((2021) ), 110495. |
[10] | Ismael A.M. and Şengür A. , Deep learning approaches for COVID-19 detection based on chest X-ray images, Expert Systemswith Applications 164: ((2021) ), 114–124. |
[11] | Jacobi A. , Chung M. , Bernheim A. and Eber C. , Portable chest X-ray in coronavirus disease-19 (COVID-19): A pictorial review, Clinical imaging 64: ((2020) ), 35–42. |
[12] | Jain R. , Gupta M. , Taneja S. and Hemanth D.J. , Deep learning based detection and analysis of COVID-19 on chest X-ray images, Applied Intelligence 51: ((2021) ), 1690–1700. |
[13] | Karbhari Y. , Basu A. , Geem Z.W. , et al., Generation of synthetic chest X-ray images and detection of COVID-19: A deep learning based approach, Diagnostics 11: ((2021) ), 895. |
[14] | Khan M.A. , Kadry S. , Alhaisoni M. , et al., Computer-aided gastrointestinal diseases analysis from wireless capsule endoscopy: a framework of best features selection, IEEE Access 8: ((2020) ), 132850–132859. |
[15] | Kumar A. and Khorwal R. , Firefly algorithm for feature selection in sentiment analysis, in: Computational Intelligence in Data Mining, Springer, Singapore, (2017) , 693–703. |
[16] | Kumar V. , Singh D. , Kaur M. , et al., Overview of current state of research on the application of artificial intelligence techniques for COVID-19, PeerJ Computer Science 7: ((2021) ), e564. |
[17] | Mohammad-Rahimi H. , Nadimi M. , Ghalyanchi-Langeroudi A. , et al., Application of machine learning in diagnosis of COVID-19 through X-ray and CT images: a scoping review, Frontiers in Cardiovascular Medicine 8: ((2021) ), 185. |
[18] | Odusami M. , Maskeliūnas R. , Damaševičius R. , et al., Analysis of features of Alzheimer’s disease: detection ofearly stage from functional brain changes in magnetic resonanceimages using a finetuned ResNet18 network, Diagnostics 11: ((2021) ), 1071. |
[19] | Pugalenthi R. , Oliver A.S. and Anuradha M. , Impulse noise reduction using hybrid neuro-fuzzy filter with improved firefly algorithm from X-ray bio-images, International Journal of Imaging Systems and Technology 30: ((2020) ), 1119–1131. |
[20] | Pugalenthi R. , Rajakumar M.P. and Ramya J. , et al., Evaluation and classification of the brain tumor MRI using machine learning technique, Journal of Control Engineering and Applied Informatics 21: ((2019) ), 12–21. |
[21] | Rahaman M.M. , Li C. , Yao Y. , et al., Identification of COVID-19 samples from chest X-ray images using deep learning: A comparison of transfer learning approaches, Journal of X-ray Science and Technology 28: ((2020) ), 821–839. |
[22] | Raja N.S.M. , Manic K.S. and Rajinikanth V. , Firefly algorithm with various randomization parameters: an analysis, in: International Conference on Swarm, Evolutionary, and Memetic Computing, Springer, Cham, (2013) , 110–121. |
[23] | Rajakumar M.P. , Sonia R. , Uma Maheswari B. , et al., Tuberculosis detection in chest X-ray using Mayfly-algorithm optimized dual-deep-learning features, Journal of X-Ray Science and Technology 29: ((2021) ), 961–974. |
[24] | Rajinikanth V. , Kadry S. and Nam Y. , Convolutional-neural-network assisted segmentation and SVM classification of brain tumor in clinical MRI slices, Information Technology and Control 50: ((2021) ), 342–356. |
[25] | Sahlol A.T. , Abd Elaziz M. , Tariq Jamal A. , et al., A novel method for detection of tuberculosis in chest radiographs using artificial ecosystem-based optimisation of deep neural network features, Symmetry 12: ((2020) ), 1146. |
[26] | Sahlol A.T. , Yousri D. , Ewees A.A. , et al., COVID-19 image classification using deep features and fractional-order marine predators algorithm, Scientific Reports 10: ((2020) ), 15364. |
[27] | Sangeetha Francelin Vinnarasi F. , Daniel J. , Anita Rose J.T. , et al., Deep learning supported disease detection with multi-modality image fusion, Journal of X-Ray Science and Technology 29: ((2021) ), 411–434. |
[28] | Selvakumar B. and Muneeswaran K. , Firefly algorithm based feature selection for network intrusion detection, Computers & Security 81: ((2019) ), 148–155. |
[29] | Sethy P.K. , Behera S.K. , Anitha K. , et al., Computer aid screening of COVID-19 using X-ray and CT scan images: An inner comparison, Journal of X-ray Science and Technology 29: ((2021) ), 197–210. |
[30] | Shree T.V. , Revanth K. , Raja N.S.M. and Rajinikanth V. , A hybrid image processing approach to examine abnormality in retinal optic disc, Procedia Computer Science 125: ((2018) ), 157–164. |
[31] | Tuncer T. , Dogan S. and Ozyurt F. , An automated residual exemplar local binary pattern and iterative ReliefF based COVID-19 detection method using chest X-ray image, Chemometrics and Intelligent Laboratory Systems 203: ((2020) ), 104054. |
[32] | Wang Y. , Chen Y. , Yang N. , et al., Classification of mice hepatic granuloma microscopic images based on a deep convolutional neural network, Applied Soft Computing 74: ((2019) ), 40–50. |
[33] | Xu H. , Yu S. , Chen J. and Zuo X. , An improved firefly algorithm for feature selection in classification, Wireless Personal Communications 102: ((2018) ), 2823–2834. |
[34] | Yang X.S. , Firefly algorithms for multimodal optimization, in: International symposium on stochastic algorithms, Springer, Berlin, Heidelberg, (2009) , 169–178. |
[35] | Yang X.S. , Firefly algorithm, Levy flights and global optimization, in: Research and development in intelligent systems XXVI, Springer, London, (2010) , 209–218 |
[36] | Zhang Y. , Song X.R. and Gong D.W. , A return-cost-based binary firefly algorithm for feature selection, Information Sciences 418: ((2017) ), 561–574. |
[37] | |
[38] | https://www.kaggle.com/tawsifurrahman/COVID-19-radiography-databas. |

