
Selecting slip resistant winter footwear for personal support workers
Abstract
BACKGROUND:
Falls are among the leading causes of occupational injuries for workers exposed to outdoor winter conditions such as Personal Support Workers (PSWs). Slip resistant footwear is known to reduce the risk of falls, however, it is difficult to predict how well a particular boot will perform prior to purchasing them. Our recently developed Maximum Achievable Angle (MAA) test can be used to rate footwear objectively to address this gap.
OBJECTIVE:
To rate the slip resistance of a selection of winter footwear that meets the needs and preferences of PSWs.
METHODS:
We selected 40 representative types of footwear based on survey results from 677 PSWs and applied our MAA test to rate slip resistance.
RESULTS:
Comfort and slip resistance were rated the most important features for selecting winter footwear. Of the 40 types of footwear tested, six were found to have a good slip resistance on ice.
CONCLUSION:
The vast majority of winter footwear that meet the needs and preferences of PSWs, perform poorly on ice. Therefore, PSWs should consult our website (ratemytreads.com) for selecting appropriate footwear that will keep them safe in the winter.
1Introduction
Falls are among the leading causes of occupational injuries for workers exposed to outdoor winter conditions [1]. These incidents are a major concern for both outdoor workers and their employers as they often result in reduced productivity, expensive compensation claims, lost workdays, not to mention the pain and suffering experienced by the workers themselves. Falls resulted in 36 days of lost time per claim and accounted for one in five of all lost time injuries in Ontario in 2012 [1]. The WSIB estimates the average cost of a fall-related injury was nearly $12,000 and the total financial burden associated with fall-related injuries was $59,000 per injury once staff replacement and lost productivity was factored in [2].
Efforts have been made to minimize the risk of slip incidents by developing new approaches to test indoor walkway/flooring slip resistance [3, 4], but this focus has been lacking for outdoor walkways in the winter. Ice-covered walkways and stairs increase the risk of falls for workers in the winter [5, 6] because of reduced friction on ice-covered surfaces. Polar water molecules have dangling surface hydrogen bonds that result in structural disorder. This structure results in the formation of a quasi-liquid layer at the ice surface that reduces friction [7]. One study at a helicopter manufacturing plant identified that icy surfaces were responsible for 30 out of the 52 reported falls [8]. In particular, the risk of injury is greatest for older workers (over 45). These workers are more likely to experience falls and the resulting injuries led to more time away from work than for younger workers [9].
Slip resistant footwear plays an important role in the prevention of slips-related falls by providing traction that can prevent the loss of balance. A study in restaurant workers found that slip resistant footwear was associated with a 54% reduction in the rate of slipping [10]. Other studies have shown that the use of slip resistant footwear may be even more important for reducing falls than having a strong safety culture in an organization [11, 12]. It is important to note that indoor workers have access to slip resistance ratings to guide their footwear selections [13]. In contrast, outdoor workers exposed to winter conditions have not had access to slip resistance ratings; as a result, they continue to experience high rates of fall-related injuries [14]. A study of 1734 postal worker falls occurring over a 2-year period in the UK found that the most common cause of falls were icy conditions with the majority of falls happening between November and February. This study also found the slip-related falls tended to cluster on days following precipitation when snow and ice were present [14].
Community-based Personal Support Workers (PSWs; also called home support workers, personal aides, or personal care attendants) provide 70% of the publicly-funded home care services in Ontario [15], and they are among the most frequently injured workers in Ontario [16]. While this group most commonly reports overexertion injuries of the back and shoulders, a less commonly discussed major cause of injury to PSWs are slip-related falls that are the result of slippery winter weather. Typically, the clients these workers travel to serve have disabilities that make it difficult to keep their walkways clear of ice. For instance, the winter of 2013/2014 in southern Ontario was particularly harsh and saw several ice storms throughout the season [17]. Many older adults felt trapped in their homes, which made it even more important for PSWs to not miss their client visits. Many of these workers were seriously injured as a result of the slippery conditions. We believe many of these types of injuries could be prevented each year if workers had access to objective winter footwear slip resistance ratings. The effects on workers’ lives, the time lost, and the costs due to injury and recovery are strong motivations for empowering this worker group with information on how to select the best winter footwear.
Until recently, there was no objective information available to consumers to help them select footwear for use in icy weather. Past evaluations of winter footwear have utilized subjective ratings of perceived slipperiness, that involve ranking different types of footwear after use on outdoor winter surfaces [18, 19]. A number of objective measurements have also been attempted on winter surfaces with mechanical devices such as a stationary step simulator [20]. However, these mechanical methods cannot adequately represent the wide variability that constitutes human gait.
To address these drawbacks, our team has developed a new method for testing slip resistance of winter footwear by having participants walk on progressively steeper ice-covered slopes (from 0–20° inclines). This method, namely, the Maximum Achievable Angle (MAA) test, provides a footwear slip resistance rating based on the steepest ice-covered incline that participants can walk up and down without slipping. A model’s MAA score is calculated by finding the minimum angle that all participants were able to ascend and descend across two ice conditions (bare ice and melting ice) without slipping. We recommend users select footwear that achieves a rating greater than 7°. This threshold was chosen based on the maximum slope recommendations for curb ramps in Ontario’s accessibility guidelines [21]. Our MAA testing results are freely available at our website: ratemytreads.com.
Prior to this investigation approximately 100 footwear models had been tested and ten of them were found to meet or exceed our 7° cut-off. However, all of the footwear that passed the test was relatively expensive, costing over $200 a pair, which we felt would be a poor fit for workers like PSWs, since they are typically considered low income workers. We also had anecdotal evidence that many PSWs did not wear conventional winter boots for much of the winter. Rather, we heard they chose to wear athletic or casual footwear, which had not been a focus of the MAA testing program to-date. Therefore, we felt our existing findings were not necessarily helpful for this vulnerable worker group. In contrast, our companion paper measures the slip-resistance performance of footwear commonly worn by outdoor workers employed by the City of Toronto (Ontario, Canada) [22]. Unlike PSWs, these workers are provided a subsidy toward the purchase of their footwear.
The objective of this study was to identify slip resistant winter footwear that was appropriate for PSWs. This project was divided into two phases that are described in detail below:
Phase 1: Understanding PSW winter footwear needs and preferences using a survey.
Phase 2: Testing the slip resistance of footwear selected based on our survey results.
2Methods
In the first phase of this project, PSWs (selected from a combination of urban and rural regions in southern Ontario) were surveyed regarding their winter footwear needs and preferences (described in Section 2.1). Based on these survey results, we then selected a representative set of 40 footwear models and applied our MAA test to rate their slip resistance in the second phase (described in Section 2.2).
2.1Survey
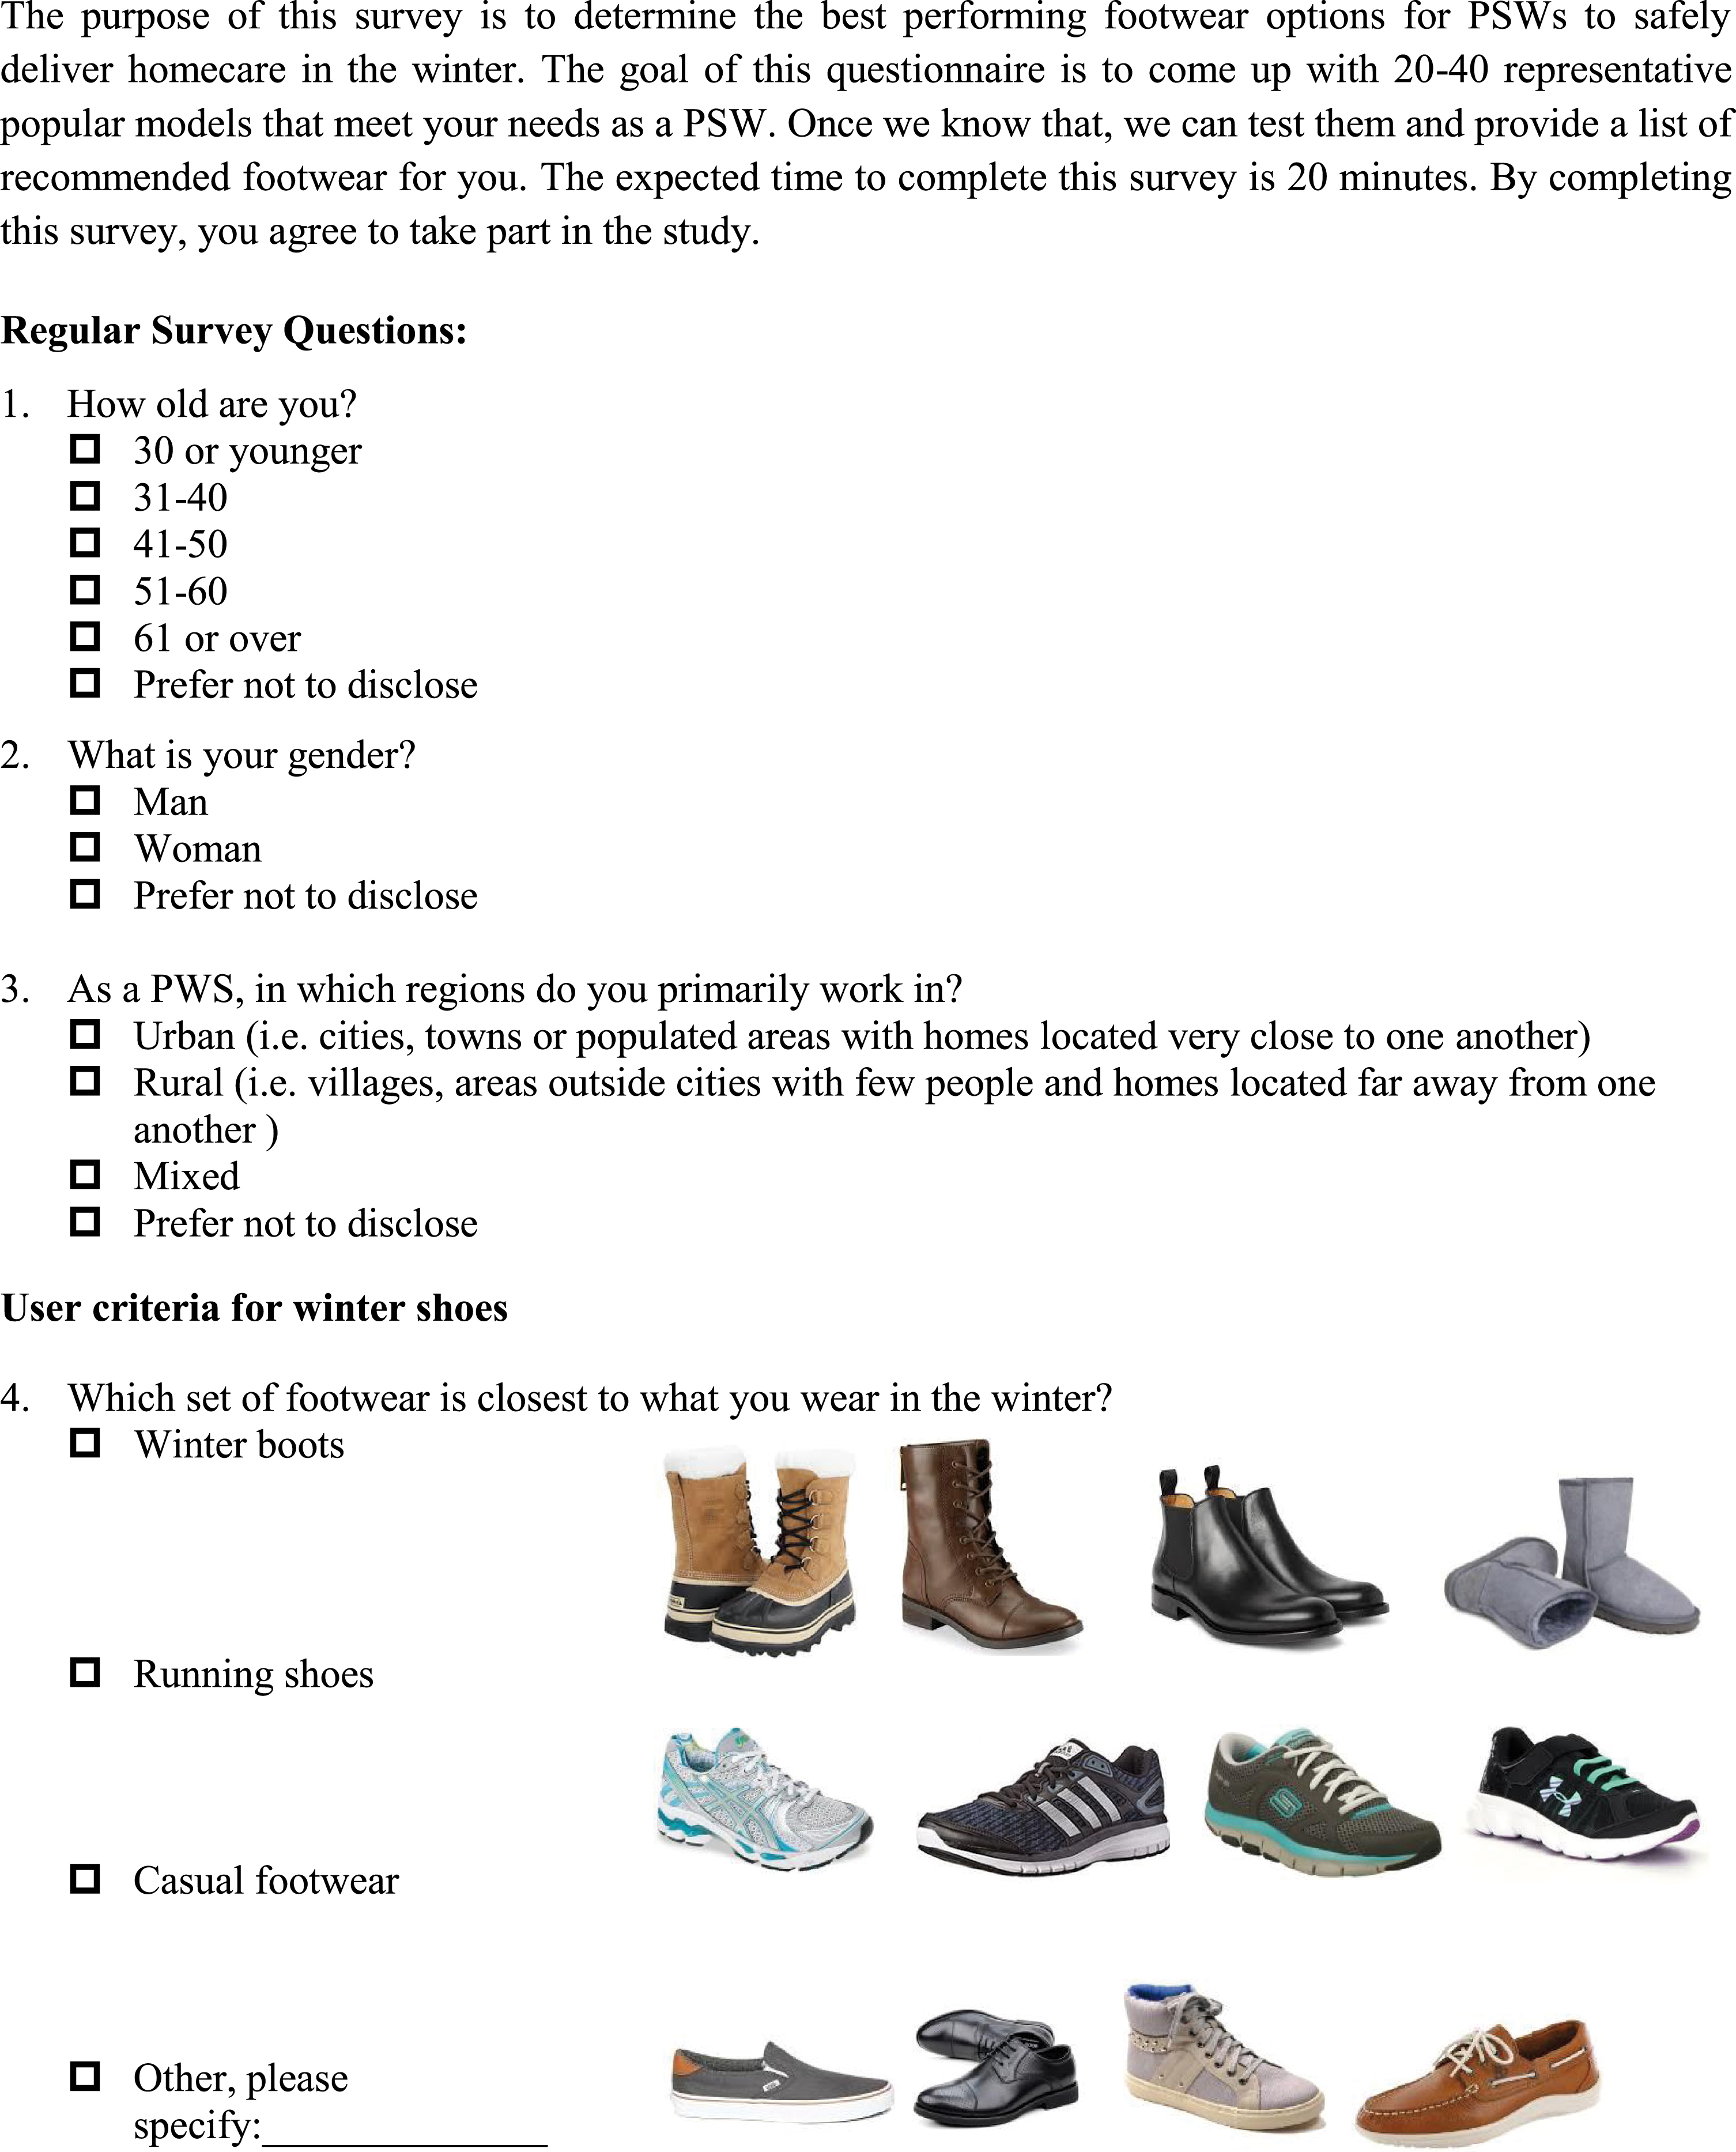
Our survey was designed collaboratively by Toronto Rehabilitation Institute – University Health Network and SE Health (SE) and was approved by the Research Ethics Board at University Health Network. Survey questions were formulated after reviewing the scientific literature regarding footwear needs in other industries as well as current and past international safety guidelines for winter slip-and-fall prevention. The survey was designed to take approximately 20 minutes to complete. The survey asked respondents to describe themselves, the features they consider to be important when selecting their winter footwear as well as their experiences with falls and fall prevention strategies in the winter. Researchers from SE, who were experienced in developing surveys for home care PSWs, evaluated the survey for the content validity and revised it for clarity. The survey was pilot tested by 30 SE PSWs and subsequently revised with minor changes based on the pilot results.
The survey was comprised of four sections. The first section asked PSWs about their demographics such as age, gender and whether the region in which they visited clients was primarily urban or rural. Section two asked about the features that respondents felt were important to them when selecting winter footwear, their preferred styles/brands, how much they were willing to spend, and where they typically bought their winter footwear. The third section asked respondents to rate their confidence in managing fall risk, their interest in continuing education on winter fall prevention strategies, the safety precautions they consider when visiting a client’s home, and factors that contribute to falls. The final section asked respondents about their history of fall-related injuries and their opinions about the role of their footwear in causing the fall. In order to ensure that the survey captured a variety of preferred footwear styles and models, the related questions were not necessarily mutually exclusive and participants were asked to give multiple responses to some questions. The question asking respondents about the factors that lead to falls used a five-point Likert-style scale that ranged from either “strongly agree” to “strongly disagree” or “extremely confident” to “not at all confident”, “extremely important” to “not at all important” and “very high” to “very low”. All these questions have a response option for “don’t know” and “unsure/no opinion”. The full survey is provided in Appendix A.
2.1.2Procedure
The survey was distributed by: (a) sending a Survey Monkey (www.surveymonkey.com) link by email to SE PSWs and (b) providing paper copies of the survey at a booth at the Personal Support Network of Ontario Training Conference held in Toronto on October 20, 2016. All participants gave informed consent prior to filling out the survey.
2.1.3Data analysis
Demographic information and responses to attitude statements were analyzed using descriptive statistics. Nominal and ordinal data were described as the percentage of respondents with 95% confidence intervals (CI). The Chi-square test was used to determine whether respondent’s attitude to the contributing factors to slip-and-fall incidents differed significantly.
2.2Slip resistance testing
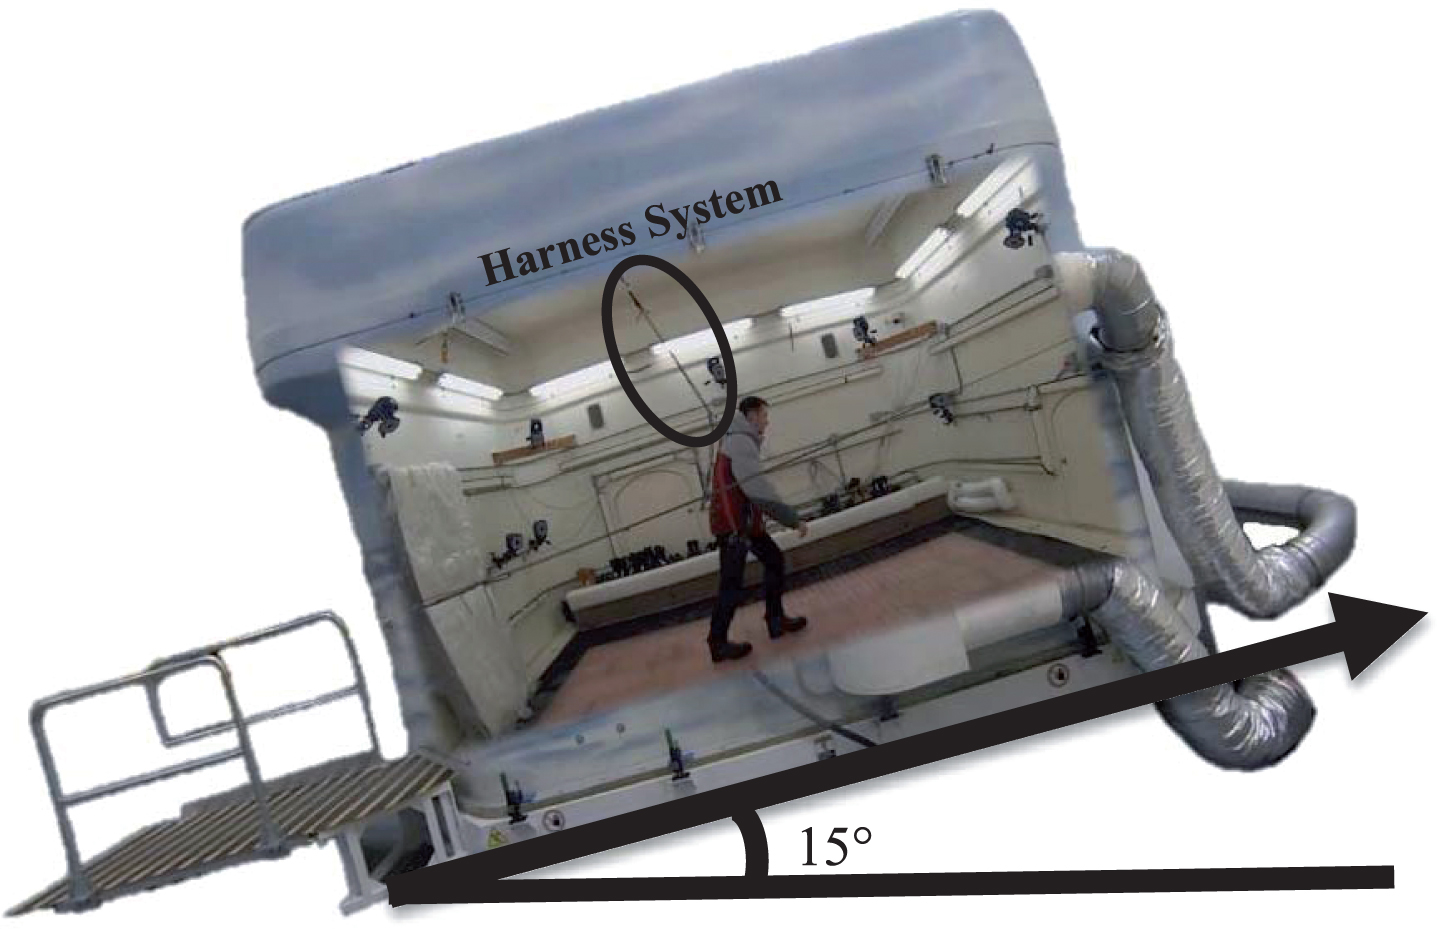
Based on our survey results, 40 footwear models were selected for testing with our Maximum Achievable Angle (MAA) method. This test method was approved by the Research Ethics Board at our institution (University Health Network, Toronto, Canada). The MAA test is a measure of the steepest incline that the participants can walk up and down without experiencing a two foot slip, which was defined as an event when (a) both feet slide on the ice surface or (b) one foot slides on the ice surface while the other foot is in the air. The MAA test was done in WinterLab at Toronto Rehabilitation Institute - UHN (Fig. 1), which simulates winter with an ice floor and cold temperatures and has the ability to be tilted to create slopes up to 15°.
Fig.1
WinterLab shown tilted at a 15° slope.
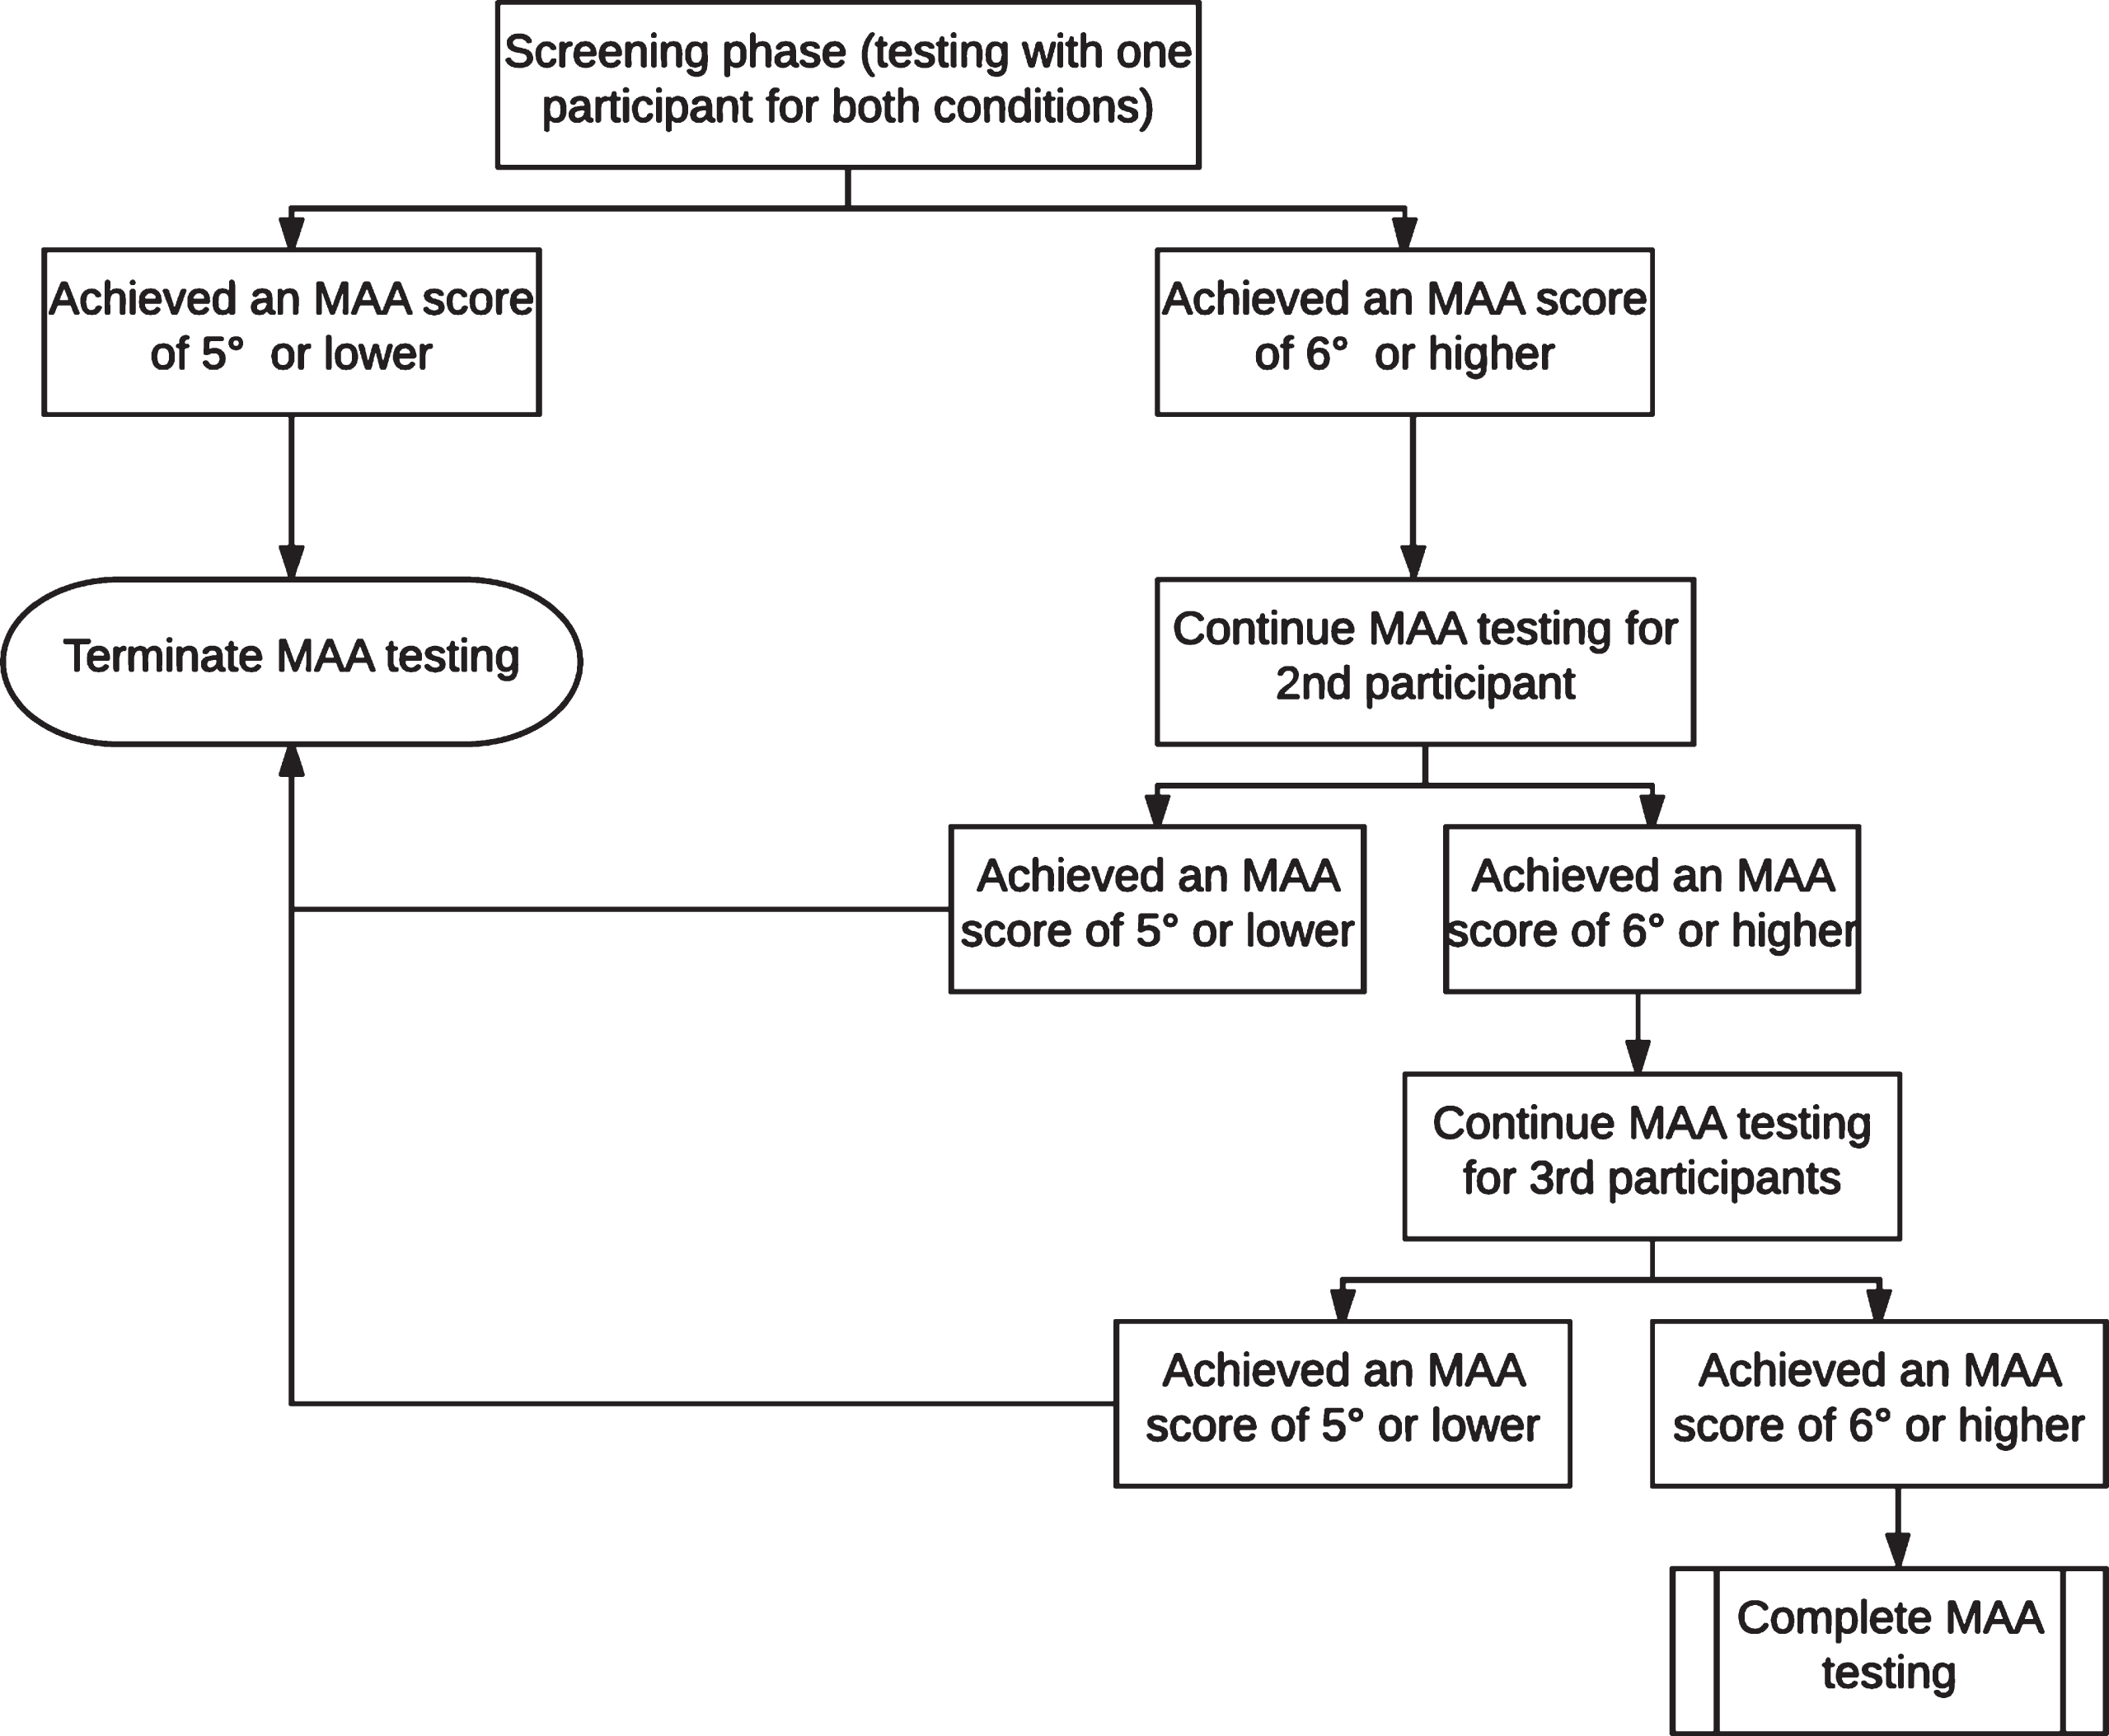
The MAA test was comprised of two phases. First, was the screening phase where 40 footwear models (35 women’s and 5 men’s) were tested by a single participant. The footwear was tested in batches of ten for women’s footwear (two hour sessions) and five for men’s footwear (one hour sessions) by one participant. One male and one female participant completed testing for the screening phase for consistency. Footwear that passed our threshold cutoff of 6° or more in the screening phase was tested by up to three more participants in the second phase. Each testing session for women’s footwear consisted of five pairs of footwear, while the men’s consisted of three pairs. The same three additional participants completed testing in the second phase for all footwear that made it past the screening phase. Figure 2 shows a flow chart detailing the MAA testing protocol.
Fig.2
The Maximum Achievable Angle protocol used in this study for slip resistance testing. Each pair of test footwear is first screened by one participant. Those achieving a 6° slope or higher are tested by up to three additional participants. Four scores are recorded for each participant testing a particular pair of footwear: bare ice uphill, bare ice downhill, melting ice uphill, melting ice downhill. The overall MAA score is determined by taking the minimum of these scores across all participants.
All footwear was washed with soap water and was not worn outside of the WinterLab to prevent contamination of the soles with debris prior to testing. All footwear was conditioned by placing them inside the WinterLab for thirty minutes prior to each testing session to bring them to lab temperature which had air temperature set to 8.5°C±1.5°C and 3°C±0.5°C, for melting ice and bare ice conditions, respectively. The ice temperature was set to 0.4°C±0.5°C, –3.8°C±0.3°C for melting ice and bare ice, respectively. The ice was resurfaced by spreading a thin layer of water evenly across the ice surface using a spray mop (Swiffer, WetJet) and allowing it to freeze to create a smooth surface thirty minutes prior to the start of each test session.
All participants were provided winter clothing including a coat, hat, and gloves to wear inside WinterLab during testing to keep warm. All participants wore a safety harness to prevent injuries during testing. Participants started walking on a level walkway for the first trial. After this, the ice-covered slope was increased gradually while participants ascended and descended the incline. An observer seated in the lab recorded whether they experienced a slip at a given angle. The angle was adjusted after each trial up to the maximum achievable angle, which was defined as the angle that the participant was able to successfully walk up or down for two trials but where a slip occurred on a 1° steeper slope. Separate MAA scores were recorded for ascending and descending with each pair of footwear. Each boot was tested on two ice conditions: bare ice and melting ice. The order of testing on melting and bare conditions was counterbalanced for each participant to avoid order effects. The overall MAA score for a given pair of footwear was determined by finding the minimum MAA score across all participants and conditions.
3Results and discussion
3.1Survey results
3.1.1Demographic characteristics
Of the 900 visitors on the survey website, 613 completed the survey for a return rate of 68.1%. A further 64 surveys were collected at the Personal Support Network of Ontario Training Conference. The vast majority of respondents were female (93.0%) and most were over the age of 40 (62%). These demographics agree well with the finding of a recent larger survey of over 1700 PSWs which reported that 94% of PSWs in Ontario are female and 69% were over the age of 45 [23]. Table 1 reports these and other demographic characteristics of the respondents. Just under half of respondents (48.1%) worked primarily in urban areas as opposed to rural areas (14.8%) while the remaining 35.0% worked in a combination of urban and rural areas (p < 0.0001).
Table 1
Demographics of our survey participants
| Age | N | % |
| 30 or younger | 95 | 14.2% |
| 31–40 | 154 | 23.0% |
| 41–50 | 177 | 26.4% |
| 51–60 | 168 | 25.1% |
| 61 or over | 70 | 10.6% |
| Prefer not to disclose | 6 | 0.9% |
| Gender | N | % |
| Female | 619 | 92.9% |
| Male | 40 | 6.0% |
| Prefer not to disclose | 7 | 1.0 % |
| Primary Working Region | N | % |
| Urban | 315 | 47.2% |
| Rural | 97 | 14.5% |
| Mixed | 244 | 36.6% |
| Prefer not to disclose | 11 | 1.7% |
3.1.2User criteria for winter footwear
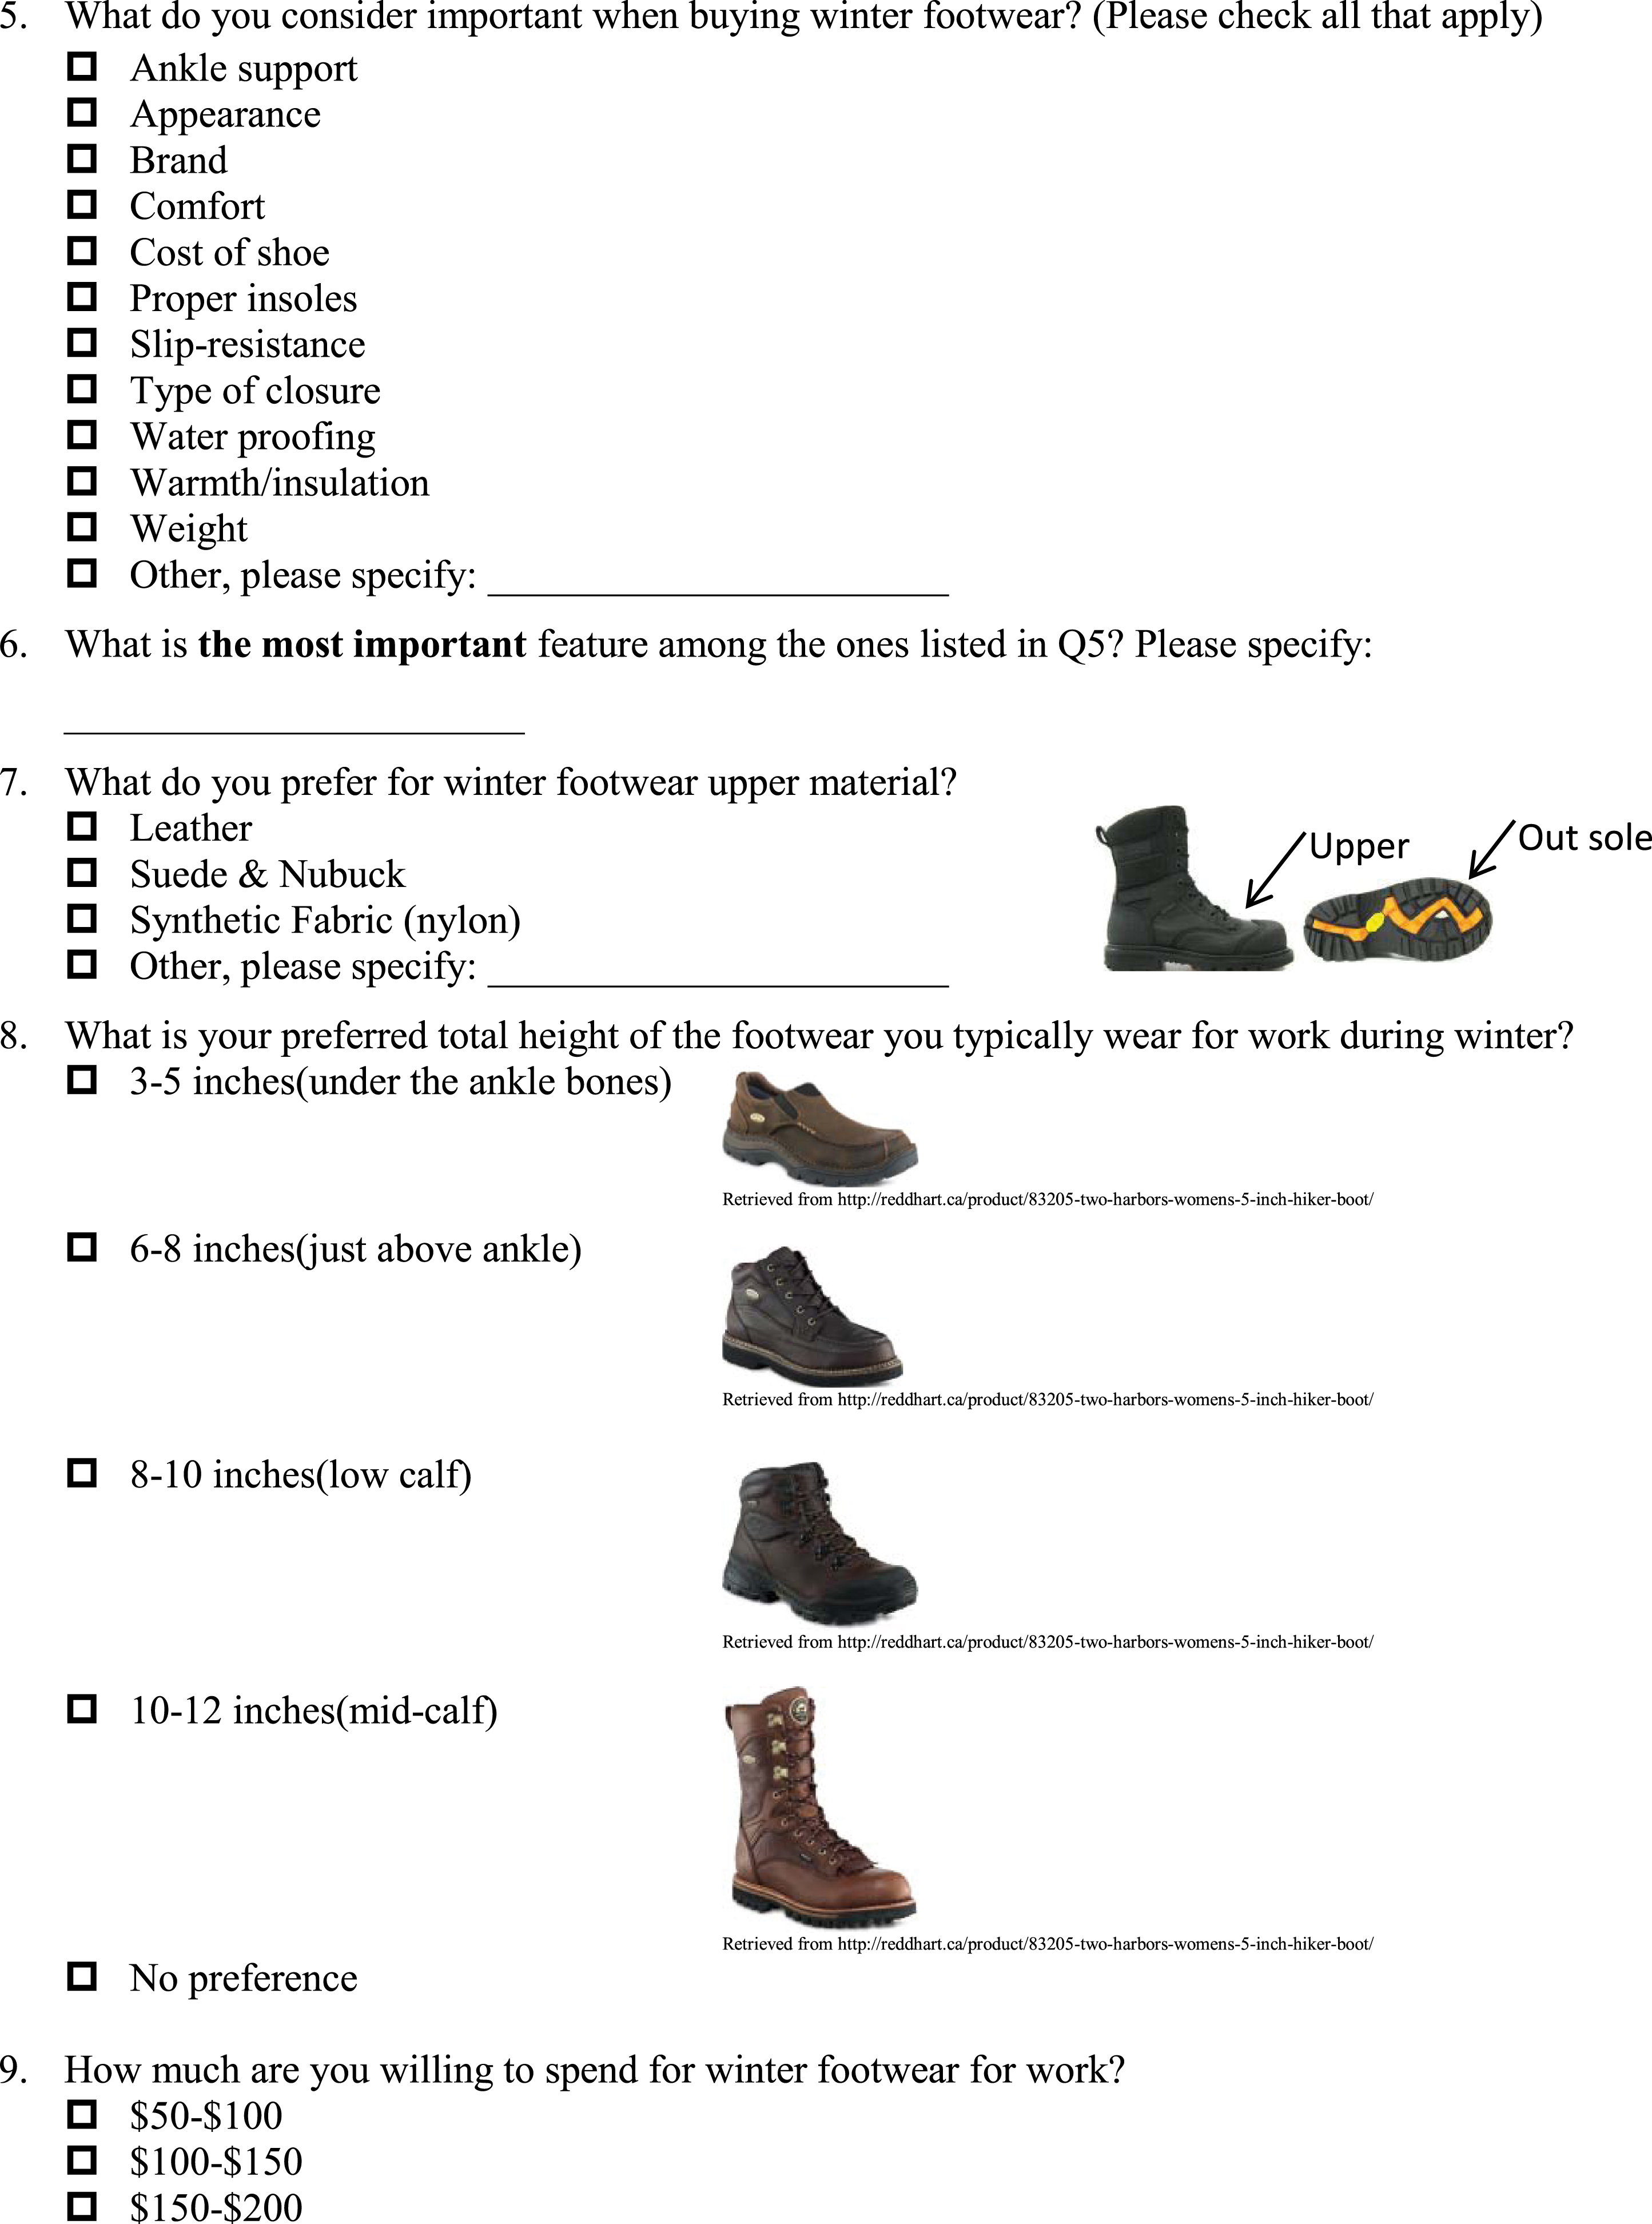
Question 5 through 14 addressed PSWs’ needs and preferences for winter footwear selection. Table 2 presents preferred footwear styles and materials. Most PSWs listed winter boots as the style of footwear they wear typically during the winter season (76.2%) rather than athletic or casual footwear though these alternative styles did make up about a quarter of responses. Of those who listed boots for their winter use, most preferred high-cut styles (58.4%) over low-cut footwear (33.6%) (p < 0.001).
Table 2
User criteria for winter footwear selection. Participants were able to select multiple categories hence proportions may not add up to 100%
| Footwear style most frequently worn | N | % |
| Winter boots | 510 | 76.2% |
| Running shoes | 118 | 17.6% |
| Casual footwear | 16 | 2.4% |
| Other | 25 | 3.7% |
| Preferred winter footwear upper material | N | % |
| Leather | 302 | 45.6% |
| Suede &Nubuck | 122 | 18.4% |
| Synthetic Fabric (nylon) | 186 | 28.1% |
| Other | 52 | 7.8% |
| Preferred total height of the footwear | N | % |
| Under-the-ankle boots | 107 | 15.0% |
| Above-the-ankle boots | 118 | 17.6% |
| Low-calf boots | 150 | 22.4% |
| Mid-calf boots | 241 | 35.0% |
| No preference | 54 | 8.1% |
| Willingness to wear slip resistant overshoe | N | % |
| Yes | 427 | 64.2% |
| No | 187 | 28.1% |
| It depends | 51 | 7.7% |
Figure 3a shows different features that PSWs consider important when selecting winter footwear. The highest ranked features are comfort and slip resistance with a response rate of 83.1% and 79.4%, respectively, whereas brand and type of closure were valued by fewer PSWs (13.6% and 26.0%, respectively). About half of the respondents listed cost as one of the most significant features in selecting winter footwear, with the majority of the participants willing to spend between $50 and $100 (Fig. 3b). This was expected based on the low socio-economic status of this worker group [24] that was also reflected in our findings on household income (28% of PSWs reported a household income of 25k-40k).
Fig.3
Features considered important by PSWs when buying winter footwear. Participants were able to select multiple categories hence proportions may not add up to 100%.
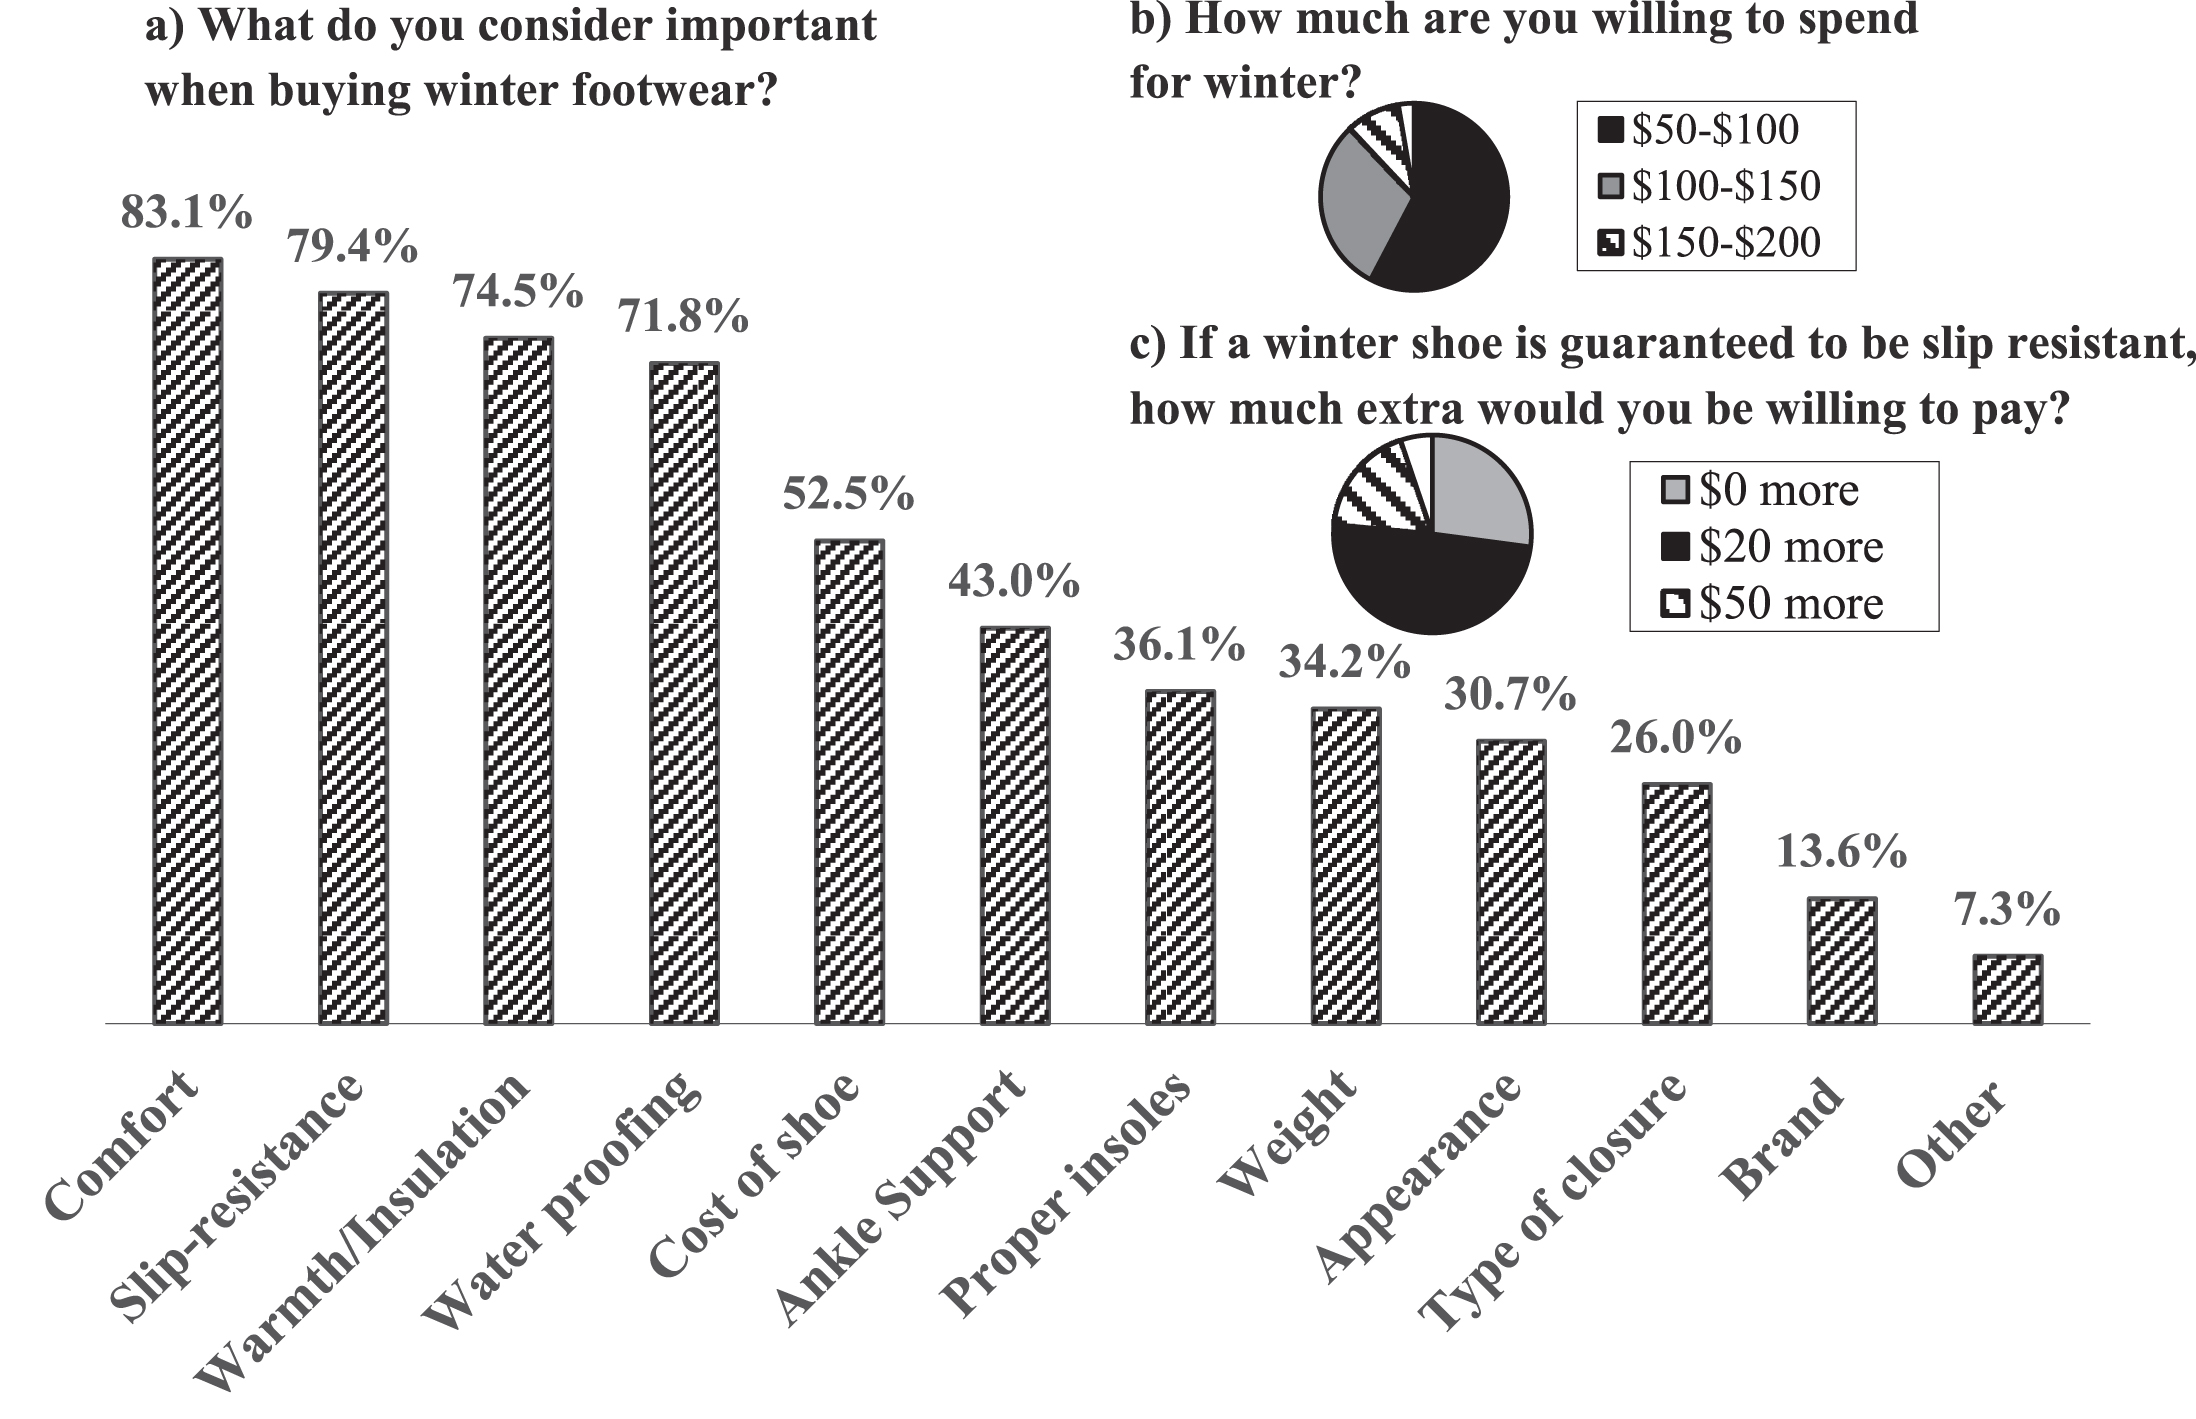
Slip resistance was found to be the second most important feature after comfort for PSWs, though respondents were not willing to pay much more for this feature (Fig. 3c). Half of respondents (49.4%) would be willing to pay $20 more though over a quarter of respondents would not pay any premium. Interestingly, 64.2% of PSWs said they would be willing to wear slip resistant overshoes winter months should such a product be available (Table 2). Almost all PSWs (95%) reported buying winter footwear in-store with a small number (8.3%) making purchases online (Table 2) (p < 0.0001). With respect to the brand for winter footwear selection, Columbia and Sketchers were found to be the most popular ones listed by 31.0% and 24.2% of PSWs, respectively.
3.1.3Safety training and fall-related injury history
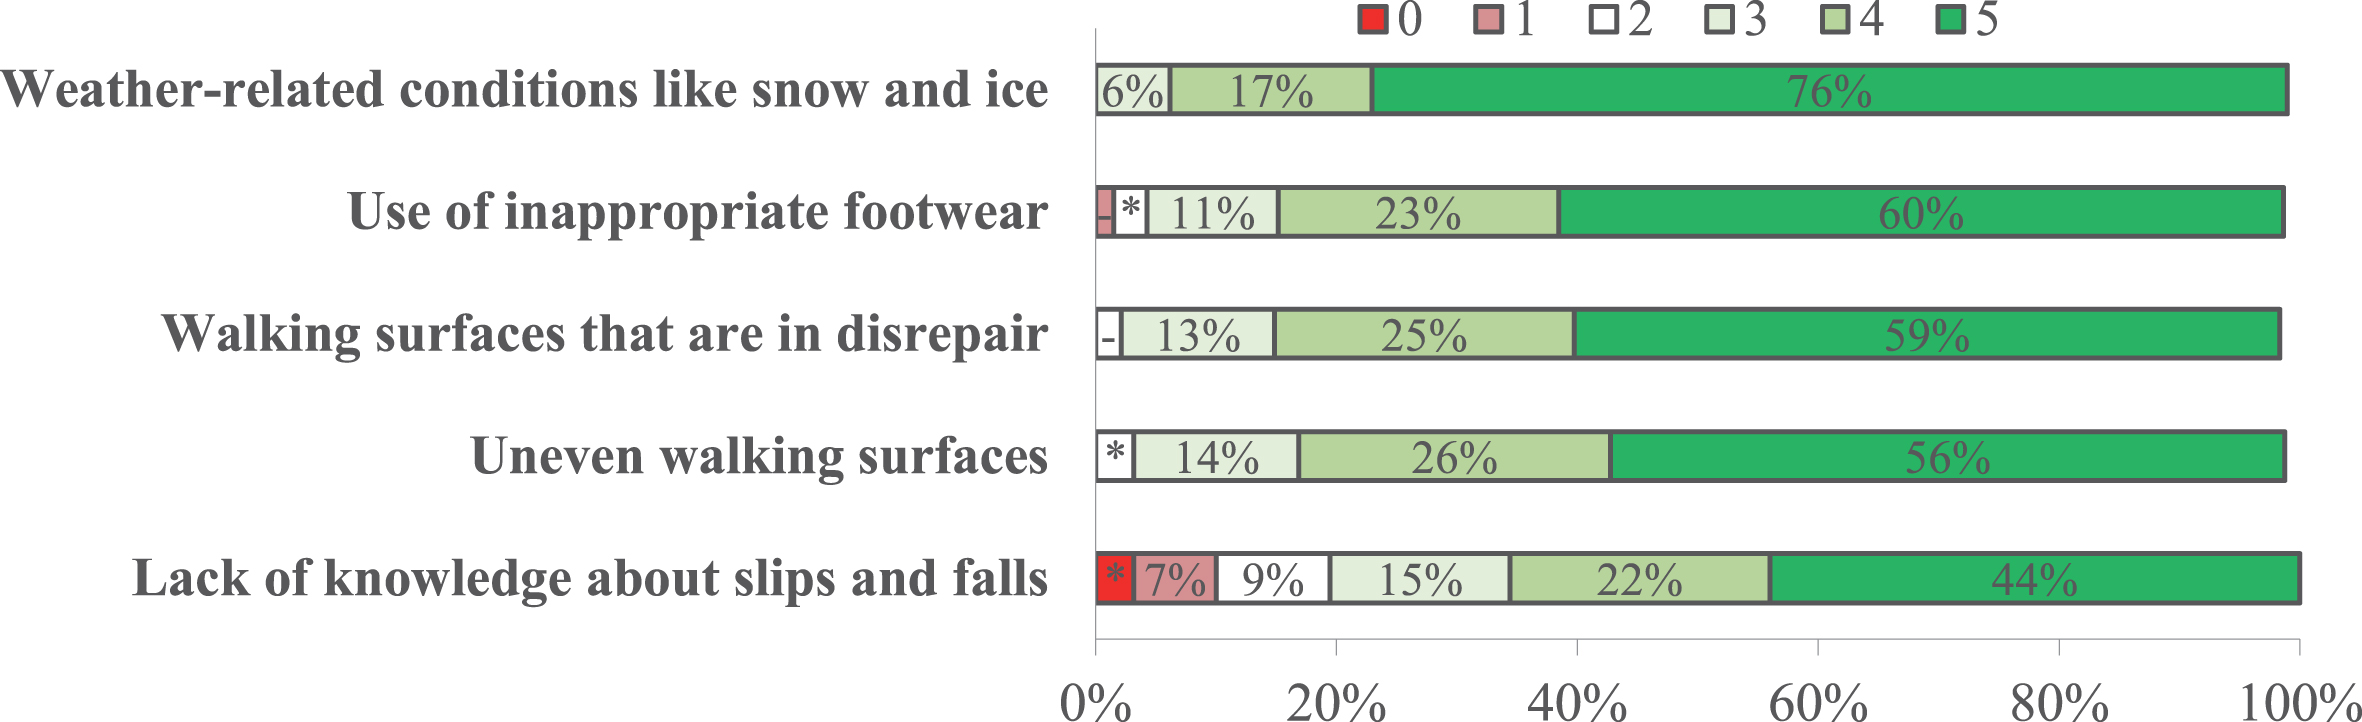
Most PSWs were confident or strongly confident in their ability to manage slip-and-fall incidents (67%), yet 72% wanted continuing education on safety tips for winter fall prevention strategies. About 76% of PSWs reported participating in safety training activities and 84% regularly read bulletins regarding slip and fall hazards. Of those who participated in the safety training activities, 82% agreed or strongly agreed that these sessions decreased their risk of falling. PSWs felt holding handrails and wearing good footwear were the most effective ways to prevent falls when providing care in the community (reported by 86% of PSWs for both). Watching out for irregular stairs, water and spills (77.1%), adjusting their stride to a pace suitable for the walking surface (72.0%), spreading salt or sand before starting to walk on the slippery surface (51.0%) were listed as the other common safety precautions used by this worker group. Figure 4 shows the respondent’s attitude to the contributing factors to slip-and-fall incidents. The majority of PSWs listed weather-related conditions like snow and ice as well as the use of inappropriate footwear as the two most important contributing factors leading to slip-and-fall incidents with average weighted scores of 4.66 and 4.33, respectively out of a possible 5 (p < 0.0001).
Fig.4
Percentage of participants who ranked contributing factors to slips-and-falls incidents based on their level of importance (rounded to the nearest percent). 0 = Not at all important to 5 = very important. Symbols (-,*) represent 2% and 3%, respectively.
With respect to fall-related injury history, 32% of PSWs reported having fallen in the past 2 years. Of those who have slipped or fallen, 84% occurred outdoor on ice- (62%) or snow-covered (36%) surfaces. Fifteen percent of PSWs reported feeling their footwear was an extremely important factor for fall risk, though almost 28% felt that they were not important at all. Twelve percent of PSWs experienced fall-related injuries in the past two years, with the majority of injuries involving their lower back (35.3%), lower leg/ankle/foot (23.2%) and thigh/knee (15.9%). These fall-related injuries commonly resulted in a Workplace Safety and Insurance Board (WSIB) report (38.1%), modified-work (35.7%) or lost time (32.1%).
3.1.4Winter footwear selection
Table 3 shows a representative list of 40 footwear models that were selected based on our survey results that we felt would meet the needs of our respondents. Even though only 7% of our survey respondents were male, we chose to select five pairs (12.5%) of men’s footwear and the remaining 35 pairs of women’s footwear to ensure a reasonable variety of men’s models were included. Three main factors were considered to select this representative list including price range, popular brands and styles. With respect to the price range, we select 20 models that were priced below $100 (listed by 57%), 14 models priced between $100– $150 (listed by 30%), five models priced between $150– $200 (listed by 9%) and one model priced between $200– $300 (listed by 3%). The list contained models that were more affordable from Payless or Walmart, which were priced in the $50 range, as 20% of our survey respondents select these stores for winter footwear purchases. With respect to the footwear style, the list contained 31 winter boots (76%), seven running shoes (17%) as well as two pairs of casual footwear (2%). We choose the footwear from a variety of brands and stores based on PSWs preference, with more pairs being included from the most popular brands/stores. These include Skechers (five pairs), SoftMoc (four pairs), The North Face (four pairs), Columbia (four pairs), Nike (two pairs) and Payless (two pairs). Some brands were found to be more popular, such as Columbia and Sketchers, compared to the others; however, we were restricted to the number of pairs we selected in those brands because of the other limiting factors, such as preferred price range and available styles.
Table 3
The 40 footwear models that were selected for MAA testing based on our survey results. The footwear was categorized as either a winter boots (W), running shoes (R), or casual footwear (C)
| ID | Brand | Model | Style | Price |
| 1 | Wind river | Women’s “Venice” Rain Boot | W | < $100 |
| 2 | Payless | Women’s Torrent Weather Boot | W | |
| 3 | Weather Spirits | Women’s Weather Spirits Boots | W | |
| 4 | Denver Hayes | Women’s Laurie Lace-Up Combat Boot | W | |
| 5 | Payless | Women’s Whiteout Cuff Down Boot | W | |
| 6 | Skechers | Women’s Relaxed Fit: Breathe Easy - Big Bucks | R | |
| 7 | Skechers | Women’s Modern Comfort Lace-Up Shoes | R | |
| 8 | Denver Hayes | Women’s Sally Lace-Up Shoe | R | |
| 9 | Skechers | Women’s Modern Comfort Lace-Up Chukka Boots | W | |
| 10 | SoftMoc | Women’s SMOCS 5 Black Chelsea Suede Boots | W | |
| 11 | Cros | Women’s Lodgepoint Lace Black Winter Boots | W | |
| 12 | Skechers | Women’s GOwalk Move Charcoal Chugga Bootie | W | |
| 13 | WindRiver | Women’s Cascade Hiking Shoe | R | |
| 14 | Timberland | Women’s Authentics Teddy Fleece Casual Boots | W | |
| 15 | SoftMoc | Women’s SALENA 2 Brown Waterproof Ankle Boots | W | |
| 16 | SoftMoc | Women’s KIARA Black Lace Up Casual Boots | W | |
| 17 | SoftMoc | Women’s MAKALA 2 Chestnut Lined Casual Boots | W | |
| 18 | Skechers | Women’s ON-THE-GO 400 Taupe Pull On Suede Boots | W | |
| 19 | Nike | Men’s Nike Son of Force Mid-Winter Shoes | C | |
| 20 | Reebok | Men’s Reebok Royal Reamaze 2 M | W | |
| 21 | Clarks | Women’s Sillian Ankle Boot | W | $100– $150 |
| 22 | Sorel | Women’s Cumberland Winter Boot | W | |
| 23 | Clarks | Women’s Clarks Desert Casual Boots | W | |
| 24 | The North Face | Women’s Thermoball Microbaffle Bootie | W | |
| 25 | Columbia | Women’s Grand Canyon Hiking Shoe | R | |
| 26 | Timberland | Women’s Savin Hill Chelsea Boot | W | |
| 27 | Columbia | Women’s Loveland Shorty OmniHeat Black Boots | W | |
| 28 | Sorel | Women’s Sorel Plus Out N About Leather Boots | W | |
| 29 | Columbia | Women’s Minx Shorty Omni-Heat Boot | W | |
| 30 | The North Face | Women’s Ballard Roll-Down Special Edition Boots | W | |
| 31 | Denver Hayes | Women’s “Brianna” Low-Cut Lace-Up Ankle Boot | W | |
| 32 | Adidas | Women’S Climawarm CP Choleah Padded Boots | W | |
| 33 | Columbia | Men’s Redmond Waterproof MidHiking Shoe | R | |
| 34 | The North Face | Men’s Back-To-Berkeley Redux Chukka Boots | W | |
| 35 | Nike | Women’s Roshe Two High | W | $150– $200 |
| 36 | Merrell | Women’s Aurora 6 Ice+Waterproof | W | |
| 37 | Merrell | Women’s Moab FST Ice+Thermo | W | |
| 38 | Saucony | Men’s Saucony PEREGRINE ICE+ | R | |
| 39 | Hush Puppies | Women’s Pender Spy Ice+Black WP Leather | C | |
| 40 | UGG | Women’s Adirondack Boot II - Leather | W | > $200 |
3.2Maximum achievable angle test results
MAA scores for all tested footwear are shown in Table 4. Of the 40 types of footwear that were tested, the best performing footwear achieved an MAA score of 14° for melting ice and 10° for bare ice. Six types of footwear passed our threshold value of 7°. The remaining 34 types of footwear fell below our threshold, thus are not recommended for use outdoors in winter (Fig. 5). It is important to note that footwear performance may change between the same models from one year to the next if the manufacturing process is altered. Therefore, we recommend checking www.ratemytreads.com for the most up-to-date information.
Fig.5
MAA scores for footwear tested in this study. The footwear models that passed our threshold score of 7° (demonstrating good slip resistance) are indicated with a green circle. The blue bars represent footwear that were tested by four participants in total. The red bars and red squares represent the footwear that completed the screening phase only. The dashed red bars represent the footwear that completed the screening phase successfully but received a failing score (below 7°) with a subsequent participant. The lowest score of the four conditions measured (bare ice uphill, bare ice downhill, melting ice uphill, melting ice downhill) is shown.
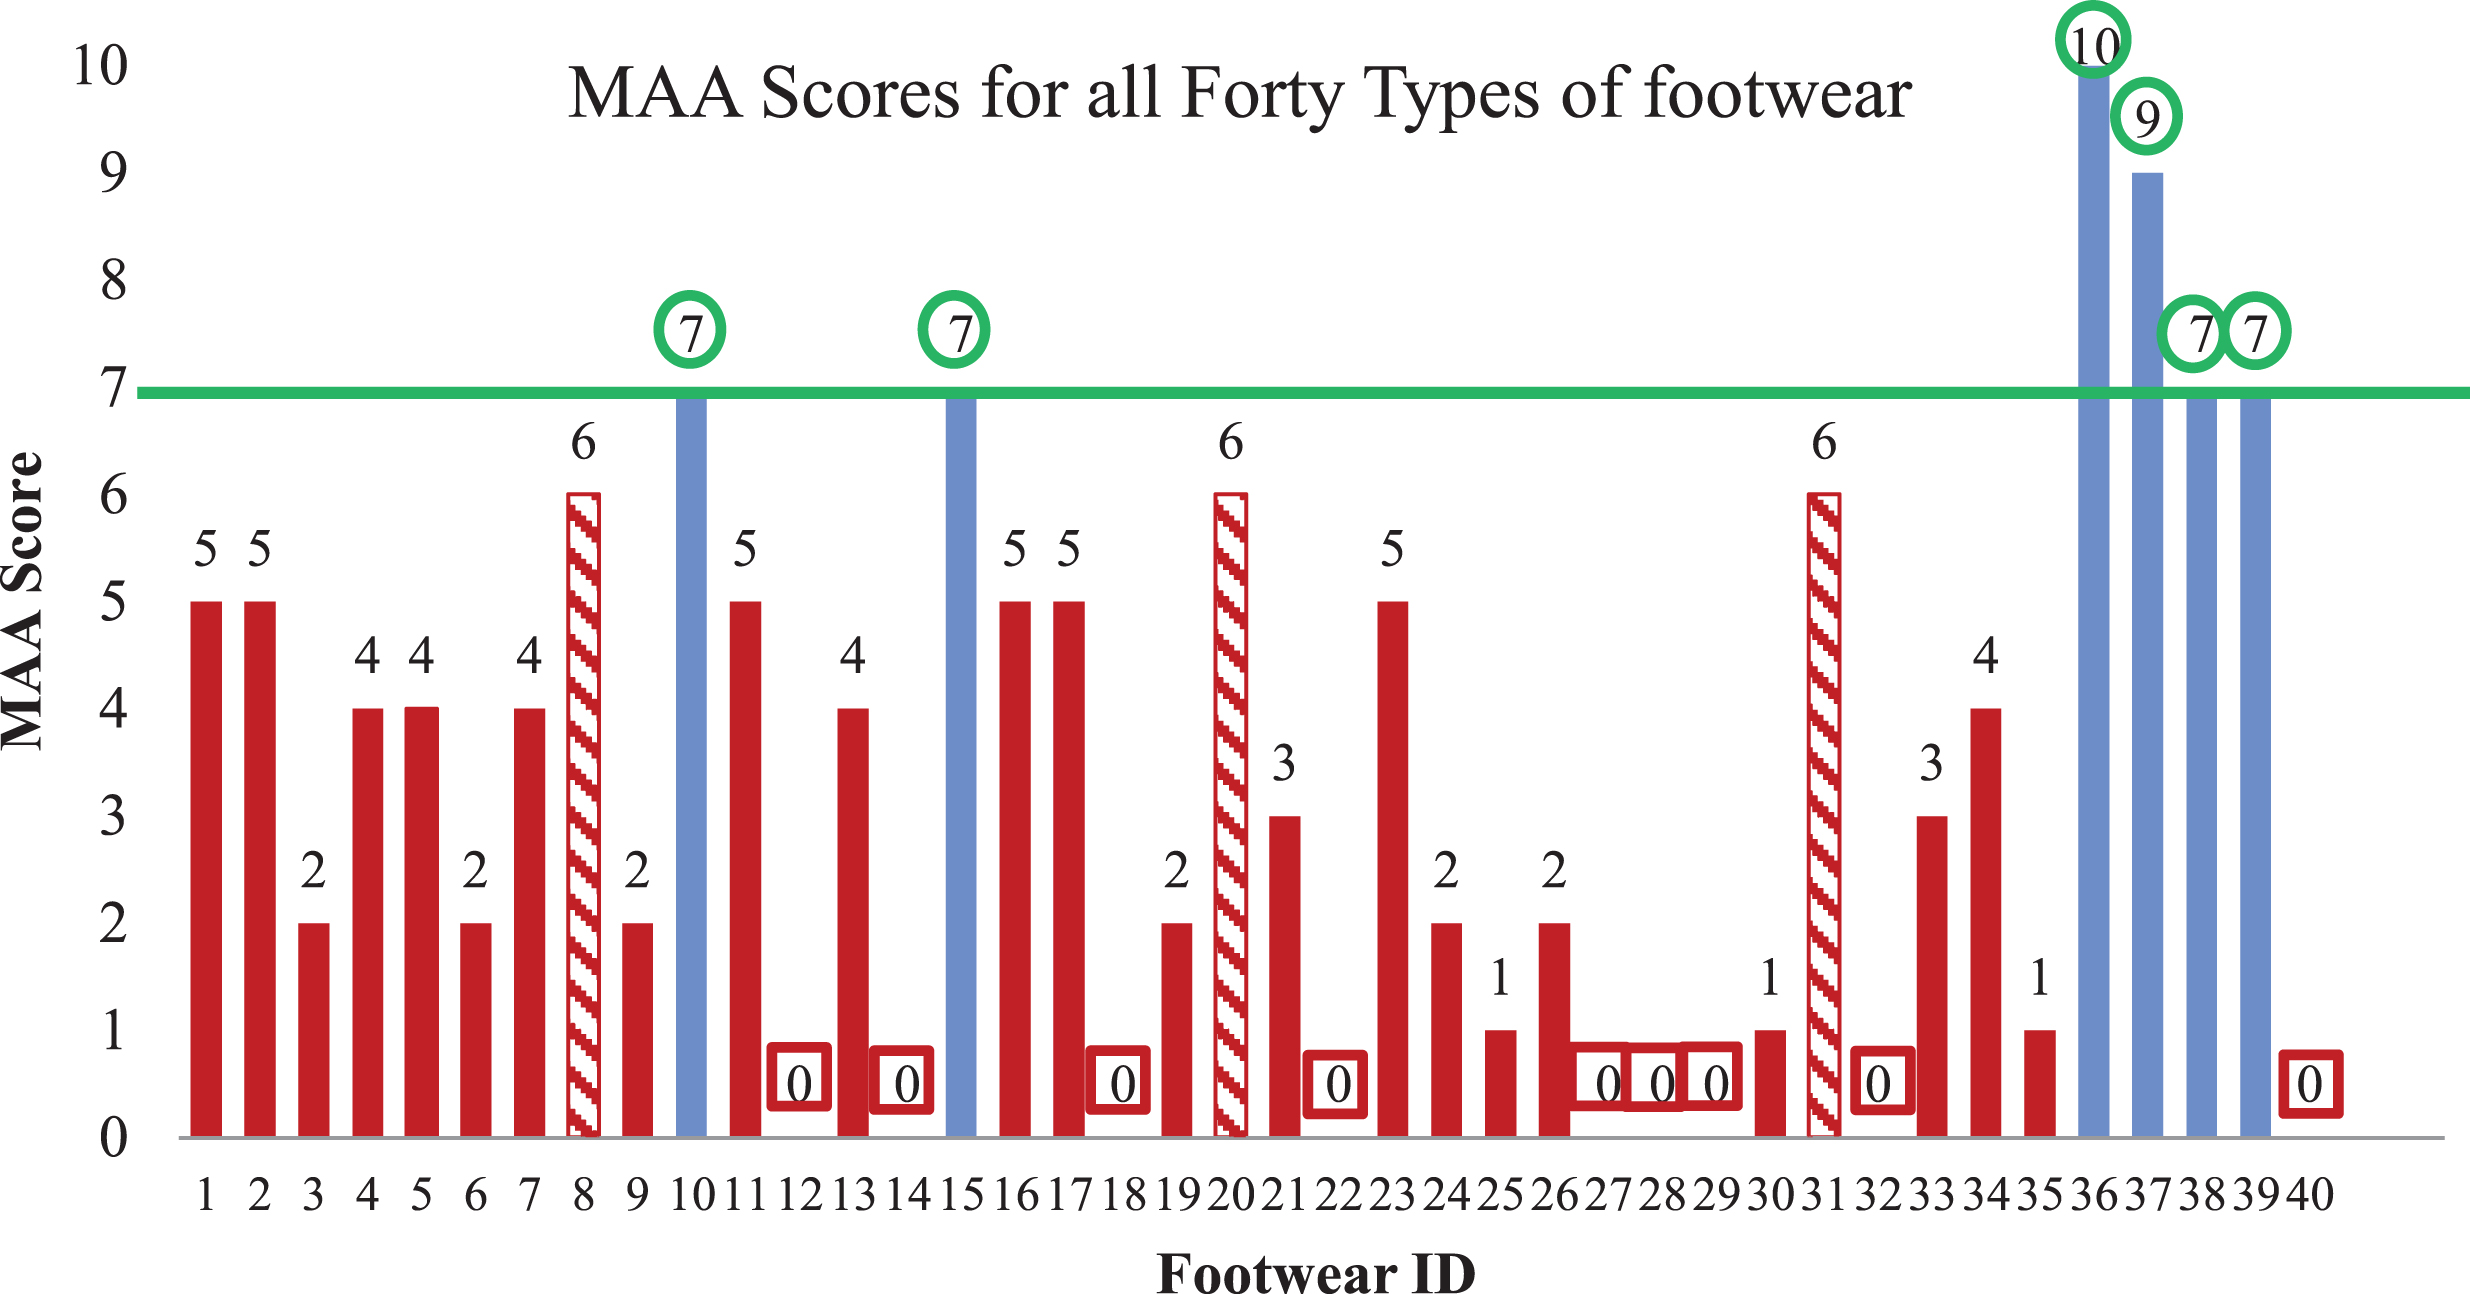
Table 4
MAA scores for the best performing footwear in our study. This score represents the incline of the steepest ice-covered slope that participants were able to walk up and down without slipping. A footwear model’s MAA score is determined by taking the minimum angle that all participants were able to ascend and descend across both ice conditions without slipping
| Bare Ice | Melting Ice | |||
| ID | Uphill MAA | Downhill MAA | Uphill MAA | Downhill MAA |
| 10 | 9 | 8 | 8 | 7 |
| 15 | 8 | 7 | 8 | 7 |
| 36 | 10 | 10 | 11 | 10 |
| 37 | 9 | 9 | 12 | 11 |
| 38 | 9 | 7 | 14 | 14 |
| 39 | 8 | 7 | 11 | 9 |
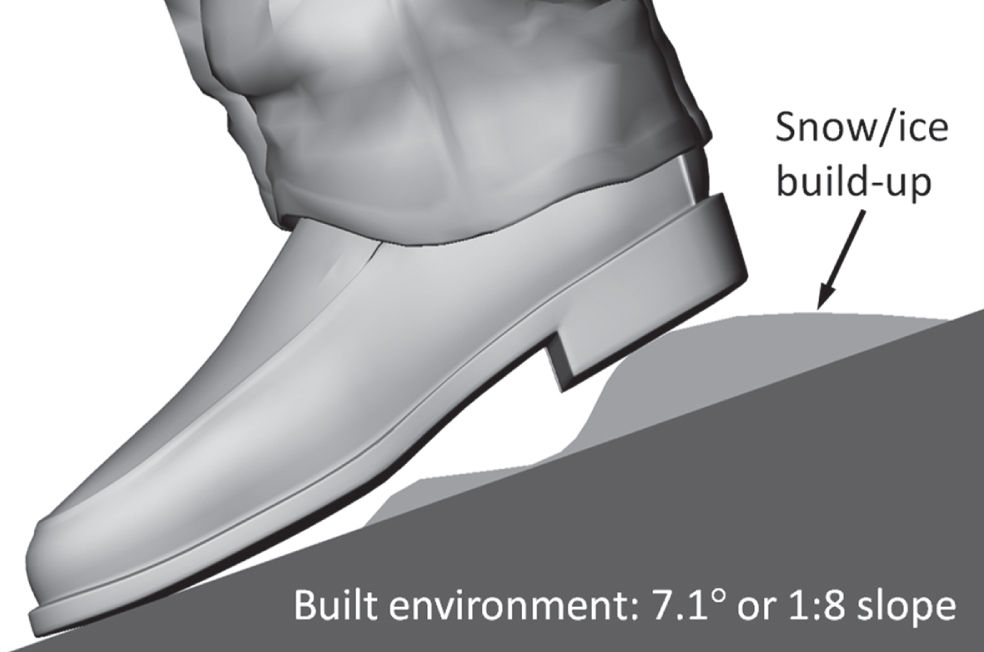
A larger MAA indicates that the footwear is safer on all surfaces. A user wearing footwear with a high MAA score will have better traction on ice on a level or sloped surface in the built environment. In particular, it is important to note that the effective slope in a particular spot can be considerably higher than the underlying built environment surface because of snow and/or ice buildup, as shown in Fig. 6.
Fig.6
Snow/ice buildup can increase the effective slope of the built environment.
Of the six types of footwear that passed our threshold, four included a new outsole material technology which allows for better traction. These four types of footwear had Vibram Arctic Grip outsoles, which included microscopic fibers embedded in the rubber outsole. The Arctic Grip technology was included in the women’s Merrell Aurora 6 Ice+Waterproof boots, Merrell - Moab FST Ice+Thermo, Men’s Hush Puppies - Pender Spy Ice+Black WP Leather and Men’s Saucony PEREGRINE ICE+. Of the six models of footwear that passed our MAA threshold, two fell within the $50 to $100 price range defined to be acceptable by 58% of PSWs. The other four types of footwear with best MAA score are within the price range of $150– $200, which only 9% of PSWs found acceptable.
It may be worth noting that our team is in process of developing new composite materials for affordable slip-resistant footwear [25–27] to address the lack of affordable slip resistant footwear. Our initial testing demonstrated that our novel material performed better at maintaining slip resistance on ice after being exposed to simulated wear compared to existing composite outsoles [25, 26]. Aside from its improved wear resistance, the lab-based tests have indicated the coefficient of friction (COF) on ice may be greater than the best footwear on the market [27].
Therefore, future work should include ways of addressing the price gap between PSWs’ willingness to pay and the retail cost of better-performing footwear. For instance, PSWs could be encouraged to purchase slip resistant footwear through the means of bulk buying, discounts, or subsidies from employers etc. An alternative strategy is to motivate the footwear industry to develop different types of footwear, including slip resistant overshoes, which could likely be sold at lower cost. This option may be particularly attractive for PSWs since they currently carry an extra pair of indoor footwear that they change into when they arrive at their clients’ homes. An overshoe that can be removed upon arrival at the client’s home would allow them to travel more efficiently.
Our findings showed that 5% of PSWs (around 34 people in our survey) experienced fall-related injuries (WSIB reported) in the past two years, costing as much as $59,000 per injury [2]. Therefore, future work should include field tests of slip resistant footwear to calculate the potential economic benefits to employers.
3.3Limitations of this study
There are three limitations to this study:
1. We select test footwear based on our survey results and availability but we were unable to confirm that these particular footwear models would actually be purchased by PSWs.
2. We have on-going work evaluating the wear resistance of the recommended footwear in this study that shows the slip resistance of some of the best performing footwear decreases over as little as 100,000 steps. Future studies will evaluate how often the best performing footwear needs to be replaced due to wear. Results from this future work will be added to the information presented on ratemytreads.com.
3. The MAA testing protocol described in this paper has an accuracy of±1° standard deviation (SD) at 95% CI. For the four pairs of recommended footwear with MAA score at the threshold value of 7°, further testing with more participants may result in MAA values that fall below our cut-off. The MAA testing protocol is under on-going review with our growing pool of test data. As a result of this work, we are considering revising the protocol to include testing with larger numbers of participants when approaching the threshold value of 7° to reduce variability near the cut-off value.
For the reasons outlined above in points 2 and 3, we recommend readers consult our ratemytreads.com website for the most up-to-date information before making a footwear purchase.
4Conclusions
The majority of winter footwear that would be considered appropriate for PSWs had poor slip resistance on icy surfaces. Only six of the 40 models tested achieved a rating higher than our 7° cut-off. Personal support workers should consider selecting from our recommended footwear list at ratemytreads.com for use in the winter. Our results suggest that there is an opportunity for footwear manufacturers to develop a wider selection of boots with good slip resistance performance since there are only small number that meet the needs and preferences of PSWs.
Conflicts of interest
All authors declare no conflict of interests with footwear manufacturers/retailers in the current work. Our team does enter into fee-for-service contracts with footwear manufacturers and retailers for slip resistance testing. However, all of the footwear reported in this study was purchased and the testing was funded by the agencies listed in the acknowledgements section.
Acknowledgments
The authors acknowledge the financial support from the Ministry of Labour (Ontario), Canadian Frailty Network and Saint Elizabeth Health Care.
Appendices
Appendix

References
[1] | Workplace Safety & Prevention Services. Workplace Safety & Prevention Services Falls Infographic. (2014) [Available from: http://www.wsps.ca/Information-Resources/Topics/Slips,-Trips-and-Falls.aspx. |
[2] | Workplace Safety & Prevention Services. Preventing Slips, Trips and Falls in the Workplace [Available from: https://carleton.ca/ehs/wp-content/uploads/slippreventionWSIB2130A.pdf. |
[3] | Flynn J , Di Pilla S , Vidal K . The development of a universal approach to testing of walkway slip resistance in the U.S. WORK: A Journal of Prevention, Assessment, and Rehabilitation. (2012) ;41: (Suppl 1):3355–7. |
[4] | Yu R , Li KW . Perceived floor slipperiness and floor roughness in a gait experiment. WORK: A Journal of Prevention, Assessment, and Rehabilitation. (2015) ;50: (4):649–57. |
[5] | Drebit S , Shajari S , Alamgir H , Yu S , Keen D . Occupational and environmental risk factors for falls among workers in the healthcare sector. Ergonomics. (2010) ;53: (4):525–36. |
[6] | Bell JL , Collins JW , Wolf L , Gronqvist R , Chiou S , Chang WR , et al. Evaluation of a comprehensive slip, trip and fall prevention programme for hospital employees. Ergonomics. (2008) ;51: (12):1906–25. |
[7] | Bowden FP , Hughes TP . The Mechanism of Sliding on Ice and Snow. Proceedings of the Royal Society of London Series A, Mathematical and Physical Sciences. (1939) ;172: (949):280–98. |
[8] | Amandus H , Bell J , Tiesman H , Biddle E . The epidemiology of slips, trips, and falls in a helicopter manufacturing plant. Human factors. (2012) ;54: (3):387–95. |
[9] | Kemmlert K , Lundholm L . Slips, trips and falls in different work groups–with reference to age and from a preventive perspective. Applied ergonomics. (2001) ;32: (2):149–53. |
[10] | Verma SK , Chang WR , Courtney TK , Lombardi DA , Huang YH , Brennan MJ , et al. A prospective study of floor surface, shoes, floor cleaning and slipping in US limited-service restaurant workers. Occup Environ Med. (2011) ;68: (4):279–85. |
[11] | Smith PM . Workplace climate, employee actions, work injury and structural equation modelling. Occupational and environmental medicine. (2015) ;72: (7):465–6. |
[12] | Swedler DI , Verma SK , Huang Y-H , Lombardi DA , Chang W-R , Brennan M , et al. A structural equation modelling approach examining the pathways between safety climate, behaviour performance and workplace slipping. Occupational and environmental medicine. (2015) . |
[13] | Wustemann L . Slip resistant footwear, in Health and Safety at work. (2007) . |
[14] | Bentley TA , Haslam RA . Slip, trip and fall accidents occurring during the delivery of mail. Ergonomics. (1998) ;41: (12):1859–72. |
[15] | Auditor General of Ontario. Annual Report of the Office of the Auditor General of Ontario. CCACs-Community Care Access Centres-Home Care2015 [Available from: http://www.auditor.on.ca/en/content/annualreports/arreports/en15/2015AR_en_final.pdf. |
[16] | Workplace Safety & Insurance Board. By the numbers: 2013 WSIB statistical report. (2014) . |
[17] | Zhang SW . State-of-the-art of polymer tribology. Tribology International. (1998) ;31: (1):49–60. |
[18] | Gao C , Abeysekera J . A systems perspective of slip and fall accidents on icy and snowy surfaces. Ergonomics. (2004) ;47: (5):573–98. |
[19] | Gard G , Berggård G . Assessment of anti-slip devices from healthy individuals in different ages walking on slippery surfaces. Applied Ergonomics. (2006) ;37: (2):177–86. |
[20] | Grönqvist R , Hirvonen M . Slipperiness of footwear and mechanisms of walking friction on icy surfaces. International Journal of Industrial Ergonomics. (1995) ;16: (3):191–200. |
[21] | Government of Ontario. Accessibility for Ontarians with Disabilities Act (AODA). (2016) . |
[22] | Bagheri ZS , Patel P , Li Y , Morrone K , Fernie G , Dutta T . Slip resistance and wearability of safety footwear used on icy surfaces for outdoor municipal workers. WORK: A Journal of Prevention, Assessment, and Rehabilitation. (2018) ; In Press. |
[23] | Brookman C , Denton M , Zeytinoglu I , Davies S . The PSW Health and Safety Matters Survey (2016) [Available from: http://www.pswshaveasay.ca/survey-results.html. |
[24] | Evans JD . Straightforward Statistics for the Behavioral Sciences. Pacific Grove, CA: Brooks/Cole Publishing; (1996) . |
[25] | Anwer A , Bagheri Zahra S , Fernie G , Dutta T , Naguib Hani E . Evolution of the Coefficient of Friction with Surface Wear for Advanced Surface Textured Composites. Advanced Materials Interfaces. (2017) ;4: (6):1600983. |
[26] | Bagheri ZS , Anwer AA , Fernie G , Naguib HE , Dutta T . Ice-Friction Characterization of Multifunctional Surface-Textured Hybrid Composite Materials using Taguchi Design of Experiment. Wear, Submitted. (2018) . |
[27] | Bagheri ZS , Anwer AA , Fernie G , Naguib HE , Dutta T , editors. Improving Slip Resistance on Ice: Surface-Textured Composite Materials for Slip-Resistant Footwear. Proceedings of the 20th Congress of the International Ergonomics Association; (2018) . |

