
Slip resistance and wearability of safety footwear used on icy surfaces for outdoor municipal workers
Abstract
BACKGROUND:
Outdoor workers experience high injury rates in the winter due to slipping on ice and snow. Our testing program has demonstrated that most safety footwear does not provide adequate slip-resistance and/or comfort in icy conditions.
OBJECTIVE:
Our objective was to determine which of the most commonly worn safety footwear available to outdoor municipal workers in Toronto, Ontario, Canada would best prevent slips on icy surfaces and which models had good wearability.
METHODS:
We selected 45 of the most popular types of winter footwear worn by these workers and applied our Maximum Achievable Angle (MAA) test method to rate the slip-resistance of the footwear. A ten-point rating scale was used for recording participants’ perceptions of wearability. The MAA test measured the steepest ice-covered incline that participants can walk up and down without experiencing a slip.
RESULTS:
Of the 45 types of footwear tested, only one model achieved an MAA score of 8 degrees that exceeded our cut-off for acceptable performance set at 7 degrees. Secondary measures of performance including thermal insulation; wearability and heaviness of footwear tested were also ranked.
CONCLUSION:
Our results demonstrate that footwear manufactures have the opportunity to differentiate their footwear by investing in slip-resistant outsole materials.
1Introduction
Falls are considered a major public health problem globally and are ranked as the second leading cause of unintentional injury and death, after traffic accidents [1]. They result in 646,000 fatalities annually world-wide with over 17 million disability-adjusted life years lost [1]. Falls can result from a loss of balance caused by slips or trips. In this paper, we focus on falls caused by slipping on icy surfaces that result from poor grip or low friction between footwear and the underfoot surface. Several factors contribute to these types of falls. These include extrinsic (i.e. environmental such as weather, lighting, physical obstacles, visual and spatial distractions), intrinsic (i.e. human such as unstable joints, muscle weakness and unreliable postural reflexes) and mixed (i.e. system such as inappropriate fall risk assessment for patients) factors [2]. In Nordic countries, 16% of fall-related accidents at work, home and during leisure activities are caused by slipping, of which 2/3 involve icy surfaces [3]. The environmental conditions become more severe on ice-covered surfaces [4]. This is because the polar water molecules manifest as a quasi-liquid layer and act as a lubricant under most winter conditions [5].
According to the Ontario Case Costing database, between 2006 and 2015, the average annual number of hospitalizations related to slips and falls on snow and ice was about 2800 among Toronto residents [6]. These injuries cost the provincial healthcare system close to $4,000,000 each year on average [6]. In addition, winter slips and falls cost the city about $6,700,000 per year as a result of liability insurance claims [6]. However, these values underestimate the numbers and public health impact of falls in icy conditions, perhaps by orders of magnitude, since many falls causing no/minor injury go unreported.
Outdoor municipal workers and Personal Support Workers (PSWs) are two worker groups who are regularly exposed to ice and snow covered surfaces and experience high rates of injury due to slip-and-fall accidents. Yet these two groups of workers are supported differently by their employers regarding their work footwear purchases. PSWs are considered low paid vulnerable workers and are typically responsible for the purchase of their own footwear while outdoor municipal workers have their footwear subsidized if purchased from an approved vendor. Our companion paper measures the slip-resistance performance of footwear commonly worn by PSWs [7]. In this paper, we evaluate the performance of footwear available to outdoor workers employed by the City of Toronto (Ontario, Canada) including firefighters, paramedics, solid waste collectors as well as power and water workers.
Slip-resistance of footwear plays an important role in the prevention of falls by providing traction to prevent balance loss [8–11], yet there have been only a few studies on this subject [12–14]. We believe the difficulty of producing and maintaining consistent winter test conditions may explain the lack of testing on winter surfaces. Most of these studies were limited to measurements of perceived slipperiness [12, 13]. Objective measurements with mechanical devices on natural winter surfaces were also limited due to inconsistent testing conditions. Changes to humidity and temperature can highly affect ice frictional properties [14].
To address the limitations above, our team developed a new testing protocol for evaluating slip-resistance of footwear in a controlled ecologically valid condition that safely mimics the actual winter environment. This test method, called the Maximum Achievable Angle (MAA) test, measures the steepest incline, covered in ice, which participants can walk up and down without experiencing a slip. A model’s MAA score is calculated by finding the minimum angle that all participants were able to ascend and descend across both ice conditions without slipping. Using these test results, we have developed an evidenced-based rating system for outdoor winter footwear available for customers online at www.ratemytreads.com. The footwear that achieves or surpasses a rating of 7 degrees receives a positive recommendation on our review website. This 7 degrees cut-off was based on the maximum allowable slope for a curb ramp as based on existing accessibility guidelines for the built environment with the expectation that footwear should prevent slips on commonly encountered icy curb ramps [15]. This rating system allows consumers to evaluate potential footwear options in terms of their ability to prevent slips before purchasing new winter footwear.
Evaluations of winter footwear should also include ratings of wearability factors such as comfort, weight as well as the quality of thermal insulation. For instance, several survey studies of attachable crampon-like devices designed to give better grip on ice for use by outdoor workers had poor acceptance because users found them to be uncomfortable. This is likely because they caused some instability and changes in gait patterns [13]. A survey of 125 outdoor workers in northern Sweden [16] showed that fit was the most important ergonomic feature for the design of footwear worn in cold climates. Similarly, recent results of our companion study with over 650 PSWs demonstrated that comfort, slip-resistance, weight, warmth and cost are important features that PSWs consider for winter footwear selection [7]. Based on these findings, we believe that for winter safety footwear to be effective at reducing the risk of falls, it needs to include good slip-resistance, but also good thermal insulation and wearability so that workers actually wear them.
The objective of this study was to measure the slip-resistance, thermal insulation and wearability of safety footwear available to outdoor municipal workers in Toronto, Ontario, Canada. To obtain this data, we selected 45 of the most popular types of winter footwear worn by outdoor municipal workers in Toronto and applied the MAA test method to rate their slip-resistance as our primary outcome measure. Subjective perceptions of thermal comfort and wearability of the footwear were also obtained for each model as secondary outcome measures. This study was approved by the Research Ethics Board at University Health Network (UHN), Toronto, Canada and all participants provided informed consent prior to participating in our study.
2Methods
2.1Footwear selection
Outdoor workers employed by the City of Toronto include firefighters, paramedics, solid waste collectors, power and water workers. These groups are at risk of falls as they trek over wide ranging uncontrolled surface conditions including icy surfaces. All workers at the City of Toronto select their work footwear from a single distributor’s catalog (Mr. Safety Shoes, Toronto, Ontario). In order to identify the most often purchased footwear types for this worker group, we were provided a record of these selections for a period of July 2015 – May 2016. This list was used to determine the models that were purchased most often. The ratio of men’s and women’s footwear models were selected to be representative of the demographics of the overall worker group which was approximately 13% female and 87% male. Based on these demographics, 40 pairs of men’s footwear and 5 pairs of women’s footwear styles were identified for our evaluation (Table 1). It is important to note that some of these footwear models may have been purchased for non-winter use by workers though the vast majority of models appeared to be designed (superficially, at least) for winter wear (good insulation and deep tread patterns).
Table 1
Footwear selection list of the 45 most often puchased footwear models worn by city workers. The brand name and footwear name is listed and each footwear type is represented with an ID number
| ID | Brand | Footwear | ID | Brand | Footwear |
| 1 | SideWinder | BTT - 630 | 23 | Original S.W.A.T. | Classic 6′′ - 2261 - |
| 2 | Mellow Walk | Maddy - 446049 | 24 | Original S.W.A.T. | Classic 9′′ SZ Safety – 2252 |
| 3 | CAT | Kitson - 304104 | 25 | Reebok Work | Arion - IB4501 |
| 4 | Mellow Walk | Maddy - 425049 | 26 | Mellow Walk | Quentin - 547049 |
| 5 | Timberland | Powertrain - 92661 | 27 | Sidewinder | Detroit Low - 488 |
| 6 | Blundstone | Green Patch - 163 | 28 | Mellow Walk | Quentin – 550049 |
| 7 | Sidewinder | BTT - 618 | 29 | Cofra | Leader - Cofra 426 |
| 8 | Sidewinder | Dominator - 8801 | 30 | Timberland | Resistor – 90660 |
| 9 | Sidewinder | Sven - 6620 | 31 | Rockport | More Energy – IR6635 |
| 10 | Timberland | BoonDock - 89645 | 32 | Mellow Walk | Quentin – 570049 |
| 11 | Baffin | Titan - 2359034 | 33 | Timberland | Hyperion - 92642 |
| 12 | Acton | Propulsion - A906212 | 34 | Magnum | Stealth Force - 5319 |
| 13 | Viper | Belmont - 913BLK | 35 | Sidewinder | Overtime - 1658-010 |
| 14 | Mellow Walk | Jack - 556039 | 36 | Viper | Selby - 9874-6 |
| 15 | Baffin | WhiteHorse - 8557019 | 37 | Magnum | Stealth Force - 5320 |
| 16 | Timberland | BoonDock - 91631 - | 38 | Timberland | Ratchet – 39077 |
| 17 | Sidewinder | 8867 | 39 | Terra | Albany – 835235 |
| 18 | Wolverine | Stud - 47803 | 40 | Acton | Cannonball - A907611 |
| 19 | Mellow Walk | Jack - 554039 | 41 | Royer | M.O.A.B 10-8620. |
| 20 | Viper | Brentwood - 9892BLK | 42 | Royer | DLX 10-9900 |
| 21 | Sidewinder | Vancush - 401 | 43 | Sidewinder | Turbo – 8502 |
| 22 | Terra | Spider - 608115 | 44 | Acton | A9067-12 |
| 45 | Wolverine | Glacier CSA Waterproof 19303 |
2.2WinterLab setup
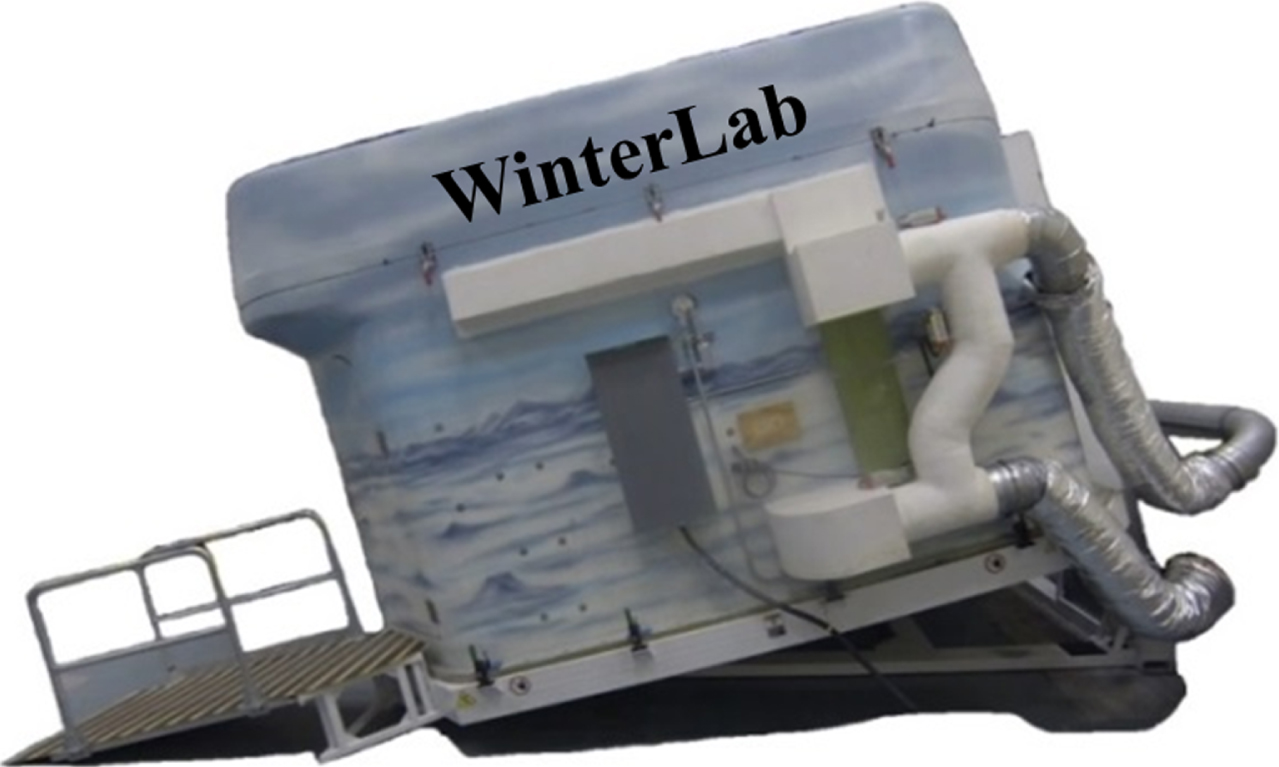
All of the footwear testing for this study was performed in WinterLab which is part of the Challenging Environment Assessment Labs at Toronto Rehabilitation Institute (TRI) - University Health Network (UHN) (Fig. 1). WinterLab is capable of creating realistic winter conditions, including cold air temperatures, snow and ice covered surfaces, which can be tilted up to 15 degrees to create slopes. Footwear slip-resistance was tested using our MAA protocol (described below) in which participants walked up and down ice-covered slopes while the angle of the floor was slowly increased until each model started to experience slips. The footwear was also rated for wearability by asking participants about their experience using the footwear. This included how easy each model was to don/doff, how heavy the participants perceived each model to be, how well each model fit, how warm they perceived the footwear to be as well as how slippery each model was perceived to be along with an overall rating of each model. Each footwear model was tested using two different surface conditions in WinterLab: a) bare ice, b) melting ice. Bare ice is a colder condition with air temperature ranging from +2.5°C to +3.5°C with no liquid water visible on the ice surface. In contrast, melting ice includes a visible layer of liquid water on the surface of the ice as it is a warmer condition with air temperature ranging from +7.0°C to +10.0°C. All test footwear was cleaned and left in WinterLab for at least 30 minutes prior to each testing session to ensure the footwear had equilibrated to the internal lab temperature by the start of each session. Throughout each testing session, the ice was resurfaced by adding a thin layer of water as needed on the ice surface using a mop (Swiffer, WetJet) to ensure a consistent testing surface was maintained for the duration of each testing session. Only new footwear was tested to ensure the outsoles were clean to prevent possible contamination of the ice surface from any foreign debris.
Fig.1
WinterLab shown tipped on an angle.
2.3The Maximum Achievable Angle (MAA) test
The 45 types of footwear were evaluated using the MAA testing protocol. All participants were required to wear a safety harness for the duration of each testing session to ensure a slip or fall in WinterLab would not result in injury. The harness was adjusted such that the participant’s knees could not touch the ground if they attempted to kneel. A researcher/observer was present in WinterLab with each participant for the duration of each testing session.
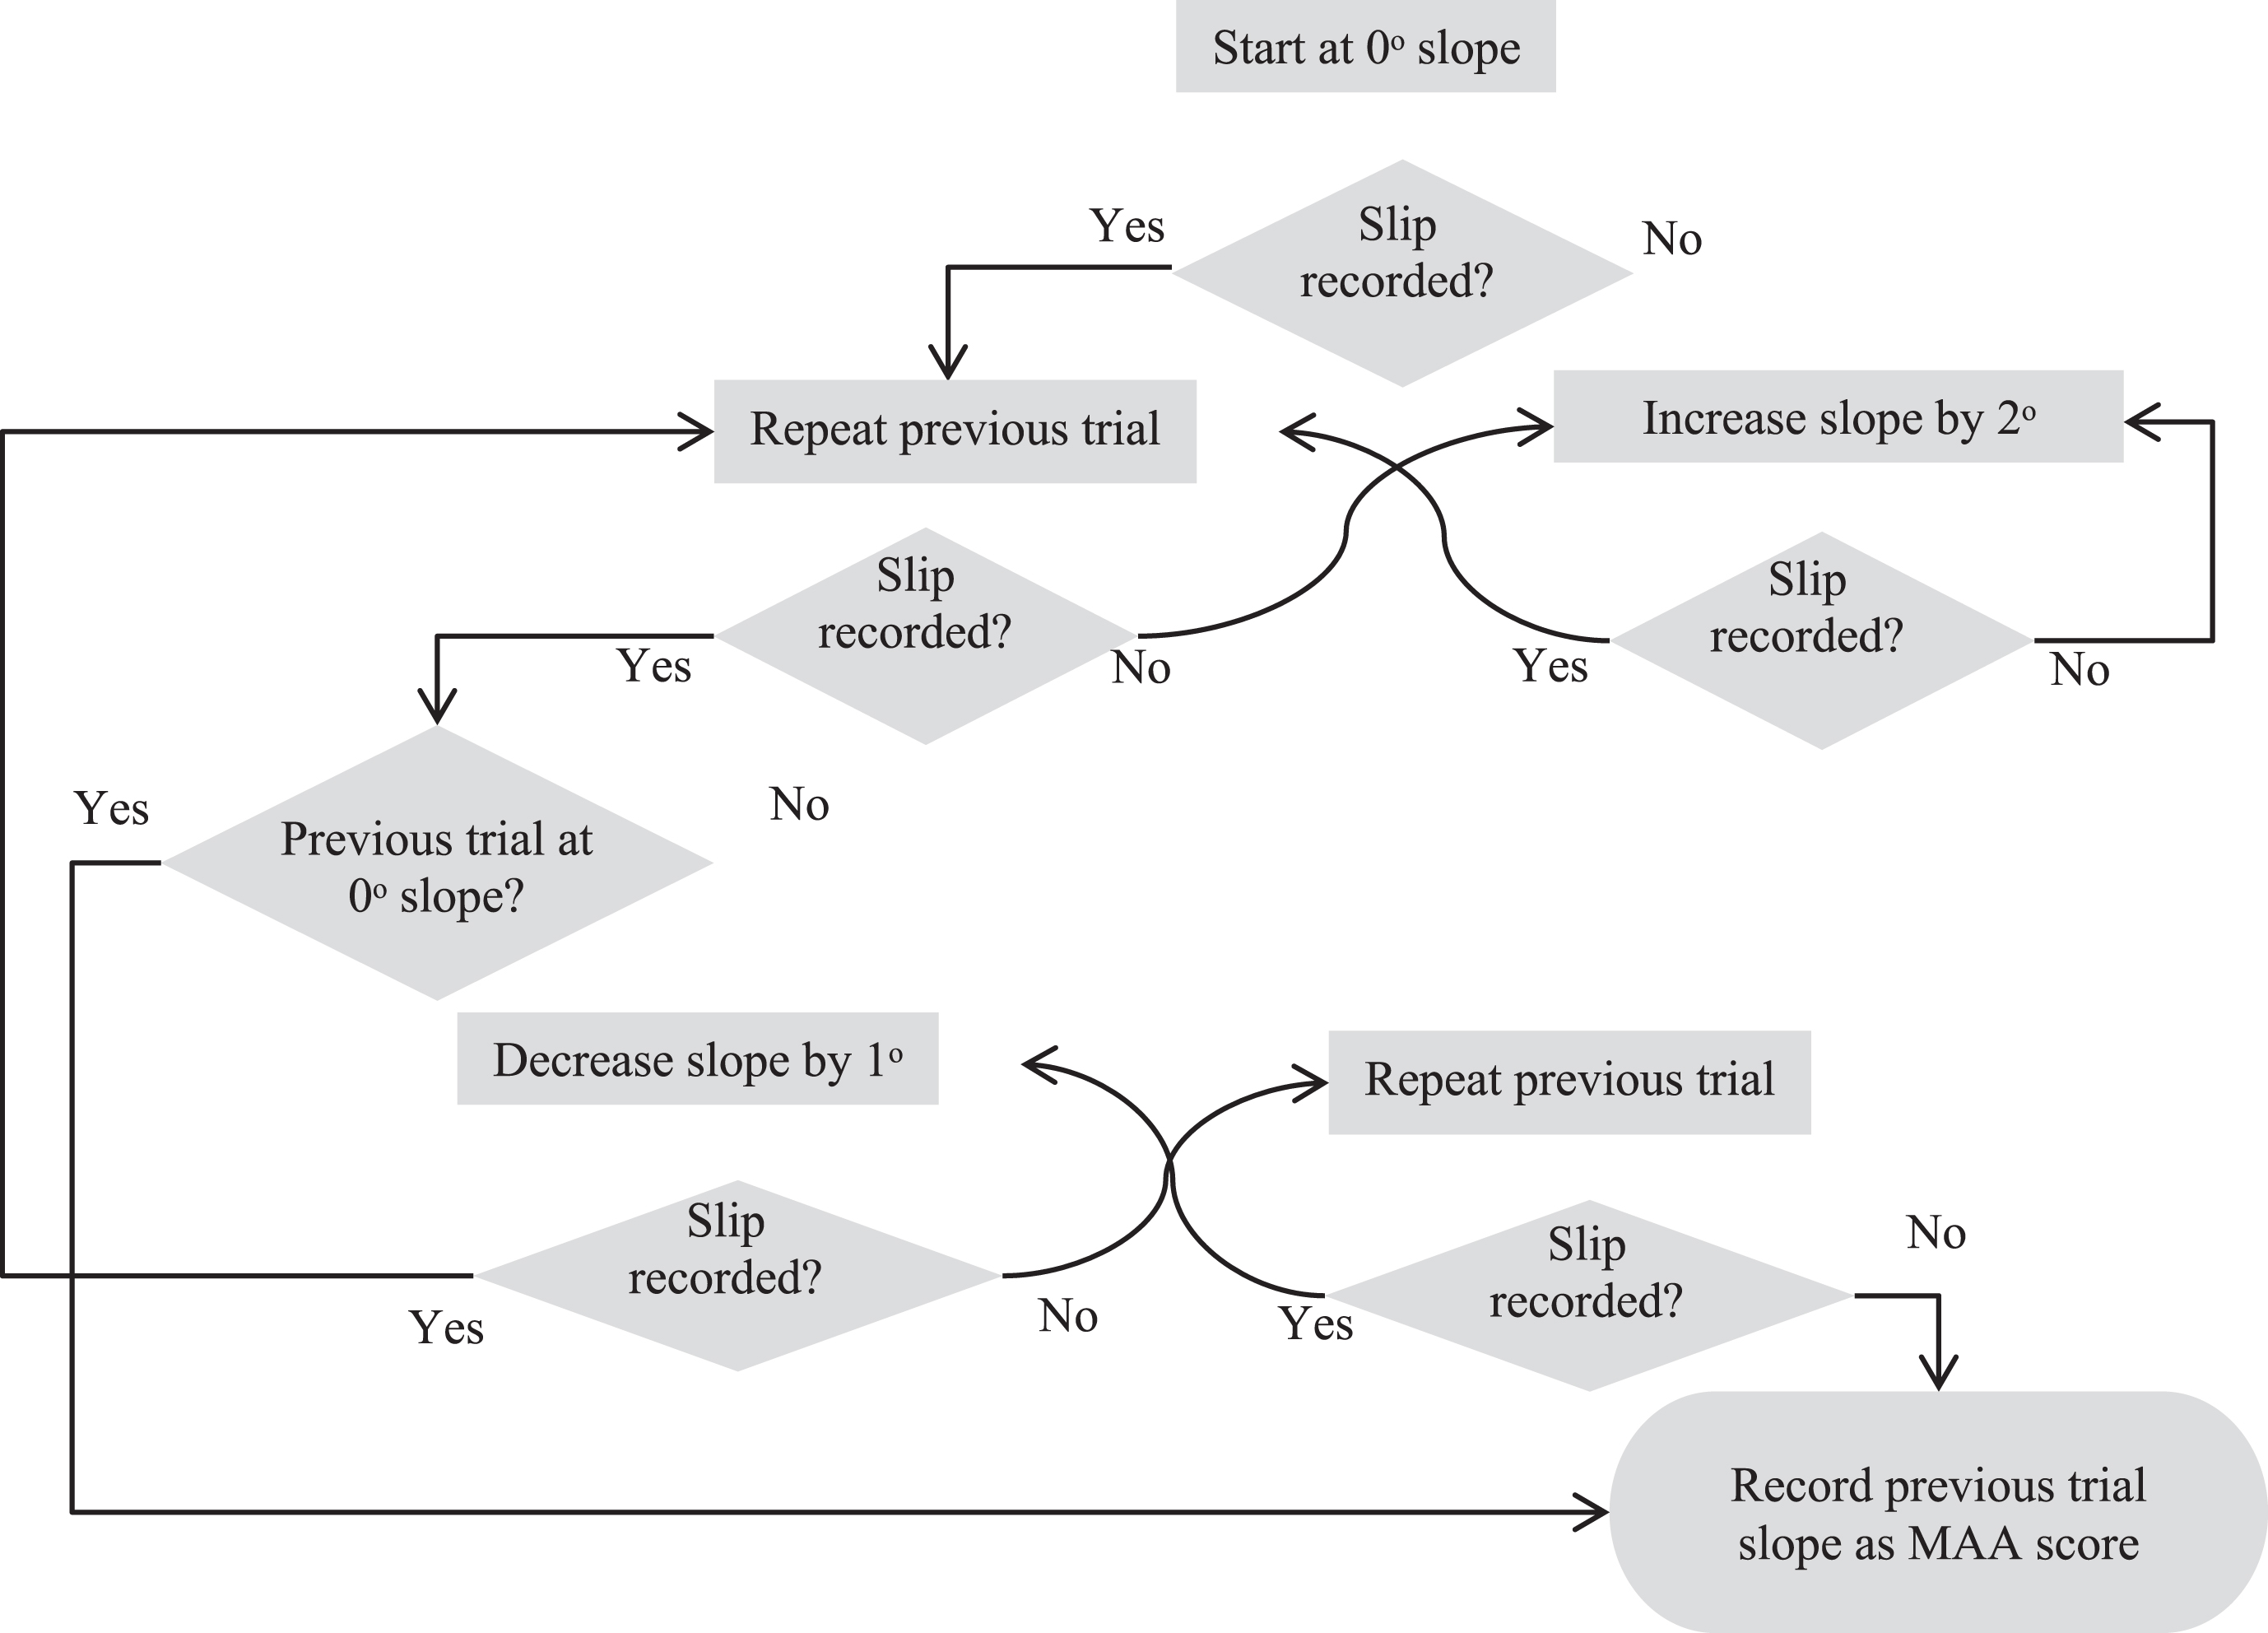
Participants began the MAA test on level ground (0 degree slope). After this trial, each participant’s initial perception of slipperiness was recorded (1 = very slippery, 10 = not at all slippery) on a scale from 1 to 10. The ice-covered slope was increased by tilting the WinterLab to successively steeper angles until the observer noted the participant had slipped during a trial. This process was repeated for each model of test footwear by increasing the slope in search of the angle where the observer noted the participant was able to successfully walk up or down a given slope for two trials while slipping on a slope that was 1 degree steeper (Fig. 2). This angle was recorded as the MAA for both uphill and downhill trials separately.
Fig.2
MAA test protocol. Once the slope angle has been set, participants ascended and descended the incline. If the observer rated the walk as a pass or fail, the angle was increased or decreased by one degree, respectively. The slope angles were changed according to the pass or fail rating and once the passing and failing angles were achieved (two fails and two passes one angle below the failing) testing was completed.
Finally, participants were asked to score, from 1–10 their final perception of slipperiness (1 = very slippery, 10 = not at all slippery), footwear warmth (1 = not at all comfortable, 10 = very comfortable), fit (1 = not at all comfortable, 10 = very comfortable), footwear heaviness (1 = very heavy, 10 = not at all heavy), ease of putting on and taking off the footwear (1 = not at all easy, 10 = very easy), overall rating of the footwear (1 = not at all good, 10 = very good) and how often the participant would use this footwear in winter (1 = not at all, 10 = very often). Participants were asked to test four types of footwear during each testing session which lasted approximately one hour.
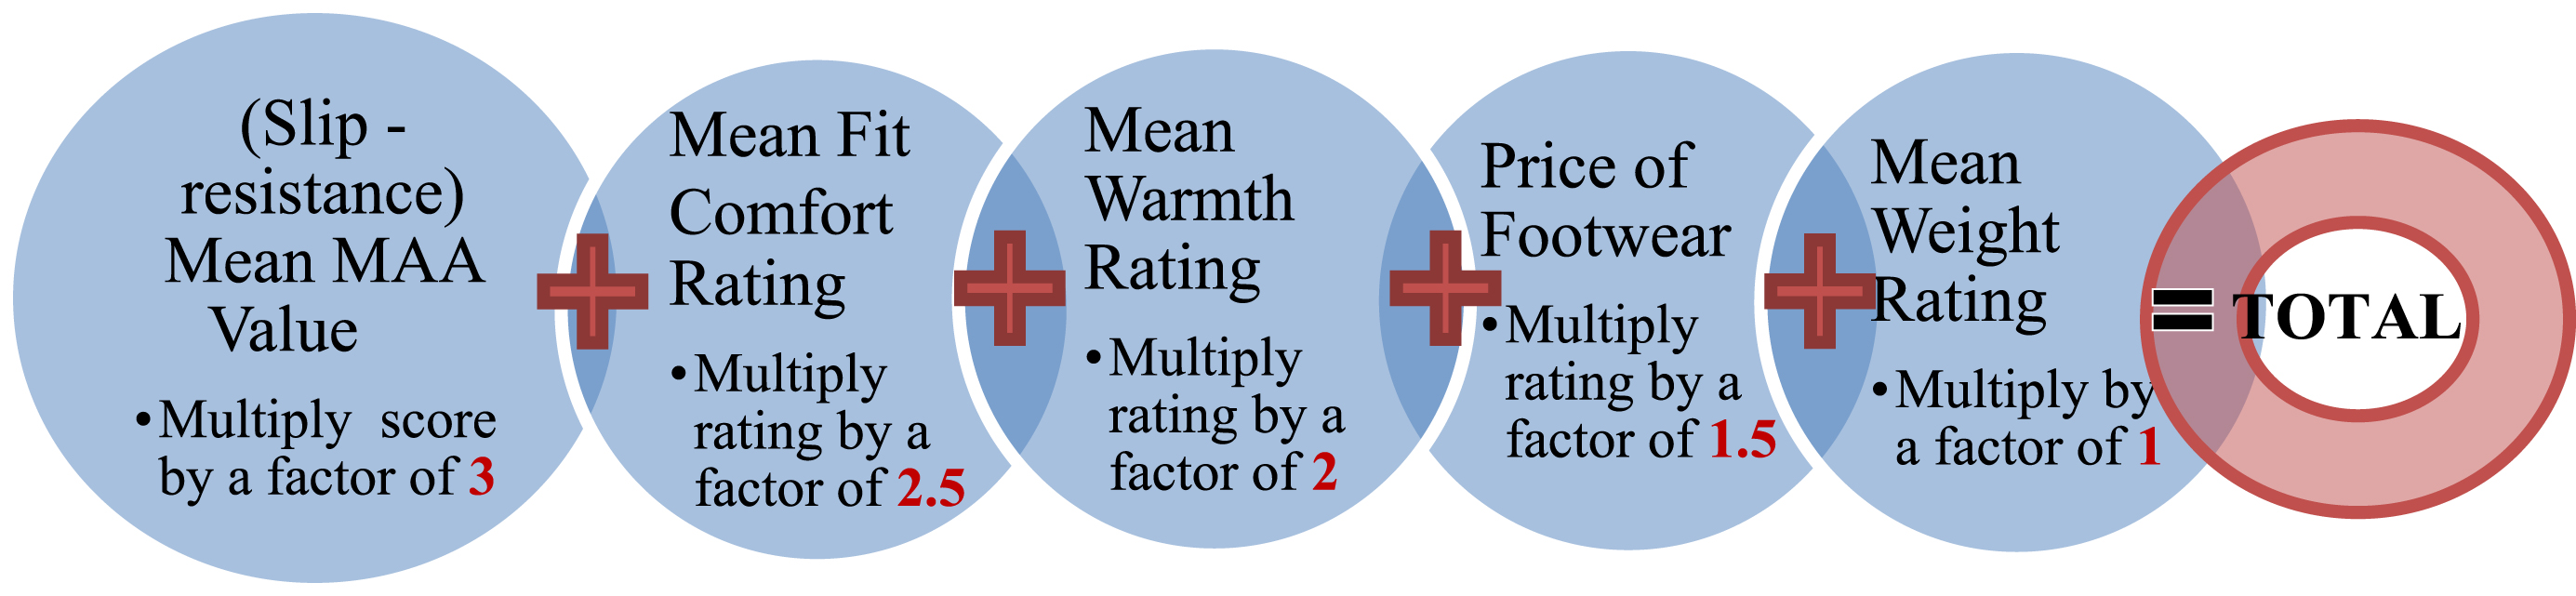
2.4Developing a decision matrix
Based on the results of our previous work, we believe several factors need to be taken into account for a successful selection of winter footwear among all the available options in the market. In order to systematically evaluate and prioritize a list of available options for municipal workers, we developed a decision matrix that evaluates each pair of tested footwear against a list of weighted criteria (i.e. slip-resistance, comfort, weight, cost and etc.) based on their level of importance derived from our survey of 677 PSWs who also spend a considerable amount of time outdoors while travelling to care for their clients in the community [7]. Our previous study of PSW footwear needs found that factors including comfort (83%), slip-resistance (80%), warmth (74%), cost (52%) and weight of the shoes (34%) were the most important features. These results were used to establish weighted criteria for our decision matrix in the current study, assuming municipal workers would have similar preferences as PSWs. We recognize this assumption may not hold for all factors as the demographics of these two worker groups are quite different. Despite this caveat we felt there was value in utilizing these results to assign relative weights to these factors in order to create an overall rating for each footwear model. The relative weights assigned were: 3 for slip-resistance (mean MAA values were used), 2.5 for comfort, 2 for warmth, 1.5 for cost and 1 for weight of the shoe (Fig. 3). Although slip-resistance is slightly less important than comfort (80% vs. 83%) based on our previous survey results [7], we assign more weight to slip-resistance compared to comfort because of its importance for ensuring safety and reducing slip-and-fall incidents.
Fig.3
Decision Matrix Flowchart. The decision matrix represents the most important factors associated with winter footwear selection as per survey results. The scoring system for the decision matrix ranges from 1 to 3 (in 0.5 increments for each factor). Factors include weight of the shoe, price, warmth, fit comfort and slip-resistance of the footwear ranging from least important factor to most important, respectively.
In order to keep the rating scale consistent for all the criteria, we have created a price rating system to award scores to footwear that matches our consumers’ needs. Our previous survey results [7] indicated that PSWs were happy to spend up to $120 for their winter footwear. Therefore, our price rating system consists of a scale rating from 1 to 10 whereas score of 10 is awarded to footwear that is priced up to $120 (before taxes) and one point is deducted for each $20 price increment beyond this. Thus footwear that costs within the range of $280–$300 has a score of 1.
2.5Statistical analysis
Correlation analyses were performed between MAA scores and wearability criteria. Pearson correlation (r) was used to analyze individual relationship. Correlations were described as very weak (0 < 0.20), weak (0.2 < 0.39), moderate (0.40 < 0.59), strong (0.6 < 0.79) or very strong (0.80-1) [18], and were considered statistically significant when p≤0.05.
3Results
3.1MAA test results
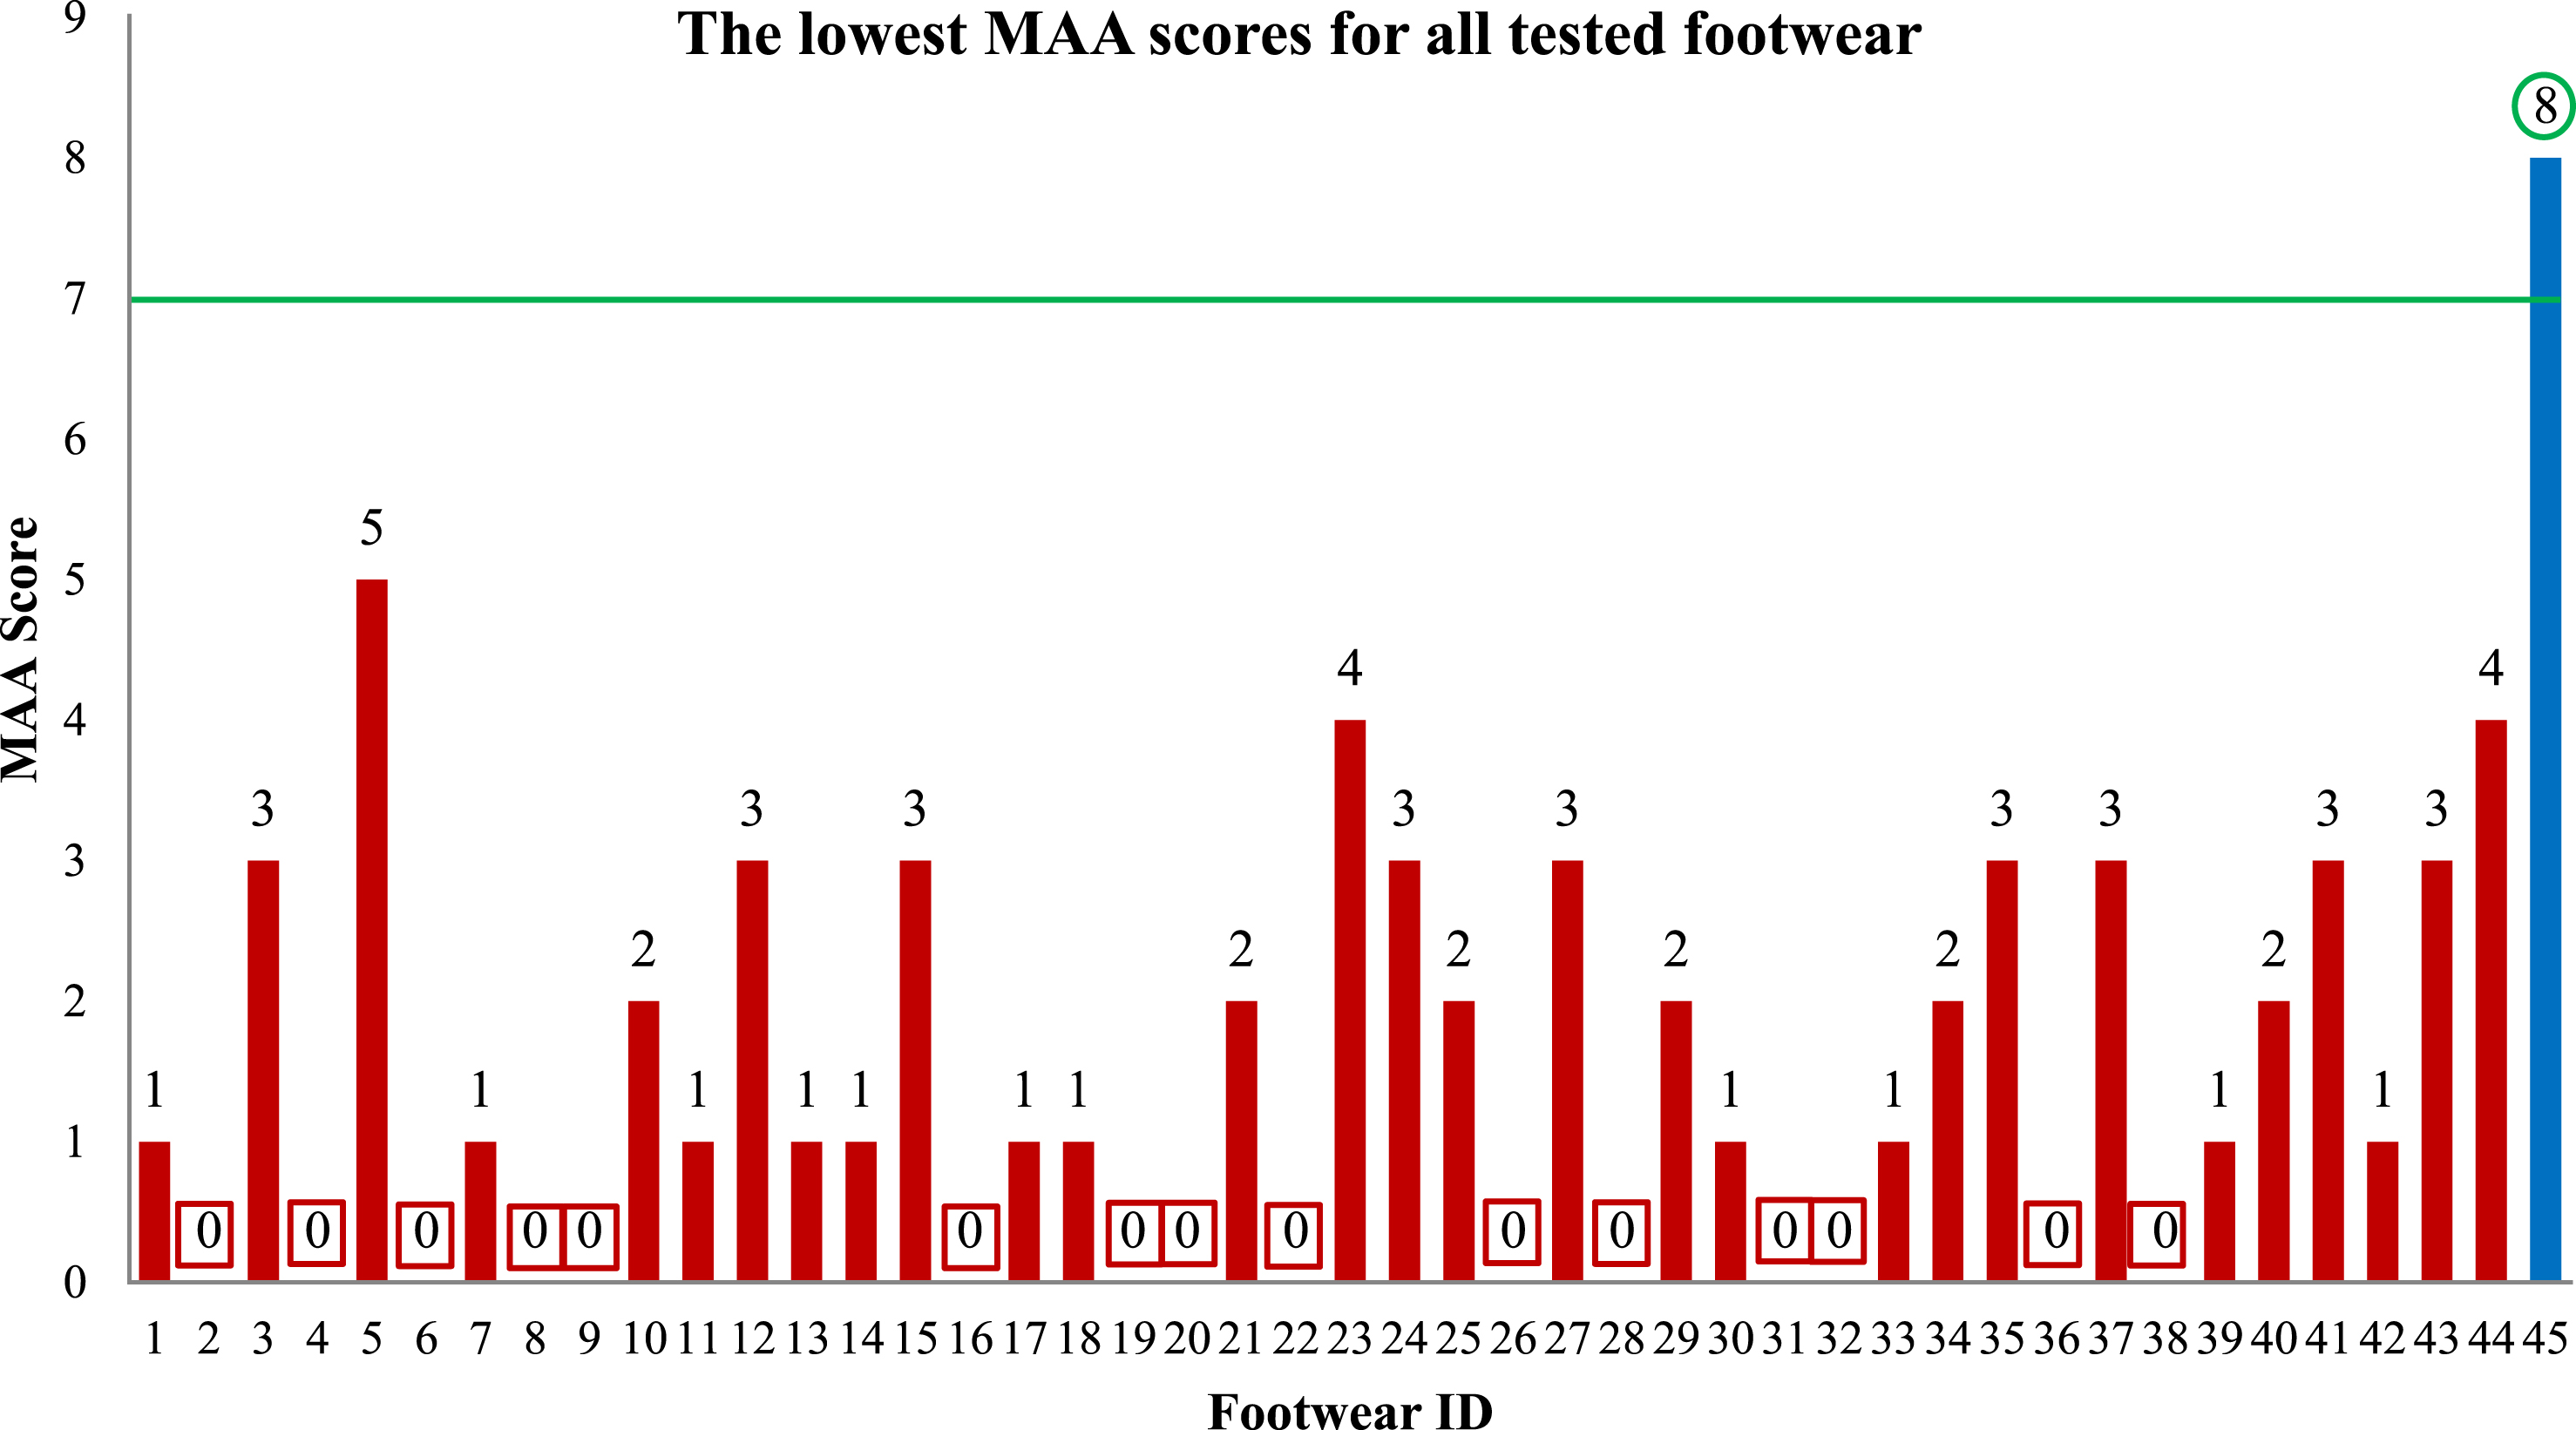
Figure 4 shows the MAA scores calculated by finding the minimum angle that all participants were able to achieve across all conditions (uphill, downhill, melting ice and bare ice). Of the 45 types of footwear, the best performing footwear type (Wolverine, Glacier CSA Waterproof 19303) achieved an MAA score of 8. The remaining 44 footwear models had MAA scores below our threshold value of 7 and therefore are not recommended for outdoor workers.
Fig.4
Maximum Achievable Angle (MAA) scores for the test footwear. The lowest MAA score (between uphill and downhill) is shown.
Mean MAA results were also calculated and are reported in (Table 2) for descriptive statistics to allow us to develop a decision matrix and correlation analysis in sections 3.2 and 3.3. The mean MAA value is calculated by taking the mean of the four conditions (bare ice/uphill, bare ice/downhill, melting ice/uphill, and melting ice/downhill) for each participant and taking the minimum MAA value across all four participants. Table 2 also summarizes each participant’s perception of slipperiness, thermal and fit comfort and heaviness for each tested pair. For participants’ perception of wearability of the footwear, the mean of the perception ratings for both conditions and all four participants were calculated.
Table 2
Mean MAA values and perception ratings of all footwear models tested
| ID | Mean MAA±SD | Fit Comfort | Warmth | MSRP | Weight | Overall |
| 1 | 1.8°±0.8° | 4.1±1.4 | 3.3±2.1 | $129.95 | 5.4±1.2 | 4.0±1.4 |
| 2 | 0.8°±0.4° | 5.6±2.2 | 2.8±1.8 | $139.95 | 7.0±2.0 | 3.9±1.3 |
| 3 | 3.3°±0.4° | 5.0±1.1 | 3.8±2.1 | $139.95 | 6.1±1.3 | 4.4±0.7 |
| 4 | 0°±0° | 4.4±1.8 | 2.4±1.6 | $139.95 | 4.9±1.3 | 3.1±1.2 |
| 5 | 6.8°±1.1° | 5.5±1.2 | 5.3±2.0 | $129.95 | 6.1±1.9 | 6.5±1.0 |
| 6 | 1.8°±1.3° | 6.3±2.5 | 6.0±2.0 | $199.95 | 8.3±1.0 | 5.8±1.8 |
| 7 | 2.0°±0.7° | 6.6±1.7 | 6.8±1.5 | $129.95 | 7.4±1.5 | 6.0±0.9 |
| 8 | 1.5°±1.1° | 5.5±2.2 | 6.0±1.9 | $139.95 | 6.5±1.7 | 4.6±1.1 |
| 9 | 1.0°±0.7° | 6.1±1.5 | 5.8±1.6 | $129.95 | 7.0±1.8 | 4.5±1.9 |
| 10 | 3.0°±0° | 7.6±1.0 | 8.0±0.7 | $294.95 | 6.8±1.7 | 6.4±1.2 |
| 11 | 2.8°±1.1° | 6.3±1.7 | 8.6±1.0 | $129.95 | 6.6±1.4 | 5.8±1.1 |
| 12 | 3.5°±0.5° | 5.6±1.8 | 6.0±1.7 | $119.95 | 8.1±1.2 | 5.9±0.8 |
| 13 | 2.0°±1.0° | 5.5±1.2 | 5.1±2.3 | $129.95 | 7.1±1.3 | 4.3±0.8 |
| 14 | 1.5°±0.5° | 6.1±2.6 | 4.6±2.4 | $139.95 | 7.9±1.6 | 5.3±0.7 |
| 15 | 3.3°±0.4° | 6.9±1.6 | 7.0±1.4 | $129.95 | 7.8±0.8 | 5.5±1.0 |
| 16 | 1.5°±0.9° | 7.9±0.9 | 7.8±1.0 | $244.95 | 7.1±0.7 | 5.8±1.9 |
| 17 | 1.5°±0.5° | 3.8±2.5 | 5.1±2.0 | $159.95 | 6.1±1.8 | 3.6±1.2 |
| 18 | 4°±0.5° | 6.1±1.6 | 5.6±1.8 | $159.95 | 7.0±1.1 | 5.8±1.0 |
| 19 | 1.0°±0.7° | 6.1±2.0 | 5.5±2.1 | $139.95 | 8.4±1.4 | 5.1±1.5 |
| 20 | 1.3°±0.8° | 5.1±1.4 | 5.1±2.3 | $129.95 | 6.6±1.0 | 3.5±1.6 |
| 21 | 2.3°±0.4° | 4.9±1.7 | 4.5±1.9 | $119.95 | 8.4±1.0 | 4.5±1.6 |
| 22 | 0.8°±0.4° | 4.9±1.6 | 4.5±2.2 | $129.95 | 8.3±1.9 | 4.0±0.7 |
| 23 | 4.5°±0.5° | 6.3±1.4 | 6.0±1.3 | $159.95 | 7.3±1.3 | 5.5±1.1 |
| 24 | 3.5°±0.5° | 6.3±0.7 | 6.3±1.5 | $169.95 | 7.1±0.9 | 5.6±0.9 |
| 25 | 2.5°±0.9° | 5.9±1.7 | 5.6±1.7 | $139.95 | 8.1±1.3 | 5.5±1.0 |
| 26 | 0.8°±0.4° | 6.5±1.1 | 5.0±1.6 | $149.95 | 8.3±1.4 | 4.6±1.3 |
| 27 | 3.8°±0.4° | 7.3±1.6 | 5.1±2.0 | $139.95 | 8.6±1.4 | 5.6±1.2 |
| 28 | 1.0°±0.7° | 5.5±2.5 | 4.4±2.1 | $144.95 | 7.8±2.3 | 4.0±1.7 |
| 29 | 3.3°±0.8° | 6.3±1.9 | 6.3±1.7 | $109.95 | 8.0±1.1 | 5.8±1.4 |
| 30 | 2.8°±1.1° | 6.6±1.4 | 6.6±1.2 | $199.95 | 7.4±1.2 | 5.4±0.9 |
| 31 | 3.5°±2.1° | 5.5±1.6 | 6.4±19 | $184.95 | 7.6±0.9 | 5.5±1.5 |
| 32 | 1.3°±0.8° | 7.5±1.7 | 4.6±1.8 | $149.95 | 8.4±1.3 | 4.6±1.1 |
| 33 | 3.0°±1.2° | 7.4±1.4 | 7.5±0.9 | $289.95 | 7.6±0.7 | 5.8±1.3 |
| 34 | 3.5°±1.5° | 5.3±1.6 | 6.5±1.7 | $199.95 | 7.9±1.3 | 4.9±1.3 |
| 35 | 5.3°±1.3° | 5.0±2.4 | 5.4±1.8 | $129.95 | 9.0±1.0 | 5.3±0.8 |
| 36 | 0.3°±0.4° | 5.4±1.5 | 5.4±1.9 | $119.95 | 7.6±1.6 | 2.5±0.9 |
| 37 | 4.3°±0.8° | 4.9±2.2 | 5.8±2.1 | $184.95 | 7.9±1.5 | 4.5±1.0 |
| 38 | 1.8°±1.3° | 5.3±2.0 | 5.4±1.8 | $154.95 | 8.3±1.3 | 3.4±1.3 |
| 39 | 2.0°±0.7° | 6.1±1.5 | 5.5±2.1 | $129.95 | 8.5±1.1 | 4.8±0.7 |
| 40 | 4.3°±1.5° | 7.0±1.2 | 7.3±1.8 | $219.95 | 6.8±1.4 | 6.1±0.9 |
| 41 | 4.3°±0.8° | 5.9±1.5 | 6.0±1.4 | $239.95 | 7.1±0.8 | 5.5±0.7 |
| 42 | 2.3°±0.8° | 5.1±2.5 | 6.3±1.6 | $329.95 | 6.1±1.2 | 4.9±1.2 |
| 43 | 3.8°±0.8° | 5.8±1.6 | 6.0±1.9 | $159.95 | 7.3±1.2 | 4.9±0.8 |
| 44 | 5.3°±0.8° | 6.6±2.0 | 7.3±1.5 | $169.95 | 7.1±1.5 | 5.1±1.7 |
| 45 | 8.5°±0.5° | 8.0±0.9 | 7.9±0.8 | $279.95 | 7.5±0.7 | 7.9±0.9 |
MSRP: represents the manufacture suggested retail price.
3.2Decision matrix
Table 3 displays the decision matrix for the six best performing types of footwear according to the mean MAA values. Results for slip-resistance (mean MAA values), comfort, warmth, cost and weight of the footwear for the six most slip-resistant pairs were used for this purpose. Footwear was evaluated, using a scale from 1–10, against the aforementioned criteria, each at the specific relative weight discussed in section 2.5. Each rating was multiplied by the relative weight for that criterion and the scores were added across the rows to obtain a total for each option. The best performing footwear achieved a total score of 71.8 which is the highest score amongst the six best performing types of footwear according to the rating system (Table 3). This footwear was Wolverine- Glacier CSA Waterproof 19303, which has Vibram Arctic Grip outsoles. This footwear was rated as the best for both comfort (8) and warmth (7.9) as well as second best for weight (7.5). However, this footwear was rated as the worst for cost with respect to other best performing footwear as it was rather expensive (∼$250) placing it out of reach of many consumers.
Table 3
Decision matrix point system for the six best performing footwear tested in terms of MAA and their associated comfort, warmth, cost and weight ratings
| ID | Mean MAA (×3) | Comfort (×2.5) | Warmth (×2) | Cost (×1.5) | Weight (×1) | Total |
| 45 | 8.5⟶25.5 | 8.0⟶20.0 | 7.9⟶15.8 | 2⟶3 | 7.5⟶7.5 | 71.8 |
| 5 | 6.8⟶20.4 | 5.5⟶13.8 | 5.3⟶10.6 | 9⟶13.5 | 6.1⟶6.1 | 64.4 |
| 44 | 5.3⟶15.9 | 6.6⟶16.5 | 7.3⟶14.6 | 7⟶10.5 | 7.1⟶7.1 | 64.6 |
| 35 | 5.3⟶15.9 | 5.0⟶12.5 | 5.4⟶10.8 | 9⟶13.5 | 9.0⟶9.0 | 61.7 |
| 23 | 4.5⟶13.5 | 6.3⟶15.8 | 6.0⟶12.0 | 8⟶12 | 7.3⟶7.3 | 60.6 |
| 18 | 4.5⟶13.5 | 6.1⟶15.3 | 5.6⟶11.2 | 8⟶12 | 7.0⟶7.0 | 59.0 |
The values were multiplied by the relative weight assigned to the factor as per the decision matrix. The weighted values were added together for a total score for the particular type of footwear.
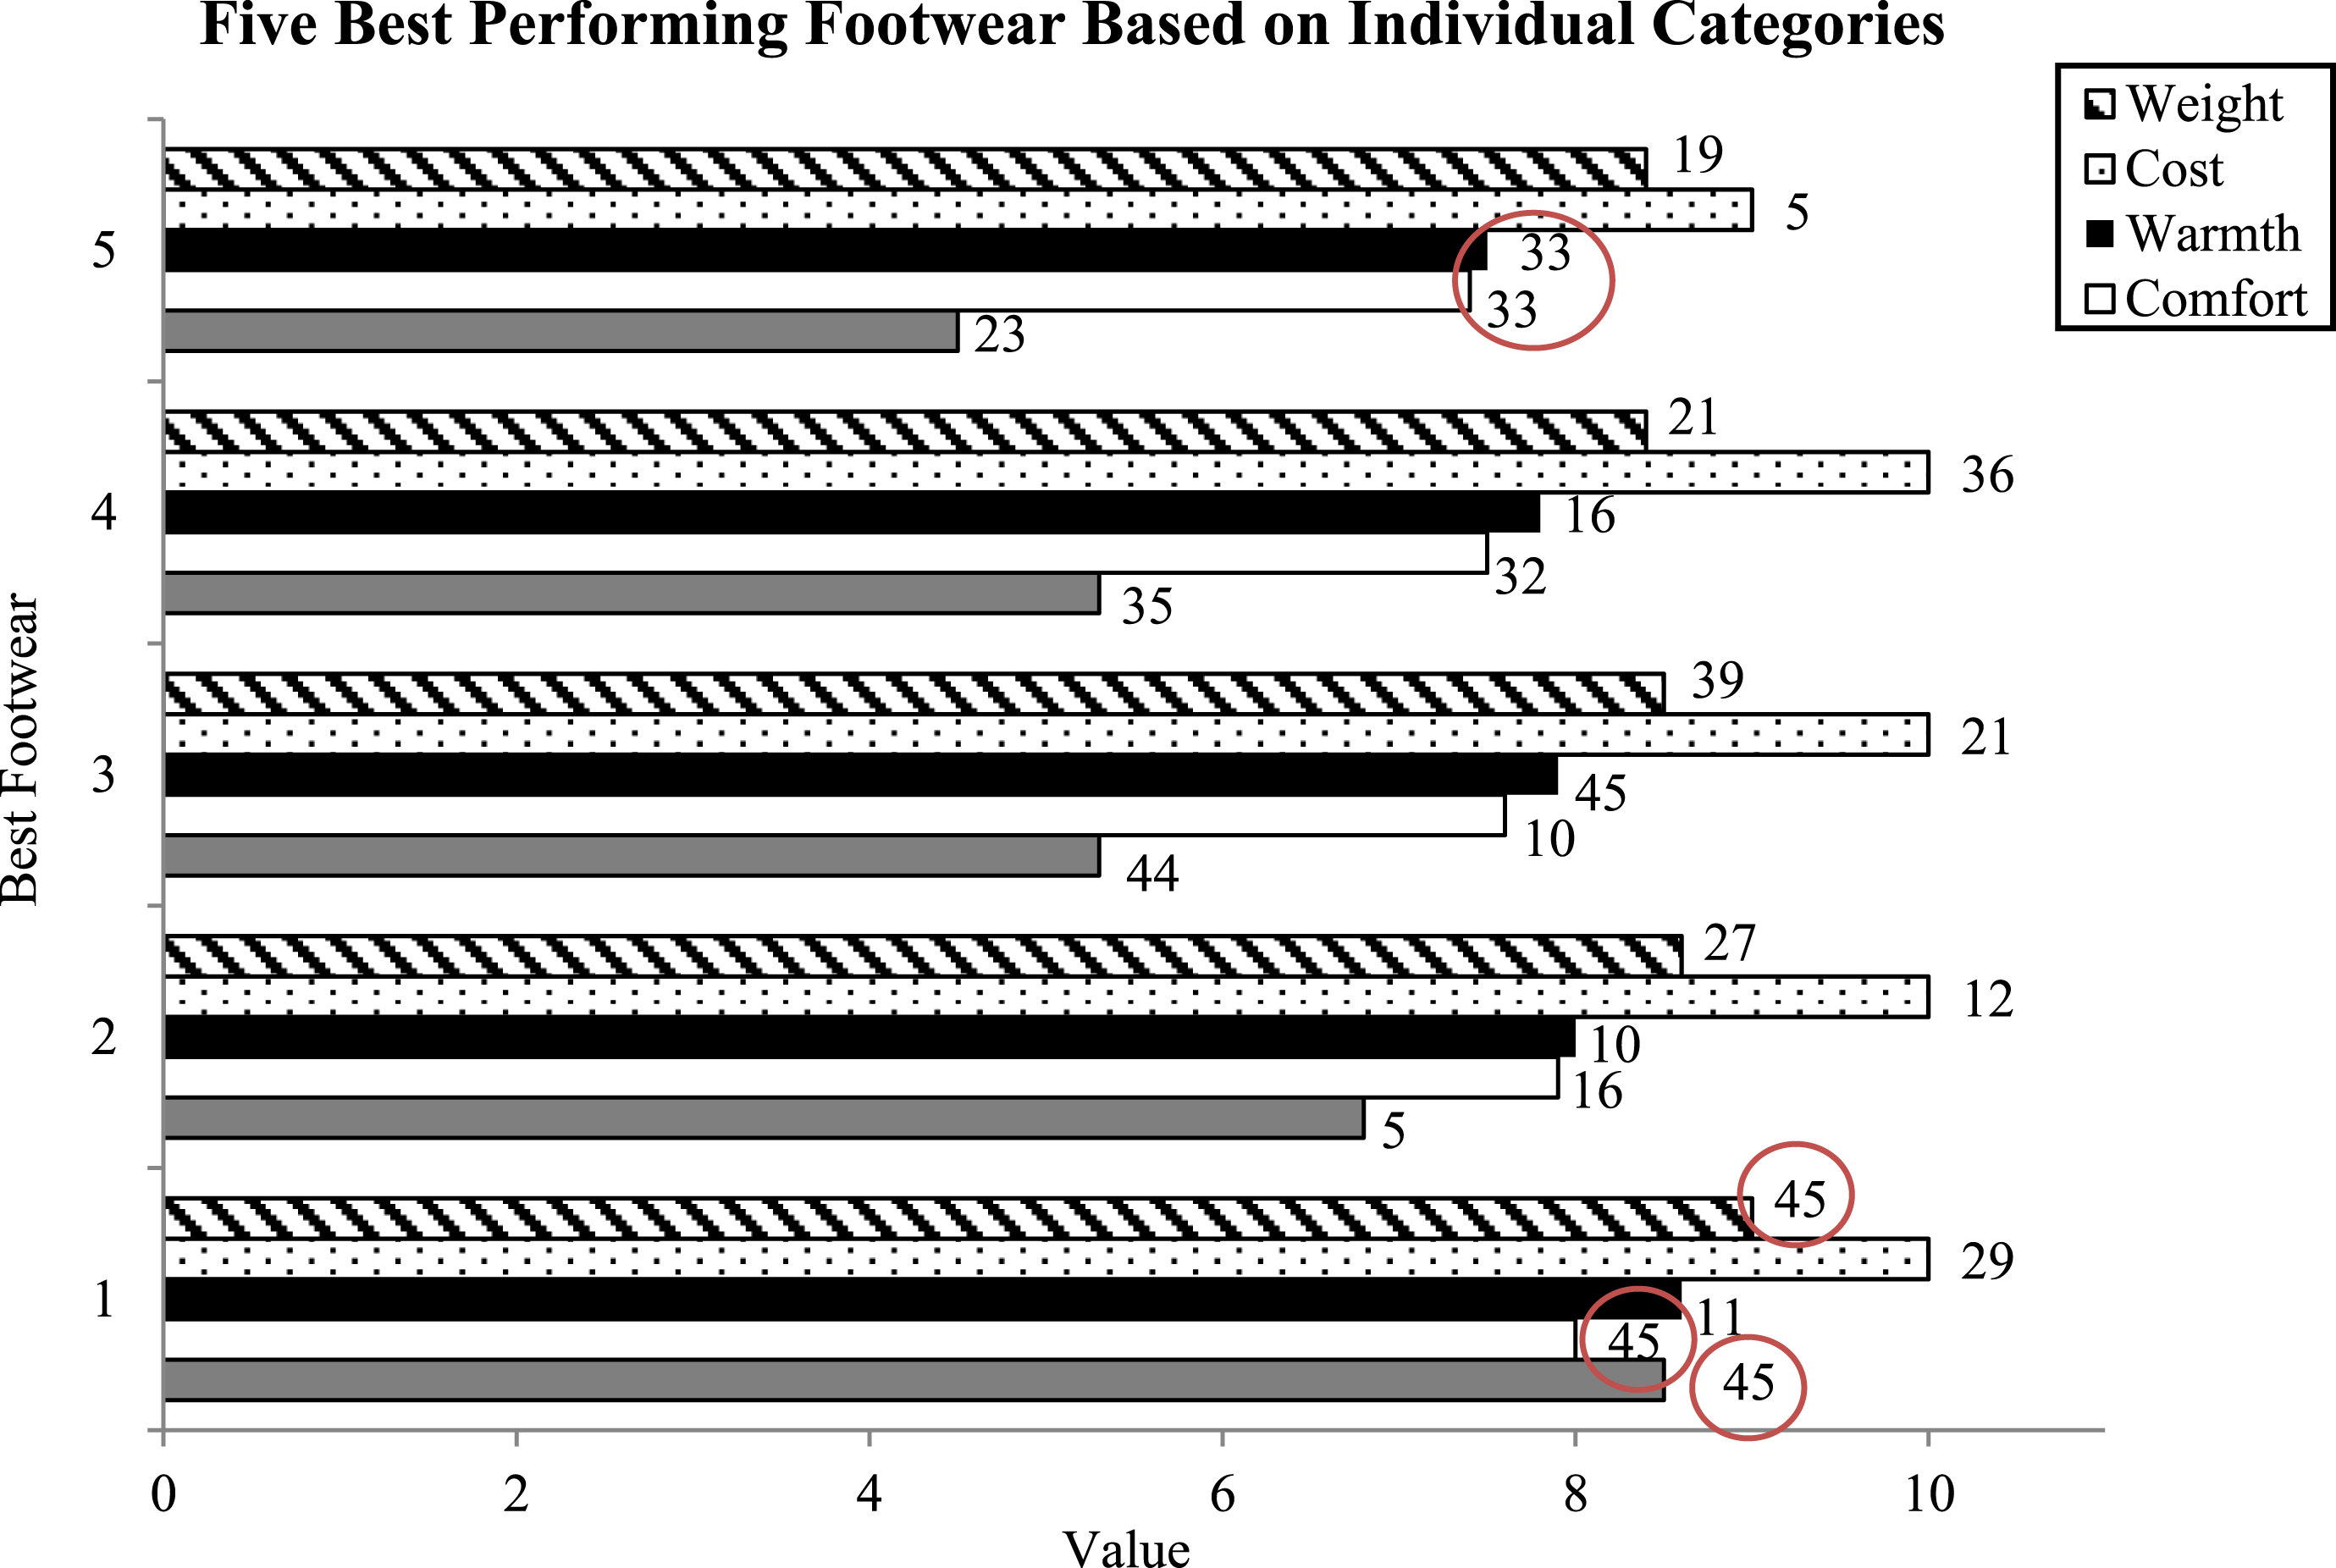
Figure 5 demonstrates the bar chart for the best performing footwear based on each rating category. The scale is from 1–5 (number 1 being the best type of footwear, number 5 represents the fifth best type of footwear). The five best performing footwear models were selected for each individual category. For instance, the top five footwear models in terms of comfort is shown in the graph in a ranking from first to fifth best. Similarly, the five best footwear models for each of the other categories (warmth, weight, cost, MAA) were also plotted. As it is evident from the graph, the slip resistance, comfort, warmth, cost and weight of walking vary among the five types of footwear, indicating that they are not properly integrated in the footwear tested. No one type of footwear met all protection and wearability needs. Footwear ID 45, for instance, was the lightest, the most slip-resistant and the most comfortable one, but it did not provide adequate thermal insulation.
Fig.5
The bar chart for the best performing footwear based on each rating category. The data labels represent the footwear IDs for each level of performing footwear. The IDs that matched for the best-performing footwear for each category are circled.
3.3Correlation analysis
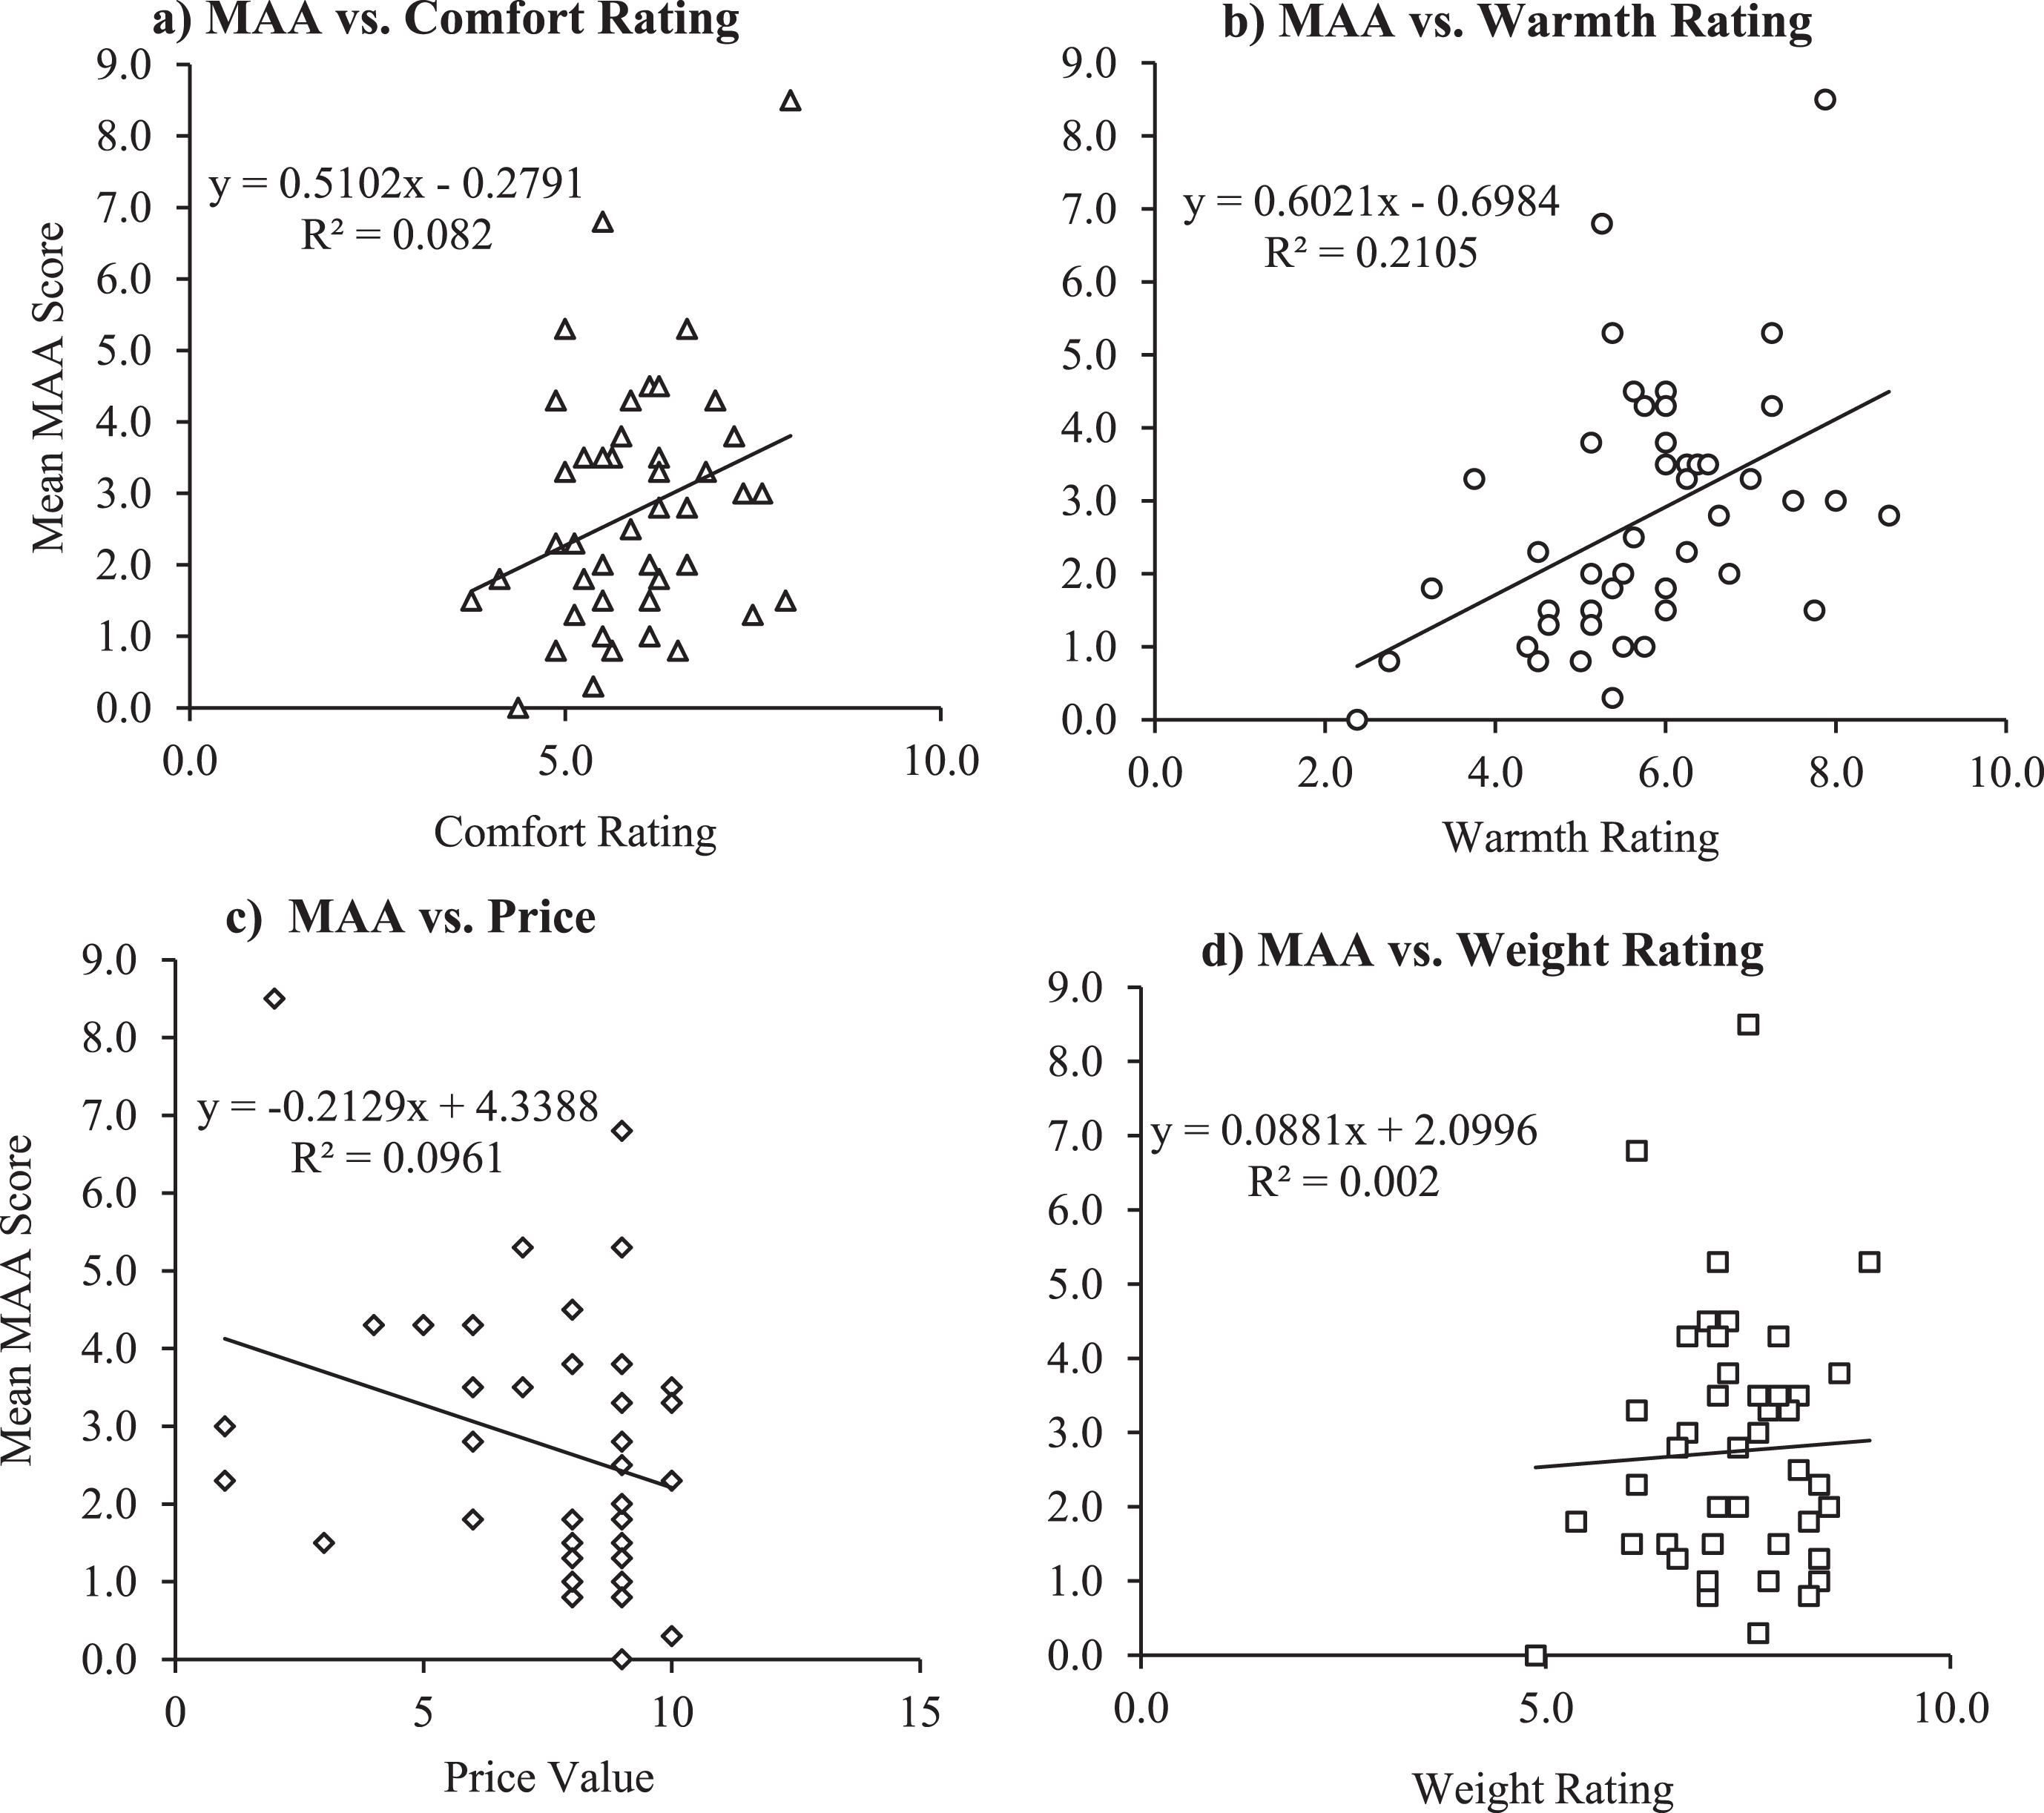
The correlation graph between the mean MAA values and the factors affecting wearability of safety footwear for city workers are depicted in Fig. 6. The graphs show the correlation between mean MAA values (slip-resistance) and the mean for the rest of the factor ratings for all forty five types of footwear. No correlations were found between MAA score and comfort (R2 = 0.082, p < 0.0001), MAA score and warmth (R2 = 0.21, p = 0.002), MAA score and price (R2 = 0.09, p < 0.0001) as well as MAA score and weight (R2 = 0.002, p < 0.0001). The results of this assessment suggest that slip-resistance, thermal insulation and wearability are not concurrently incorporated in the footwear tested.
Fig.6
Correlation graphs of MAA vs each individual factor. The lowest mean MAA amongst four mean values (mean value of uphill, downhill for both conditions separately) was recorded and plotted. The average of all the ratings/factors for all forty five types of footwear were recorded and plotted in all four graphs above, respectively.
4Discussion
Outdoor workers exposed to icy walkways in the winter are at high risk of injury due to slipping and require footwear that is slip-resistant alongside other safety and ergonomic features. This study assesses the integration of slip-resistance, thermal insulation and wearability of some safety footwear available to municipal workers with the aim to identify footwear styles that incorporate all these features. Our findings demonstrate that footwear manufacturers have the opportunity to improve their footwear by incorporating more of the factors that their users look for. Our results have also shown that footwear performance may change between the same models from one year to the next year. Thus, we recommend checking www.ratemytreads.com for the most up to date ratings.
Slip-resistance of footwear plays an important role in the prevention of slips and falls by providing traction to prevent balance loss. An alternative method for providing traction on ice is with metallic cleats embedded into footwear outsoles to dig into snow and ice surfaces [13]. However, a growing body of evidence on metallic cleats shows that the public dislike them because they force changes in gait patterns. In addition, outsoles with built-in spikes and cleats become hazardous in the transition from outdoor to indoor environments and therefore may not be appropriate. In our experience, these cleats become very slippery when worn on wet hard surfaces like tarrazo, marble, or ceramic tile floors.
The best performing footwear in the current study (footwear ID 45) achieved an MAA score of 8. This is just above the minimum standards for slip resistance performance, which is defined as the ability to maintain traction while walking up and down on a seven-degree incline. Thus, a user wearing this footwear will be less likely to slip on an unexpected patch of ice on a level surface or on slopes. However, there is still a need to develop footwear with improved slip-resistance performance that could achieve MAA scores above 7 degrees, as snow and/or ice buildup can increase the effective slope on walk ways and dynamic conditions such as the need for sudden starts, stops or turns would still likely cause footwear with MAA score of 7 degrees or higher to lose traction in everyday conditions.
Aside from preventing slip and fall incidents, outdoor workers in cold climates rely on footwear to protect them from impact injuries and cold exposure. It is a challenge to designers and manufacturers to satisfy the three protective demands, while maintaining the wearability needs for outdoor worker [17]. For instance, thermal insulation and steel toe caps can provide protection from impact injuries and exposure to cold climates, yet make footwear heavy and less wearable. This is also evident from the current results as there was no single footwear type that met all protection and wearability needs. Users generally disregard the use of protective footwear or devices when their perception of discomfort outweighs the risk of fall-related injuries, resulting in the loss of all intended protection [18]. This means that the most slip-resistant footwear (higher MAA scores) might be passed over by workers if they do not fulfill other requirements for this work force. As a consequence, the full benefits of slip-resistant footwear are not being realized if other wearability factors are lacking. Similar observations have been reported in the literature. For instance, Gao et al. reported that anti-slip property were ranked lower with respect to thermal insulation by military employees because they are exposed to cold environments for longer periods [19].
One limitation of this study is that we assumed municipal workers would have same preferences as PSWs when selecting their work footwear during winter season. This might not be the case as different work forces might have different preferences in selecting their footwear. For instance, municipal workers in Toronto have their footwear purchases subsidized if done through the approved supplier (Mr Safety Shoes), while PSWs are normally responsible for purchasing their own footwear. Therefore, price could well be a less important factor for municipal workers.
In addition, municipal workers including firefighters, paramedics, solid waste collectors, power and water workers are exposed to more dangerous conditions that require protection from impact, flame, heat and chemicals, which makes the footwear heavy and less wearable. It is common to see that protection is achieved at the expense of losing wearability or vice versa. Thus, this work force may accept footwear that is less comfortable footwear compared to PSWs. Although these safety and ergonomic features could be ranked differently by municipal workers, the final outcome of this investigation would likely be similar since our general finding is that there was no one type of footwear that meets all protection and wearability needs simultaneously. The results of this study demonstrate that footwear manufacturers could take on leadership positions in the market and differentiate themselves from their competitors by designing products that score well on all factors that workers look for including slip-resistance.
Finally, we have adjusted our MAA testing protocol based on the results of this study. Since the MAA score is based on taking the minimum angle across all participants, it is unnecessary to test with multiple participants once the first participant demonstrates poor performance. Only footwear that scores 5 degrees or higher with the first participant will go on to further testing with four participants. This change will substantially reduce the cost of future testing allowing us to testing larger numbers of footwear overall. We applied this updated protocol in our companion paper which discusses the best footwear options for PSWs [7].
5Conclusion
Only one of the 45 models of work footwear tested in this study possessed reasonable slip-resistance. Ongoing study is underway to evaluate how often the best performing footwear needs to be replaced to maintain its slip-resistance on ice. Safety footwear manufacturers have an opportunity to differentiate themselves from their competitors if they invest in improving the slip-resistance of their products as there are currently few models that perform well available to outdoor municipal workers and other workers like them. Similarly, investment into improving wearability of safety footwear for use in the winter season is warranted.
Conflict of interest
None to report.
References
[1] | World Health Organization. Falls WHO Media centre August 2017 [Available from: http://www.who.int/mediacentre/factsheets/fs344/en/. |
[2] | Gronqvist R , Abeysekera J , Gard G , Hsiang SM , Leamon TB , Newman DJ , et al. Human-centred approaches in slipperiness measurement. Ergonomics. (2001) ;44: (13):1167–99. |
[3] | Gronqvist R , Hirvonen M . Slip resistance of winter shoes. In: Proceedings of quality and usage of protective clothing. (1992) , pp. 123–9. |
[4] | Gronqvist R , Chang WR , Courtney TK , Leamon TB , Redfern MS , Strandberg L . Measurement of slipperiness: Fundamental concepts and definitions. Ergonomics. (2001) ;44: (13):1102–17. |
[5] | Bowden FP , Hughes TP . The Mechanism of Sliding on Ice and Snow. Proceedings of the Royal Society of London Series A, Mathematical and Physical Sciences. (1939) ;172: (949):280–98. |
[6] | Toronto Public Health. Staff report for action on preventing injuries from wintertime slips and falls in Toronto, (2016) . |
[7] | Bagheri ZS , Patel N , Li Y , Rizzi K , Lui KYG , Holyoke P , Fernie G , Dutta T . Selecting slip-resistant footwear for personal support workers to use outdoors in winter, WORK Accepted (2018) . |
[8] | Verma SK , Chang WR , Courtney TK , Lombardi DA , Huang YH , Brennan MJ , et al. A prospective study of floor surface, shoes, floor cleaning and slipping in US limited-service restaurant workers. Occupational and environmental medicine. (2011) ;68: (4):279–85. |
[9] | Staal C , White B , Brasser B , LeForge L , Dlouhy A , Gabier J . Reducing employee slips, trips, and falls during employee-assisted patient activities. Rehabilitation nursing: The Official journal of the Association of Rehabilitation Nurses. (2004) ;29: (6):211–4, 30; discussion 4. |
[10] | Smith PM . Workplace climate, employee actions, work injury and structural equation modelling. Occupational and Environmental Medicine. (2015) ;72: (7):465–6. |
[11] | Swedler DI , Verma SK , Huang Y-H , Lombardi DA , Chang W-R , Brennan M , et al. A structural equation modelling approach examining the pathways between safety climate, behaviour performance and workplace slipping. Occupational and environmental medicine, (2015) . |
[12] | Gao C , Abeysekera J . A systems perspective of slip and fall accidents on icy and snowy surfaces. Ergonomics. (2004) ;47: (5):573–98. |
[13] | Gard G , Berggård G . Assessment of anti-slip devices from healthy individuals in different ages walking on slippery surfaces. Applied Ergonomics. (2006) ;37: (2):177–86. |
[14] | Grönqvist R , Hirvonen M . Slipperiness of footwear and mechanisms of walking friction on icy surfaces. International Journal of Industrial Ergonomics. (1995) ;16: (3):191–200. |
[15] | Government of Ontario. Accessibility for Ontarians with Disabilities Act (AODA), (2016) . |
[16] | Bergquist K , Abeysekera J , editors. Ergonomic aspects of safety shoes worn in the cold climate. Proceedings of the 3rd Pan-Pacific Conference on Occupational Ergonomics. Seoul, Korea, (1994) a. |
[17] | Abeysekera J , editor. Diversified design needs of personal protective devices and clothing in cold climate: An Example in the design needs of protective outdoors winter shoes. Proceedings of NOKOBETEF 6 and 1st European Conference on Protective Clothing. Stockholm, Sweden, (2000) . |
[18] | Gao C , Abeysekera J . The assessment of the integration of slip resistance, thermal insulation and wearability of footwear on icy surfaces. Safety Science. (2002) ;40: (7):613–24. |
[19] | Gao C , Holmer I , Abeysekera J . Slips and falls in a cold climate: Underfoot surface, footwear design and worker preferences for preventive measures. Applied Ergonomics. (2008) ;39: (3):385–91. |

