
An experimental study of pulse wave measurements with magnetic induction phase shift method
Abstract
BACKGROUND:
Pulse wave monitoring is widely used to evaluate the physiological and pathological states of the cardiovascular system.
OBJECTIVE:
High-sensitivity ring sensors were designed, and a simultaneous acquisition platform based on National Instruments T-Clock technology (NI-TCLK) was used to achieve simultaneous pulse detection using both the traditional method and the magnetic induction phase shift (MIPS) method.
METHODS:
The excitation signal had a frequency of approximately 10.7 MHz and power of about 20 dBm. A total of 30 volunteers (adults, aged 20–30 y) were selected to corroborate the feasibility of our measurement system. The subjects wore the proposed sensor on their right-hand forefingers and for reference, the piezoelectric pulse sensor on the left-hand forefinger. The pulse waves of these 30 subjects were measured over 2 min each.
RESULTS:
The phase shift of the magnetic induction detection signal ranged from 0.6–0.8 degrees. Comparison of detection results for the same subject between the two methods showed that the pulse rate measured by magnetic induction exhibited fewer deviations and better stability than the traditional method. In addition, spectral analysis indicated that the pulse frequencies obtained using the 2 methods were concentrated between 1–3 Hz and were regular in the 1.5 Hz frequency region.
CONCLUSIONS:
These results prove that the magnetic induction pulse wave can be used to accurately measure pulse wave features.
1.Introduction
The Reports on Cardiovascular Diseases 2015 in China indicates that cardiovascular disease (CVD) is still among the leading causes of mortality, with 2 in every 5 deaths attributed to it [1]. Therefore, diagnosis and prevention of CVD is an urgent problem in China. Clinical studies show that the waveform of the pulse wave signal, which is induced by the periodic systole and diastole of the heart, is one of the early responses to changes in cardiovascular hemodynamic parameters [2]. In 2014, Ben-Shlomo found that aortic pulse wave velocity could improve the identification of high-risk populations [3]. The change in pulse wave characteristics, such as pulse wave velocity, is widely used as a noninvasive marker to evaluate arterial stiffness [4]. In 2015, Yu et al. proposed a method of estimating heart rate (HR) that is applicable for ordinary cameras subject to natural head movement or facial expression. The proposed method features region-of-interest (ROI) detection via facial feature detection and tracking, target signal extraction by independent component analysis in the RGB channels, and HR estimation via a real-valued iterative adaptive approach [5]. In 2016, Kusuma et al. designed a device for arrhythmia detection on the basis of the fingertip pulse sensor and overall system testing for 10 respondents whose results had an average precision of 77.25% [6]. The major classes of fingertip pulse detection sensors include piezoelectric pulse sensors, semiconductor pressure sensors, and fiber optic pulse sensors. Piezoelectric sensors feature high sensitivity and the ability to perform long-term continuous detection; however, they exhibit poor anti-interference capacity and low stability [7]. Semiconductor strain gauge sensors feature high sensitivity and low transverse sensitivity, but these sensors require high adhesion between the sheets and the sensor, and the adhesion quality can affect the precision [9]. Fiber optic pulse sensors feature high sensitivity, high accuracy, small size, and tolerance of high electromagnetic interference; however, they are susceptible to interference from environmental noise and polarization fading [11]. Photoplethysmography (PPG) [12] is commonly used in the clinic as a noncontact pulse detection method. PPG exhibits strong resistance to interference, high linearity, and high sensitivity, but is limited by the unknown mechanisms of volume pulse wave bloodstream signals, a narrow detection scope, and its unsuitability for long-term continuous detection. Pflugradt et al. [13] developed an ectopic beat discriminator with low computational complexity, which uses multimodal features derived from ECG and pulse wave-related measurements.
Magnetic induction phase shift shows considerable potential for detecting biological signals. The MIPS method is based on detecting the conductivity of biological tissues. The system generates a main magnetic field through the excitation coil, which acts on biological tissues. The phase shift between the excitation magnetic field (EMF) and the induced magnetic field (IMF) reflect the change in conductivity in biological tissues. The first measurement method based on magnetic induction was proposed in 1968 by Tarjan and Mcfee [14] and has been applied to the study of human tumors and brain impedance. Existing studies focus on the care of patients with brain tumors, cerebral hemorrhages, brain edema, and breast cancer [15]. Another application of magnetic induction phase shift is the detection of cardiorespiratory activity. Noncontact monitoring of cardiorespiratory activity by electromagnetic coupling with human tissue is investigated by Philips Corporation [17]. In 2014, Jin et al. [18] developed a novel and sensitive coil detection system based on the MIPS method; cerebral hemorrhage in rabbits can be detected using the technique with high sensitivity and anti-interference ability. In 2015, Pan et al. [19] employed the MIPS technique to detect cerebral hemorrhage in rabbits, which was larger than that in a previous study. In 2017, Li et al. [20] used the MIPS method to evaluate cerebral hemorrhage and cerebral edema in rabbits and obtained satisfactory experimental results. Most of the existing fingertip pulse sensor may cause a sensation, such as a continuous physical force on fingers. This study introduces a simple noncontact pulse detection device based on the MIPS method. Given its noncontact technology, the MIPS technique exerts no pressure on fingers and may require a long time recording. In addition, the proposed pulse sensor is ring-like; thus, patients can perform recipient pulse monitoring.
Figure 1.
Principle of the phase vector.
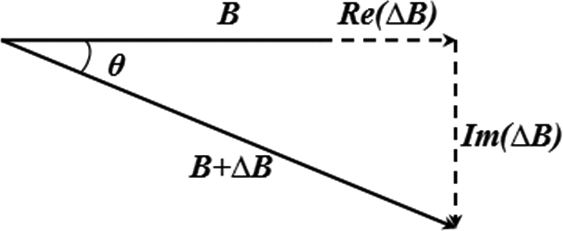
Figure 2.
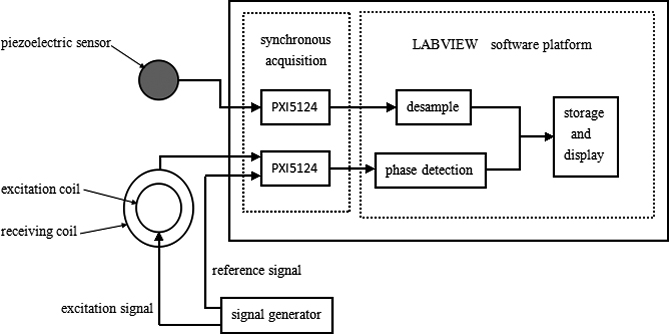
MIPS pulse measurement system.
2.Principles and method
2.1Principles
In pulse detection via the MIPS method, an EMF within a specific frequency range acts on the fingers. Electromagnetic induction causes a phase difference between the EMF and the IMF. Changes in MIPS are correlated with changes in vascular blood volume; thus, the MIPS method can reflect pulse changes. Figure 1 illustrates the principles of MIPS.
An induction signal is sent to the excitation coil, which produces an alternating magnetic field (AMF) referred to as EMF. When the AMF passes the fingers, electromagnetic induction generates an induction current, which produces a disturbed magnetic field on the detection coil. It changes the distribution of the original magnetic field, and can be detected by the detection coil. Changes in blood flow in the finger vessels cause the intensity and distribution of the induction current to change. Thus, the detection coil produces a phase difference between the detection signal and the induction signal. The change in reflects the change in the magnetic field, reflecting the change in conductivity.
2.2Detection system
The MIPS detection system mainly consists of 4 modules: a signal generator, a MIPS pulse detection sensor, a National Instruments PXI DAQ system (NI, USA), and a LabVIEW software interface. To compare with traditional clinical detection methods, this system introduces piezoelectric pulse monitoring as a reference. The workflow of the magnetic induction pulse detection system is presented in Fig. 2. The first step in synchronous pulse measurement is to collect the test signals of the excitation source via the receiving coil of the MIPS monitoring system. The reference signals from the excitation source are collected using the DAQ card NI-PXI5124. The signals are then sent to the phase detector. Traditional pulse signals from the piezoelectric pulse sensor are collected using another NI-PXI5124 DAQ card. Two testing waveforms, which are measured simultaneously using the traditional and magnetic methods, are shown on the LabVIEW display interface.
Figure 3.
(a) Magnetic induction pulse sensor and (b) Simulation of its operation.
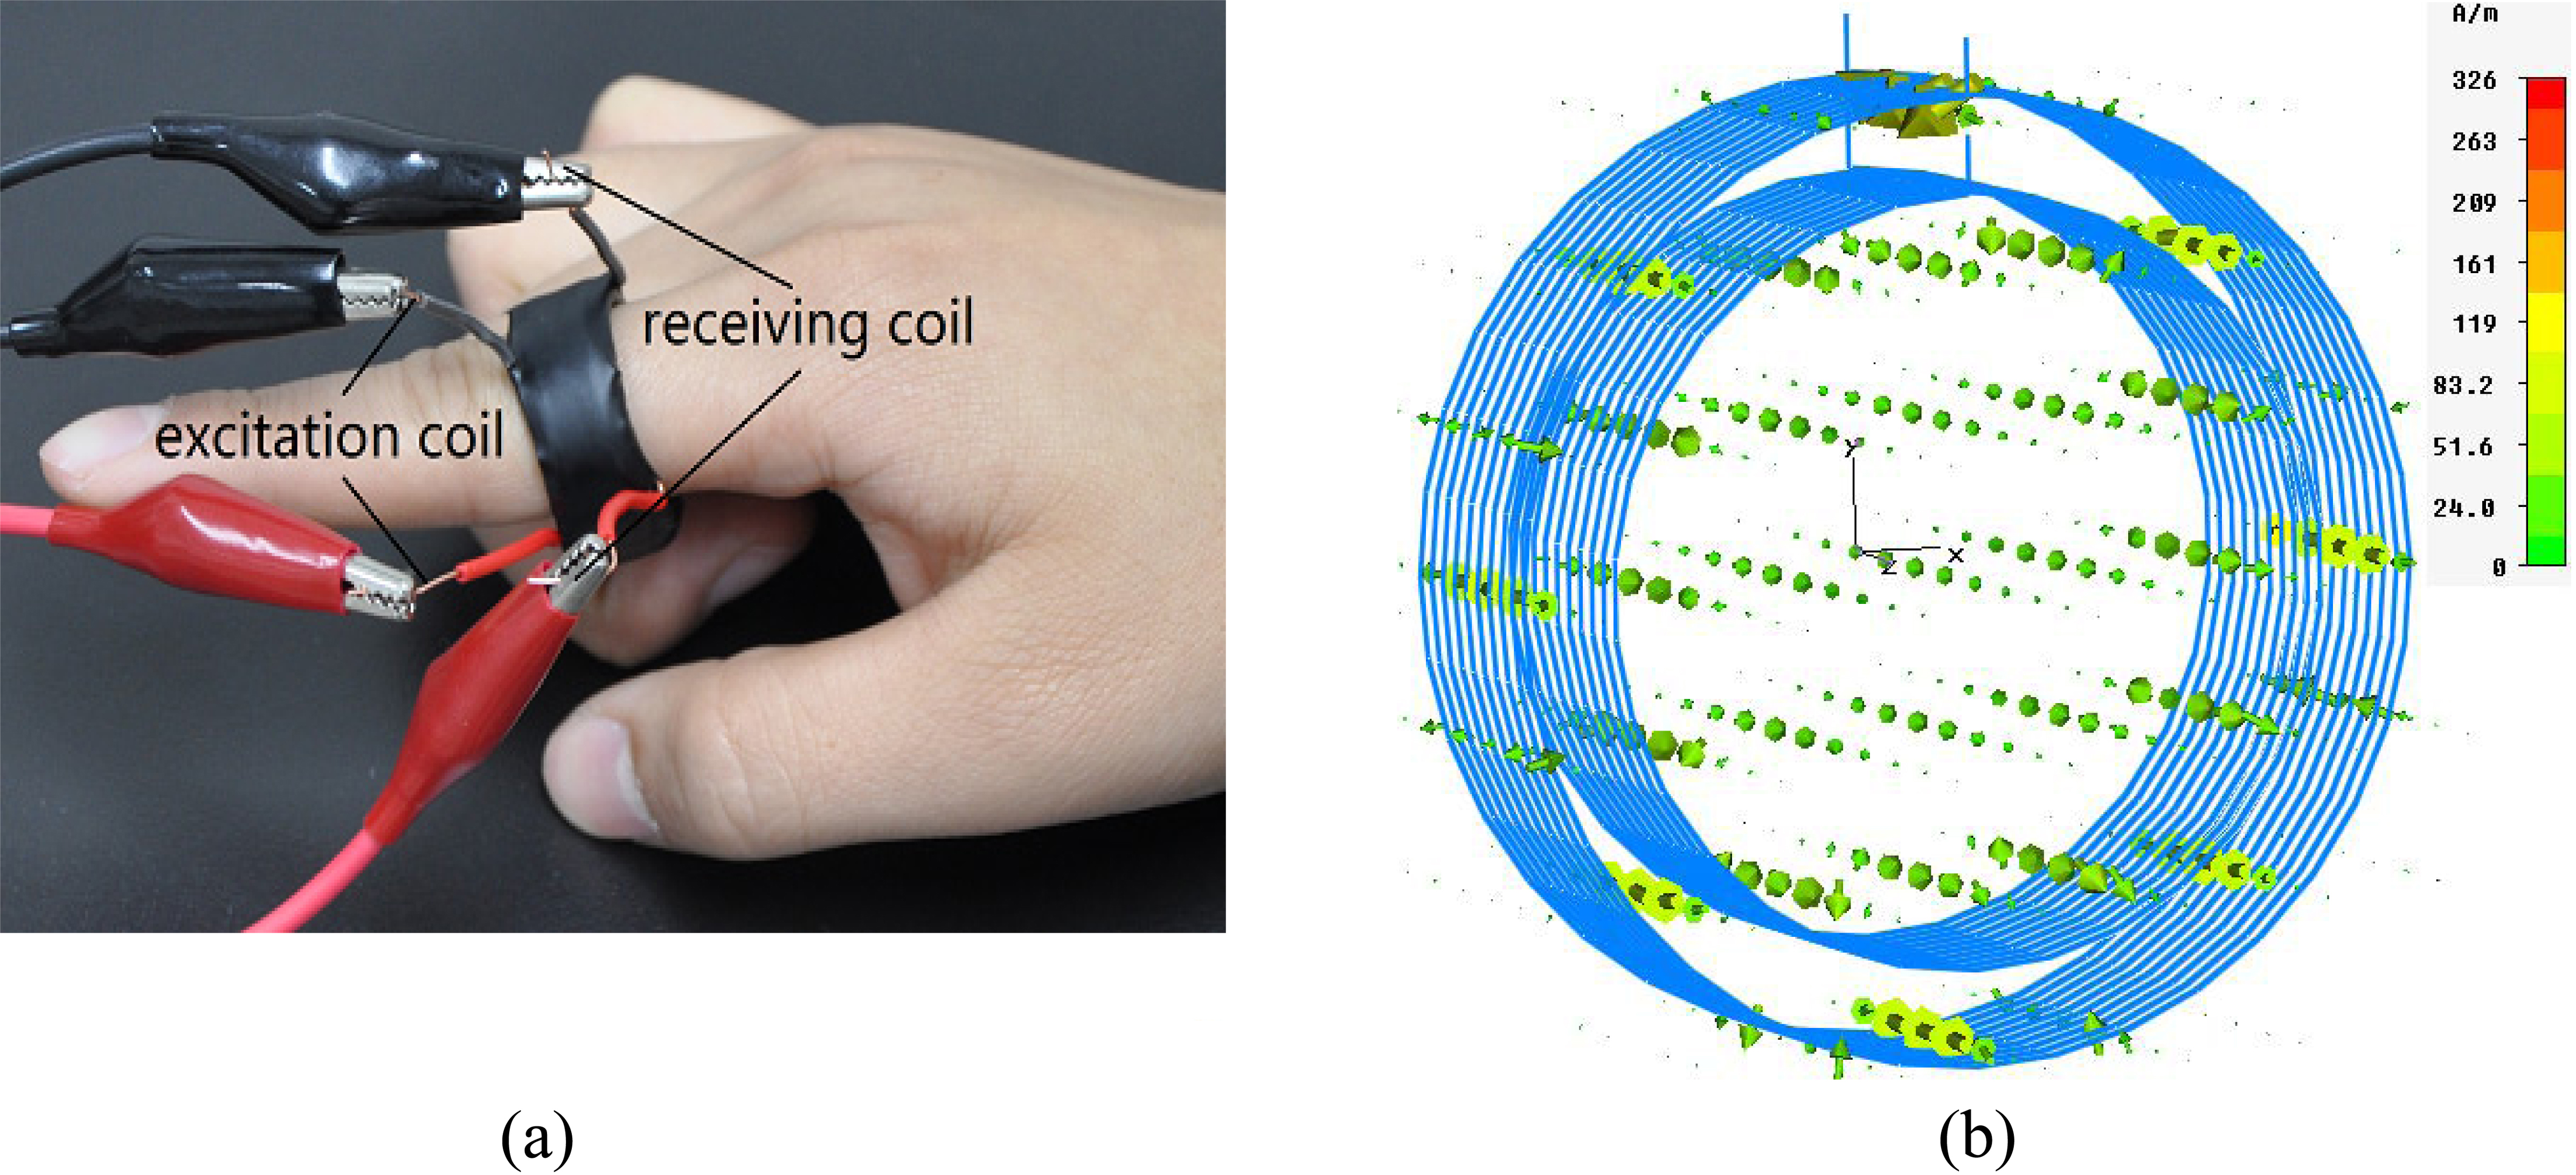
Figure 4.
Front panel of the synchronous measurement system.
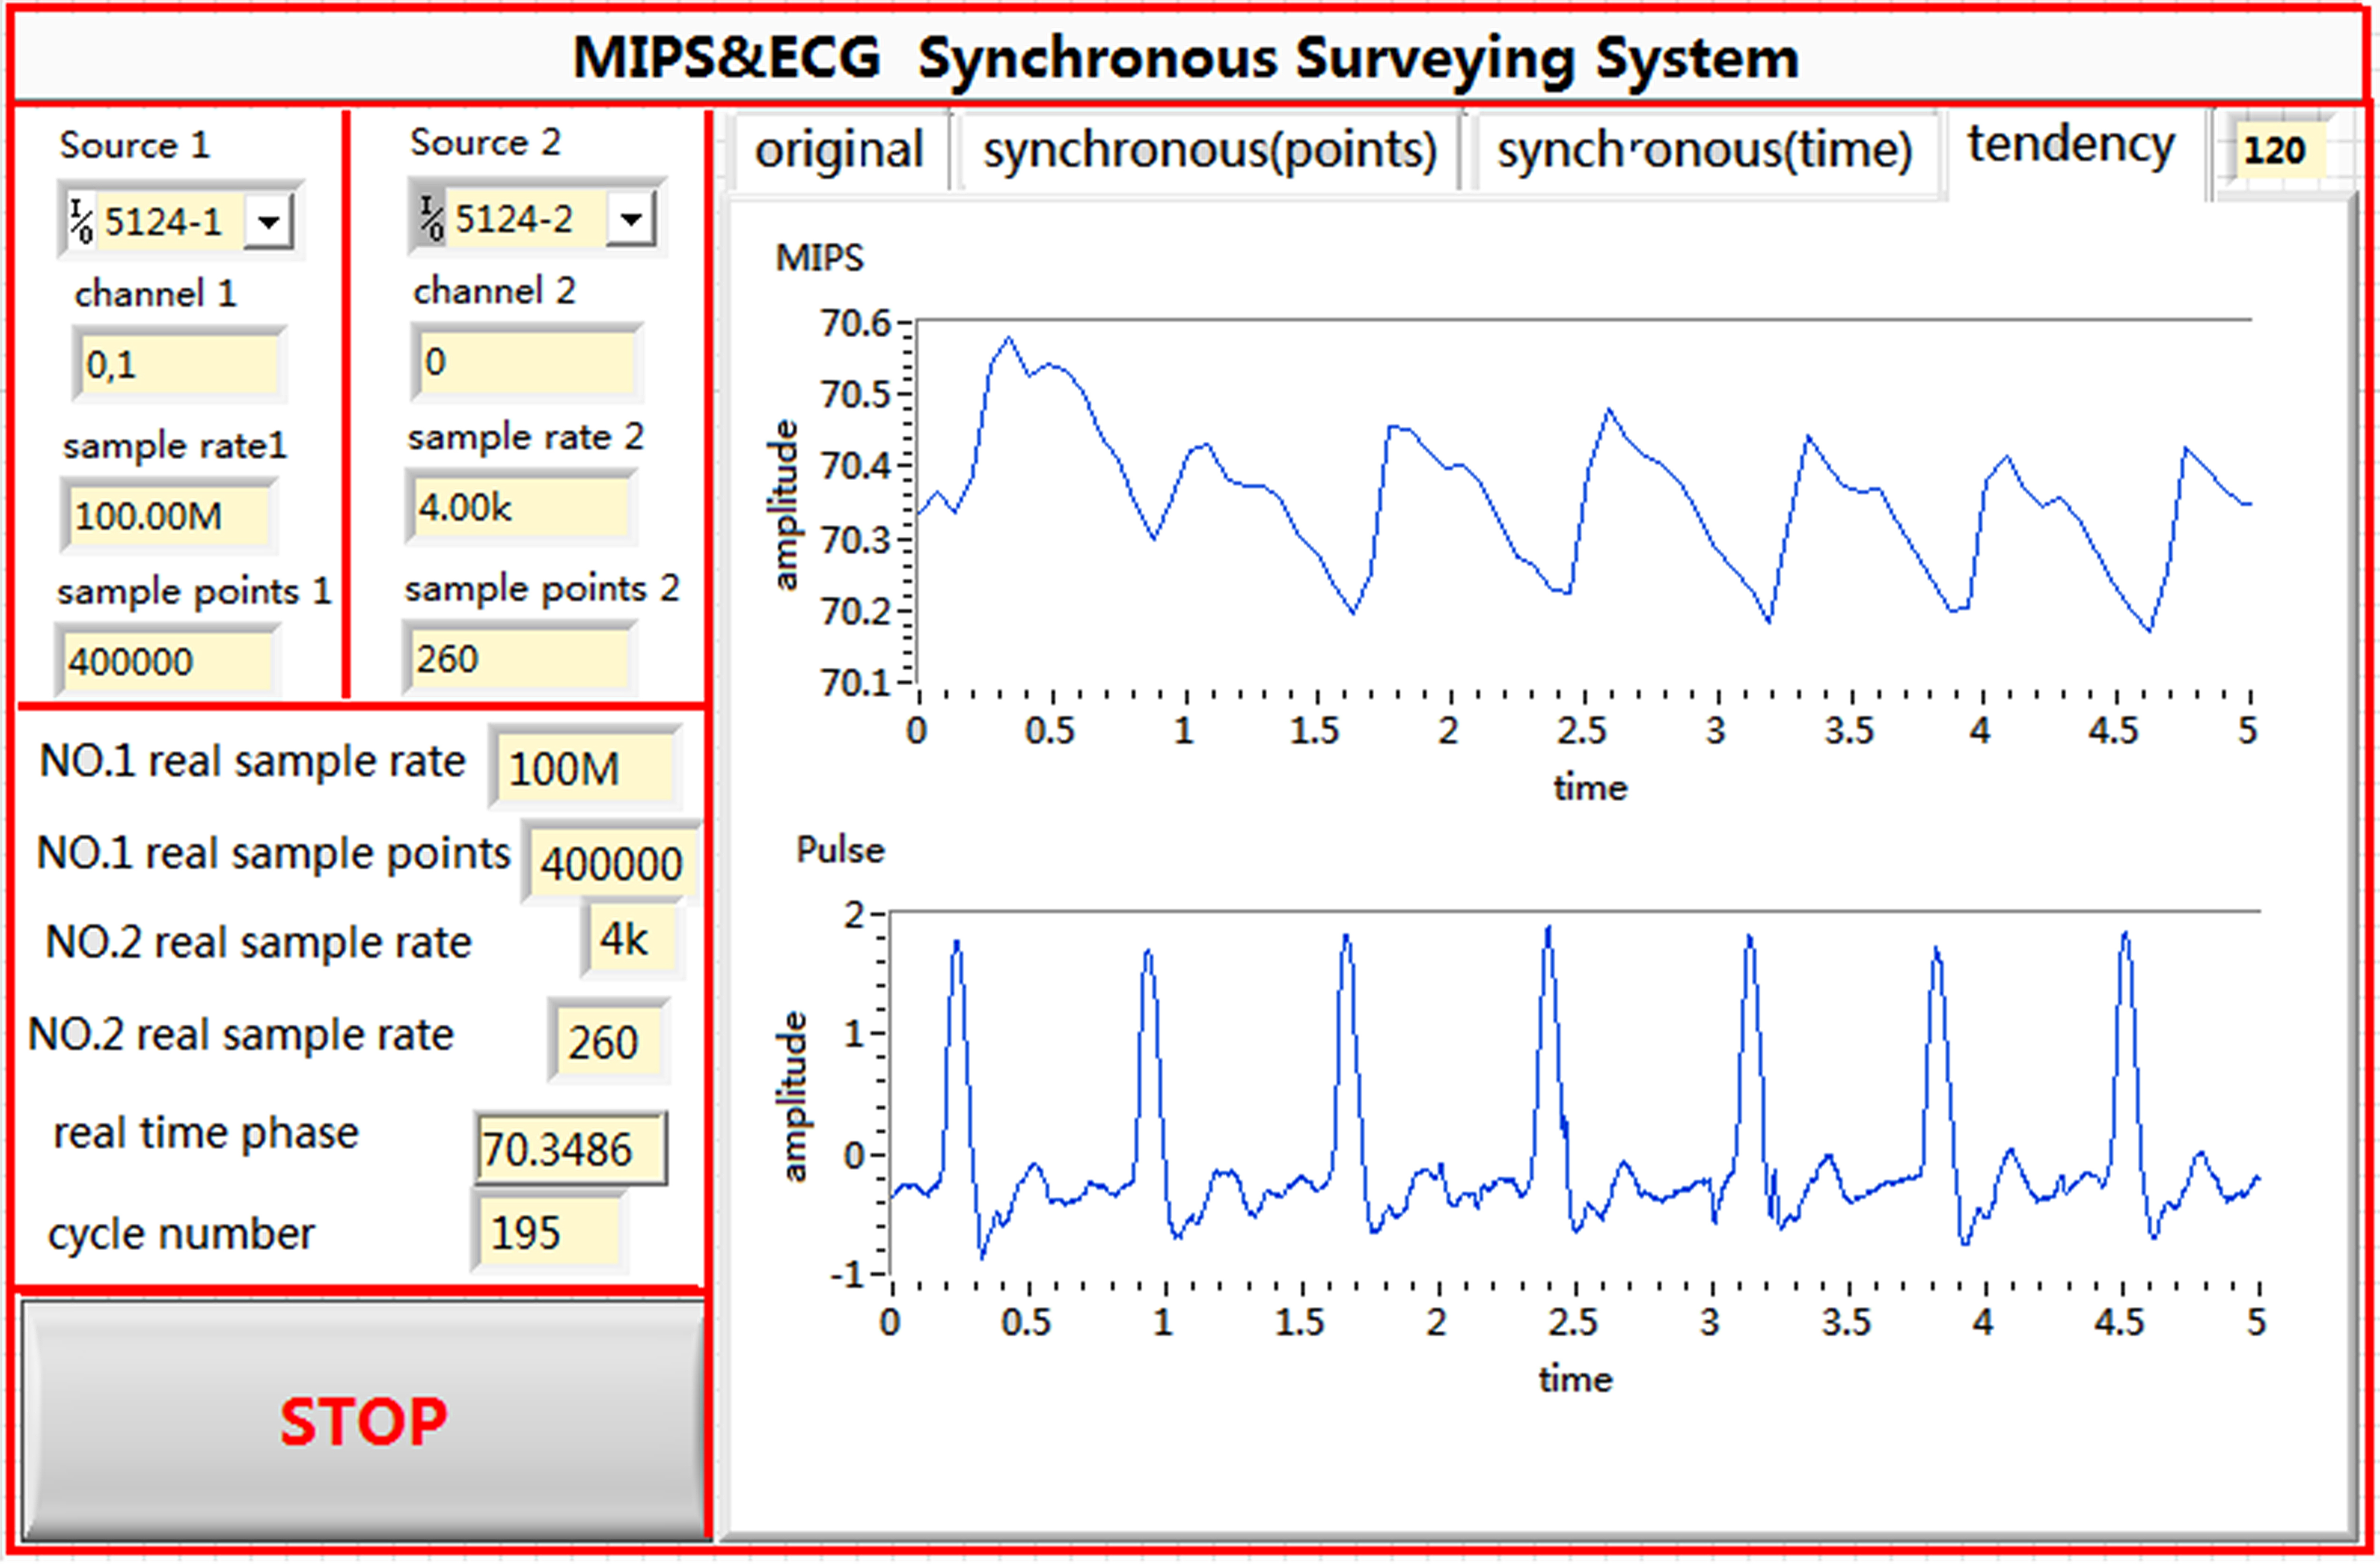
Figure 5.
Software block diagram of the synchronous measurement system.
2.3Sensors
The MIPS sensor presented in Fig. 3a is composed of 2 copper conductor coils of different sizes. The diameter of the copper conductor wire was 0.3 mm; that of the inside excitation coil was 2 cm; and that of the outside receiving coil was 2.5 cm. Both coils had 10 turns and were able to fit the fingers of the subject. Figure 3b presents a magnetic induction phase shift sensor with stimulated coils; the arrows represent the magnetic field intensity. The direction of the arrows indicates the direction of the field, and their size and color represent the magnitude of the field.
2.4Experimental design, signal collection, and analysis
The signal generator produced 2 sinusoidal signals with the same frequency and initial phase. The excitation signal had a frequency of approximately 10.7 MHz and power of 20 dBm. The pulse waves were collected using LabVIEW, a graphic programming language developed by National Instrument Company, USA. The National Instruments T-Clock (NI-TCLK) technology ensured the synchronous precision of 2 collection cards within picoseconds. The NI-TCLK technology was used to achieve a synchronous collection of pulse wave measurements by using the traditional pulse method and the proposed MIPS detection system. The FFT phase detection algorithm [22, 23] can effectively inhibit interference from Gaussian white noise with high speed and precision. The memory and display unit are responsible for the real-time display of the measurement state and for data storage, which facilitate later processing. The front panel and the program layout are shown in Figs 4 and 5, respectively.
Figure 6.
Synchronous pulse wave measurement of volunteers.
Figure 7.
Original phase shift curve for subject 5.
Figure 8.
Change in phase shift after removal of the baseline drift.
A total of 30 volunteers (adults, aged 20–30 y) were selected to corroborate the feasibility of our measurement system. All volunteers met the following conditions: (1) healthy, without CVD or other diseases that would render the subject unsuitable for our experiments and (2) no implanted medical devices such as a pacemaker or a metal stent. Before the experiment, the height and weight of the subjects were measured and recorded. The subjects wore the sensor on their right forefingers and for reference, the piezoelectric pulse sensor on their left forefingers. As shown in Fig. 6, the subjects lay down on the bed and relaxed during the measurement. The pulse waves of the 30 subjects were measured for 2 min each.
To confirm the stability of this method, the pulse was measured synchronously 10 times for the same volunteer under the resting state using MIPS pulse measurement system and the traditional pulse detection method. The 2-minute measurements were collected every 5 min, and the results of the 2 methods were recorded and analyzed.
3.Results
The height, weight, magnetic induction pulse frequency, and piezoelectric pulse frequency of the subjects were recorded. Table 1 lists the results.
The results obtained using the MIPS pulse sensor were consistent with those obtained using the traditional pulse sensor. The pulse rates of subjects with different symptoms vary, reflecting the differences in cardiovascular activity among individuals. The pulse rates of the females were clearly higher than those of the males.
For subject 5, the original waveform of the pulse phase difference recorded by the coil ring is presented in Fig. 7. The X-axis represents time, whereas the Y-axis represents the phase difference. The amplitude of change in MIPS is approximately 0.6
Table 1
Physical characteristics and measurements of the volunteers
| No. | Gender | Age | Height (cm) | Weight (kg) | Pulse frequency (times/min) | Pulse frequency |
|---|---|---|---|---|---|---|
| magnetic induction | (times/min) piezoelectric | |||||
| 1 | Male | 24 | 171 | 68 | 66 | 65 |
| 2 | Male | 24 | 185 | 75 | 81 | 81 |
| 3 | Male | 22 | 165 | 67 | 66 | 67 |
| 4 | Male | 25 | 168 | 63 | 61 | 61 |
| 5 | Male | 24 | 165 | 60 | 71 | 71 |
| 6 | Male | 22 | 160 | 55 | 85 | 84 |
| 7 | Female | 23 | 165 | 57 | 80 | 80 |
| 8 | Female | 22 | 158 | 49 | 78 | 77 |
| 9 | Female | 24 | 170 | 60 | 82 | 82 |
| 10 | Female | 21 | 161 | 50 | 70 | 69 |
| 11 | Female | 22 | 162 | 51 | 72 | 72 |
| 12 | Female | 22 | 165 | 60 | 78 | 78 |
| 13 | Female | 23 | 160 | 52 | 75 | 75 |
| 14 | Male | 21 | 165 | 65 | 70 | 69 |
| 15 | Male | 24 | 168 | 64 | 66 | 66 |
| 16 | Male | 22 | 170 | 70 | 61 | 62 |
| 17 | Male | 24 | 172 | 72 | 67 | 67 |
| 18 | Male | 24 | 175 | 72 | 65 | 65 |
| 19 | Male | 24 | 174 | 73 | 64 | 64 |
| 20 | Male | 22 | 165 | 58 | 62 | 61 |
| 21 | Male | 23 | 168 | 60 | 65 | 65 |
| 22 | Male | 23 | 182 | 74 | 68 | 68 |
| 23 | Female | 25 | 162 | 50 | 75 | 75 |
| 24 | Female | 21 | 163 | 51 | 83 | 82 |
| 25 | Female | 23 | 160 | 53 | 78 | 78 |
| 26 | Female | 22 | 158 | 48 | 80 | 80 |
| 27 | Female | 23 | 166 | 53 | 82 | 82 |
| 28 | Female | 24 | 164 | 52 | 76 | 76 |
| 29 | Female | 22 | 160 | 50 | 74 | 74 |
| 30 | Female | 23 | 166 | 55 | 78 | 78 |
Figure 8 shows the MIPS data after signal preprocessing. The processed pulse signals preserved the major characteristics of the original pulse signals, with almost no influence from baseline drift.
Table 2
Comparison between the magnetic induction method and the traditional method for 10 measurements of the same subject
| Magnetic induction method | Traditional method | |
| Pulse frequency (times/min) | 71.3 (0.008) | 71.1 (0.013) |
The MIPS and piezoelectric pulse sensor data from 10 consecutive measurements of the same volunteer were analyzed by computing for the mean and variance of the results from each method. These results are listed in Table 2. The MIPS method presented less variation compared with the traditional method.
Figure 9.
(a) Detection signal; (b) Signal spectrum.
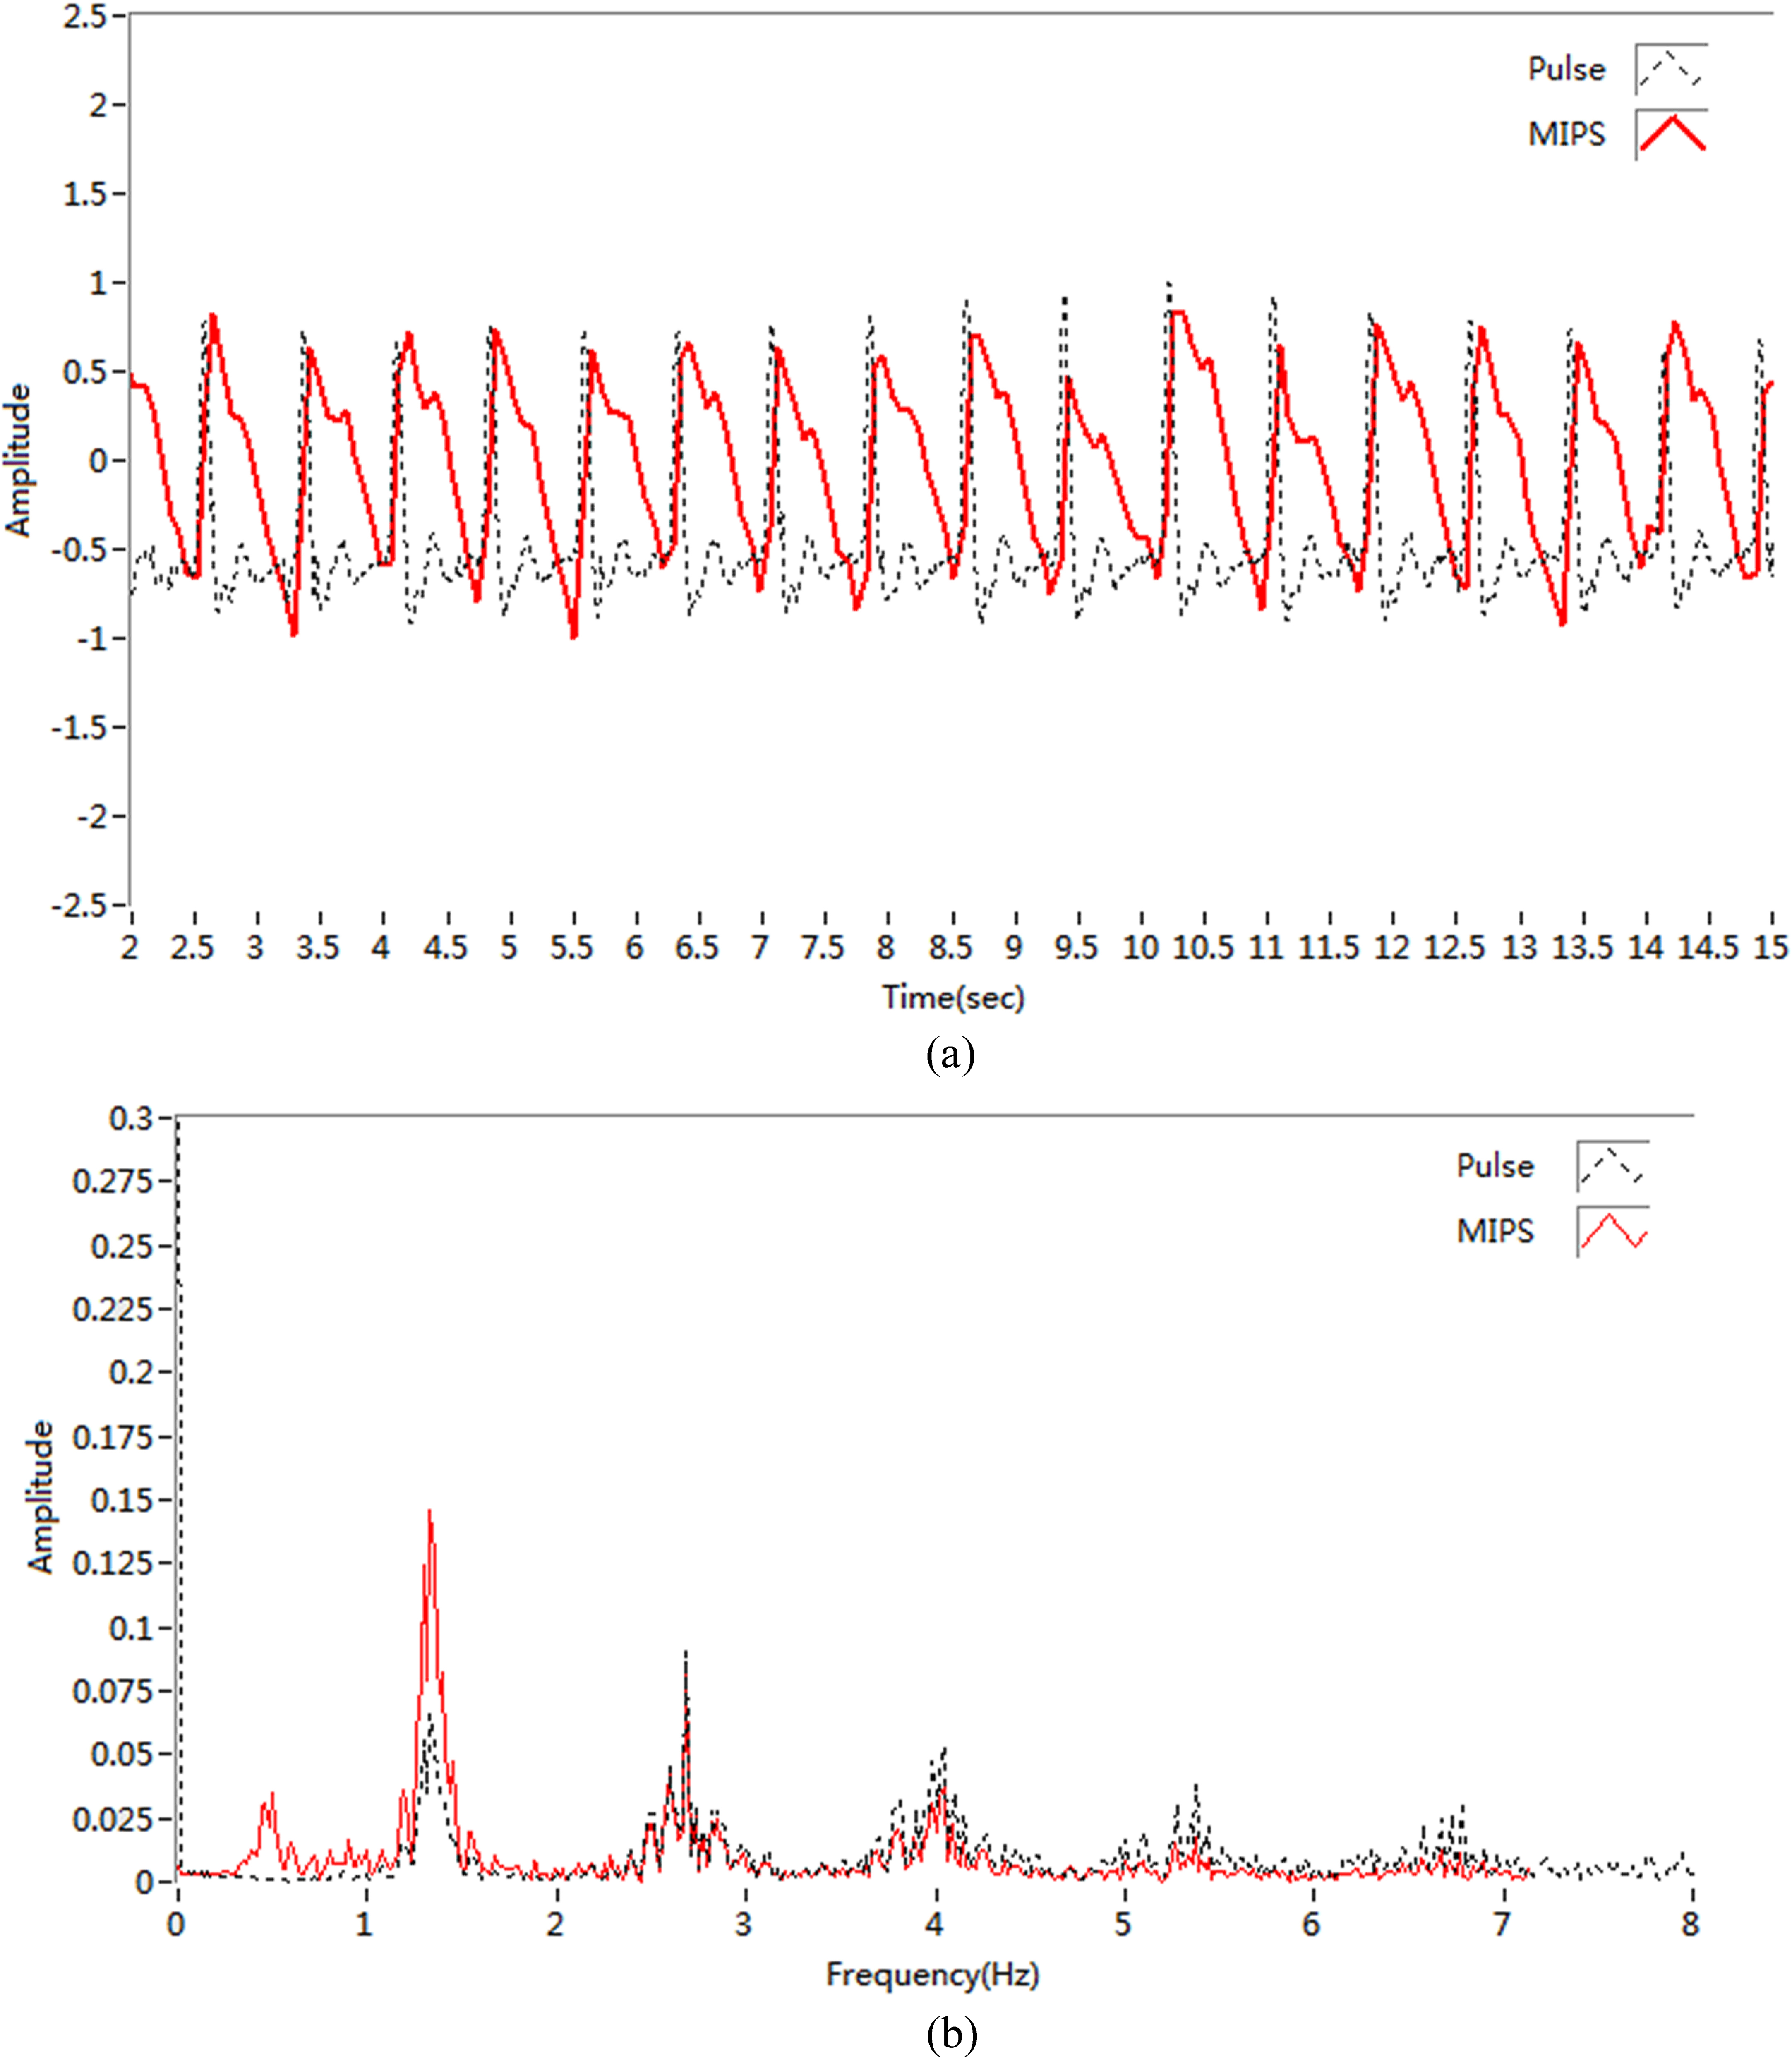
For subject 5, MIPS signals and traditional pulse signals were used in spectral analysis. The sampling rate in MIPS method was 100 MHz, whereas that in the traditional pulse detection method was 200 KHz. The time-domain signals from the synchronous measurement of the 2 methods are shown in Fig. 9a, and the Fourier transform between signals is shown in Fig. 9b.
Clearly, the 2 channels of pulse signals from synchronous acquisition were similar in shape, with both being composed of a main wave and a dicrotic wave [24]. Spectral analysis showed the pulse frequencies of the two methods were consistent and concentrated in 1–3 Hz and were regular in the 1.5 Hz frequency region.
4.Discussion
Clinical pulse sensors are contact-type sensors, which are clamped or tightly pressed against the finger of the patient to obtain more accurate pulse wave signals. However, some patients, such as those with burns or skin allergies do not feel comfortable with this method. Moreover, traditional fingertip pulse sensors usually need to be moved to another finger after 1 h to avoid insufficient blood supply; thus, these sensors are unsuitable for continuous monitoring of the pulse wave signals. The noncontact MIPS pulse sensor designed in this study provides advantages, such as noninvasive, convenient, and continuous monitoring with stability.
In this study, the pulse wave amplitude measured using the MIPS pulse sensor ranged from 0.6
To verify its reliability, the MIPS method of pulse measurement was compared with the traditional methods of pulse measurement. Piezoelectric sensors are widely used for clinical measurements [7, 8]. Therefore, piezoelectric sensors were chosen as a reference for comparison with the magnetic pulse measurement in the present study. NI-TCLK was used to collect synchronous pulse wave signals with high synchronous precision. The results for the 30 volunteers suggest that the measurements obtained using the MIPS technique are comparable to those obtained using the traditional pulse detection method. The MIPS system can also measure pulse rates from individuals of either gender and various physiological states. It also provides reliable measurements. In addition, the synchronous MIPS signals and the traditional pulse signals were used for spectral analysis, which confirmed the similarity of the 2 signals. Thus, the signal obtained using the MIPS method can indeed reflect the main features of the pulse wave signal.
The MIPS method and the traditional method were employed to measure the resting pulse of the same volunteer 10 times to confirm the stability of this system. The results of the statistical analysis indicate that the MIPS method exhibits a more stable performance compared with the traditional method, thus showing less variability.
Although some positive experimental results are obtained, certain aspects of this measurement system have yet to be improved. First, synchronous measurements show that the 2 pulse peaks do not overlap. The MIPS signals are approximately 100 ms delayed relative to those of the traditional pulse peaks. The main reason for this may be that the hysteretic nature of the MIPS algorithm. Another reason may be the systematic instrument error or the time inconsistency caused by measuring different blood vessels. Second, the MIPS system needs to be compressed in future designs. For example, this technology could be embedded in a ring that could transfer pulse data to a remote terminal by wireless communication. In addition, to obtain more reliable pulse signals, an in-depth analysis of the interference from motion artifacts has to be conducted.
5.Conclusion
This study used MIPS method to perform noncontact pulse measurements. The magnetic induction pulse sensor is easy to set up and convenient to use. It also exhibits high sensitivity and a stable performance. Spectral analysis also shows that MIPS signals can reflect the major characteristics of the pulse signal. The experimental results revealed that our proposed MIPS system is suitable for clinical use. This method overcomes some disadvantages of traditional pulse sensors, such as sensation of pressure, finger ischemia, and skin sensitivity. Moreover, the noncontact magnetic induction pulse measurement system enables pulse measurements for burn patients and others requiring noncontact and requires further research and development. Future studies should focus on hardware integration and microminiaturization of the system to improve its portability. A more accessible software interface is required to enable expedient use. Moreover, this system should be used to measure the pulse characteristics in patients with pathological conditions to explore effective methods of analyzing MIPS signals to identify pathological conditions. The next step of our study is the use of pulse wave signals obtained using the MIPS methods to calculate parameters, such as pulse wave velocity and other useful information. These studies can improve the clinical diagnosis and treatment of CVD.
Acknowledgments
This work was supported by the National Natural Science Foundation of China (Grant No. 51607181) and Chongqing City Postdoctoral Foundation (No. Xm2016106). The funders had no role in the study design, data collection and analysis, decision to publish, or preparation of the manuscript.
Conflict of interest
None to report.
References
[1] | Chen WW, Gao RL, Liu LS, et al. Chinese cardiovascular disease report 2015 profile. Chinese Circulation Journal (2016) ; 31: (6): 521-528. |
[2] | Lee JY, Lin JC. A microprocessor-based noninvasive arterial pulse wave analyzer. IEEE Transactions on Biomedical Engineering (1985) ; 6: : 451-455. |
[3] | Ben-Shlomo Y, Spears M, Boustred C, et al. Aortic pulse wave velocity improves cardiovascular event prediction: An individual participant meta-analysis of prospective observational data from 17,635 subjects. Journal of the American College of Cardiology (2014) ; 63: (7): 636-646. |
[4] | Takashima N, Turin TC, Matsui K, et al. The relationship of brachial-ankle pulse wave velocity to future cardiovascular disease events in the general Japanese population: The Takashima Study. Journal of Human Hypertension (2014) ; 28: (5): 323. |
[5] | Yu SJ, You XE, Jiang XB, et al. Human heart rate estimation using ordinary cameras under natural movement. 2015 IEEE International Conference on Systems Man and Cybernetics (2015) ; 188: : 1041-1046. |
[6] | Kusuma RW, Abbie RA, Musa P. Design of Arrhythmia detection device based on fingertip pulse sensor. Proceedings of Second International Conference on Electrical Systems, Technology and Information 2015, Springer Singapore (2016) ; 363-372. |
[7] | Ling Z. Design of sleeveless blood pressure measuring instrument based on pulse wave transit time. Journal of Electronic Measurement & Instrument (2013) ; 26: (12): 1080-1085. |
[8] | Lv Y. The research and design of portable medical measure equipment. Chinese Journal of Scientific Instrument (2005) ; 26: (8): 484-489. |
[9] | Hlenschi C, Corodeanu S, Chiriac H. Magnetoelastic sensors for the detections of pulse waves. IEEE Transactions on Magnetics (2013) ; 49: (1): 117-119. |
[10] | Kaniusas E, Pfutzner H, Mehnen L, et al. Method for continuous nondisturbing monitoring of blood pressure by magnetoelastic skin curvature sensor and ECG. IEEE Sensors Journal (2006) ; 6: (3): 819-828. |
[11] | Yu F, Wang J, He B, et al. Fiber optical sensor effectiveness in the human body. Journal of Clinical Rehabilitative Tissue Engineering Research (2013) ; 8242-8247. |
[12] | Shi P, Yu H. Principles of photoplethysmography and its applications in physiological measurements. Journal of Biomedical Engineering (2013) ; 30: (4): 044. |
[13] | Pflugradt M, Geissdoerfer K, Goernig M, et al. A fast multimodal ectopic beat detection method applied for blood pressure estimation based on pulse wave velocity measurements in wearable sensors. Sensors (2017) ; 17: (1): 158. |
[14] | Tarjan PP, Mcfee R. Electrodeless measurements of the effective resistivity of the human torso and head by magnetic induction. IEEE Transactions on Biomedical Engineering (1968) ; 15: (4): 266-278. |
[15] | González CA, Rojas R, Rubinsky B. Circular and magnetron inductor/sensor coils to detect volumetric brain edema by inductive phase shift. 13th International Conference on Electrical Bioimpedance and the 8th Conference on Electrical Impedance Tomography (2007) ; 17: : 315-319. |
[16] | Gonzalez CA, Rojas R, Villanueva C, et al. Inductive phase shift spectroscopy for volumetric brain edema detection: An experimental simulation. International Conference of the IEEE Engineering in Medicine & Biology Society (2007) ; 2346-2349. |
[17] | Francisco F, Claudia I, Matthias H. Planar coil arrangement for a magnetic induction impedance measurement apparatus. US Patent Application Publication (2014) ; 8808190. |
[18] | Jin G, Sun J, Qin MX, et al. A new method for detecting cerebral hemorrhage in rabbits by magnetic inductive phase shift. Biosensors and Bioelectronics (2014) ; 52: : 374-378. |
[19] | Pan WC, Yan QG, Qin MX, et al. Detection of cerebral hemorrhage in rabbits by time-difference magnetic inductive phase shift spectroscopy. Plos One (2015) ; 10: (5): e0128127. |
[20] | Li G, Sun J, Ma K, et al. Construction of a cerebral hemorrhage test system operated in real-time. Scientific Reports (2017) ; 7: : 42842. |
[21] | Li G, Ma K, Sun J, et al. Twenty-four-hour real-time continuous monitoring of cerebral edema in rabbits based on a noninvasive and noncontact system of magnetic induction. Sensors (2017) ; 17: (3): 537. |
[22] | Hu XY, Qin MX, Liang WW. Implementation of digital phase detection in brain MIT based on programming with LabVIEW and Matlab. Journal of the Fourth Military Medical University (2013) ; 28: : 1144-1146. |
[23] | Lu YJ, Xi ZH and Wang JB. Analysis and comparison between FFT and digital correlation theory in phase difference measurement. Information Technology (2007) ; 12: : 105-108. |
[24] | Liu H, Zhao G, Chen SC. Design a pulse signal processing and analyzing system based on LabVIEW. Science Technology & Engineering (2011) ; 57: (18): 903-909. |

