
Study of altered functional connectivity in individuals at risk for Alzheimer’s Disease
Abstract
BACKGROUND:
Mild Cognitive Impairment (MCI) has been considered to have a high risk in converting into Alzheimer’s Disease (AD). Previous studies showed that AD was associated with changes in resting-state networks (RSNs). However, few studies have evaluated the altered functional connectivity in early mild cognitive impairment (EMCI) and late mild cognitive impairment (LMCI).
OBJECTIVE:
The aim of this work was to evaluate the impaired network functional connectivity with the disease progression.
METHODS:
In this paper, we evaluated the impaired function connectivity with the progression of disease based on a priori defined 246 regions of interest based on Brainnetome Atlas. Connectivity analysis based on three levels (node integrity, intra-network, and inter-network) was conducted.
RESULTS:
Altered function connectivity was detected in several RSNs. These results provided insights into the dysfunction of more RSNs accompany the progression of AD. We also found that one brain region may belong to multiple RSNs and contribute to achieving different network function.
CONCLUSIONS:
The aberrant intra- and inter-network dysfunctions might be potential biomarkers or predictors of MCI and AD progression and provide new insight into the pathophysiology of these diseases.
1.Introduction
Alzheimer’s Disease (AD) is a wide prevalent neurodegenerative disease, which endangers the health of human all over the world. The accumulations of A
With the development of neuroimaging techniques, MRI has been widely applied to investigate the neurodegenerative diseases. Resting-state fMRI (rsfMRI) is an especially useful modality because it can be used easily in diverse patient populations to quantify functional network connectivity in terms of correlated, spontaneous MR signal fluctuations [5]. It is efficient to assess brain function connectivity among brain regions [6, 7]. Correlated brain regions have been divided into several resting-state networks (RSNs) [8, 9].
The research about RSNs offered a typical model for looking into the relationship between brain activity alterations and cognitive dysfunction in neurological disorders [10]. As for as AD and MCI concerned, convergence evidence on account of fMRI studies demonstrated that functional integration have disease severity related changes. For examples, recent studies have shown that functional connectivity and networks were influenced in the subjects with AD or at high risk for AD, especially in higher cognitive RSNs such as the default mode network (DMN), attention network (AN), executive control network (ECN) and salience network (SAL). All these preliminary research findings support the point that AD is a disconnection syndrome [11] and that the selective impairment patterns in the RSNs may describe the traits and states of AD.
However, most of these studies concentrate on the connectivity alterations within higher cognitive RSNs, the understanding of more RSNs still needs to explore. Inspired by the above studies, we hypothesized that the alteration of functional connectivity across more RSNs would happen in individuals with EMCI and LMCI, which are patients at high risk for AD. We expected that functional abnormalities would occur in several RSNs and that the cognitive impairments measured by mini-mental state examination (MMSE) would be correlated with rs-fMRI markers of abnormalities. To test these hypotheses, in this paper, altered functional connectivities based on a priori defined 246 regions of interest [12] were explored in participants of 26 patients with EMCI, 19 patients with LMCI, compared with 23 healthy control subjects.
2.Materials and methods
2.1Subjects
The dataset was examined from ADNI database. According to the protocol, each participant finished the informed consent and had neuropsychological tests and clinical examinations, including Clinical Dementia Rating (CDR), Mini-Mental State Examination (MMSE), and behavioral measures.
In this study, 68 participants with rs-fMRI tests were included. It includes 26 patients with EMCI and 19 patients with LMCI, compared with 23 healthy control subjects. The demographics of participants were showed in Table 1.
Table 1
Demographics of subjects
| NC (23) | EMCI (26) | LMCI (19) | p value | |
| Gender (M/F) | 12/11 | 15/11 | 13/6 | 0.139 |
| CDR | 0 | 0.5 | 0.5 | – |
| Age (year) | 74.0 (5.4) | 71.2 (7.9) | 73.2 (8.5) | 0.400 |
| MMSE | 29.2 (1.0) | 28.3 (1.2) | 27.6 (1.2) | 0.002 |
| Head motion | 0.6 (0.4) | 0.7 (0.4) | 0.8 (0.6) | 0.800 |
The inclusion criteria were as follows: 1) CDR of 0 and MMSE scores of 26 or higher for the NC group; 2) CDR of 0.5 and MMSE scores of 24 or higher for the MCI group; 3) no change in categorical disease status at the visit. The following exclusion criteria were applied: 1) obvious distortion on the raw imaging files; 2) translation or rotation in any axis of head motion larger than the size of one voxel during the scanning. For full ADNI inclusion/exclusion criteria, see http://www.adni-info.org.
2.2Image acquisition
According to ADNI protocol (http://adni.loni.usc.edu/), the resting-state fMRI data was acquired on 3.0 Tesla Philips scanners (varied models/systems) while subjects were instructed to keep their eyes open. Images were acquired using an echo planar imaging (EPI) sequence with a repetition time (TR) ranging from 2250 ms to 3090 ms; echo time (TE)
2.3Preprocessing of rs-fMRI
The resting-state fMRI data were pre-processed using the Brainnetome fMRI Toolkit (http://brant.brainnetome.org) based on Statistical Parametric Mapping (SPM12, http://www.fil.ion.ucl.ac.uk/spm). Pre-processing steps included (1) slice-timing correction; (2) realignment to the first volume for head motion correction; (3) spatial normalization to a standard EPI template with re-slicing to 2 mm cubic voxels; (4) regression of nuisance parameters including linear drift, six motion parameters, and the mean time series of all voxels within the white matter and cerebrospinal fluid; (5) temporal filtering (0.01–0.08 Hz) to reduce high frequency and low frequency noise.
2.4Connectivity analysis
The seed region in the present study were based on a priori defined 246 regions of interest (Brainnetome Atlas, http://atlas.brainnetome.org/) [12]. These regions of interests have been coregistered to the templates from Stanford’s Functional Imaging in Neuropsychiatric Disorders (FIND) (http://findlab.stanford.edu/functional_ROIs.html), which include Auditory Network (AN); Basal Ganglia Network (BGN); Dorsal Default Mode Network (dDMN); Higher Visual Network (HVN); Language Network (LN); Left Executive Central Network (LECN); Sensorimotor Network (SN); Posterior Salience Network (PSN); Precuneus Network (PN); Primary Visual Network (PVN); Right Executive Control Network (RECN); Anterior Salience Network (ASN); Ventral Default Mode Network (VDMN); Visuospatial Network (VN).
For each participant, Pearson’s correlation coefficient was computed between the mean time series of each pair of ROIs. Three levels investigation was explored [13]:
(1) Node level:
(2) Inter-network level:
(3) Intra-network level:
2.5Statistical analysis
In order to obtain the statistical significance, the Z scores at each level were employed into one-way analyses of variance (ANOVA) with a group as a element (3 groups: NC, EMCI, LMCI) after age and gender effects were regressed out by using a linear regression model. The statistical significance was
In three groups, considering that we implemented many times comparisons, we performed a 10,000 times random arrangement to test whether the identified altered connections are really significant. For the sake of getting a statistically significant difference, post-hoc in each two groups have been performed between the NC and EMCI, NC and LMCI, EMCI and LMCI (
3.Results
For each group, a 246
At node level, significant differences between groups were detected, and these differences were widely separated in several RSNs. (1) Compared with EMCI group and LMCI group (Fig. 1), significant decrease integrity was showed in two regions of Posterior Salience Network (PCL_R_2_1, INS_R_6_1), and two regions of Language Network (pSTS_L_2_2, MTG_L_4_3), and two regions of dorsal Default Mode Network (CG_L_7_1, CG_L_7_6). (2) Compared with EMCI group and NC group (Fig. 2), significant decrease integrity was showed in the region of Dorsal Default Mode Network (Hipp_L_2_1). (3) Compared with LMCI group and NC group (Fig. 3), significant decrease integrity was showed in five regions of dorsal Default Mode Network (CG_L_7_6, CG_L_7_1, SFG_L_7_7, IPL_L_6_5, Hipp_L_2_1), and one region of Anterior Salience Network (IFG_R_6_3), three regions of Language Network (IFG_L_6_3, pSTS_L_2_2, MTG_L_4_3), one region of Posterior Salience Network (PCL_R_2_1), one region of Basal Ganglia Network (BG_L_6_6), one region of Left Executive Control Network (MFG_L_7_2), one region of Sensorimotor Network (PrG_L_6_4).
Figure 1.
The altered region between EMCI and LMCI at node level.
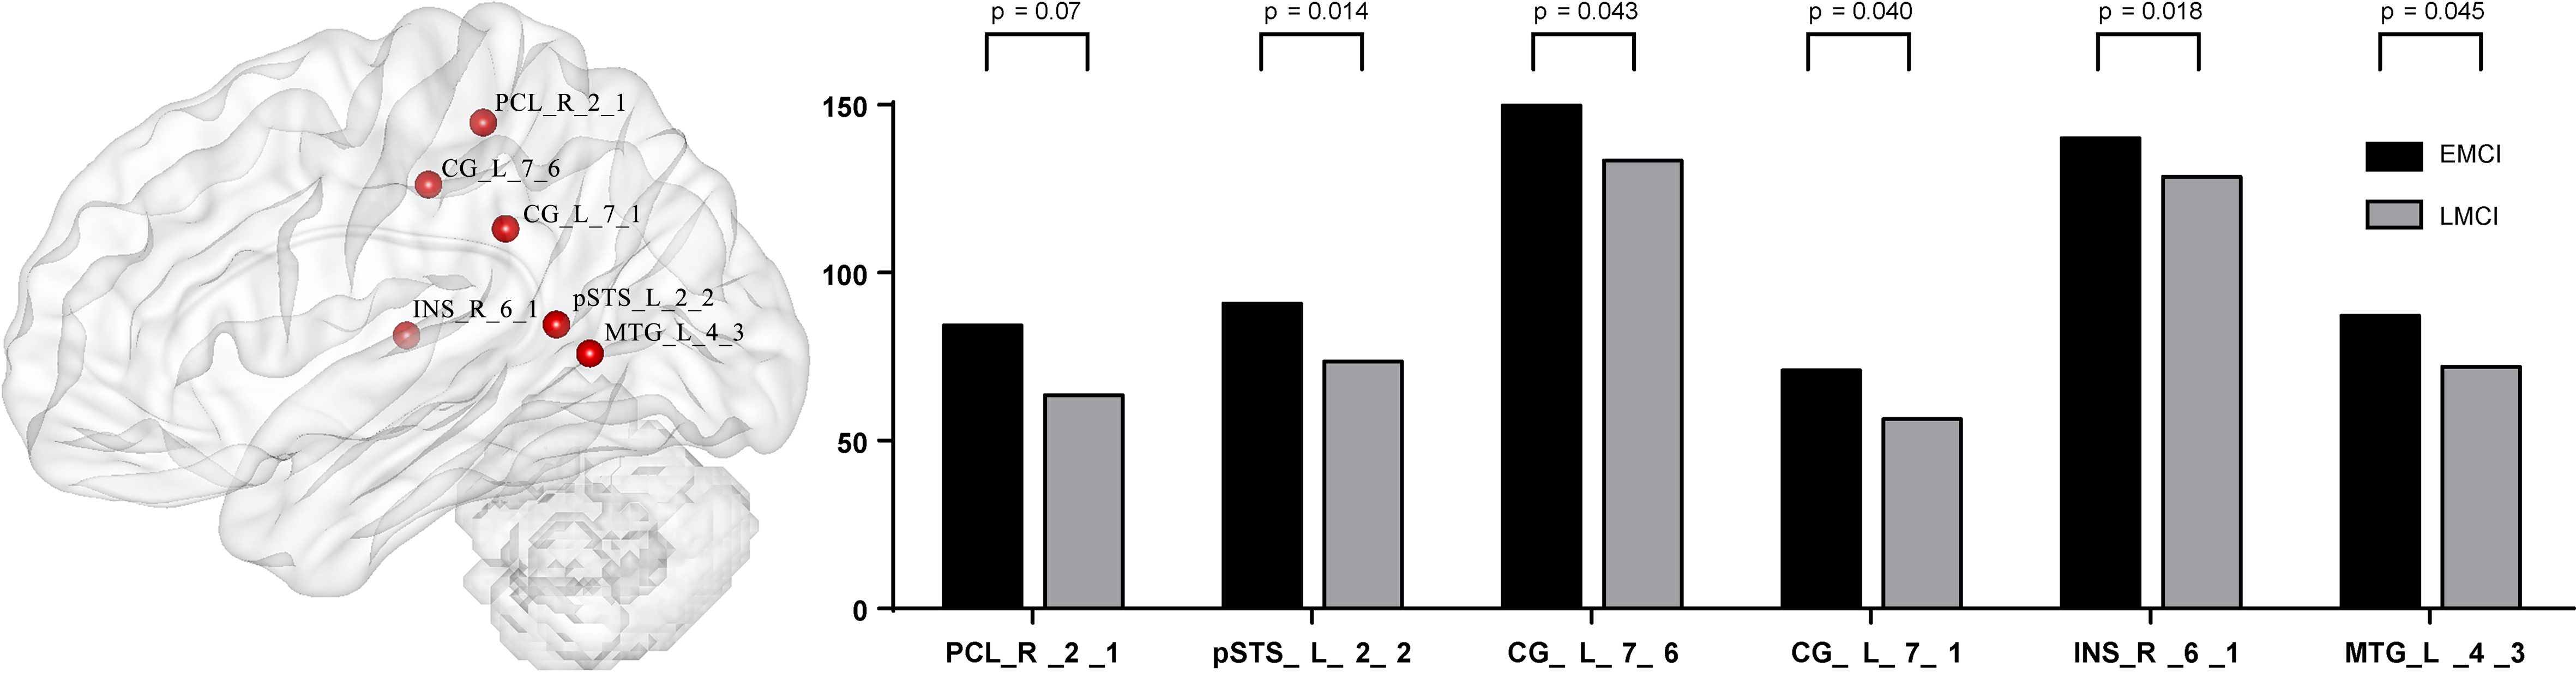
Figure 2.
The altered region between EMCI and NC at node level.
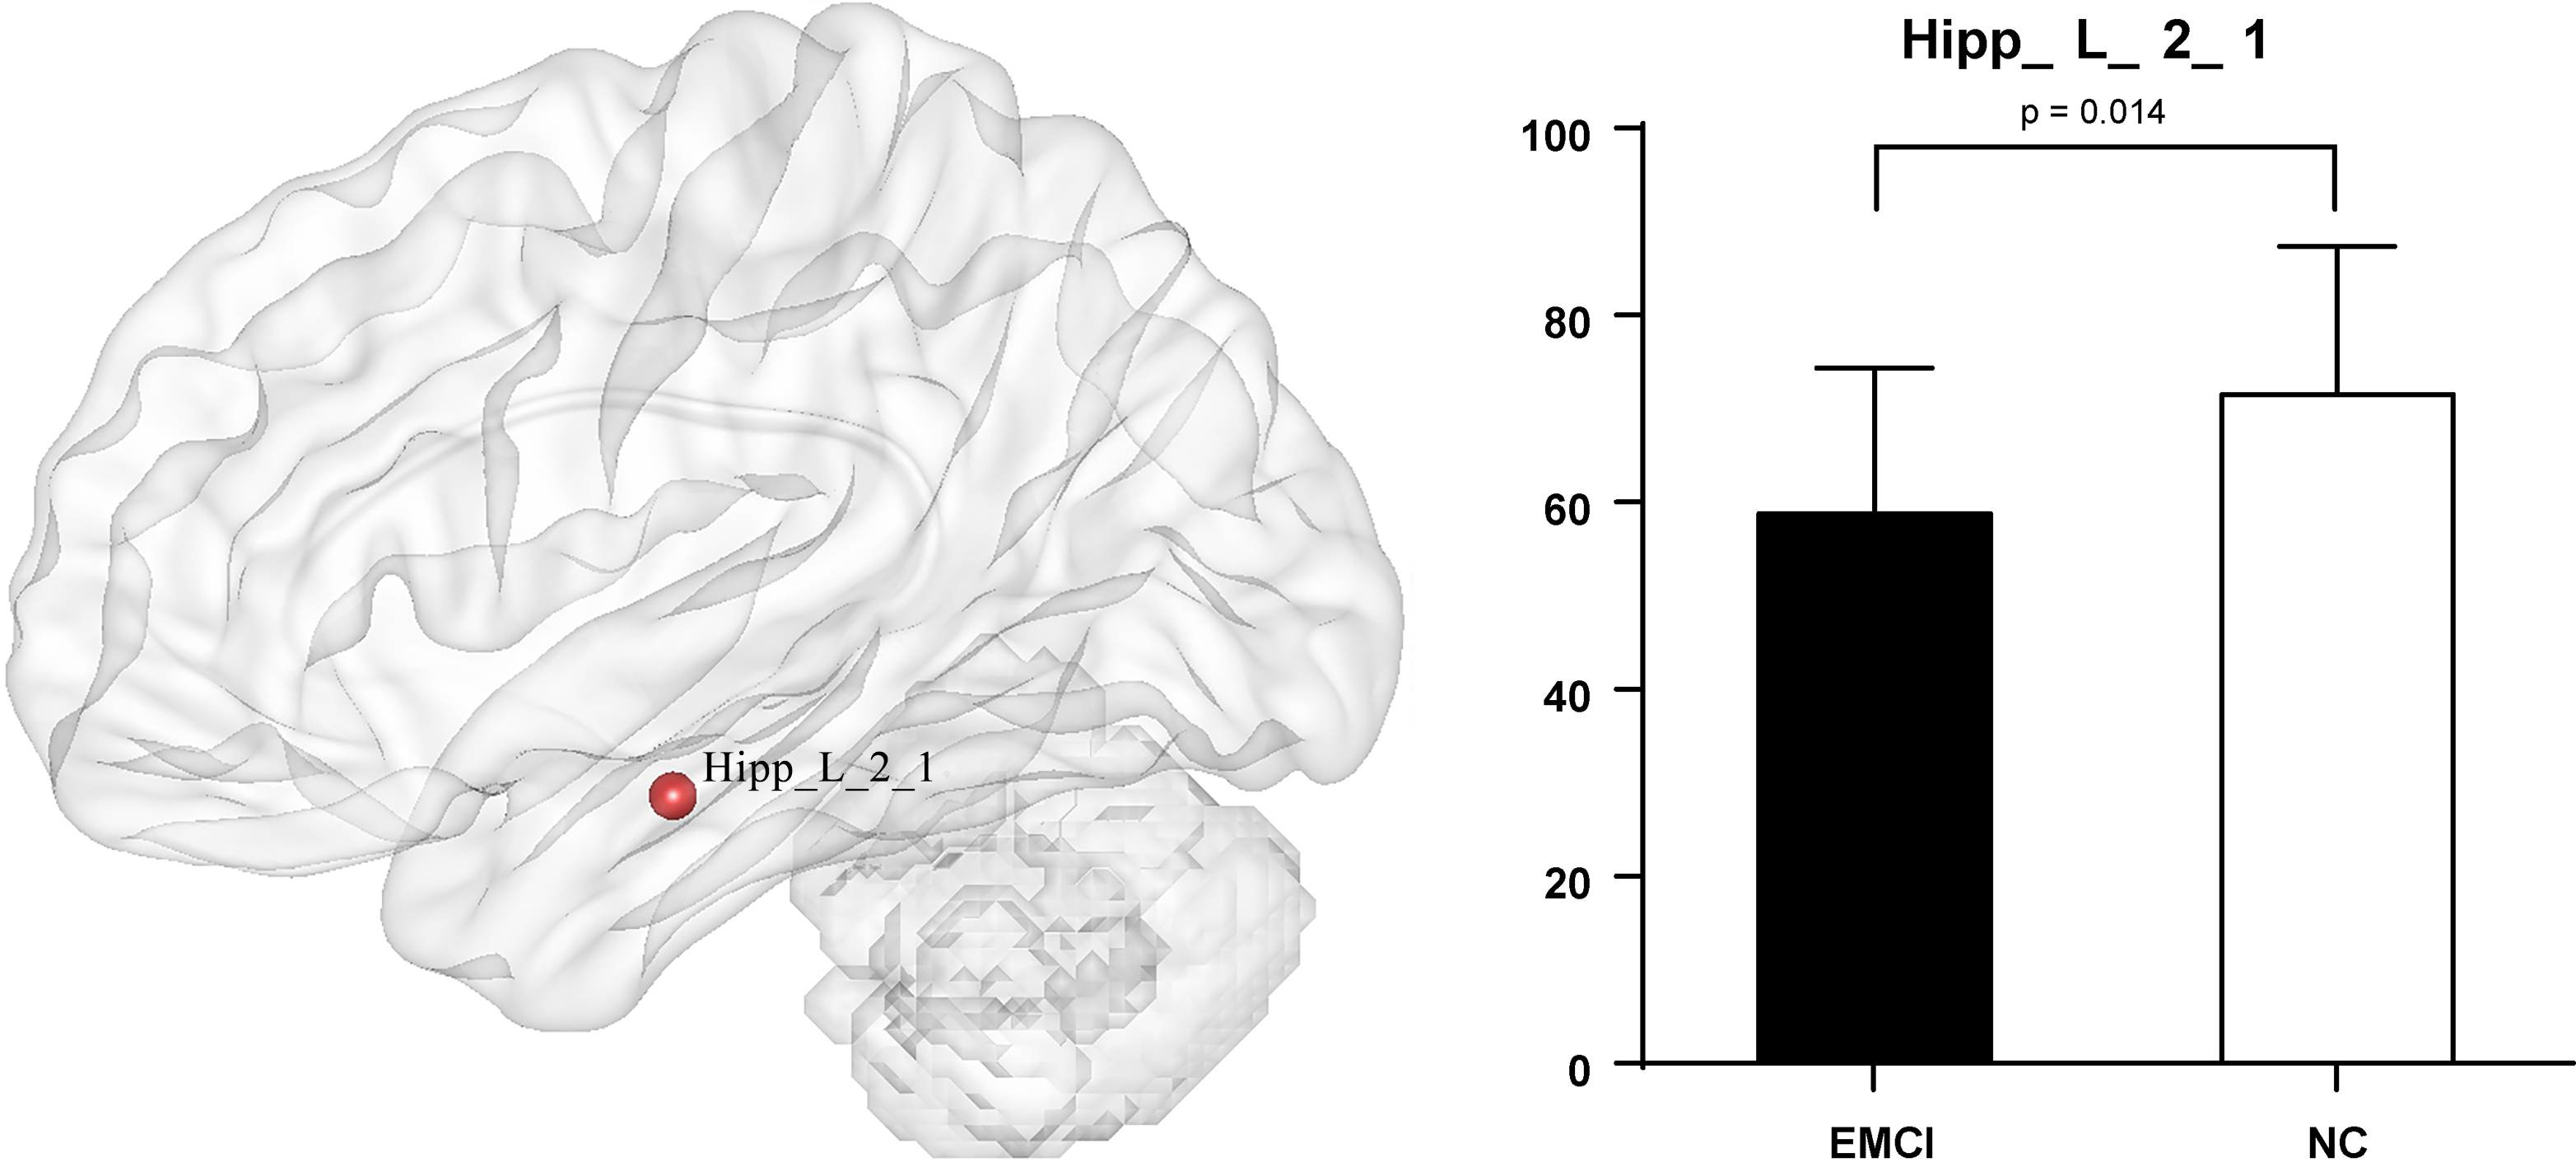
Figure 3.
The altered region between LMCI and NC at node level.
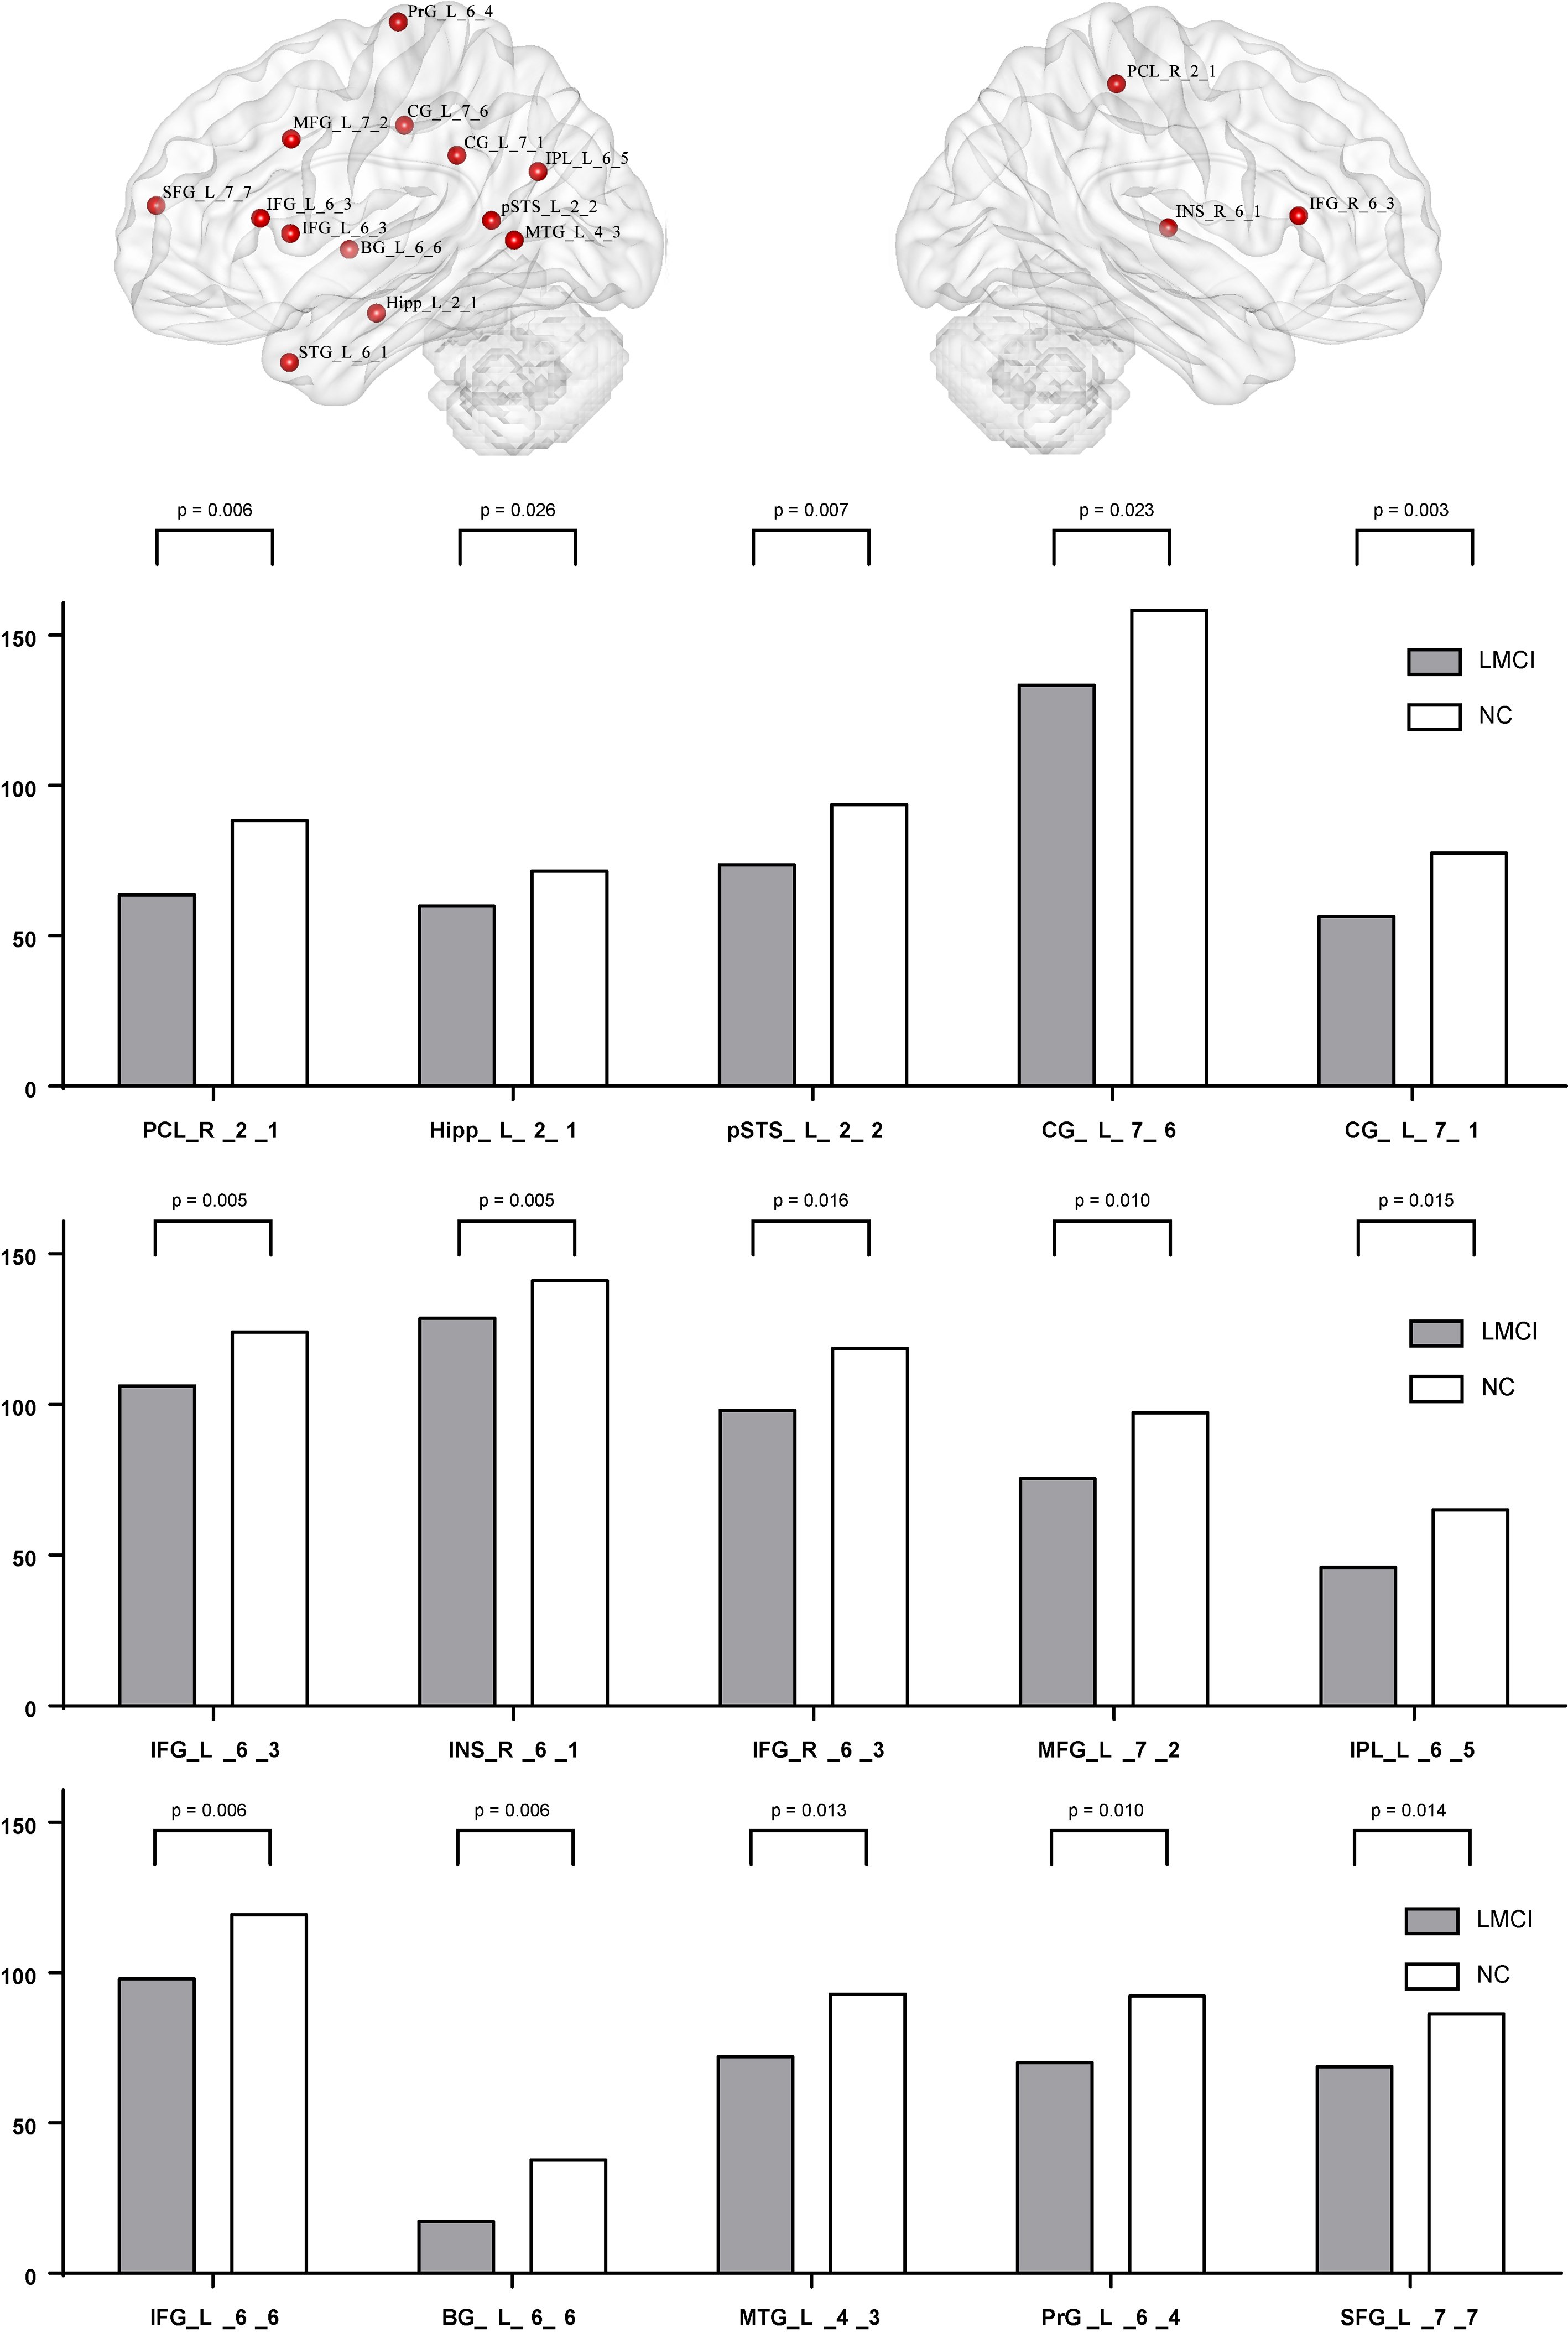
Figure 4.
Differences between EMCI, LMCI and NC at Intra-network level.
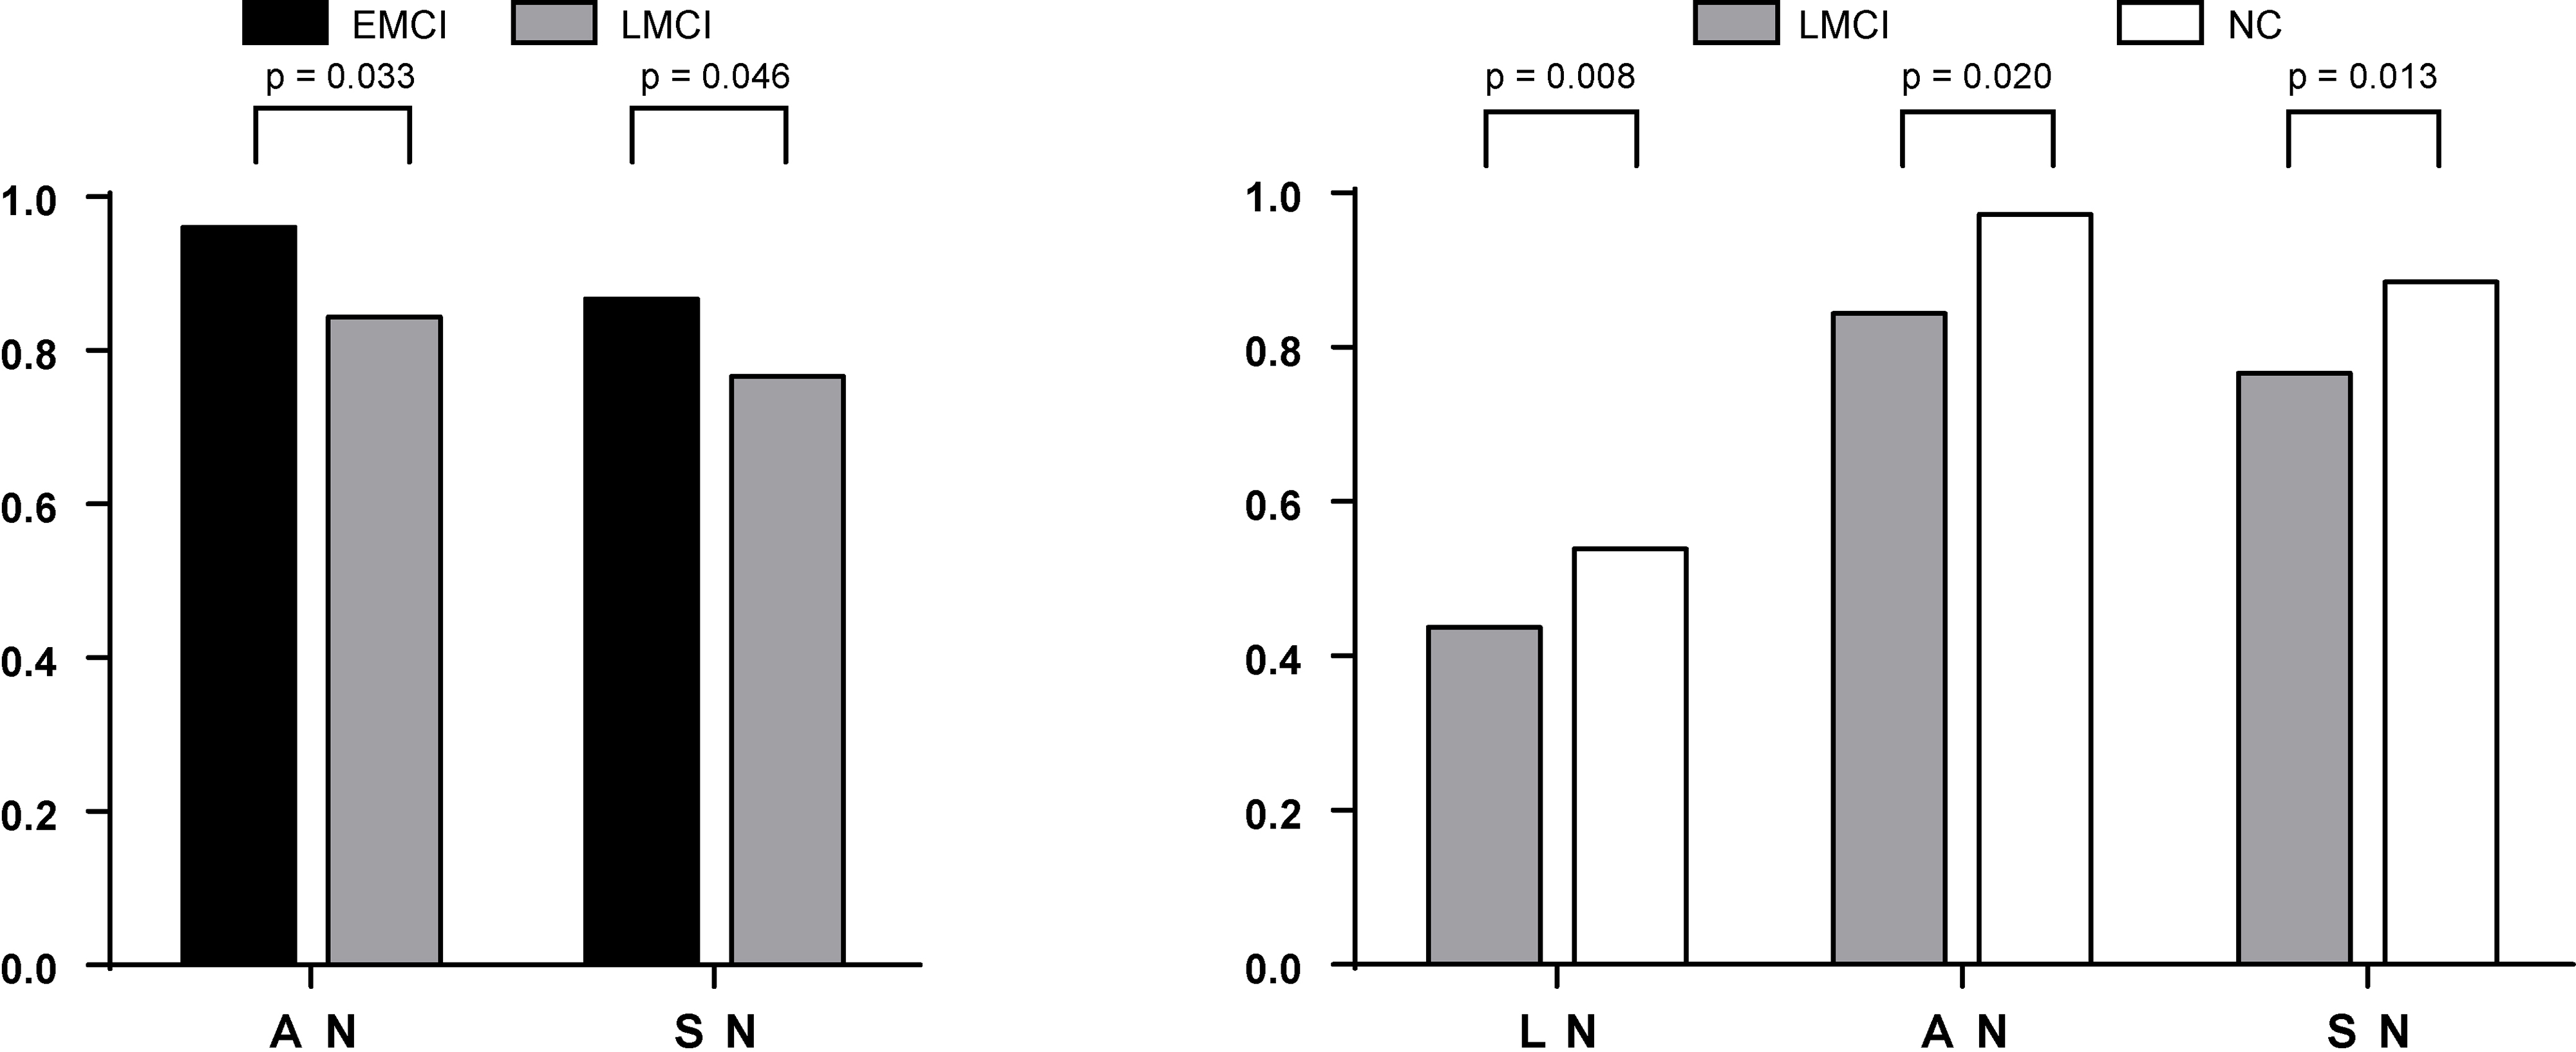
At intra-network level (Fig. 4), compared with EMCI group, significant decreases were found in Auditory Network (AN) and Sensorimotor Network (SN) in the LMCI group. Compared with NC group, the LMCI group showed significant decreases in Auditory Network (AN), Language Network (LN), Sensorimotor Network (SN).
Figure 5.
Differences between EMCI, LMCI and NC at inter-network level.
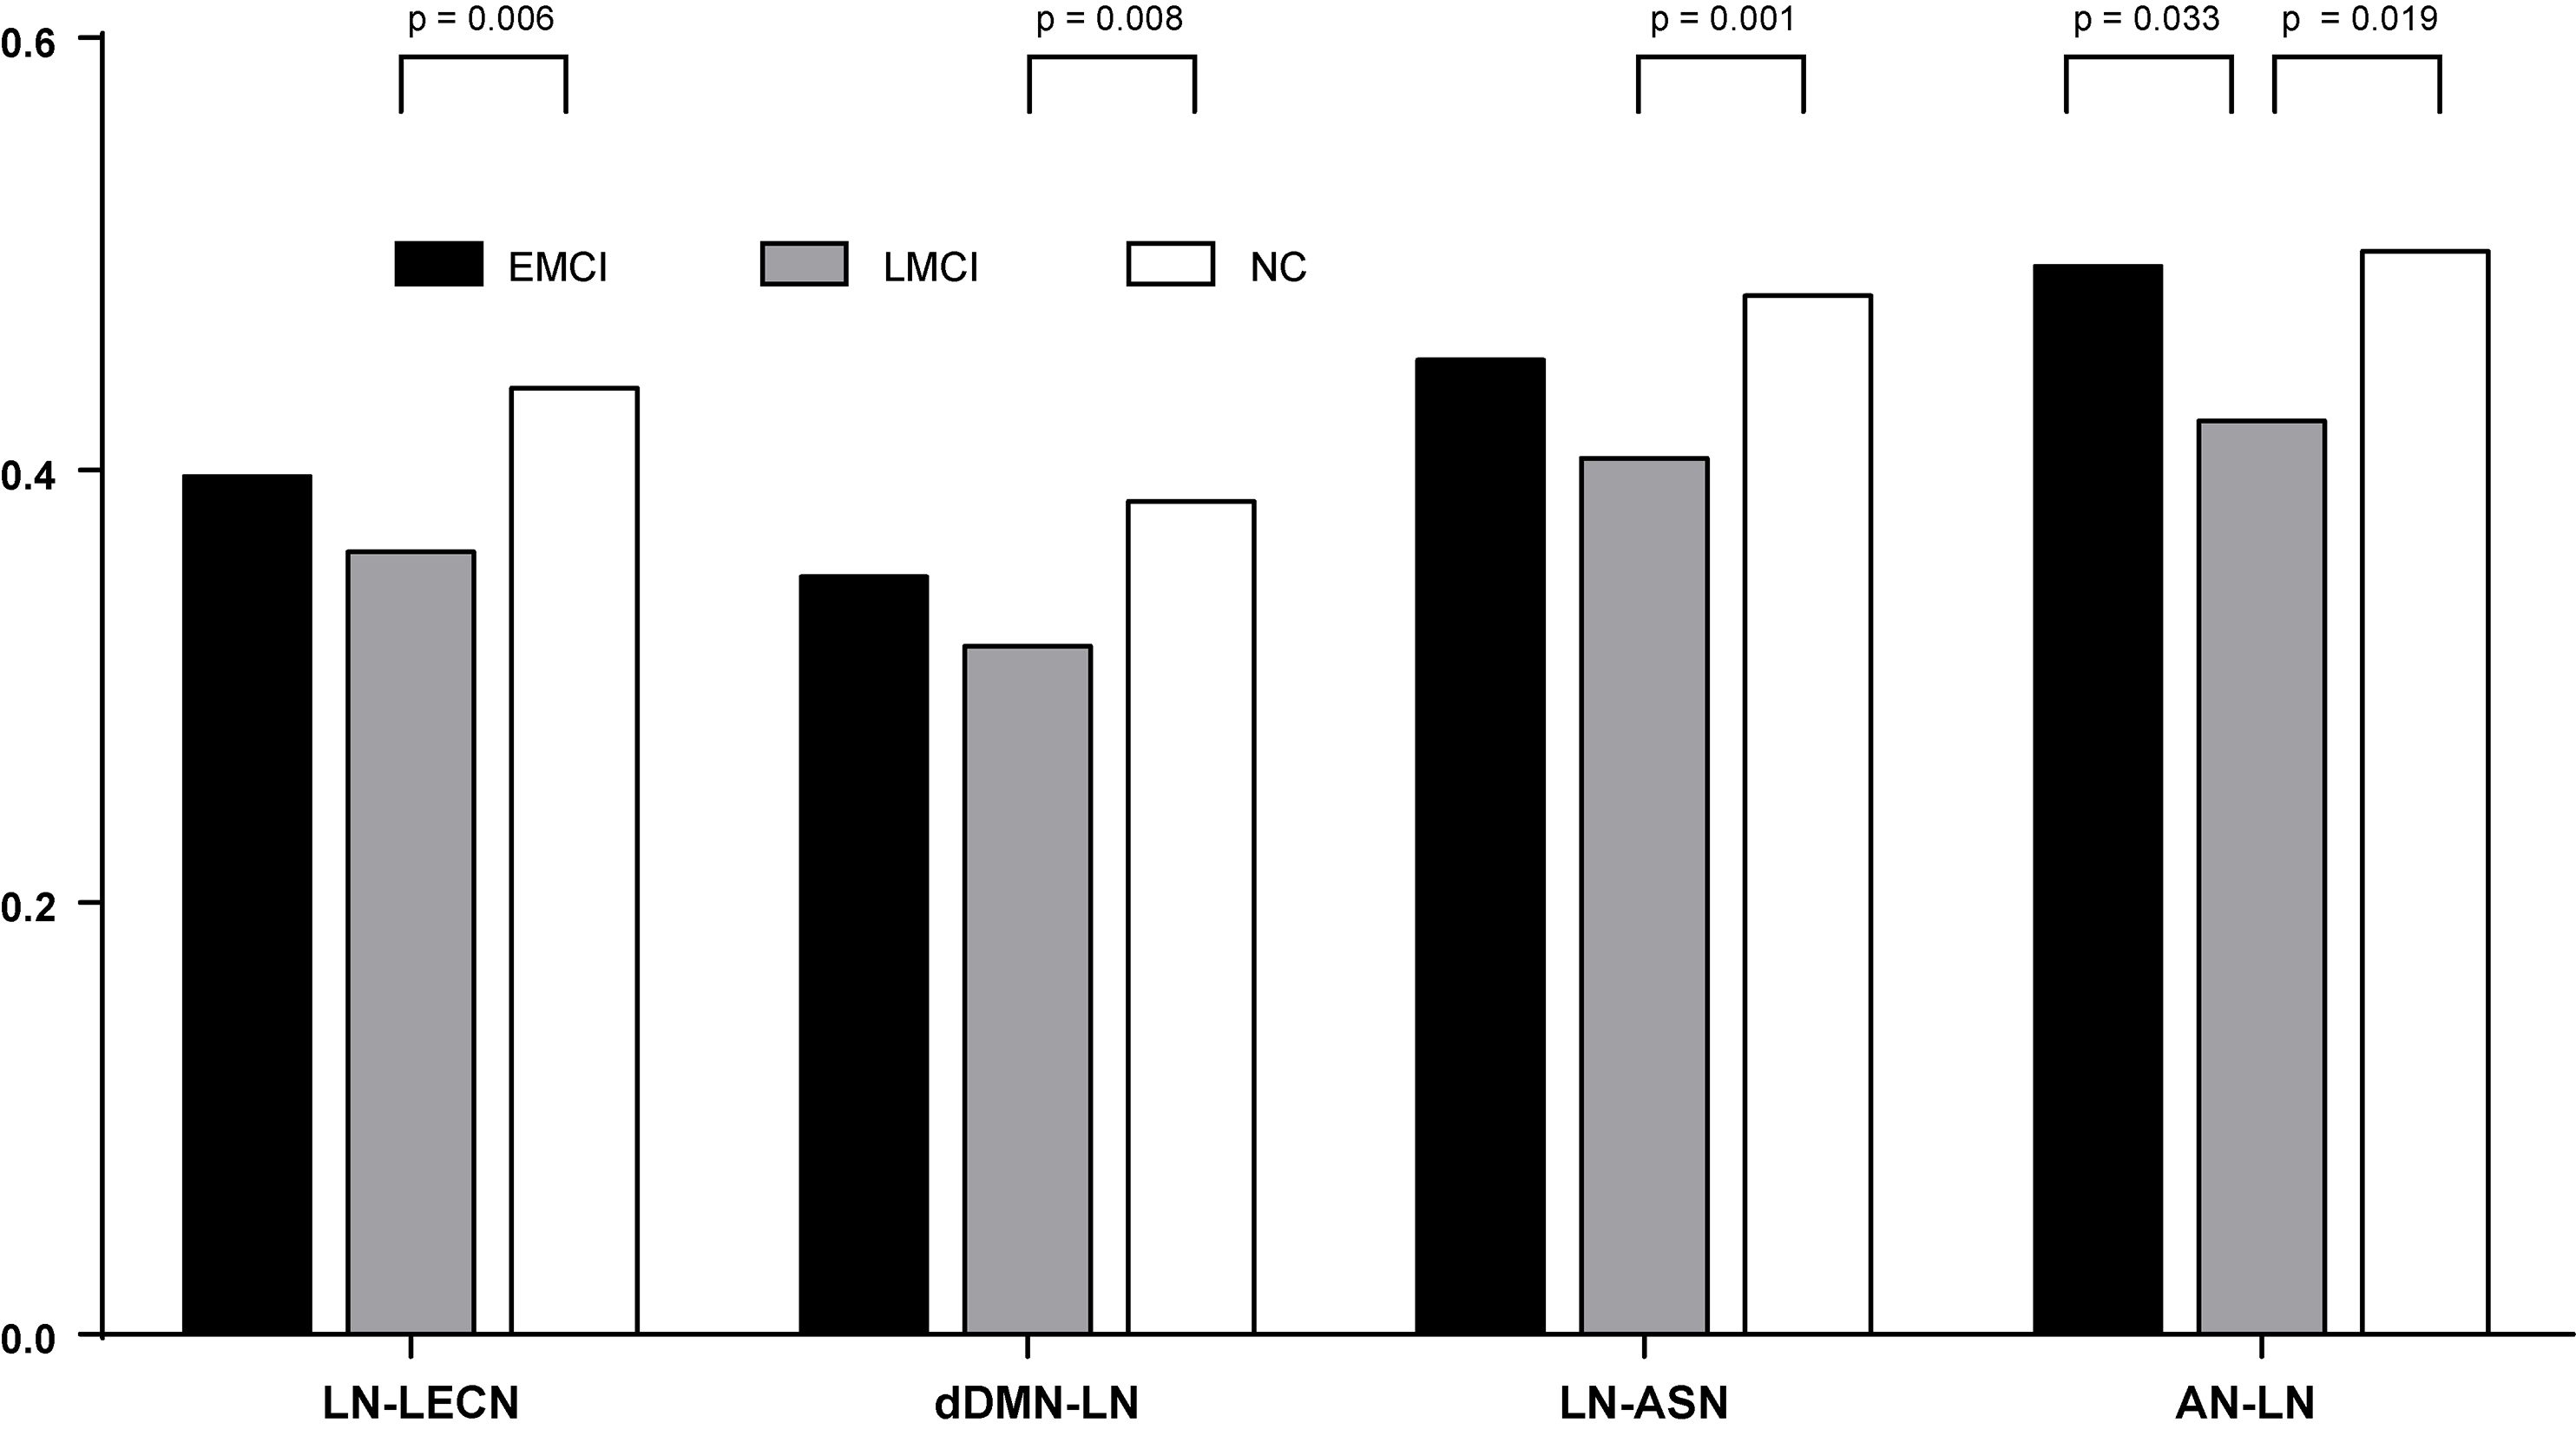
At inter-network level (Fig. 5), compared with EMCI group, the connectivity strength difference between Auditory Network and Language Network (AN-LN) was found in LMCI. Compared with NC group, several connectivity strength differences were detected in LMCI group, such as Language Network and Left Executive Control Network (LN-LECN), Dorsal Default Mode Network and Language Network (dDMN-LN), Language Network and Anterior Salience Network (LN-ASN); Auditory Network-Language Network (AN-LN).
4.Discussion
In the present study, impaired functional connectivity was detected widely in MCI which might be the basis of cognitive impairment. At node level, the differences were anchored in several networks (Figs 1–3), such as Posterior Salience Network, Language Network, dorsal Default Mode Network, Anterior Salience Network Basal Ganglia Network Left Executive Control Network, Sensorimotor Network.
At intra-network level, the significant decreases were anchored in Auditory Network (AN), Language Network (LN), Sensorimotor Network (SN) in MCI (Fig. 4). At inter-network level, the significant differences were anchored in between Auditory Network (AN) and Language Network (LN), between Language Network (LN) and Left Executive Control Network (LECN); between Dorsal Default Mode Network (dDMN) and Language Network (LN); between Language Network (LN) and Anterior Salience Network (ASN) in MCI (Fig. 5).
In this study, the altered function connectivity was detected in AN and SN, both of which were parts of SMN (sensory-motor network) [14]. Previous studies have found that the functional changes among olfaction, visual, hearing and motor systems (the major components of the SMN) might influence the onset of cognitive impairments, worsen as the disease progress, and be strong risk factors for AD [15]. The language network was anchored in Wernicke’s and Broca’s areas which was responsible for language comprehension and production. Our results provided additional convincing evidence that the dysfunction in SMN should be paid more attention.
In inter-network level, changes were aroused in between LN and LECN, as well as dDMN and LN. The Executive Control Network (ECN) was involved in goal-directed behavior and cognitive control. The DMN played a pivotal role in cognitive processes, especially in episodic memory processing [16, 17]. The impaired performance of episodic memory was one of the core features in the diagnosis of AD [18]. And the impaired functional connectivity within DMN was frequently identified in AD and MCI patients using multiple imaging techniques [18, 19, 20]. Our results also demonstrated that DMN might be one of the most affected networks in MCI patients.
Previous resting state fMRI studies demonstrated aberrant functional connectivity of DMN and SAL in AD [20, 21], aMCI [22] and even in normal cognition with amyloid burden [23]. It was suggested that the SAL was involved in the orientation of attention to the most homeostatically relevant (salient) of ongoing intrapersonal and extra personal events [24]. In this light, the present study prompted us to infer that the reduced connectivity between DMN and SAL might be one of the reasons for attention deficits in the early stages of AD and MCI.
These results provided insights into the dysfunction of more RSNs accompany the severity of subjects at high risk for AD. The aberrant intra- and inter-network dysfunctions might be potential biomarkers or predictors of MCI and AD progression.
Acknowledgments
This work was supported by Brainnetome Center; and the Shandong Province higher Educational Science and Technology Program (Nos.J15LN24, J13LN13 and J16LN10); and the Research Fund for International Cooperation Training Program of Excellent Young Teachers of Shandong Normal University; and the Primary Research and Development Plan of Shandong Province (2017GGX10112).
Conflict of interest
None to report.
References
[1] | Blennow K, de Leon MJ, Zetterberg H. Alzheimer’s disease. Lancet, (2006) , 368: : 387-403. |
[2] | Holtzman DM, Morris JC, Goate AM. The Challenge of the Second Century. Science Translational Medicine, (2011) , 3: (77): 77sr1. |
[3] | Rami L, Gomez-Anson B, Sanchez-Valle R, Bosch B, Monte GC, Llado A, Molinuevo JL. Longitudinal study of amnesic patients at high risk for Alzheimer’s disease: clinical, neuropsychological and magnetic resonance spectroscopy features. Dementia and Geriatric Cognitive Disorders, (2007) , 24: (5): 402-410. |
[4] | Petersen RC. Early diagnosis of Alzheimer’s disease: is MCI too late? Current Alzheimer Research, (2009) , 6: (4): 324-330. |
[5] | Drysdale AT, Grosenick L, Downar J, Dunlop K, Mansouri F. Resting-state connectivity biomarkers define neurophysiological subtypes of depression. Nature medicine, (2017) , 23: (1): 28-38. |
[6] | Zhang D, Raichle ME. Disease and the brain’s dark energy. Nature Reviews Neurology, (2010) , 6: (1): 15-28. |
[7] | Biswal B, Yetkin FZ, Haughton VM, Hyde JS. Functional connectivity in the motor cortex of resting human brain using echo-planar MRI. Magnetic Resonance in Medicine, (1995) , 34: (4): 537-541. |
[8] | Calhoun VD, Adali T, Pearlson GD, Pekar JJ. A method for making group inferences from functionalMRI data using independent component analysis. Human Brain Mapping, (2001) , 14: (3): 140-151. |
[9] | Beckmann CF, DeLuca M, Devlin JT, Smith SM. Investigations into resting-state connectivity using independent component analysis. Philosophical Transactions of the Royal Society B, (2005) , 360: : 1001-1013. |
[10] | Menon V. Developmental pathways to functional brain networks: emerging principles. Trends in Cognitive Sciences, (2013) , 17: (12): 627-640. |
[11] | Delbeuck X, Collette F, Van der Linden M. Is Alzheimer’s disease a disconnection syndrome? Evidence from a crossmodal audio-visual illusory experiment. Neuropsychologia, (2007) , 45: (14): 3315-3323. |
[12] | Fan L, Li H, Zhuo J, et al. The Human Brainnetome Atlas: A New Brain Atlas Based on Connectional Architecture. Cerebral Cortex, (2016) , 26: (8): 3508-3526. |
[13] | Zhan Y, Ma J, Alexander-Bloch AF, Xu K, Cui Y, Feng Q, Jiang T, Liu Y. Longitudinal study of impaired intra- and inter-network brain connectivity in subjects at high risk for Alzheimer’s disease. Journal of Alzheimer’s Disease, 52: (3): 913-927. |
[14] | Bressler SL, Menon V. Large-scale brain networks in cognition: emerging methods and principles. Trends in Cognitive Sciences, (2010) , 14: (6): 277-290. |
[15] | Devanand DP, Liu X, Tabert MH, et al. Combining early markers strongly predicts conversion from mild cognitive impairment to Alzheimer’s disease. Biological Psychiatry, (2008) , 64: (10): 871-879. |
[16] | Buckner RL, Andrewshanna JR, Schacter DL, et al. The brain’s default network: Anatomy, function, and relevance to disease. Annals of the New York Academy of Sciences, (2008) , 1124: (1124): 1-38. |
[17] | Sestieri C, Corbetta M, Romani GL, et al. Episodic memory retrieval, parietal cortex, and the default mode network: functional and topographic analyses. The Journal of Neuroscience, (2011) , 31: (12): 4407-4420. |
[18] | Dubois B, Feldman H, Jacova C, et al. Advancing research diagnostic criteria for Alzheimer’s disease: the IWG-2 criteria. Lancet Neurology, (2014) , 13: (6): 614-629. |
[19] | Zhu DC, Majumdar S, Korolev IO, et al. Alzheimer’s disease and amnestic mild cognitive impairment weaken connections within the default-mode network: a multi-modal imaging study. Journal of Alzheimer’s Disease, (2013) , 34: (4): 969-984. |
[20] | Brier MR, Thomas JB, Snyder AZ, et al. Loss of Intranetwork and Internetwork Resting State Functional Connections with Alzheimer’s Disease Progression. The Journal of Neuroscience, (2012) , 32: (26): 8890-8899. |
[21] | Agosta F, Pievani M, Geroldi C, et al. Resting state fMRI in Alzheimer’s disease: beyond the default mode network. Neurobiology of Aging, (2012) , 33: (8): 1564-1578. |
[22] | Myers N, Pasquini L, Gottler J, et al. Within-patient correspondence of amyloid-β and intrinsic network connectivity in Alzheimer’s disease. Brain, (2014) , 137: (7): 2052-2064. |
[23] | Lim HK, Nebes RD, Snitz BE, et al. Regional amyloid burden and intrinsic connectivity networks in cognitively normal elderly subjects. Brain, (2014) , 137: (12): 3327-3338. |
[24] | Eckert MA, Menon V, Walczak A, et al. At the heart of the ventral attention system: The right anterior insula. Human Brain Mapping, (2009) , 30: (8): 2530-2541. |

