
Neuropsychiatry and White Matter Microstructure in Huntington’s Disease
Abstract
Background: Neuropsychiatric symptoms in Huntington’s disease (HD) are often evident prior to clinical diagnosis. Apathy is highly correlated with disease progression, while depression and irritability occur at different stages of the disease, both before and after clinical onset. Little is understood about the neural bases of these neuropsychiatric symptoms and to what extent those neural bases are analogous to neuropsychiatric disorders in the general population.
Objective: We used Diffusion Tensor Imaging (DTI) to investigate structural connectivity between brain regions and any putative microstructural changes associated with depression, apathy and irritability in HD.
Methods: DTI data were collected from 39 premanifest and 45 early-HD participants in the Track-HD study and analysed using whole-brain Tract-Based Spatial Statistics. We used regression analyses to identify white matter tracts whose structural integrity (as measured by fractional anisotropy, FA) was correlated with HADS-depression, PBA-apathy or PBA-irritability scores in gene-carriers and related to cumulative probability to onset (CPO).
Results: For those with the highest CPO, we found significant correlations between depression scores and reduced FA in the splenium of the corpus callosum. In contrast, those with lowest CPO demonstrated significant correlations between irritability scores and widespread FA reductions. There was no significant relationship between apathy and FA throughout the whole brain.
Conclusions: We demonstrate that white matter changes associated with both depression and irritability in HD occur at different stages of disease progression concomitant with their clinical presentation.
INTRODUCTION
Huntington’s disease (HD) is a neurodegenerative disorder caused by an autosomal-dominant mutation of the CAG repeat expansion in the huntingtin gene [1]. It primarily affects the medium spiny neurons within the striatum, extending later throughout the cortex [2]. HD is monogenic and can readily be identified by predictive testing. This combined with the full penetrance and ultimate certainty of disease onset facilitates research into disease progression from its very earlystages.
The clinical phenotype of HD is characterised by motor abnormalities [3], progressive cognitive deterioration across a number of domains [4, 5], and a series of more variable neuropsychiatric changes. Despite depression, apathy and irritability all being highly prevalent in HD [6, 7], most studies have focussed principally or exclusively on motor and cognitive decline and their association with disease progression. However, apathy is clearly associated with disease progression, in terms of both severity [6, 8, 9] change over time [4, 10], and cognitive and motor decline [10, 11]. In contrast, the relationship of depression and irritability to disease progression is less well defined [7, 8]. Depressive symptoms often precede clinical onset [12] peaking during early-HD stages and diminishing as disease advances [10, 13]. The clinical features of depression are similar to those in the general population [14], but they are seemingly independent of cognitive decline [15], despite limited evidence that higher levels of depression can impact cognitive function [16]. Irritability, which is highly correlated with both impulsivity and aggression [9, 17] similarly correlates with neither disease progression [7] nor cognitive and motor decline [8, 15]. Rather there is some indication of increasing irritability in both premanifest [10, 13] and early disease stages [7, 13].
Neuroimaging has provided some insight into the neural bases underlying depression, irritability and apathy in the general population. Depression is associated with a wide network of volumetric and white matter structural abnormalities in regions including the prefrontal and parietal cortices and the corpus callosum [18], while irritability, due to the high correlation with both impulsive and aggressive behaviours, has been linked with dysfunction within ‘paralimbic’ regions, such as the ventromedial prefrontal cortex [19]. Apathy is less well characterised, but has been putatively associated with abnormal function of the frontal lobe [20]. There is, however, very little information regarding the underlying neural bases of the same neuropsychiatric disorders within HD. One study using structural imaging has demonstrated a relationship between reduced anterior cingulate volume in gene-carriers and depression scores [21] but other studies have shown no such association [22]. There is also evidence of reduced structural connectivity in frontal regions in a depressed HD group [23] and decreased prefrontal activity related to increased depression scores and reduced cognitive performance in premanifest-HD [16]. Likewise, increased irritability, has been associated with reduced amygdala activity and connectivity between brain regions involved in emotion processing and regulation [24], while apathy levels correlate with reduced structural connectivity in the rectus gyrus [25]. However, despite these findings, neurobiological evidence for neuropsychiatric symptoms in HD is both mixed and limited.
Structural MRI shows that white matter atrophy is a good marker of disease progression in early-HD and acts as an independent predictor of disease onset [4, 26, 27]. Given that white matter structure can influence local diffusion, changes in structure may manifest as changes in local diffusion of water. Diffusion Tensor Imaging (DTI) can be used to examine white matter microstructure. DTI measures orientation distribution of diffusion, with a principal outcome measure of fractional anisotropy (FA) that describes the directionality of diffusion. In HD, a pattern of congruent reductions in FA and increases in mean diffusivity (overall diffusion), acts as a marker of disease progression and predictor of onset in those very close to diagnosis [28–30]. Only two studies have specifically examined diffusion anomalies associated with neuropsychiatric disturbance in HD. The first demonstrated associations between apathy levels in HD patients and reduced white matter FA in the rectus gyrus [25], while the second compared HD diagnosed patients with and without depression [23] and demonstrated reduced FA in inferior frontal regions, the anterior cingulate, the insula and the cerebellum. However, the low median threshold used for identifying depression in this study may have resulted in a heterogeneous ‘depressed’ group.
Here, we investigated the relationship between the three most prevalent neuropsychiatric symptoms in HD (depression, apathy and irritability/aggression) and white matter microstructure in a large group of premanifest and clinically-diagnosed HD gene-carriers recruited from the final visit of the multi-site Track-HD study [4]. Given the inconsistent evidence regarding the underlying neural basis for each symptom in HD, we adopted a whole-brain DTI-analysis technique, Tract-Based Spatial Statistics (TBSS) [31]. Several studies have used TBSS in HD populations and found widespread changes in both premanifest and diagnosed gene-carriers. Since the division between premanifest and early HD is somewhat arbitrarily defined by motor onset, gene-carrier participants were analysed as a continuous group. In addition to the possible association between FA and neuropsychiatric symptoms, we also examined the relationship between neuropsychiatric measures and FA as a function of cumulative probability to onset (CPO) [32]. We specifically predicted that reduced FA in relation to CPO and neuropsychiatric measures would be evident for depression, apathy and irritability/aggression corresponding to the clinical presentation of these symptoms, with most abnormalities related to apathy and irritability found in the frontal regions. However, we also examined the whole brain to identify any associations between diffusivity and neuropsychiatric symptoms in other brain areas.
MATERIALS AND METHODS
Participant information
Forty-five HD gene carriers and thirty-nine premanifest-HD subjects who had undergone a DTI scan were recruited from the final time point of the multi-site Track-HD study [4] (see Supplementary Information). For the apathy analyses, one premanifest and two early-HD participants were excluded due to missing neuropsychiatric data. Inclusion criteria and participant recruitment have been described previously [33]. We used cumulative probability to onset (CPO), which acts as a stronger predictor of many HD phenomena both before and after the point of diagnosis [32]. The study was approved by the local ethics committees and all participants gave written informed consent according to the Declaration of Helsinki.
Neuropsychiatric measures
As part of the Track-HD study an annual interview to survey neuropsychiatric signs and symptoms associated with HD was carried out by a trained rater. The following scales were used:
Hospital Anxiety and Depression Scale (HADS)
The HADS is a 14-item self-report tool, designed to obtain a brief rating of depression and anxiety symptoms that reflects primarily mood rather than cognitive and somatic symptoms. Each item is scored on a 0–3 scale. Seven items each relate to anxiety and depression producing separate anxiety and depression sub-scores, each with a maximum of 21. The HADS provides a more quantitative measure of depression than the Problem Behaviours Assessment depression scale and is less susceptible to confounds from somatic symptoms in HD than the Beck Depression Inventory [34].
Problem Behaviours Assessment (PBA)
The short version of the PBA-s [35] is a concise version of the Problem Behaviours Assessment for HD (PBA-HD) [17]. It is a semi-structured interview designed to assess eleven psychiatric symptoms thought to be potentially most relevant to HD: low mood, suicidal ideation, anxiety, irritability, angry or aggressive behaviour, apathy, perseverative thinking or behaviour, obsessive compulsive behaviour, paranoid/delusional thinking or behaviour, hallucinations and behaviour suggesting disorientation. Individual items are scored on a five-point scale for severity and frequency respectively (previous four weeks) and multiplied for an overall score. Raters were trained, and all interviews recorded with a random subsample reviewed by an experienced rater. Factor analysis of PBA-HD data [8, 17] identified three main factors: apathy, irritability/aggression, and affective symptoms. For irritability, an integrated irritability and aggression score was used due to the high level of correlation in HD [9, 17].
Medication
Neuroleptic and antidepressant drugs are widely used to treat disturbances of mood and motor functioning in HD. As a naturalistic study of premanifest gene carriers and patients during early stage disease, participants in the Track-HD cohort were commonly using these medications, which could potentially reduce depression or irritability scores and/or worsen apathy scores. Medication use (SSRIs, SNRIs, neuroleptics, tricyclics, bupropion, benzodiazepines, anti-epileptics and tetrabenazine) was recorded in detail and used to create a binary code dependent on presence/absence of medication at the visit that may affect mood, irritability, or apathy scores.
Behavioural measures
All participants underwent a broad range of cognitive and quantitative motor tests known to be sensitive in HD. For full details see [33, 36]. In the current study, we used three tasks as markers of cognitive and motor performance. The Symbol Digit Modalities Test (SDMT) is a test of visuomotor integration, measuring visual attention and motor speed. The participant was given 90 seconds to match symbols and digits as quickly as possible, following a key located at the top of the page, and the total number of correct responses is recorded. Spot the Change is a visual working memory task in which the participant was required to view an array of five coloured squares that were presented for 250 ms. After 1000 ms a similar array was presented with one of the squares encircled. Participants decided whether the square within the circle is the same as in the original array or has changed in colour. The outcome is Cowan’s K formula for estimating the number of items encoded at each set size [37] which assesses individual differences in the flexibility of the scope of attention. During Speeded Tapping the participant placed their non-dominant hand palm down on a support surface located on the table in front of a force transducer such that they could comfortably tap on the surface with their index finger. A cuing tone was presented at 1·8 Hz and subjects were instructed to tap at the same rate as the cue and to continue tapping at this rate when the cuing tone stopped. Five trials were performed. The participant continued to tap for 10 seconds after the cuing tone ceased. Speeded Tapping Tap Duration Variability, was calculated during this period from the tap deviation from the pre-defined 1·8 Hz frequency [38].
Imaging data acquisition
Structural imaging data collection has been described previously [33]. DTI data were acquired using 3T MRI Siemens Trio (London and Paris) and Philips (Leiden) scanners (see Supplementary information for Quality Control information). Diffusion-weighted images with 42 unique gradient directions (b = 1000 sec/mm2) were collected with either seven images (Siemens) with no diffusion weighting or one image with no diffusion weighting (Phillips). For scans collected in London, dimensions were 128 pixels×96 pixels×65 slices per volume, with TE = 84 ms and TR = 7600 ms; for Paris, dimensions were 128 pixels×128 pixels×75 slices per volume, with TE = 88 ms and TR = 13100 ms and for Leiden, dimensions were 112 pixels×112 pixels×55 slices per volume, with TE = 56 ms and TR = 8078 ms. Voxel size for Siemens scans was 2×2×2 mm3 and for Phillips 1.96×1.96×2mm3.
Data analyses
Demographic, clinical and neuropsychiatric data were analysed using independent t-tests and Chi-Squared tests in SPSS v.19.0. Prior to analysis, each DTI dataset was manually scanned for artefacts, signal drop-out, and motion; quality assurance was performed after each pre-processing step. The diffusion data were pre-processed using standard pipelines within the FSL data analysis package [39]. Data were first corrected for distortions caused by eddy currents, and motion using FSL’s eddy correct and vector gradient information was updated accordingly. The no-gradient (b = 0) image was then skull-stripped using the Brain Extraction Tool (BET), manually examined, corrected if required, and diffusion-tensor fit to the corrected data. For the TBSS analysis [31], all diffusion tensor data were then registered to a customized diffusion tensor template using DTI-TK [40] to achieve optimal alignment of white matter. The customized template used diffusion tensor maps from 18 participants (three premanifest and three manifest from each site) and was created using a bootstrapping process and iterative spatial normalization. The tensor volume for each subject was then registered to the final template using linear (rigid and affine) and nonlinear registration and resliced into high-resolution (1mm3); the mean FA skeleton was generated. Using TBSS analysis, the mean FA image was thresholded to include voxels with mean FA of 0.2 and each participant’s FA data projected onto the skeleton. Using the FSL GLM Randomise tool, cross-subject statistics were performed on all voxels within the FA skeleton mask using non-parametric permutation tests (n = 5000) [41]. The premanifest and manifest participants were modelled together to investigate the main effects of each neuropsychiatric measure and CPO respectively on FA. Our primary interest, however, was the interaction between each neuropsychiatric measure and CPO on levels of FA. Confounder variables included age, sex, site and intracranial volume (ICV), which was generated as described previously [42]. All analyses were repeated to include medication use (for depression using SSRI/SNRI only; for apathy and irritability/aggression using all medication as described in the methods). Threshold-Free Cluster Enhancement (TFCE) was used for cluster identification and all results were corrected for multiple comparisons using an FWE-threshold of p < 0.05. To further understand any significant interactions, FA values were extracted for each participant using a mask containing all significant voxels thresholded at the corrected P < 0.05. Conditioning plots were generated purely for visualization purposes of significant statistical relationships. A conditioning plot consists of a series of scatterplots depicting the relationship between FA and a neuropsychiatric variable, each a function of CPO. Subsamples of the data are selected based on overlapping intervals of CPO and a linear regression curve fit for each scatterplot. Finally, using Spearman’s Rho the extracted FA values were correlated with the three measures of cognitive and motor performance using SPSS v.22.
RESULTS
Demographic and clinical measures
Table 1 shows relevant descriptive and inferential statistics for the premanifest-HD and early-HD groups. The early-HD participants were significantly older than the premanifest participants. This was expected given that HD is a progressive disease. There were no statistically significant differences in gender, education, or in the delineation of participants across site. For the gene-carrier groups, as expected, there were significant differences in CPO, but no significant difference in CAG length. Finally, there was a significant difference for irritability and apathy and a borderline significant difference for depression (See Supplementary Data for site-specific analyses).
Relationship between CPO and fractional anisotropy
We found widespread significant (corrected P < 0.05) negative correlations between CPO and FA across the whole brain in a series of white matter tracts, principally the corpus callosum (body, genu and splenium), bilateral anterior, superior and posterior corona radiata, left posterior thalamic radiation, and right superior longitudinal fasciculus. There were additional significant negative correlations between CPO and FA in the right internal capsule, the inferior longitudinal and inferior fronto-occipital fasciculi (see Supplementary Data: Table 1 and Fig. 1).
Relationship between neuropsychiatric measures and fractional anisotropy
HADS depression
There were no significant correlations between HADS depression scores and FA across the whole brain (corrected P > 0.05). There was a significant association between FA and the HADS depression scores as CPO varied that was localized to the body and the splenium of the corpus callosum (corrected P = 0.014 for right, P = 0.009 for left) (Table 2; Fig. 1a). For higher CPO, FA decreased as HADS depression increased; this negative relationship diminished for lower CPO (Fig. 1b). These results remained significant when controlling for the effects of SSRI/SNRI medication (corrected P < 0.05) (See Supplementary Data for site-specific analyses).
PBA irritability/aggression
There were significant negative correlations between irritability/aggression scores and FA across the whole brain; these were located in the left hemisphere only (corrected P < 0.05). Tracts that demonstrated such a correlation were the body of the corpus callosum and fornix, the retrolenticular and posterior limb of the internal capsule, the external capsule, the posterior and superior corona radiate, the posterior thalamic radiation and the inferior fronto-occipital, inferior longitudinaland superior longitudinal fasciculi. There were no positive correlations between FA and irritability/aggression scores across the whole brain (corrected P < 0.05). There was a significant association between FA and the irritability/aggression scores as CPO varied (corrected P < 0.05). Again this was widespread across the brain in the same white matter regions in which we saw negative correlations between irritability/aggression and FA (Table 3; Fig. 2a). For lower CPO, FA decreased as PBA irritability/aggression scores increased; this negative relationship was reversed as CPO increased (Fig. 2b). These results remained significant when controlling for the effects of all medication (corrected P < 0.05). We predicted that elevated irritability/aggression would be associated with frontal white matter anomalies. Thus, we examined white matter changes in the frontal lobe at an uncorrected threshold and identified similar negative correlations in the left uncinate fasciculus (uncorrected P < 0.001) (See Supplementary Data for site-specific analyses).
PBA apathy
There were no significant overall correlations between PBA apathy scores and FA, and no significant interaction of CPO that affected this relationship (corrected P < 0.05). This remained the case when controlling for the effects of all medication. We predicted that elevated apathy would be associated with frontal white matter anomalies. Therefore, we further investigated this area at an uncorrected level of P < 0.001. However, even at this more liberal threshold no significant associations were identified for the simple relationship between apathy and FA or as a function of CPO (See Supplementary Data for site-specific analyses).
Correlations between behaviour and FA
There were positive correlations between FA values for the Depression-CPO interaction and SDMT (r = 0.453, p = 0.001) and Spot the Change (r = 0.310, p = 0.004). This indicates that in those HD gene-carriers with higher levels of depression and who are closer to onset (Fig. 1b) cognitive performance declined as FA decreases. There was also a significant negative relationship between speeded tapping duration and FA values for the Depression-CPO interaction (r = –0.376, p = 0.001), which likewise shows that motor performances worsened as FA decreased in those with higher levels of depression. There were congruent positive correlations between FA values for the Irritability/Aggression-CPO interaction and SDMT (r = 0.409, p = 0.001) and Spot the Change (r = 0.285, p = 0.009). Similarly to depression, this indicates that in those HD gene-carriers with higher levels of irritability/aggression and who are further from onset (Fig. 2b) cognitive performance declined as white matter abnormalities increase. However, there was no significant relationship between speeded tapping and FA values for the Irritability/Aggression-CPO interaction (r = –0.163, p = 0.140).
DISCUSSION
This is the first study to use multi-site diffusion imaging data to investigate relationships between neuropsychiatric symptoms and white matter microstructural change in a large cohort of premanifest and clinically-diagnosed HD gene-carriers. We demonstrated that both depression and irritability scores were associated with widespread changes in FA, conditional on CPO. FA decreased as both depression symptoms increased in those with high CPO, FA also decreased as irritability/aggression symptoms increased, but only in those with low CPO. We found no relationship between apathy and diffusivity.
Depressive symptoms are highly prevalent in HD, occurring in 40–50% of gene carriers [7], but their timecourse in terms of disease progression is less well understood. Symptoms seem to emerge most significantly in the premanifest and early diagnosis stages, but do not change significantly over time [7, 10, 13]. In the current study, the highest level of disease severity is that of Stage 2 [43], equivalent to the mild to moderate stages of clinically-diagnosed HD. We have shown that in those with high CPO, deterioration of white matter microstructure within the corpus callosum is associated with increased levels of depressive symptoms. This supports existing evidence that those with early stage disease are most impacted by depression and further suggests that this may be underscored by localized changes in white matter microstructure. Although in the current study we have used CPO, a measure of predicted disease severity, rather than total functional capacity (TFC), a measure of actual disease severity, the strong relationship between these two measures [4] validates its use here. Similarly, there is limited evidence to suggest that irritability/aggression is robustly related to disease progression [7, 8, 10], but there are indications that it is observed prior to other neuropsychiatric symptoms in premanifest gene-carriers [8, 10, 13]. We have shown that in those with low CPO (nominally furthest from clinical onset) widespread changes in white matter microstructure are associated with increased levels of irritability/aggression. This relationship diminishes in those with the highest CPO. This again supports existing clinical evidence that high levels of irritability/aggression are evident in those furthest from disease onset and that these changes are underscored by widespread decreases in white matter microstructural organization.
Depression-related decreases in FA were located mainly within the posterior corpus callosum. This region facilitates interhemispheric communication and given its connectivity to all four lobes is involved in the transference of motor, sensory and cognitive information. Changes in white matter structure throughout the brain including that of the corpus callosum are common in depression in the general population [44] and it is a structure that degenerates throughout the time course of HD [45]. Interestingly, the white matter changes we found were isolated to the more posterior body and splenium of the callosum which also show abnormalities in depressive disorders [46, 47] and are consistent with reported microstructural degeneration in HD [45]. This is perhaps unsurprising given the evidence for early wholesale cortical white matter degeneration in the posterior cortex, which later extends more widely to involve midline and frontal regions [48]. Grey matter atrophy may also begin in the posterior, occipital regions, albeit at a much slower rate than in white matter [48]. Thus, despite indications that depressive symptomatology does not differ considerably from those of depression per se [14], changes at the microstructural level suggest that depression may be more associated with the white matter changes characteristic of HD progression. Furthermore, a decline in both motor and cognitive performance was associated with decreased FA values in those with higher levels of depression suggesting that the depression may be associated more globally with disease progression. This speculation should be clarified in future work explicitly comparing HD participants with depressive symptoms with matched depressed non-HD control participants. Interestingly, in a previous study, increased Stroop- interference related activity in the ventromedial prefrontal cortex was associated with an increase in depression scores in premanifest HD [49]. It was suggested that this may reflect changes in network activity in the anterior regions of the brain. These functional connectivity changes are compatible with our findings in which structural degeneration associated with higher levels of depression occurs in more posterior white matter tracts. Given that the previous study investigated only premanifest HD participants, however, we cannot comment on the extent to which observed functional connectivity changes are comparable in the early disease stage.
Unlike depression, irritability/aggression is underscored by more specific morphological changes, which, given the close association with impulsive behaviour, occur in ventromedial prefrontal, medial temporal regions [50]. In the current study, there was some evidence of microstructural change in frontal connections at an uncorrected threshold, but it was changes in posterior tracts relating to irritability/aggression levels that were most prevalent and widespread. This suggests that elevated levels of irritability and aggression that arise in HD may be due not to impulsive traits but instead to cognitive overload. Situations in which an individual becomes cognitively overstretched can lead to increased irritability. This might be particularly true for those with early symptom onset, such that as executive function begins to deteriorate, irritability levels rise. This is supported by robust evidence of irritability in those up to 10 years prior to onset [13]. To test this further, we investigated the relationship between FA and three cognitive and motor performance markers that are robustly sensitive to HD progression [4]. Both SDMT and Spot the Change performance were positively associated with FA values for the irritability/aggression interaction indicating that those with high irritability, who were furthest from onset, showed decreased global FA and a corresponding decline in cognitive performance. Furthermore, this relationship was not significant for speeded tapping performance and thus specific to cognitive behaviour. We have shown that not only does irritability occur in those with lower CPO but that this is underscored by changes in white matter microstructure characteristic of HD progression. This is further reinforced by the fact that all abnormalities associated with irritability/aggression were located within tracts in the left hemisphere. The left hemisphere appears to degenerate first, with evidence of right-hemisphere compensation behaviour during task-based fMRI and in resting state networks of global cognition [51]. Left hemisphere degeneration may also motivate neuropsychiatric symptomatology.
Apathy is the neuropsychiatric symptom most robustly associated with disease progression [4, 7–10] and cognitive and motor dysfunction [10, 11, 15]. In the current study, however, there was no discernible relationship between apathy and white matter change; even when controlling for the effects of medication. A previous study using data form the Track-HD study shows a negative relationship between apathy and the rectus gyrus using region of interest analyses [25]. However, that previous study used only single site data from the first timepoint of the study. Grey matter degeneration tends to be preceded by that of white matter; given the robust association of apathy and disease progression, it is possible that apathy in HD is related not to white matter microstructural changes but instead to that of grey matter. It is important to remember that there may be an inherent bias within the current sample given that those with the lowest levels of apathy may be most likely to participate in such a study; those with the most profound apathy and possibly most profound changes in brain structure may be absent.
It is important to note that volumetric loss is probably the most established measure of change within the brain during the premanifest HD stage. In the current study, we used DTI data from the 36-month timepoint of the Track-HD study and information regarding structural change within this cohort has already been published in previous Track-HD articles [4, 33, 48, 52]. In the current study, we chose a non-morphological measure of disease progression, as changes in structural volume, either for the striatum or whole brain reflect more directly the neurodegenerative pathology associated with HD progression. It is, therefore, possible that an association between brain volume, white matter microstructural change and neuropsychiatric scores would be confounded by this (see Supplementary Data for further information).
There are some limitations of the current study. Using data from multiple sites can introduce possible site effects. However, strict quality control procedures were conducted at each site to ensure consistency across scans and all data were visually inspected for potential site-specific artefacts. Furthermore, site was also included within the statistical model. We also performed analyses on data from each site independently for both neuropsychiatric scores and FA change (see Supplementary Data). The large numbers within the Track-HD cohort and the high levels of quality assurance and standardization of protocols and pipelines, in addition to the enhanced registration suggest that the findings within this study are robust. Neuropsychiatric symptoms can be difficult to quantify. However, through training, quality control and high inter-rater reliability it has been shown that scores can be reliably measured [35].
This is the first study to use multi-site DTI data to investigate the relationship between white matter microstructure and neuropsychiatric disturbance in both premanifest and early-HD participants. We have demonstrated congruent increases in depression symptoms and decreases in FA in those with high CPO. Similarly, we have also shown that increases in irritability are associated with higher levels of FA in those with low CPO and therefore, furthest from onset. These findings are compatible with the clinical timecourse of neuropsychiatric symptoms and indicate that white matter changes may impact their onset in different ways. These findings are highly relevant in extending our understanding of changes in white matter microstructure and its potential impact on the onset and duration of neuropsychiatric symptoms in HD.
CONFLICT OF INTEREST
There are no conflicts of interest.
TRACK-HD INVESTIGATORS
Australia C Campbell, M Campbell, I Labuschagne, C Milchman (Monash University, Melbourne, VIC). Canada A Coleman, R Dar Santos, J Decolongon, A Sturrock (University of British Columbia, Vancouver, BC). France C Jauffret, D Justo, S Lehericy, C Marelli, K Nigaud, R Valabrègue (ICM Institute, Paris). Germany N Bechtel, S Bohlen (University of Münster, Münster). Netherlands S J A van den Bogaard, E M Dumas, J van der Grond, E P ‘t Hart (Leiden University Medical Center, Leiden). UK N Arran, J Callaghan, C Stopford (University of Manchester, Manchester); D M Cash (IXICO, London); H Crawford, N C Fox, N Z Hobbs, N Lahiri, I Malone, J Read, M J Say, D Whitehead, E Wild (University College London, London); R Jones (London School of Hygiene and Tropical Medicine, London). USA E Axelson (University of Iowa, IA), S Queller, C Campbell (Indiana University, IN).
ACKNOWLEDGMENTS
Track-HD is funded by the CHDI foundation, a not for profit organization dedicated to finding treatments for Huntington’s disease, the Wellcome Trust (GR), and the Medical Research Council (SJT).
We thank the TRACK-HD study participants and their families, and also acknowledge the support of the National Institute for Health Research University College London Hospitals Biomedical Research Centre and the Manchester Biomedical Research Centre.
All authors have contributed to the work, agree with the presented findings, and that the work has not been published before nor is being considered for publication in another journal.
Appendices
The supplementary table and figure are available in the electronic version of this article: http://dx.doi.org/10.3233/JHD-150160.
REFERENCES
1 | Ross CA, Tabrizi SJ(2011) Huntington’s disease: From molecular pathogenesis to clinical treatmentLancet Neurol10: 18398 |
2 | Vonsattel JP(2008) Huntington disease models and human neuropathology: Similarities and differencesActa Neuropathol115: 15569 |
3 | (1996) Unified Huntington’s Disease Rating Scale: Reliability and consistency. Huntington study groupMov Disord11: 2136142 |
4 | Tabrizi SJ, Scahill RI, Owen G, Durr A, Leavitt BR, Roos RA(2013) Predictors of phenotypic progression and disease onset in premanifest and early-stage Huntington’s disease in the TRACK-HD study: Analysis of 36-month observational dataLancet Neurol12: 7637649 |
5 | Stout JC, Paulsen JS, Queller S, Solomon AC, Whitlock KB, Campbell JC(2011) Neurocognitive signs in prodromal Huntington diseaseNeuropsychology25: 1114 |
6 | Craufurd D, Snowden J(2002) Neuropsychological and neuropsychiatric aspects of Huntington’s DiseaseHuntington’s DiseaseBates GP, Harper P, Jones L3rd ed6294Oxford University Press |
7 | van Duijn E, Craufurd D, Hubers AA, Giltay EJ, Bonelli R, Rickards H(2014) Neuropsychiatric symptoms in a European Huntington’s disease cohort (REGISTRY)J Neurol Neurosurg Psychiatry10.1136/jnnp-2013-307343 |
8 | Kingma EM, van Duijn E, Timman R, van der Mast RC, Roos RA(2008) Behavioural problems in Huntington’s disease using the Problem Behaviours AssessmentGen Hosp Psychiatry30: 2155161 |
9 | Rickards H, De Souza J, van Walsem M, van Duijn E, Simpson SA, Squitieri F(2011) Factor analysis of behavioural symptoms in Huntington’s diseaseJ Neurol Neurosurg Psychiatry82: 4411412 |
10 | Thompson JC, Harris J, Sollom AC, Stopford CL, Howard E, Snowden JS(2012) Longitudinal evaluation of neuropsychiatric symptoms in Huntington’s diseaseJ Neuropsychiatry Clin Neurosci24: 15360 |
11 | Reedeker N, Bouwens JA, van Duijn E, Giltay EJ, Roos RA, van der Mast RC(2011) Incidence, course, and predictors of apathy in Huntington’s disease: A two-year prospective studyJ Neuropsychiatry Clin Neurosci23: 4434441 |
12 | Duff K, Paulsen JS, Beglinger LJ, Langbehn DR, Stout JC, Predict HDIotHSG(2007) Psychiatric symptoms in Huntington’s disease before diagnosis: The predict-HD studyBiol Psychiatry62: 1213411346 |
13 | Julien CL, Thompson JC, Wild S, Yardumian P, Snowden JS, Turner G(2007) Psychiatric disorders in preclinical Huntington’s diseaseJ Neurol Neurosurg Psychiatry78: 9939943 |
14 | Scaria J, Craufurd D(2014) Clinical features of depression in Huntington’s disease-a cross sectional study comparing the clinical features of depression in patients with Huntington’s disease and in patients without huntington’s diseaseJ Neurol Neurosurg Psychiatry85: 8e3 |
15 | Baudic S, Maison P, Dolbeau G, Boisse MF, Bartolomeo P, Dalla Barba G(2006) Cognitive impairment related to apathy in early Huntington’s diseaseDement Geriatr Cogn Disord21: 5-6316321 |
16 | Gray MA, Egan GF, Ando A, Churchyard A, Chua P, Stout JC(2013) Prefrontal activity in Huntington’s disease reflects cognitive and neuropsychiatric disturbances: The IMAGE-HD studyExp Neurol239: 218228 |
17 | Craufurd D, Thompson JC, Snowden JS(2001) Behavioral changes in Huntington DiseaseNeuropsychiatry Neuropsychol Behav Neurol14: 4219226 |
18 | Liao Y, Huang X, Wu Q, Yang C, Kuang W, Du M(2013) Is depression a disconnection syndrome? Meta-analysis of diffusion tensor imaging studies in patients with MDDJ Psychiatry Neurosci38: 14956 |
19 | Blair RJ(2007) The amygdala and ventromedial prefrontal cortex in morality and psychopathyTrends Cogn Sci11: 9387392 |
20 | Levy R, Dubois B(2006) Apathy and the functional anatomy of the prefrontal cortex-basal ganglia circuitsCereb Cortex16: 7916928 |
21 | Hobbs NZ, Pedrick AV, Say MJ, Frost C, Dar Santos R, Coleman A(2011) The structural involvement of the cingulate cortex in premanifest and early Huntington’s diseaseMov Disord26: 916841690 |
22 | Jurgens CK, van de Wiel L, van Es AC, Grimbergen YM, Witjes-Ane MN, van der Grond J(2008) Basal ganglia volume and clinical correlates in ‘preclinical’ Huntington’s diseaseJ Neurol255: 1117851791 |
23 | Sprengelmeyer R, Orth M, Muller HP, Wolf RC, Gron G, Depping MS(2014) The neuroanatomy of subthreshold depressive symptoms in Huntington’s disease: A combined diffusion tensor imaging (DTI) and voxel-based morphometry (VBM) studyPsychol Med44: 918671878 |
24 | Kloppel S, Stonnington CM, Petrovic P, Mobbs D, Tuscher O, Craufurd D(2010) Irritability in pre-clinical Huntington’s diseaseNeuropsychologia48: 2549557 |
25 | Delmaire C, Dumas EM, Sharman MA, van den Bogaard SJ, Valabregue R, Jauffret C(2013) The structural correlates of functional deficits in early huntington’s diseaseHum Brain Ma34: 921412153 |
26 | Aylward EH, Nopoulos PC, Ross CA, Langbehn DR, Pierson RK, Mills JA(2011) Longitudinal change in regional brain volumes in prodromal Huntington diseaseJ Neurol Neurosurg Psychiatry82: 4405410 |
27 | Paulsen JS, Nopoulos PC, Aylward E, Ross CA, Johnson H, Magnotta VA(2010) Striatal and white matter predictors of estimated diagnosis for Huntington diseaseBrain Res Bull82: 3-4201207 |
28 | Novak MJ, Seunarine KK, Gibbard CR, Hobbs NZ, Scahill RI, Clark CA(2014) White matter integrity in premanifest and early Huntington’s disease is related to caudate loss and disease progressionCortex52: 398112 |
29 | Bohanna I, Georgiou-Karistianis N, Sritharan A, Asadi H, Johnston L, Churchyard A(2011) Diffusion tensor imaging in Huntington’s disease reveals distinct patterns of white matter degeneration associated with motor and cognitive deficitsBrain Imaging Behav5: 3171180 |
30 | Dumas EM, van den Bogaard SJ, Ruber ME, Reilman RR, Stout JC, Craufurd D(2012) Early changes in white matter pathways of the sensorimotor cortex in premanifest Huntington’s diseaseHum Brain Ma33: 1203212 |
31 | Smith SM, Jenkinson M, Johansen-Berg H, Rueckert D, Nichols TE, Mackay CE(2006) Tract-based spatial statistics: Voxelwise analysis of multi-subject diffusion dataNeuroimage31: 414871505 |
32 | Langbehn DR, Brinkman RR, Falush D, Paulsen JS, Hayden MRInternational Huntington’s Disease Collaborative G(2004) A new model for prediction of the age of onset and penetrance for Huntington’s disease based on CAG lengthClin Genet65: 4267277 |
33 | Tabrizi SJ, Langbehn DR, Leavitt BR, Roos RA, Durr A, Craufurd D(2009) Biological and clinical manifestations of Huntington’s disease in the longitudinal TRACK-HD study: Cross-sectional analysis of baseline dataLancet Neurol8: 9791801 |
34 | De Souza J, Jones LA, Rickards H(2010) Validation of self-report depression rating scales in Huntington’s diseaseMov Disord25: 19196 |
35 | Callaghan J, Stopford C, Arran N, Boisse MF, Coleman A, Santos RD(2015) Reliability and factor structure of the short problem behaviors assessment for Huntington’s disease (PBA-s) in the TRACK-HD and REGISTRY studiesJ Neuropsychiatry Clin Neurosci27: 15964 |
36 | Stout JC, Jones R, Labuschagne I, O’Regan AM, Say MJ, Dumas EM(2012) Evaluation of longitudinal 12 and 24 month cognitive outcomes in premanifest and early Huntington’s diseaseJ Neurol Neurosurg Psychiatry83: 7687694 |
37 | Cowan N(2001) The magical number 4 in short-term memory: A reconsideration of mental storage capacity24: 187114discussion -85 |
38 | Bechtel N, Scahill RI, Rosas HD, Acharya T, van den Bogaard SJ, Jauffret C(2010) Tapping linked to function and structure in premanifest and symptomatic Huntington diseaseNeurology75: 2421502160 |
39 | Smith SM, Jenkinson M, Woolrich MW, Beckmann CF, Behrens TE, Johansen-Berg H(2004) Advances in functional and structural MR image analysis and implementation as FSLNeuroimage23 SupplS1: 208219 |
40 | Zhang H, Yushkevich PA, Alexander DC, Gee JC(2006) Deformable registration of diffusion tensor MR images with explicit orientation optimizationMed Image Anal10: 5764785 |
41 | Winkler AM, Ridgway GR, Webster MA, Smith SM, Nichols TE(2014) Permutation inference for the general linear modelNeuroimage92: 381397 |
42 | Whitwell JL, Crum WR, Watt HC, Fox NC(2001) Normalization of cerebral volumes by use of intracranial volume: Implications for longitudinal quantitative MR imagingAJNR Am J Neuroradiol22: 814831489 |
43 | Paulsen JS, Nehl C, Hoth KF, Kanz JE, Benjamin M, Conybeare R(2005) Depression and stages of Huntington’s diseaseJ Neuropsychiatry Clin Neurosci17: 4496502 |
44 | Cole J, Chaddock CA, Farmer AE, Aitchison KJ, Simmons A, McGuffin P(2012) White matter abnormalities and illness severity in major depressive disorderBr J Psychiatry201: 13339 |
45 | Phillips O, Sanchez-Castaneda C, Elifani F, Maglione V, Di Pardo A, Caltagirone C(2013) Tractography of the corpus callosum in Huntington’s diseasePloS One8: 9e73280 |
46 | Lacerda AL, Brambilla P, Sassi RB, Nicoletti MA, Mallinger AG, Frank E(2005) Anatomical MRI study of corpus callosum in unipolar depressionJ Psychiatric Res39: 4347354 |
47 | Ballmaier M, Kumar A, Elderkin-Thompson V, Narr KL, Luders E, Thompson PM(2008) Mapping callosal morphology in early- and late-onset elderly depression: An index of distinct changes in cortical connectivityNeuropsychopharmacology33: 715281536 |
48 | Tabrizi SJ, Reilmann R, Roos RA, Durr A, Leavitt B, Owen G(2012) Potential endpoints for clinical trials in premanifest and early Huntington’s disease in the TRACK-HD study: Analysis of 24 month observational dataLancet Neurol11: 14253 |
49 | Unschuld PG, Joel SE, Pekar JJ, Reading SA, Oishi K, McEntee J(2012) Depressive symptoms in prodromal Huntington’s Disease correlate with Stroop-interference related functional connectivity in the ventromedial prefrontal cortexPsychiatry Res203: 2-3166174 |
50 | Blair RJ(2010) Psychopathy, frustration, and reactive aggression: The role of ventromedial prefrontal cortexBr J Psychol101: Pt 3383399 |
51 | Kloppel S, Gregory S(2015) Compensation in preclinical Huntington’s disease: Evidence from the Track-On HD studyEBioMedicine10.1016/j.ebiom.2015.08.002 |
52 | Tabrizi SJ, Scahill RI, Durr A, Roos RA, Leavitt BR, Jones R(2011) Biological and clinical changes in premanifest and early stage Huntington’s disease in the TRACK-HD study: the 12-month longitudinal analysisLancet Neurol10: 13142 |
Figures and Tables
Fig.1
Tracts in which reduced FA was correlated with increased levels of depression in those with high CPO; FWE -corrected threshold of P < 0.05. a) Results (red-yellow) are projected on a white matter skeleton (green), overlaid on a customized mean FA image. b) FA as a function of HADS depression (lower scatterplots), conditional on CPO (upper panel). The upper panel depicts the overlapping ranges of CPO that determine the subsample of each scatterplot. A linear regression line was fit for each scatterplot to aid interpretation.
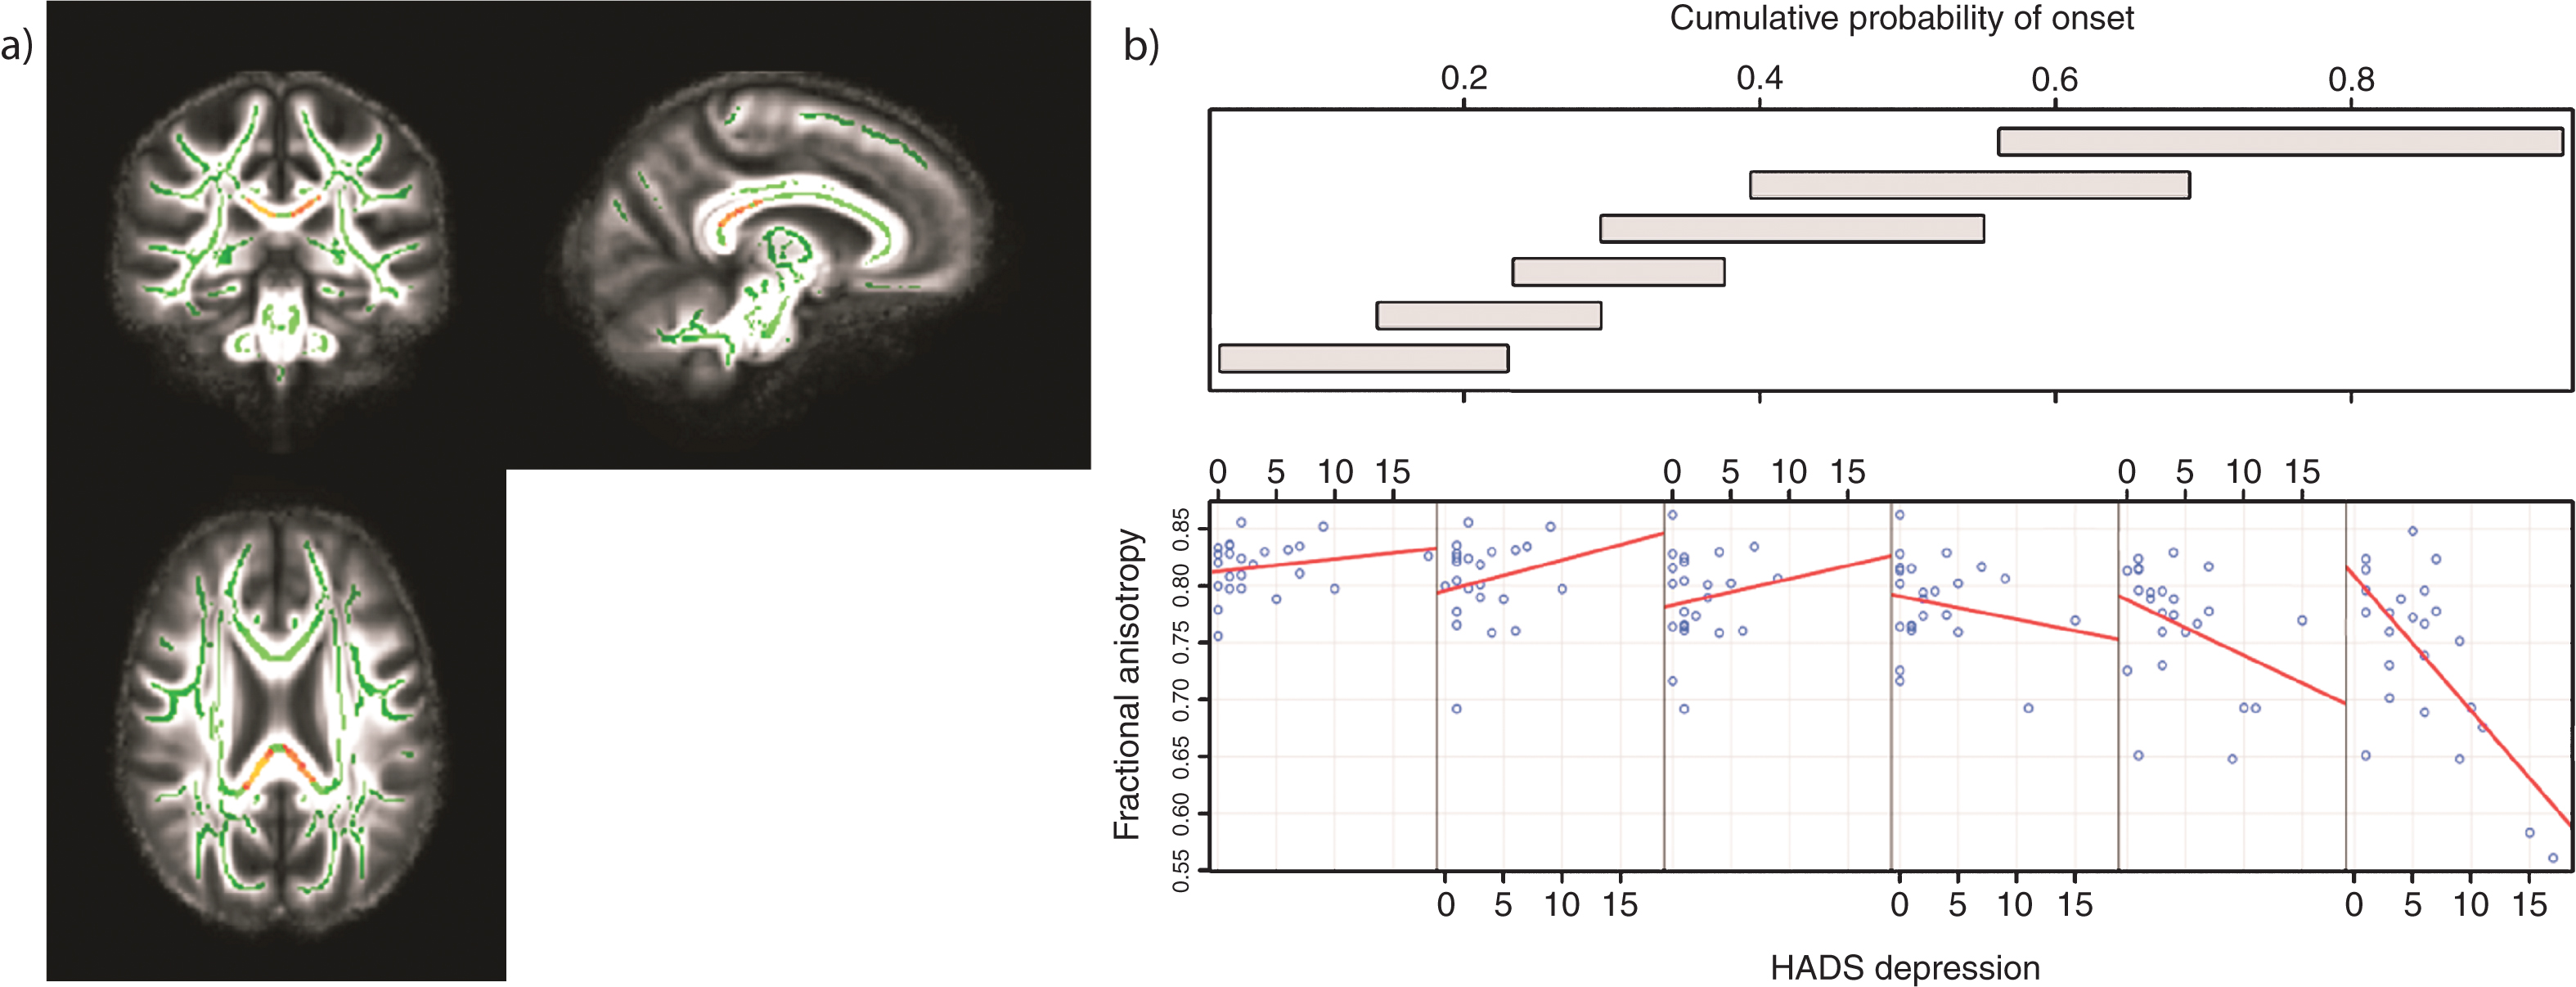
Fig.2
Tracts in which reduced FA was correlated with increased levels of irritability/aggression in those with low CPO; FWE-corrected threshold of P < 0.05. a) Results (red-yellow) are projected on a white matter skeleton (green), overlaid on a customized mean FA image. FA as a function of PBA irritability/aggression (lower scatterplot), conditional on CPO (upper panel). The upper panel depicts the overlapping ranges of CPO that determine the subsample of each scatterplot. A linear regression line was fit for each scatterplot to aid interpretation.
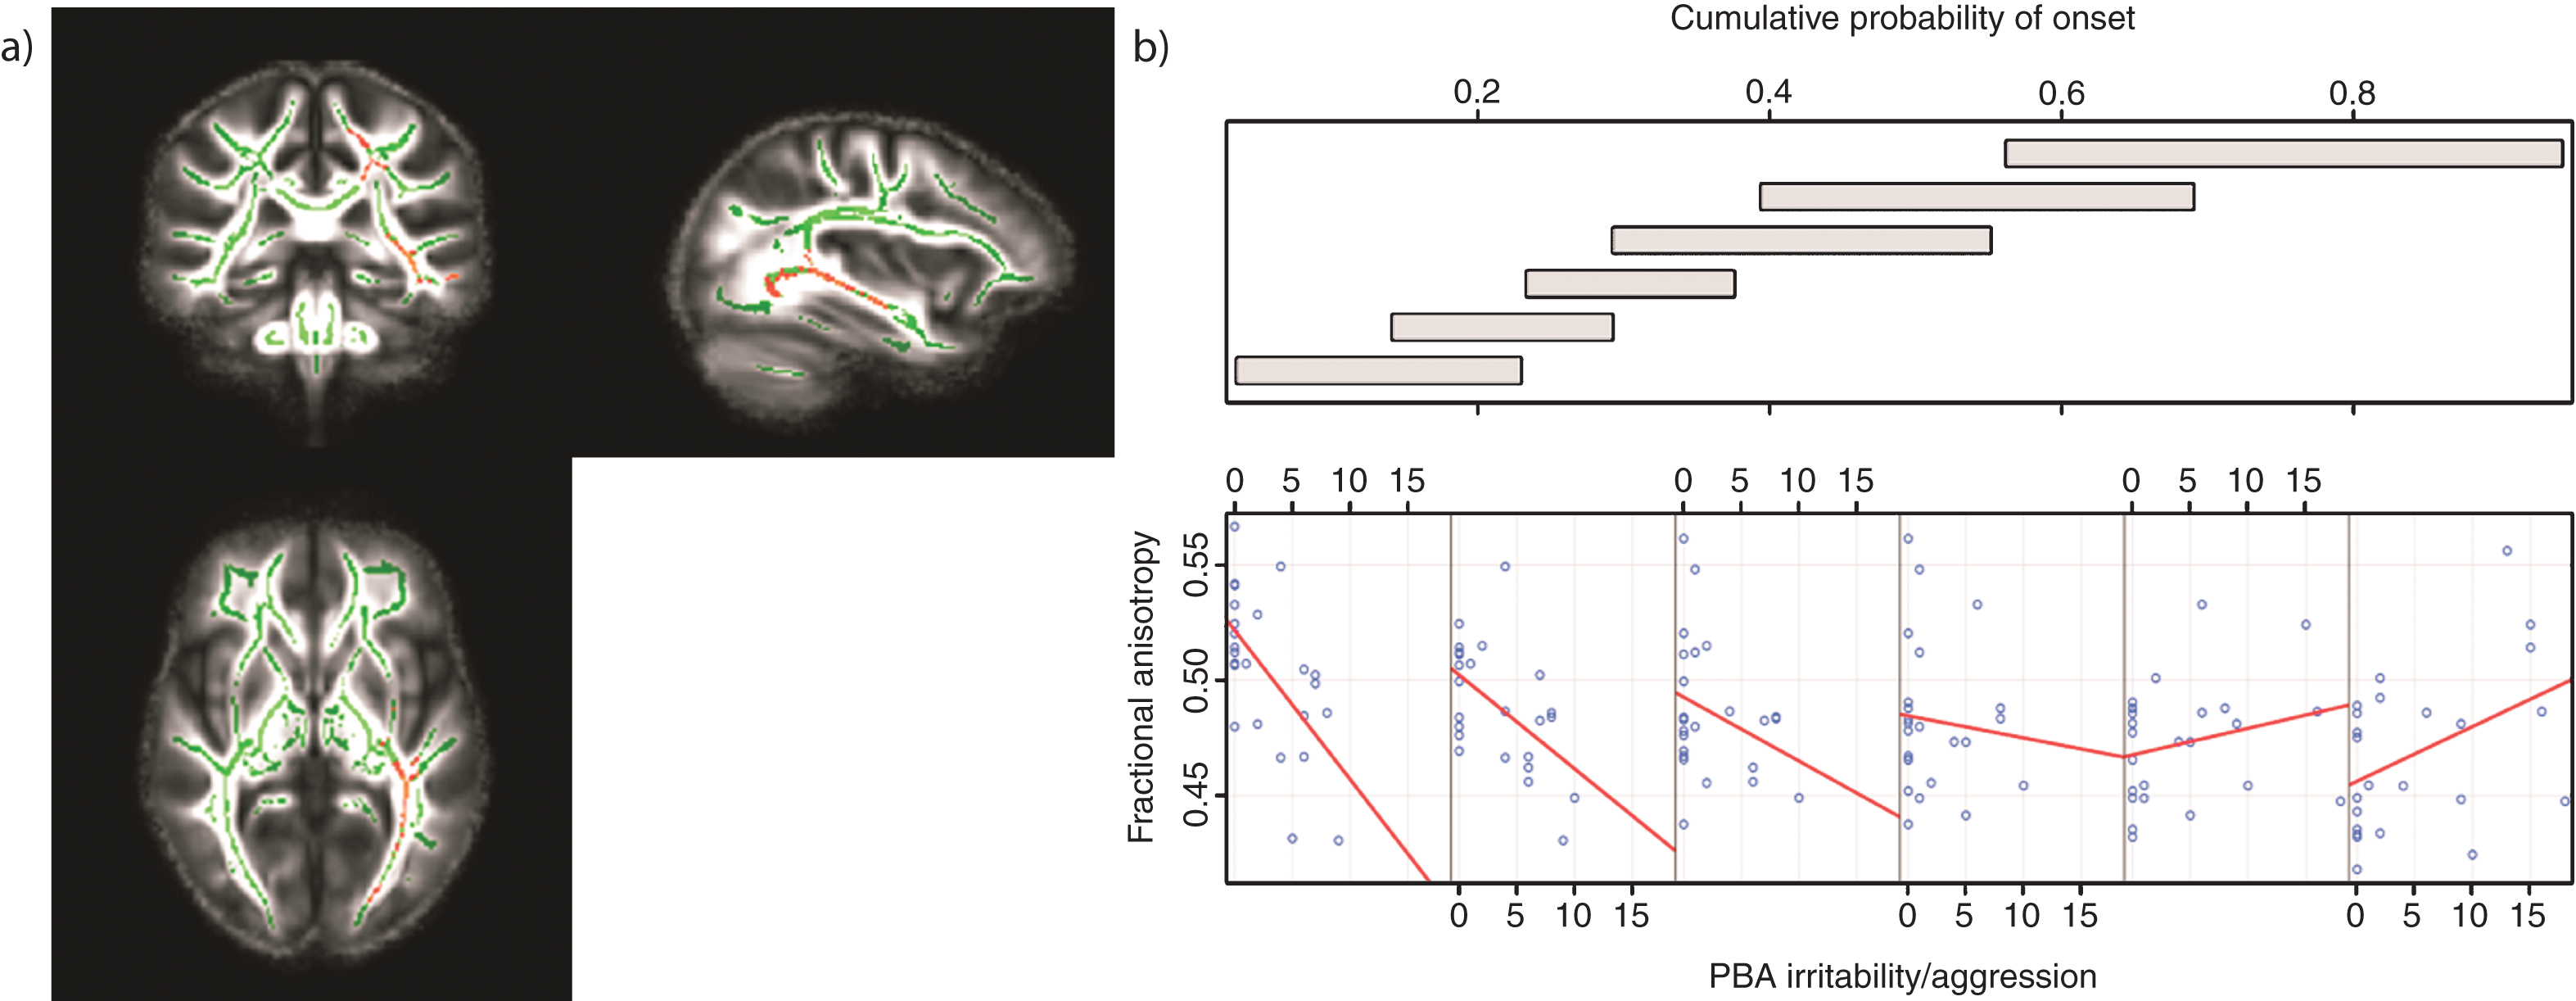
Table 1
Comparisons of demographic, clinical and behavioral characteristics of premanifest and early-HD gene-carrier participants; FET = Fisher’s Exact Test
| Premanifest-HD | Early-HD | Statistic | P-Value | |
| Age (mean, sd) | 42.5 (7.9) | 49.4 (10.1) | t(81.3) = 3.55 | <0.001 |
| Sex (female, %) | 20 (51%) | 29 (64%) | X (1) = 1.489 | 0.222 |
| Education (median) | 4 | 4 | FET = 3.947 | 1 |
| Site (no.) London | 16 | 18 | X (2) = 0.013 | 0.994 |
| Paris | 16 | 19 | ||
| Leiden | 7 | 8 | ||
| CAG Repeat (mean, range) | 42.85 (39–48) | 43.33 (39–49) | t(82) = 0.667 | 0.507 |
| CPO (mean, sd) | 0.229 (0.15) | 0.539 (0.23) | t(82) = 7.137 | <0.001 |
| HADS depression (mean, sd) | 2.97 (3.58) | 4.71 (4.39) | t(82) = 1.97 | 0.053 |
| PBA Irritability and Aggression (mean, sd) | 2.23 (3) | 4.38 (5.2) | t(72) = 2.356 | 0.021 |
| PBA Apathy (mean, sd) | 2.45 (4.08) | 5.53 (5.66) | t(76.1) = 2.84 | 0.006 |
Table 2
Tracts in which reduced FA was significantly correlated with increased levels of HADS depression for those with high CPO; FWE–corrected threshold of p < 0.05
| Maximum Intensity Voxel | Voxels | p-value | White Matter tracts | ||
| x | y | z | |||
| 105 | 80 | 86 | 444 | 0.014 | Left Splenium |
| Left Callosal Body | |||||
| 121 | 83 | 91 | 386 | 0.009 | Right Splenium |
| Right Callosal Body | |||||
Table 3
Tracts in which reduced FA was correlated with increased levels of irritability/aggression in those with low CPO; FWE-corrected threshold of p < 0.05
| Maximum Intensity Voxel | Voxels | p-value | White Matter tracts | ||
| x | y | z | |||
| 76 | 78 | 69 | 1235 | 0.019 | Left Retrolenticular Internal Capsule |
| Left Posterior Corona Radiata | |||||
| Left Posterior Thalamic Radiation | |||||
| Left External Capsule | |||||
| Left Superior Longitudinal Fasc. | |||||
| Left Inferior Longitudinal Fasc. | |||||
| Left Inferior Fronto-Occipital Fasc. | |||||
| Left Fornix | |||||
| 90 | 74 | 95 | 706 | 0.03 | Left Callosal Body |
| Left Posterior Corona Radiata | |||||
| Left Superior Corona Radiata | |||||
| Left Superior Longitudinal Fasc. | |||||

