
Effect of Probiotic Bifidobacterium breve in Improving Cognitive Function and Preventing Brain Atrophy in Older Patients with Suspected Mild Cognitive Impairment: Results of a 24-Week Randomized, Double-Blind, Placebo-Controlled Trial
Abstract
Background:
Probiotics have been reported to ameliorate cognitive impairment.
Objective:
We investigated the effect of the probiotic strain Bifidobacterium breve MCC1274 (A1) in enhancing cognition and preventing brain atrophy of older patients with mild cognitive impairment (MCI).
Methods:
In this RCT, 130 patients aged from 65 to 88 years old with suspected MCI received once daily either probiotic (B. breve MCC1274, 2×10¹⁰ CFU) or placebo for 24 weeks. Cognitive functions were assessed by ADAS-Jcog and MMSE tests. Participants underwent MRI to determine brain atrophy changes using Voxel-based Specific Regional Analysis System for Alzheimer’s disease (VSRAD). Fecal samples were collected for the analysis of gut microbiota composition.
Results:
Analysis was performed on 115 participants as the full analysis set (probiotic 55, placebo 60). ADAS-Jcog subscale “orientation” was significantly improved compared to placebo at 24 weeks. MMSE subscales “orientation in time” and “writing” were significantly improved compared to placebo in the lower baseline MMSE (< 25) subgroup at 24 weeks. VSRAD scores worsened in the placebo group; probiotic supplementation tended to suppress the progression, in particular among those subjects with progressed brain atrophy (VOI Z-score ≥1.0). There were no marked changes in the overall composition of the gut microbiota by the probiotic supplementation.
Conclusion:
Improvement of cognitive function was observed on some subscales scores only likely due to the lower sensitiveness of these tests for MCI subjects. Probiotics consumption for 24 weeks suppressed brain atrophy progression, suggesting that B. breve MCC1274 helps prevent cognitive impairment of MCI subjects.
INTRODUCTION
Mild cognitive impairment (MCI) is a gray zone that is not to be confused with normal aging, where many cognitive functions do not see significant dec-line even as we age. “Senior moments” such as the trouble in remembering, inability to do simple math, or forgetting words, happens to most people, but sometimes, specific cognitive domains start to regularly fail, such as working memory, long-term memory, verbal skills, and mental math. When this occurs, it is essential to follow up with a mental examination to rule out any signs of Alzheimer’s disease (AD) or other dementia since 10–15% of individuals diagnosed with MCI will convert to AD annually [1].
Probiotics are “live microorganisms which when administered in adequate amounts, confer a health benefit on the host” as defined by the International Scientific Association for Probiotics and Prebiotics (ISAPP) [2]. Several central nervous system (CNS) disorders, including MCI and AD, are associated with abnormal inflammation in the brain and the gut, suggesting these diseases may not have a unique central origin but could start from the periphery [3–5]. In addition, several studies looking at the possible alterations in gut microbiota identified a shift of microbial populations towards a pro-inflammatory flora [6, 7]. This is important because the gut microbiota and the brain can communicate using the Gut-Brain-Axis and this mode of communication implies that bacteria-derived metabolites can have a positive or negative impact on the CNS [8].
Increasing research interest has focused on evaluating if probiotics could be considered as novel strategies to treat human conditions associated with cognitive impairment such as MCI and AD. While only a handful number of clinical studies have met the high-standard of randomized placebo-controlled trials, they suggest that probiotics can improve cognitive and gastrointestinal symptoms in patients with AD, MCI, and Parkinson’s disease, which is possibly through reducing inflammatory response and improving lipid metabolism [9]. Our research in recent years has focused on understanding the CNS benefits of the probiotic strain Bifidobacterium breve MCC1274 (A1). After initially showing its effectiveness at alleviating amyloid-β-induced inflammation in a mouse model of AD [10], we conducted several clinical studies evaluating the enhancement of cognitive functions of MCC1274 in MCI populations in Japan [11–13]. Through those studies, we could demonstrate the effectiveness of this probiotic in improving clinical trial participant’s memory as evaluated by RBANS (the Repeatable Battery for the Assessment of Neuropsychological Status) test and JMCIS (Japan MCI score) test [12]. Furthermore, amelioration in RBANS subdomain of immediate and delayed memory, which depends on Medial Temporal Lobe integrity [14], suggested that the MCC1274 effect may prevent brain shrinkage linked to inflammation as this brain region volume change is useful in distinguishing patients with mild cognitive impairment and AD from those without impairment [15].
In recent years, brain imaging analyses have been routinely used to distinguish MCI from other disorders such as encephalitis, stroke, or glioblastomas [16]. Advances in brain image analysis now allow quantitative analysis of brain morphology, making it a powerful supportive tool to diagnose dementia. A quantitative technique called Voxel-based Specific Regional Analysis System for Alzheimer’s disease (VSRAD) based on magnetic resonance imaging (MRI) data has been used in Japan to diagnose early Alzheimer’s type dementia by taking and analyzing the degree of atrophy of the brain [17].
In this randomized, double-blind placebo-cont-rolled study conducted in a Japanese MCI population living in Tokyo, we aimed to gain as much information as possible on the cognitive enhancement potential of B. breve MCC1274 and whether its previously observed memory enhancing benefits in the MCI population would involve alteration of brain atrophy and/or any changes in the gut microbiota. For this study, we used ADAS-Jcog (Japanese version of Alzheimer’s Disease Assessment Scale) and MMSE (Mini-Mental State Examination) to assess the improvement of cognitive functions by the probiotic strain. In addition, we also investigated if B. breve MCC1274 could prevent brain shrinkage in MCI patients using VSRAD brain imaging technology. Finally, we explored the impact of consuming MCC1274 on the gut microbiota to understand better the underlying mechanism by how this probiotic can improve memory of MCI individuals.
MATERIALS AND METHODS
This study was a double-blind, randomized plac-ebo-controlled trial to study the effect of B. breve MCC1274 (synonym B. breve A1) in older adults with suspected MCI and is registered at University Hospital Medical Research Network number UMIN000031507.
Study design and participants
Patients were recruited from patients who visited the Department of Gastroenterology, Department of Psychiatry, and Department of General Medicine, Juntendo Tokyo Koto Geriatric Medical Center. All subjects underwent a medical examination and were selected according to the following inclusion criteria (1) age 65–89 years, (2) satisfied with the clinical criteria of MCI (DSM-5), and the following three criteria: i) Memory complaint by subject or family, ii) MMSE scores between 22 and 26 (inclusive), and iii) Clinical Dementia Rating (CDR) = 0.5, and (3) written informed consent provided for study participation. Exclusion criteria were as follows: (1) Parkinson’s disease, Huntington’s disease, normal pressure hydrocephalus, progressive supranuclear palsy, epilepsy, multiple sclerosis, cerebral infection, or subsequent complication caused by head trauma; history of major depression or bipolar disorder, alcohol or other substance abuse; findings of multiple infarction, brain tumor, or subdural hematoma; cognitive impairment due to deficiency of vitamin B12 or folate; neurosyphilis; thyroid function abnormality; (2) severe disease (cerebrovascular, heart, liver, renal, gastrointestinal, endocrine-metabolic, infectious disease), cancer of the alimentary system, cases of gastrointestinal tract resection and inflammatory bowel disease; (3) heavy users of pharmaceutical products affecting the bowel movement regularity (antibiotic, medicine for intestinal disorders, laxative, antidiarrheic) and health food, supplement (lactic acid bacterium, Bifidobacterium, Lactobacillus, oligosaccharide, dietary fiber); (4) remarkable abnormality for blood pressure and blood tests; severe anemia; allergy for drugs and food; heavy smoker, drinker; irregular lifestyle such as a meal type, sleep duration; (5) users for Anti-dementia drugs, psychoactive drugs, severe diabetes mellitus treated with insulin; (6) contraindications for MRI such as magnetic body or metal; (7) participation in any other new drug study for AD; participation in another new drug study; (8) considered by the principal investigator to be ineligible.
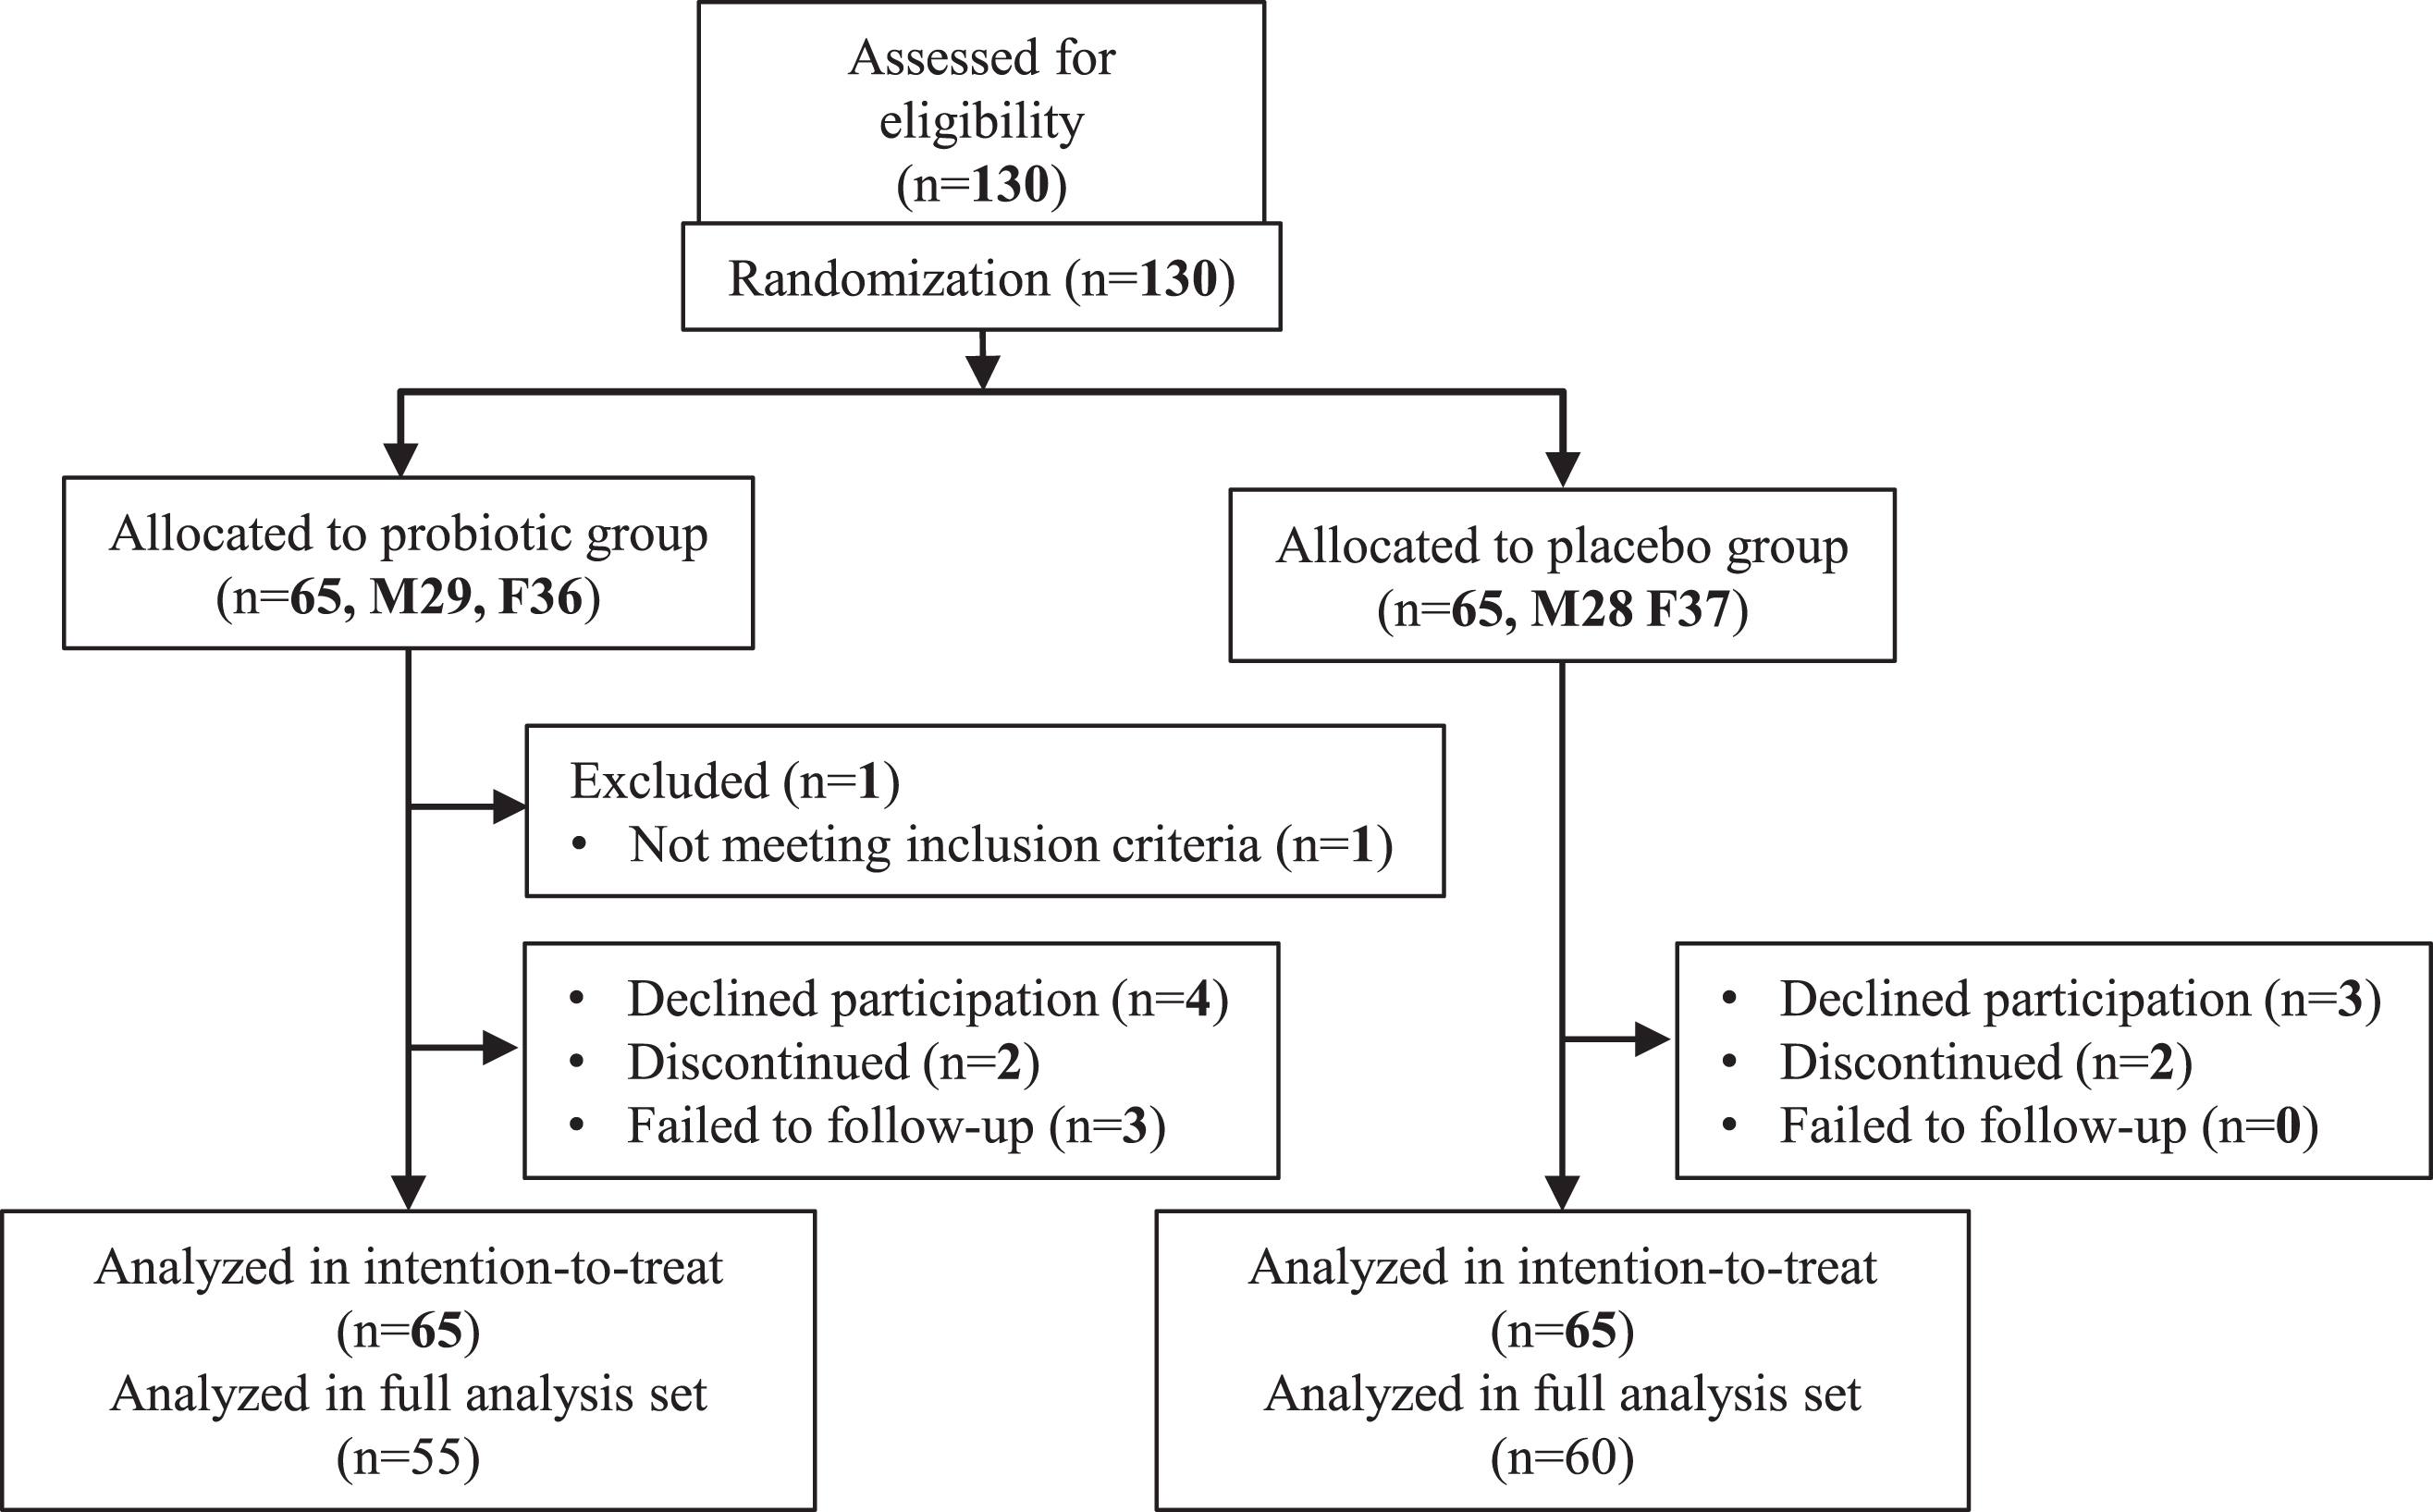
Participants’ characteristics are shown in Table 1. Subjects were recruited from March 2018 to June 2020. A sample size of 140 participants (70 per group) was designed to evaluate cognitive function effects by B. breve MCC1274 consumption. This sample size was expected to achieve 80% power to detect 2.5-point difference change from baseline of ADAS-Jcog scores between the probiotic and placebo groups, assuming a standard deviation of 5 in both groups, a two-side test with α = 0.05, and an attrition rate of 10% (Fig. 1). This study was done with the approval of the ethical committee of Juntendo University, and was based on the tenets of the Declaration of Helsinki. Informed consent was obtained from each subject.
Table 1
Subject characteristics
| Full analysis set (FAS) | VSRAD analysis set | |||
| Probiotics | Placebo | Probiotics | Placebo | |
| Subject number | 55 | 60 | 42 | 47 |
| Gender (male/female) | 26/29 | 25/35 | 22/20 | 20/27 |
| Age | 77.2 (5.8) | 78.9 (4.3) | 77.3 (6.1) | 78.5 (4.2) |
| Height (cm) | 156.3 (9.1) | 154.7 (8.1) | 157.7 (8.7) | 154.9 (8.4) |
| Body weight (kg) | 55.4 (13.2) | 56.2 (8.7) | 56.9 (14) | 56.4 (8.8) |
| BMI (kg·m-2) | 22.6 (4.4) | 23.5 (3.3) | 22.8 (4.8) | 23.5 (3.5) |
| ADAS total score | 7.98 (2.89) | 7.52 (3.06) | 8.1 (2.9) | 7.5 (3.2) |
| MMSE total score | 24.5 (1.2) | 24.6 (1.2) | 24.4 (1.3) | 24.6 (1.2) |
Data are number or mean (SD).
Fig. 1
Trial profile.
Intervention
We prepared sachets containing lyophilized powder of B. breve MCC1274, a strain originating from an infant, which mainly included maize starch as a carrier. Using a microbial colony counting methodology, we confirmed that each sachet contained 2×10¹⁰ CFU or more. Placebo sachets were composed of maize starch only and were identical in appearance and weight. Each participant consumed one probiotic or placebo sachet daily for 24 weeks.
Medical interviews were conducted at each visit, and blood tests, body weight measurement, blood pressure, and heart rate determination were evaluated at those times.
Neuropsychological tests
Cognitive functions were evaluated at each visit (at baseline, 8 and 16 weeks, and after completing the treatment) with ADAS-Jcog and MMSE as primary and secondary outcomes, respectively. ADAS-Jcog gives scores ranging from 0 (no errors) to 70 (maximum impairment) and evaluates memory, language, praxis, and orientation. It includes eleven subscales (word recall, spoken language ability, comprehension of spoken language, word-finding difficulty, following commands, naming objects and fingers, constructions, ideational praxis, orientation, word recognition, and recall of test instructions). MMSE is another more straightforward test that yields scores ranging from 0 to 30, with lower scores indicating some form of cognitive functions decline. MMSE includes eleven items that evaluate orientation to time, to place, registration of three words, calculation (Serial-7 subdomain, subtracting serial sevens from 100), language (tested by naming objects, repeating a sentence, reading a sentence, writing a sentence, and three-step command), and ability to draw shapes. However, the serial-7 subdomain of the MMSE has a strong bias for learning and may affect the ability to detect cognitive improvement, especially in a Japanese population, as reported previously [18]. Therefore, we have calculated a modified MMSE score (mMMSE) that does not include Serial-7.
Brain imaging
As another secondary endpoint, brain atrophy assess by brain MRI was evaluated. For the brain imaging, participants’ whole-brain were scanned with 3-D T1-weighted MRI at week 0 and 24, and these sagittal imaging data were analyzed with VSRAD® advance 2. VSRAD, which uses brain MRI data to assess the brain morphological abnormalities associated with AD, was developed by Dr. Matsuda and colleagues [19, 20]. VSRAD applies voxel-based morphometry (VBM), a method for superimposing plane tomographic images from head MRI and dividing the entire brain into small cubes for statistical analysis [17]. This free software application was updated into VSRAD advance 2 and it is being used in many hospitals. In particular, a Z-score of gray matter atrophy in the volume of interest (VOI) relevant to AD, which measures the severity of medial temporal atrophy, is a representative indicator of VSRAD [17–22]. VSRAD analysis was performed according to the protocols (https://medical.eisai.jp/products/vsrad/general/manual/), and the process of statistical image manipulation was conducted as previously reported [23].
VSRAD scores reflect the severity of gray matter loss across the entire brain because the software compares an image with the original standard database template. VSRAD advance 2 automatically calculates the four indicators of AD shown below:
i) The Z-score of gray matter atrophy severity in the volume of interest of AD (“VOI severity”) = ((normal control average of voxel-level–patient’s voxel-level)/normal control standard deviation),
ii) The extent of gray matter atrophy in the VOI of AD (“VOI extent”) = ((number of voxels judged to have a Z-score of more than 2/number of all voxels in the volume of the hippocampus)×100%),
iii) The extent of gray matter atrophy in the whole brain (“GM extent”) = a percentage of voxels with a Z-score > 2 compared with the whole brain, and
iv) the ratio of the extent of gray matter atrophy in the VOI to the whole brain (“VOI ratio”) = ((number of voxels judged to have a Z-score of more than 2/number of all voxels in the volume of the whole brain)×100%).
Fecal DNA preparation and microbiota analysis
Fecal DNA preparation and microbiota analysis were performed as described previously [24]. Briefly, fecal samples were collected using Techno Suruga’s stool collection kit brush type at week 0 and week 4. DNA was extracted from the fecal samples, and purified DNA was suspended in 2,000 ml of Tris-EDTA buffer (pH 8.0). PCR amplification and DNA sequencing of the V3–V4 region of the bacterial 16S rRNA gene was performed on the Illumina MiSeq instrument (Illumina, San Diego, CA, USA). After removing the sequences consistent with the Genome Reference Consortium human build 38 (GRCh38) data and the phiX reads from the raw Illumina paired-end reads, the sequences were analyzed using the QIIME2 software package (version 2017.10). Potential chimeric sequences were removed using DADA2 [25], and 30 and 90 bases were trimmed from the 30 regions of the forward, and the reverse reads, respectively. The taxonomical classification was performed using the Naive Bayes classifier trained on the Greengenes13.8 dataset with a 99% sequence similarity threshold for full-length Operational Taxonomic Units.
Randomization and masking
After the assessment for eligibility, randomization was conducted using random permuted blocks of participants stratified by sex (male versus female) and MMSE score (≥25 versus < 25) to ensure balan-ced allocation of the participants to each group. Any research team member did not know the allocated sequence until the study ended and the database locked. Given the safety record of B. breve MCC1274, no provision for emergency unmasking of study participants was considered, and therefore, no allocation sequence copies were held at the recruitment sites.
Statistical analysis
Once data collection was completed, all data were fixed before the code-breaking. The principal analysis for all primary and secondary outcome measures was done on the Full Analysis Set (FAS) by excluding participants: (1) who have violated the eligibility criteria, (2) who have never consumed the study supplement, and (3) who have no post-randomization data at all.
A total of 145 subjects were assessed for eligibility. Owing to the pandemic of COVID-19, finally, 130 subjects participated in this study. After informed consent, seven declined to participate without taking any samples (probiotic 4, placebo 3), four discontinued (each two for each group), three in the probiotic group failed to follow-up, and one (age < 65 y) did not meet the inclusion criteria. Finally, a total of 115 subjects (60 in placebo and 55 in probiotic groups) completed the final examination and was included in FAS (Table 1).
Normality testing was conducted using Shapiro–Wilk test before the statistical evaluation. For the data of ADAS-Jcog and MMSE scores, because more than half of the parameters were judged to be non-normally distributed, changes from baseline to follow-up points were compared between the probiotic and placebo groups using the Wilcoxon rank-sum test. Moreover, intra-group changes in the values between baseline and after intervention were tested using Wilcoxon signed-rank test. Subgroup data of cognitive test and VSRAD were also analyzed according to baseline MMSE score and VSRAD Z-score. MMSE score was divided into two groups (≥25 versus < 25), the stratified factor for randomization, and the median of baseline MMSE. VSRAD Z-score was divided by 1.0, the standard for suspected atrophy of the brain. Statistical analysis was performed using SAS software version 9.4 (SAS Institute Inc., Cary, NC, USA) for neuropsychological data or R software ver. 3.6.0 for VSRAD data, with significance set at p < 0.05. The Student’s t-test was used for comparing the changes of means. Safety of B. breve MCC1274 was assessed on all participants by comparing any changes with Student’s t-test based on changes of blood parameters during the intervention period (Supplementary Table 1).
RESULTS
Baseline characteristics of the participants were almost identical for both groups (Table 1). The rate of consumption of the supplements for 24 weeks was considerably high in both groups (97.2±3.5% in the probiotic group, 96.1±5.2% in the placebo group). Blood parameters at baseline and post-intervention were comparable for both groups (Supplementary Table 1). One subject experienced lumbar compression fracture, one reported mild constipation in the probiotic group, and one subject experienced spinal canal stenosis in the placebo group; however, no adverse events related to sample consumption were observed.
Neuropsychological tests
The results of the ADAS-Jcog total score for placebo and B. breve MCC1274 at baseline, weeks 8, 16, and 24 are shown in Table 2. The total score evenly declined in both groups until the end of the trial without significant inter-group differences at each measurement. If we look at ADAS-Jcog sub-domain scores, there was no significant intergroup differences; however, significant improvement was observed in the changes from baselines of “orientation” at week 24 by the probiotic (p = 0.021). MMSE total score increased in both groups during the intervention without significant differences between groups. A significant intergroup difference was observed in the MMSE sub-domain score “repetition” at week 16 (p = 0.033) (Table 3).
Table 2
Summary of the cognitive tests in the full analysis set
| Group | Baseline | Week 8 | Week 16 | Week 24 | ⊿ Week 24 | ||||||
| Mean (SD) | p | Mean (SD) | p | Mean (SD) | p | Mean (SD) | p | Mean (SD) | p | ||
| ADAS-cog total score | Probiotic | 7.98 (2.89) | 0.319 | 7.75 (3.09) | 0.175 | 7.06 (3.2)** | 0.336 | 6.67 (3.4)*** | 0.253 | –1.34 (2.61) | 0.789 |
| Placebo | 7.52 (3.06) | 6.89 (2.87)* | 6.47 (3.13)** | 6.1 (3.41)*** | –1.36 (2.53) | ||||||
| Word recall | Probiotic | 4.08 (1.32) | 0.103 | 3.68 (1.21)* | 0.816 | 3.55 (1.32)** | 0.194 | 3.48 (1.42)*** | 0.159 | –0.64 (1.18) | 0.789 |
| Placebo | 3.74 (1.37) | 3.64 (1.56) | 3.2 (1.41)** | 3.1 (1.58)*** | –0.62 (1.15) | ||||||
| Spoken language ability | Probiotic | 0 (0) | 1.000 | 0 (0) | 1.000 | 0.02 (0.14) | 0.970 | 0 (0) | 1.000 | 0 (0) | 1.000 |
| Placebo | 0 (0) | 0 (0) | 0.02 (0.13) | 0 (0) | 0 (0) | ||||||
| Comprehension of | |||||||||||
| spoken language | Probiotic | 0 (0) | 1.000 | 0 (0) | 1.000 | 0.02 (0.14) | 0.970 | 0.02 (0.14) | 0.299 | 0.02 (0.14) | 0.299 |
| Placebo | 0 (0) | 0 (0) | 0.02 (0.13) | 0 (0) | 0 (0) | ||||||
| Word-finding difficulty | Probiotic | 0.06 (0.23) | 0.792 | 0.09 (0.35) | 0.884 | 0.04 (0.19) | 0.949 | 0.02 (0.14) | 0.634 | –0.02 (0.24) | 0.778 |
| Placebo | 0.07 (0.25) | 0.07 (0.25) | 0.03 (0.18) | 0.04 (0.19) | –0.04 (0.33) | ||||||
| Following commands | Probiotic | 1.04 (0.77) | 0.111 | 0.82 (0.77) | 0.707 | 0.76 (0.82)* | 0.193 | 0.71 (0.7)** | 0.663 | –0.37 (0.82) | 0.075 |
| Placebo | 0.8 (0.71) | 0.87 (0.75) | 0.91 (0.71) | 0.63 (0.62) | –0.16 (0.73) | ||||||
| Naming | Probiotic | 0 (0) | 0.178 | 0 (0) | 0.347 | 0 (0) | 0.174 | 0 (0) | 0.100 | 0 (0) | 0.354 |
| Placebo | 0.03 (0.18) | 0.02 (0.13) | 0.03 (0.18) | 0.05 (0.23) | 0.02 (0.13) | ||||||
| Constructions | Probiotic | 0.27 (0.45) | 0.610 | 0.44 (0.5)* | 0.066 | 0.26 (0.44) | 0.668 | 0.31 (0.51)* | 0.085 | 0.04 (0.56) | 0.060 |
| Placebo | 0.32 (0.47) | 0.2 (0.4) | 0.22 (0.42) | 0.16 (0.37) | –0.16 (0.49) | ||||||
| Ideational praxis | Probiotic | 0.38 (0.73) | 0.817 | 0.35 (0.78) | 0.779 | 0.35 (0.73) | 0.674 | 0.16 (0.54) | 0.273 | –0.18 (0.79) | 0.796 |
| Placebo | 0.43 (0.79) | 0.27 (0.58) | 0.29 (0.65) | 0.23 (0.57) | –0.23 (0.82) | ||||||
| Orientation | Probiotic | 0.35 (0.58) | 0.397 | 0.42 (0.74) | 0.677 | 0.35 (0.68) | 0.964 | 0.22 (0.54) | 0.117 | –0.14 (0.53) | 0.021† |
| Placebo | 0.37 (0.99) | 0.4 (0.81) | 0.41 (0.88) | 0.47 (0.97) | 0.16 (0.75) | ||||||
| Word recognition | Probiotic | 1.79 (1.3) | 0.429 | 1.94 (1.73) | 0.078 | 1.7 (2) | 0.296 | 1.73 (1.94) | 0.195 | –0.05 (1.49) | 0.400 |
| Placebo | 1.73 (1.52) | 1.44 (1.2) | 1.32 (1.36)** | 1.4 (1.61)* | –0.32 (1.41) | ||||||
| Recall of test | |||||||||||
| instructions | Probiotic | 0.02 (0.14) | 0.960 | 0.02 (0.14) | 0.309 | 0.02 (0.14) | 0.313 | 0.02 (0.14) | 0.948 | 0 (0.2) | 1.000 |
| Placebo | 0.03 (0.26) | 0 (0) | 0 (0) | 0.02 (0.13) | –0.02 (0.3) | ||||||
Data are indicated as mean (SD). p value shows inter-group difference (probiotics versus placebo) (Wilcoxon rank-sum test), †p < 0.05. Difference from baseline was analyzed by Wilcoxon signed rank Test), *p < 0.05, **p < 0.01, ***p < 0.001.
Table 3
Summary of the cognitive tests by MMSE in the full analysis set
| Group | Baseline | Week 8 | Week 16 | Week 24 | ⊿ Week 24 | ||||||
| Mean (SD) | p | Mean (SD) | p | Mean (SD) | p | Mean (SD) | p | Mean (SD) | p | ||
| MMSE total score | Probiotic | 24.51 (1.23) | 0.675 | 26.89 (2.26)*** | 0.868 | 27.44 (2.04)*** | 0.665 | 27.08 (2.42)*** | 0.725 | 2.61 (2.3) | 0.923 |
| Placebo | 24.62 (1.17) | 26.68 (2.71)*** | 27.12 (2.53)*** | 27.25 (2.38)*** | 2.63 (2.27) | ||||||
| Orientation in time | Probiotic | 4.64 (0.56) | 0.770 | 4.66 (0.7) | 0.898 | 4.72 (0.56) | 0.936 | 4.82 (0.52) | 0.065 | 0.18 (0.71) | 0.213 |
| Placebo | 4.6 (0.74) | 4.66 (0.69) | 4.67 (0.71) | 4.6 (0.8) | 0 (0.66) | ||||||
| Orientation in place | Probiotic | 4.62 (0.56) | 0.669 | 4.78 (0.57) | 0.690 | 4.82 (0.62)* | 0.910 | 4.92 (0.27)** | 0.194 | 0.29 (0.58) | 0.242 |
| Placebo | 4.62 (0.67) | 4.71 (0.67) | 4.85 (0.41)** | 4.81 (0.48)* | 0.19 (0.72) | ||||||
| Registration | Probiotic | 3 (0) | 0.178 | 2.98 (0.14) | 0.309 | 3 (0) | 1.000 | 2.98 (0.14) | 0.299 | –0.02 (0.14) | 0.163 |
| Placebo | 2.97 (0.18) | 3 (0) | 3 (0) | 3 (0) | 0.02 (0.13) | ||||||
| Serial-7 s | Probiotic | 1.76 (1.22) | 0.543 | 3.36 (1.8)*** | 0.444 | 3.48 (1.56)*** | 0.941 | 2.98 (1.87)*** | 0.124 | 1.22 (2.05) | 0.125 |
| Placebo | 1.77 (1.41) | 3.17 (1.64)*** | 3.45 (1.74)*** | 3.53 (1.59)*** | 1.77 (1.92) | ||||||
| Recall | Probiotic | 2.2 (0.87) | 0.755 | 2.56 (0.76)** | 0.860 | 2.67 (0.61)*** | 0.754 | 2.71 (0.64)*** | 0.707 | 0.51 (0.81) | 0.797 |
| Placebo | 2.17 (0.85) | 2.56 (0.84)*** | 2.6 (0.7)*** | 2.65 (0.72)*** | 0.47 (0.78) | ||||||
| Naming | Probiotic | 2 (0) | 1.000 | 2 (0) | 1.000 | 2 (0) | 1.000 | 2 (0) | 1.000 | 0 (0) | 1.000 |
| Placebo | 2 (0) | 2 (0) | 2 (0) | 2 (0) | 0 (0) | ||||||
| Repetition | Probiotic | 0.8 (0.4) | 0.824 | 0.87 (0.34) | 0.195 | 0.94 (0.23)* | 0.033† | 0.86 (0.35) | 0.967 | 0.08 (0.44) | 0.786 |
| Placebo | 0.82 (0.39) | 0.78 (0.42) | 0.81 (0.4) | 0.86 (0.35) | 0.05 (0.48) | ||||||
| Three-stage | Probiotic | 2.89 (0.32) | 0.243 | 2.93 (0.33) | 0.918 | 2.89 (0.32) | 0.253 | 2.92 (0.27) | 0.137 | 0.04 (0.34) | 0.937 |
| command | Placebo | 2.95 (0.22) | 2.95 (0.22) | 2.95 (0.22) | 2.98 (0.13) | 0.04 (0.27) | |||||
| Reading | Probiotic | 0.98 (0.14) | 0.304 | 0.95 (0.23) | 0.936 | 1 (0) | 1.000 | 1 (0) | 0.183 | 0.02 (0.14) | 0.092 |
| Placebo | 1 (0) | 0.95 (0.22) | 1 (0) | 0.97 (0.19) | –0.04 (0.19) | ||||||
| Writing | Probiotic | 0.71 (0.46) | 0.069 | 0.87 (0.34)* | 0.153 | 0.94 (0.23)** | 0.232 | 0.9 (0.3)** | 0.907 | 0.22 (0.5) | 0.058 |
| Placebo | 0.85 (0.36) | 0.95 (0.22)* | 0.88 (0.33) | 0.9 (0.31) | 0.05 (0.4) | ||||||
| Construction | Probiotic | 0.91 (0.29) | 0.657 | 0.93 (0.26) | 0.633 | 0.98 (0.14) | 0.115 | 0.98 (0.14) | 0.634 | 0.08 (0.34) | 0.920 |
| Placebo | 0.88 (0.32) | 0.95 (0.22) | 0.91 (0.28) | 0.97 (0.19) | 0.07 (0.37) | ||||||
Data are indicated as mean (SD). p value shows inter-group difference (probiotics versus placebo) (Wilcoxon rank-sum test), †p < 0.05. Difference from baseline was analyzed by Wilcoxon signed rank Test), *p < 0.05, **p < 0.01, ***p < 0.001.
Tables 4 and 5 show the subgroup analysis for ADAS-Jcog and MMSE when baseline MMSE is divided by the median (< 25 or≥25). A signifi-cant improvement in ADAS-Jcog “orientation” (p = 0.022) is seen in participants with MMSE < 25, after taking B. breve MCC1274 for 24 weeks (Table 4). A significant difference over placebo is detected for MMSE “orientation in time” (p = 0.006) at week 24 and “repetition” (p = 0.026) at week 16. The difference was observed in the changes from baselines of “writing” (p = 0.045) at week 24 (Table 5). There was no significant difference in the participants with MMSE≥25, except for ADAS-Jcog “construction” (p = 0.021, week 8) and MMSE “writing” (p = 0.036, week 8) and change from baseline of “orientation” (p = 0.023) at week 24 (Tables 4 and 5).
Table 4
Subgroup analysis of cognitive tests by ADAS-cog based on baseline MMSE scores
| Group | Baseline | Week 8 | Week 16 | Week 24 | ⊿ Week 24 | ||||||
| Mean (SD) | p | Mean (SD) | p | Mean (SD) | p | Mean (SD) | p | Mean (SD) | p | ||
| MMSE < 25 | |||||||||||
| ADAS-cog total score | Probiotic | 8.4 (2.92) | 0.503 | 8.14 (3.36) | 0.940 | 7.25 (3.39) | 0.810 | 7.11 (3.66) | 0.718 | –1.19 (2.76) | 0.283 |
| Placebo | 7.87 (3.22) | 7.83 (2.79) | 7.51 (3.51) | 7.08 (3.88) | –0.68 (2.76) | ||||||
| Word recall | Probiotic | 4.22 (1.08) | 0.377 | 3.82 (1.18) | 0.501 | 3.59 (1.31)* | 0.710 | 3.49 (1.27)** | 0.756 | –0.71 (0.96) | 0.278 |
| Placebo | 3.94 (1.27) | 4.06 (1.48) | 3.44 (1.49) | 3.37 (1.54) | –0.5 (1.35) | ||||||
| Spoken language ability | Probiotic | 0 (0) | 1.000 | 0 (0) | 1.000 | 0.04 (0.2) | 1.000 | 0 (0) | 1.000 | 0 (0) | 1.000 |
| Placebo | 0 (0) | 0 (0) | 0.04 (0.2) | 0 (0) | 0 (0) | ||||||
| Comprehension of | Probiotic | 0 (0) | 1.000 | 0 (0) | 1.000 | 0.04 (0.2) | 1.000 | 0.04 (0.21) | 0.317 | 0.04 (0.21) | 0.317 |
| spoken language | Placebo | 0 (0) | 0 (0) | 0.04 (0.2) | 0 (0) | 0 (0) | |||||
| Word-finding difficulty | Probiotic | 0.04 (0.2) | 0.373 | 0.08 (0.28) | 0.488 | 0.04 (0.2) | 1.000 | 0 (0) | 0.359 | 0 (0) | 0.333 |
| Placebo | 0.11 (0.32) | 0.15 (0.36) | 0.04 (0.2) | 0.04 (0.2) | –0.08 (0.4) | ||||||
| Following commands | Probiotic | 1.13 (0.95) | 0.266 | 0.79 (0.83) | 0.445 | 0.88 (0.9) | 0.587 | 0.87 (0.69) | 0.337 | –0.3 (0.88) | 0.408 |
| Placebo | 0.82 (0.68) | 0.96 (0.81) | 0.96 (0.74) | 0.68 (0.69) | –0.12 (0.67) | ||||||
| Naming | Probiotic | 0 (0) | 0.187 | 0 (0) | 0.366 | 0 (0) | 0.170 | 0 (0) | 0.180 | 0 (0) | 1.000 |
| Placebo | 0.07 (0.27) | 0.04 (0.19) | 0.08 (0.28) | 0.08 (0.28) | 0 (0) | ||||||
| Constructions | Probiotic | 0.38 (0.5) | 0.564 | 0.42 (0.5) | 0.142 | 0.25 (0.44) | 0.947 | 0.44 (0.59) | 0.069 | 0.09 (0.6) | 0.181 |
| Placebo | 0.3 (0.47) | 0.22 (0.42) | 0.24 (0.44) | 0.16 (0.37) | –0.12 (0.44) | ||||||
| Ideational praxis | Probiotic | 0.42 (0.65) | 0.899 | 0.5 (0.93) | 0.562 | 0.54 (0.83) | 0.926 | 0.13 (0.46) | 0.101 | –0.26 (0.75) | 0.468 |
| Placebo | 0.48 (0.89) | 0.33 (0.68) | 0.52 (0.82) | 0.4 (0.76) | –0.12 (0.97) | ||||||
| Orientation | Probiotic | 0.25 (0.53) | 0.315 | 0.29 (0.46) | 0.641 | 0.25 (0.53) | 0.107 | 0.22 (0.67) | 0.022† | 0 (0.52) | 0.303 |
| Placebo | 0.63 (1.36) | 0.52 (0.98) | 0.76 (1.2) | 0.8 (1.29) | 0.28 (0.98) | ||||||
| Word recognition | Probiotic | 1.97 (1.47) | 0.154 | 2.23 (2.23) | 0.431 | 1.58 (2.39)* | 0.912 | 1.93 (2.48) | 0.554 | –0.04 (1.61) | 0.468 |
| Placebo | 1.52 (1.27) | 1.55 (1.06) | 1.39 (1.41) | 1.51 (1.59) | –0.06 (1.23) | ||||||
| Recall of test | |||||||||||
| instructions | Probiotic | 0 (0) | 1.000 | 0 (0) | 1.000 | 0.04 (0.2) | 0.338 | 0 (0) | 0.359 | 0 (0) | 0.359 |
| Placebo | 0 (0) | 0 (0) | 0 (0) | 0.04 (0.2) | 0.04 (0.2) | ||||||
| MMSE≥25 | |||||||||||
| ADAS-cog total score | Probiotic | 7.66 (2.88) | 0.536 | 7.45 (2.89) | 0.079 | 6.91 (3.1)* | 0.130 | 6.31 (3.2)** | 0.233 | –1.46 (2.52) | 0.583 |
| Placebo | 7.23 (2.94) | 6.12 (2.73)** | 5.69 (2.61)*** | 5.33 (2.84)*** | –1.89 (2.24) | ||||||
| Word recall | Probiotic | 3.97 (1.49) | 0.182 | 3.57 (1.25) | 0.363 | 3.52 (1.36) | 0.171 | 3.48 (1.56)* | 0.126 | –0.58 (1.35) | 0.722 |
| Placebo | 3.57 (1.44) | 3.29 (1.56) | 3.02 (1.34)** | 2.89 (1.6)** | –0.71 (0.98) | ||||||
| Spoken language ability | Probiotic | 0 (0) | 1.000 | 0 (0) | 1.000 | 0 (0) | 1.000 | 0 (0) | 1.000 | 0 (0) | 1.000 |
| Placebo | 0 (0) | 0 (0) | 0 (0) | 0 (0) | 0 (0) | ||||||
| Comprehension of | |||||||||||
| spoken language | Probiotic | 0 (0) | 1.000 | 0 (0) | 1.000 | 0 (0) | 1.000 | 0 (0) | 1.000 | 0 (0) | 1.000 |
| Placebo | 0 (0) | 0 (0) | 0 (0) | 0 (0) | 0 (0) | ||||||
| Word-finding difficulty | Probiotic | 0.07 (0.25) | 0.533 | 0.1 (0.4) | 0.148 | 0.03 (0.18) | 0.964 | 0.04 (0.19) | 0.943 | –0.04 (0.33) | 0.643 |
| Placebo | 0.03 (0.17) | 0 (0) | 0.03 (0.17) | 0.03 (0.18) | 0 (0.25) | ||||||
| Following commands | Probiotic | 0.97 (0.61) | 0.253 | 0.84 (0.74) | 0.804 | 0.67 (0.76)* | 0.208 | 0.57 (0.69)* | 0.703 | –0.43 (0.79) | 0.114 |
| Placebo | 0.79 (0.74) | 0.79 (0.7) | 0.88 (0.7) | 0.59 (0.56) | –0.19 (0.78) | ||||||
| Naming | Probiotic | 0 (0) | 1.000 | 0 (0) | 1.000 | 0 (0) | 1.000 | 0 (0) | 0.367 | 0 (0) | 0.367 |
| Placebo | 0 (0) | 0 (0) | 0 (0) | 0.03 (0.18) | 0.03 (0.18) | ||||||
| Constructions | Probiotic | 0.19 (0.4) | 0.213 | 0.45 (0.51)* | 0.021† | 0.27 (0.45) | 0.621 | 0.21 (0.42) | 0.573 | 0 (0.54) | 0.188 |
| Placebo | 0.33 (0.48) | 0.18 (0.39) | 0.21 (0.42) | 0.16 (0.37) | –0.19 (0.54) | ||||||
| Ideational praxis | Probiotic | 0.36 (0.8) | 0.664 | 0.23 (0.62) | 0.854 | 0.2 (0.61) | 0.605 | 0.18 (0.61) | 0.842 | –0.11 (0.83) | 0.274 |
| Placebo | 0.39 (0.7) | 0.21 (0.49) | 0.12 (0.42) | 0.09 (0.3)* | –0.31 (0.69) | ||||||
| Orientation | Probiotic | 0.42 (0.62) | 0.032† | 0.52 (0.89) | 0.314 | 0.43 (0.77) | 0.126 | 0.21 (0.42)* | 0.856 | –0.25 (0.52) | 0.023† |
| Placebo | 0.15 (0.44) | 0.3 (0.64) | 0.15 (0.36) | 0.22 (0.49) | 0.06 (0.5) | ||||||
| Word recognition | Probiotic | 1.65 (1.16) | 0.834 | 1.72 (1.2) | 0.114 | 1.79 (1.66) | 0.183 | 1.58 (1.37) | 0.244 | –0.06 (1.41) | 0.156 |
| Placebo | 1.91 (1.7) | 1.35 (1.32) | 1.27 (1.34)** | 1.31 (1.64)* | –0.53 (1.52) | ||||||
| Recall of test | |||||||||||
| instructions | Probiotic | 0.03 (0.18) | 0.982 | 0.03 (0.18) | 0.317 | 0 (0) | 1.000 | 0.04 (0.19) | 0.300 | 0 (0.28) | 0.603 |
| Placebo | 0.06 (0.35) | 0 (0) | 0 (0) | 0 (0) | –0.06 (0.35) | ||||||
Data are indicated as mean (SD). p value shows inter-group difference (probiotics versus placebo) (Wilcoxon rank-sum test), †p < 0.05. Difference from baseline was analyzed by Wilcoxon signed rank Test), *p < 0.05, **p < 0.01, ***p < 0.001.
Table 5
Subgroup analysis of cognitive tests by MMSE based on baseline MMSE scores
| Group | Baseline | Week 8 | Week 16 | Week 24 | ⊿ Week 24 | ||||||
| Mean (SD) | p | Mean (SD) | p | Mean (SD) | p | Mean (SD) | p | Mean (SD) | p | ||
| MMSE < 25 | |||||||||||
| MMSE total score | Probiotic | 23.29 (0.69) | 0.189 | 26.42 (2.26)*** | 0.899 | 27.29 (1.99)*** | 0.059 | 26.52 (2.52)*** | 0.909 | 3.26 (2.34) | 0.843 |
| Placebo | 23.52 (0.7) | 26.08 (3.1)*** | 26 (2.42)*** | 26.44 (2.58)*** | 2.96 (2.59) | ||||||
| Orientation in time | Probiotic | 4.5 (0.51) | 0.907 | 4.79 (0.42) | 0.757 | 4.79 (0.51) | 0.180 | 4.87 (0.63) | 0.006# | 0.35 (0.71) | 0.078 |
| Placebo | 4.37 (0.93) | 4.65 (0.75) | 4.44 (0.96) | 4.36 (1.04) | 0 (0.76) | ||||||
| Orientation in place | Probiotic | 4.63 (0.5) | 0.386 | 4.67 (0.76) | 0.427 | 4.83 (0.38) | 0.502 | 4.87 (0.34) | 0.108 | 0.26 (0.54) | 0.653 |
| Placebo | 4.41 (0.75) | 4.5 (0.86) | 4.72 (0.54) | 4.6 (0.65) | 0.2 (0.87) | ||||||
| Registration | Probiotic | 3 (0) | 0.366 | 2.96 (0.2) | 0.317 | 3 (0) | 1.000 | 3 (0) | 1.000 | 0 (0) | 1.000 |
| Placebo | 2.96 (0.19) | 3 (0) | 3 (0) | 3 (0) | 0 (0) | ||||||
| Serial-7 s | Probiotic | 1.25 (0.79) | 0.543 | 3.04 (1.83)*** | 0.968 | 3.29 (1.63)*** | 0.842 | 2.57 (1.88)** | 0.062 | 1.3 (2.1) | 0.313 |
| Placebo | 1.63 (1.45) | 3.12 (1.61)** | 3.16 (1.77)*** | 3.44 (1.45)*** | 1.88 (1.88) | ||||||
| Recall | Probiotic | 1.88 (0.85) | 0.617 | 2.5 (0.89)** | 0.857 | 2.67 (0.57)*** | 0.114 | 2.61 (0.66)*** | 0.850 | 0.74 (0.81) | 0.929 |
| Placebo | 1.78 (0.8) | 2.42 (0.99)** | 2.4 (0.65)** | 2.52 (0.82)*** | 0.72 (0.89) | ||||||
| Naming | Probiotic | 2 (0) | 1.000 | 2 (0) | 1.000 | 2 (0) | 1.000 | 2 (0) | 1.000 | 0 (0) | 1.000 |
| Placebo | 2 (0) | 2 (0) | 2 (0) | 2 (0) | 0 (0) | ||||||
| Repetition | Probiotic | 0.75 (0.44) | 0.723 | 0.83 (0.38) | 0.156 | 0.92 (0.28) | 0.026† | 0.83 (0.39) | 0.587 | 0.09 (0.6) | 0.970 |
| Placebo | 0.7 (0.47) | 0.65 (0.49) | 0.64 (0.49) | 0.76 (0.44) | 0.08 (0.57) | ||||||
| Three-stage command | Probiotic | 2.83 (0.38) | 0.129 | 2.88 (0.45) | 0.918 | 2.88 (0.34) | 0.620 | 2.91 (0.29) | 0.144 | 0.09 (0.42) | 0.599 |
| Placebo | 2.96 (0.19) | 2.92 (0.27) | 2.92 (0.28) | 3 (0) | 0.04 (0.2) | ||||||
| Reading | Probiotic | 0.96 (0.2) | 0.307 | 0.92 (0.28) | 0.524 | 1 (0) | 1.000 | 1 (0) | 0.359 | 0.04 (0.21) | 0.170 |
| Placebo | 1 (0) | 0.96 (0.2) | 1 (0) | 0.96 (0.2) | –0.04 (0.2) | ||||||
| Writing | Probiotic | 0.67 (0.48) | 0.235 | 0.88 (0.34) | 0.931 | 0.92 (0.28)* | 0.255 | 0.91 (0.29)* | 0.280 | 0.26 (0.45) | 0.045† |
| Placebo | 0.82 (0.4) | 0.89 (0.33) | 0.8 (0.41) | 0.8 (0.41) | 0 (0.41) | ||||||
| Construction | Probiotic | 0.83 (0.38) | 0.580 | 0.96 (0.2) | 0.977 | 1 (0) | 0.170 | 0.96 (0.21) | 0.317 | 0.13 (0.46) | 0.613 |
| Placebo | 0.89 (0.32) | 0.96 (0.2) | 0.92 (0.28) | 1 (0) | 0.08 (0.28) | ||||||
| MMSE≥25 | |||||||||||
| MMSE total score | Probiotic | 25.45 (0.51) | 0.620 | 27.26 (2.22)*** | 0.854 | 27.57 (2.11)*** | 0.317 | 27.54 (2.29)*** | 0.700 | 2.07 (2.16) | 0.701 |
| Placebo | 25.52 (0.51) | 27.15 (2.29)*** | 27.97 (2.3)*** | 27.88 (2.03)*** | 2.38 (2) | ||||||
| Orientation in time | Probiotic | 4.74 (0.58) | 0.866 | 4.55 (0.85) | 0.658 | 4.67 (0.61) | 0.229 | 4.79 (0.42) | 0.856 | 0.04 (0.69) | 0.881 |
| Placebo | 4.79 (0.49) | 4.67 (0.65) | 4.85 (0.36) | 4.78 (0.49) | 0 (0.57) | ||||||
| Orientation in place | Probiotic | 4.61 (0.62) | 0.136 | 4.87 (0.34) | 0.673 | 4.8 (0.76) | 0.557 | 4.96 (0.19)* | 0.943 | 0.32 (0.61) | 0.228 |
| Placebo | 4.79 (0.55) | 4.88 (0.42) | 4.94 (0.24) | 4.97 (0.18) | 0.19 (0.59) | ||||||
| Registration | Probiotic | 3 (0) | 0.348 | 3 (0) | 1.000 | 3 (0) | 1.000 | 2.96 (0.19) | 0.300 | –0.04 (0.19) | 0.167 |
| Placebo | 2.97 (0.17) | 3 (0) | 3 (0) | 3 (0) | 0.03 (0.18) | ||||||
| Serial-7 s | Probiotic | 2.16 (1.34) | 0.147 | 3.61 (1.76)** | 0.296 | 3.63 (1.52)*** | 0.771 | 3.32 (1.83)** | 0.658 | 1.14 (2.05) | 0.254 |
| Placebo | 1.88 (1.39) | 3.21 (1.69)*** | 3.67 (1.71)*** | 3.59 (1.72)*** | 1.69 (1.98) | ||||||
| Recall | Probiotic | 2.45 (0.81) | 0.902 | 2.61 (0.67) | 0.658 | 2.67 (0.66) | 0.208 | 2.79 (0.63) | 0.672 | 0.32 (0.77) | 0.817 |
| Placebo | 2.49 (0.76) | 2.67 (0.69) | 2.76 (0.71)* | 2.75 (0.62)* | 0.28 (0.63) | ||||||
| Naming | Probiotic | 2 (0) | 1.000 | 2 (0) | 1.000 | 2 (0) | 1.000 | 2 (0) | 1.000 | 0 (0) | 1.000 |
| Placebo | 2 (0) | 2 (0) | 2 (0) | 2 (0) | 0 (0) | ||||||
| Repetition | Probiotic | 0.84 (0.37) | 0.405 | 0.9 (0.3) | 0.766 | 0.97 (0.18) | 0.628 | 0.89 (0.32) | 0.546 | 0.07 (0.26) | 0.680 |
| Placebo | 0.91 (0.29) | 0.88 (0.33) | 0.94 (0.24) | 0.94 (0.25) | 0.03 (0.4) | ||||||
| Three-stage command | Probiotic | 2.94 (0.25) | 0.962 | 2.97 (0.18) | 0.982 | 2.9 (0.31) | 0.268 | 2.93 (0.26) | 0.492 | 0 (0.27) | 0.688 |
| Placebo | 2.94 (0.24) | 2.97 (0.17) | 2.97 (0.17) | 2.97 (0.18) | 0.03 (0.31) | ||||||
| Reading | Probiotic | 1 (0) | 1.000 | 0.97 (0.18) | 0.608 | 1 (0) | 1.000 | 1 (0) | 0.367 | 0 (0) | 0.367 |
| Placebo | 1 (0) | 0.94 (0.24) | 1 (0) | 0.97 (0.18) | –0.03 (0.18) | ||||||
| Writing | Probiotic | 0.74 (0.45) | 0.167 | 0.87 (0.34) | 0.036† | 0.97 (0.18)* | 0.628 | 0.89 (0.32) | 0.251 | 0.18 (0.55) | 0.445 |
| Placebo | 0.88 (0.33) | 1 (0) | 0.94 (0.24) | 0.97 (0.18) | 0.09 (0.39) | ||||||
| Construction | Probiotic | 0.97 (0.18) | 0.194 | 0.9 (0.3) | 0.603 | 0.97 (0.18) | 0.362 | 1 (0) | 0.190 | 0.04 (0.19) | 0.740 |
| Placebo | 0.91 (0.28) | 0.94 (0.24) | 0.91 (0.29) | 0.94 (0.25) | 0.06 (0.44) | ||||||
Data are indicated as mean (SD). p value shows inter-group difference (probiotics versus placebo) (Wilcoxon rank-sum test), †p < 0.05. Difference from baseline was analyzed by Wilcoxon signed rank Test), *p < 0.05, **p < 0.01, ***p < 0.001.
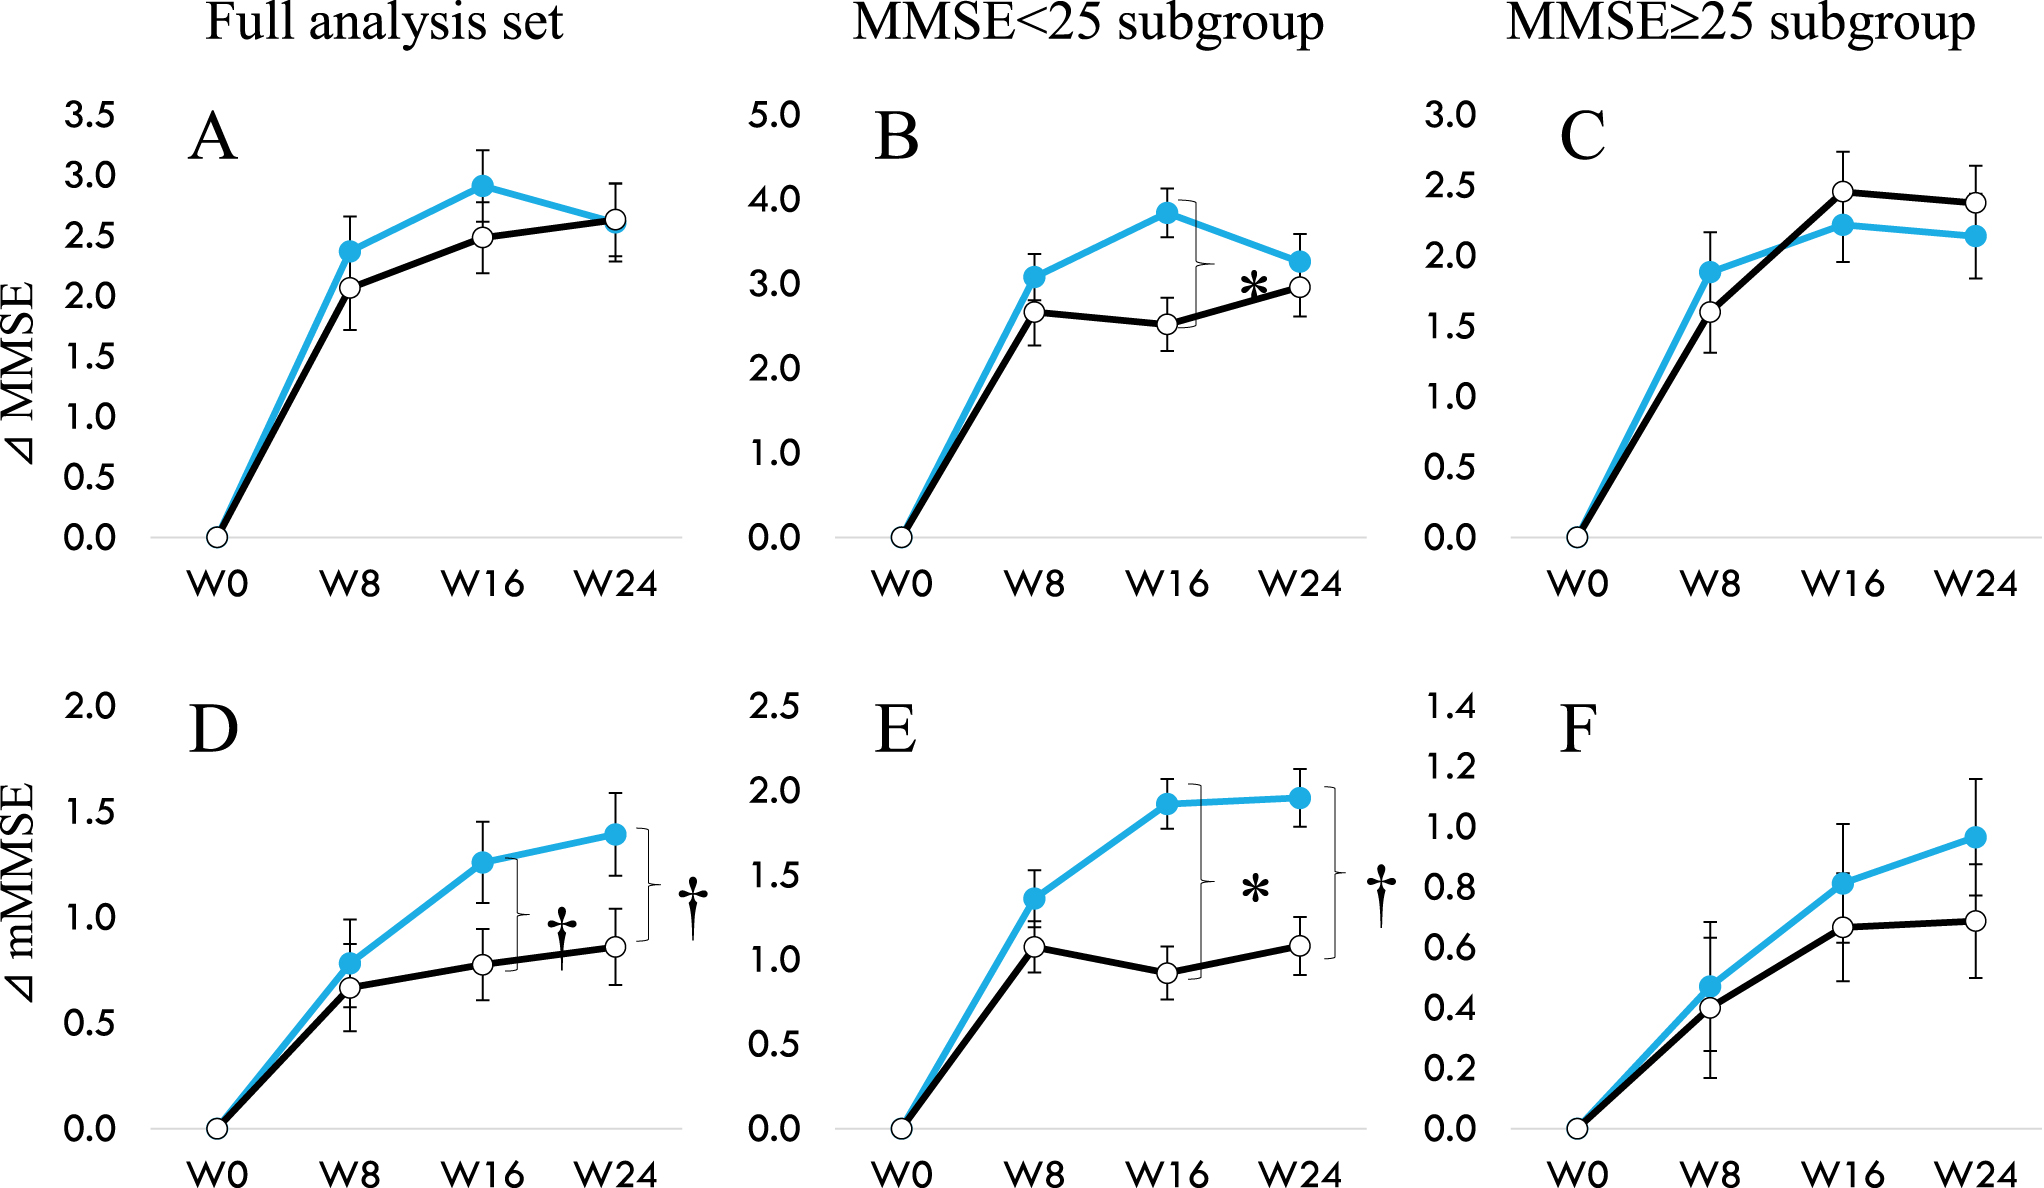
When we looked at mMMSE that does not include Serial-7 for participants in the FAS, MMSE < 25 or≥25 (Table 6, Fig. 2), significant intergroup difference was observed in the total mMMSE scores at week 16 (p = 0.011) along with a tendency of difference at week 24 (p = 0.061) in the MMSE < 25 sub-group. A trend towards significant improvement over placebo was found in the changes from baseline in FAS (p = 0.059), and this effect is seen mainly in participants with MMSE < 25 (p = 0.060). There was no difference in the MMSE≥25 subgroup between the probiotic and placebo groups. This data is per our previous observations that B. breve MCC1274 showed that individuals with more severe cognitive impairment benefit from consuming this probiotic daily instead of mildly impaired [12, 13].
Table 6
Summary of modified MMSE (mMMSE) total score
| Group | Baseline | Week 8 | Week 16 | Week 24 | ⊿ Week 24 | ||||||
| Mean (SD) | p | Mean (SD) | p | Mean (SD) | p | Mean (SD) | p | Mean (SD) | p | ||
| Full analysis set | Probiotic | 22.75 (1.38) | 0.718 | 23.53 (1.45)*** | 0.974 | 23.96 (1.2)*** | 0.287 | 24.1 (1.17)*** | 0.187 | 1.39 (1.4) | 0.0587 |
| Placebo | 22.85 (1.69) | 23.52 (1.98)** | 23.67 (1.63)*** | 23.72 (1.71)*** | 0.86 (1.37) | ||||||
| Subgroup (MMSE < 25) | Probiotic | 21.96 (1.06) | 0.697 | 23.36 (1.5)*** | 0.458 | 23.92 (0.95)*** | 0.011† | 23.96 (1.15)*** | 0.061 | 1.96 (1.22) | 0.0604 |
| Placebo | 21.82 (1.56) | 22.96 (2.23)*** | 22.84 (1.8)*** | 23 (2.12)*** | 1.08 (1.29) | ||||||
| Subgroup (MMSE≥25) | Probiotic | 23.26 (1.31) | 0.279 | 23.71 (1.38)** | 0.467 | 23.97 (1.38)*** | 0.294 | 24.24 (1.18)*** | 0.888 | 0.97 (1.38) | 0.409 |
| Placebo | 23.59 (1.32) | 23.97 (1.62) | 24.3 (1.16)** | 24.28 (1.02)** | 0.69 (1.42) | ||||||
Data are indicated as mean (SD). p value shows inter-group difference (probiotics versus placebo) (Wilcoxon rank-sum test), †p < 0.05. Difference from baseline was analyzed by Wilcoxon signed rank Test), *p < 0.05, **p < 0.01, ***p < 0.001. Modified MMSE (mMMSE) are calculated by abstracting Serial-7 from the eleven items of MMSE.
Fig. 2
Change of MMSE (A to C) and change of mMMSE (D to E) from 0 to 24 weeks. A and D show data from the full analysis set. B and E for participants with baseline MMSE < 25, and C and F for participants with baseline MMSE≥25. Modified MMSE (mMMSE) are calculated by abstracting Serial-7 from the eleven items of MMSE. Filled circle (MCC1274), open circle (placebo). †p < 0.1, *p < 0.05, significant difference from Placebo group (Wilcoxon rank-sum test).
Relationship between VSRAD and scores of cognitive function tests
VSRAD data were obtained from 109 subjects at baseline. The difference of VSRAD scores in the subgroups divided by baseline MMSE scores (≥25 versus < 25) is shown in Table 7. There were significantly lower scores of VOI Z-score (1.02±0.55 versus 1.31±0.78, p = 0.031), VOI extent scores (8.23±13.81 versus 20.17±24.63, p = 0.004) and ratio (2.18±3.10 versus 5.17±5.06, p = 0.002), but not GM extent score (3.66±1.77 versus 3.59±1.83, p = 0.956), in the MMSE-higher subgroup compared to the MMSE-lower subgroup. These data suggest that the MMSE-lower subgroup (< 25) had a progressed VOI-specific brain atrophy at baseline.
Table 7
Subgroup analysis of VSRAD by baseline MMSE scores
| VSRAD | ||||||||
| VOI Z-score | p | GM extent | p | VOI extent | p | Ratio | p | |
| All subjects (n = 109) | 1.15 (0.67) | 3.63 (1.79) | 13.49 (20.13) | 3.5 (4.64) | ||||
| MMSE≥25 (n = 61) | 1.02 (0.55) | 0.031 | 3.66 (1.77) | 0.956 | 8.23 (13.81) | 0.004 | 2.18 (3.10) | 0.002 |
| MMSE < 25 (n = 48) | 1.31 (0.78) | 3.59 (1.83) | 20.17 (24.63) | 5.17 (5.66) | ||||
Data are indicated as mean (SD). P value, inter-group difference (MMSE≥25 versus MMSE < 25) (Welch’s t test). VSRAD, Voxel-based Specific Regional Analysis System for Alzheimer’s Disease; VOI, volume of interest; GM, gray matter atrophy in the whole brain; Ratio, VOI extent/GM extent.
Correlation analysis coefficients between the VSRAD scores and each of the ADAS-Jcog and MMSE scores are shown in Supplementary Table 2. Regarding the ADAS-Jcog test, total score and subscale “orientation” were correlated with all VSRAD categories, and “word recall” was associated with VOI Z-score, GM extent, and VOI extent scores. On the other hand, the MMSE test showed that the total score was inversely correlated with VOI extent, and “orientation in time” was inversely correlated with all VSRAD parameters. Moreover, “recall” and mMMSE were inversely correlated with VOI Z-score, VOI extent, and ratio scores. Overall, this data from ADAS-Jcog and MMSE indicate that brain atrophy seen in MCI is associated with the ability of “word recall” and “orientation”, two tasks that require hippocampal short-term memory function (word recall) and the inferior parietal lobe (orientation) [26].
Effect of B. breve MCC1274 supplementation on VSRAD
VSRAD data were obtained from 89 subjects for both baseline and week 24. There was no difference in the baseline age and MMSE scores (Table 1), so data analysis of VSRAD was conducted on this data set. Changes in VSRAD score before and after the intervention is shown in Table 8. An increase in the scores of GM extent (p < 0.05) and VOI extent (p < 0.1) was observed in the placebo group but not in the probiotic group, suggesting an increase in brain atrophy over time in untreated participants only (Supplementary Figure 1). A significant intergroup difference was observed in the changes from baseline of GM extent score (p = 0.013). Subgroup analyses were performed according to VOI Z-score at baseline (≥1.0 versus < 1.0, Table 9). For those with a Z-score<1, the GM extent score tended to increase in the placebo group, but there were no marked changes for other parameters in both groups. On the other hand, for those with a Z-score ≥1.0, VOI Z-score (p < 0.05), VOI extent (p < 0.01), and Ratio scores (p < 0.05) were significantly increased from baseline in the placebo group, but not in the probiotic group. A nearly significant difference was observed in the changes from baseline in these parameters between the two groups (VOI Z score: p = 0.086; GM extent: p = 0.057; VOI extent: p = 0.055).
Table 8
Summary of VSRAD variability in the full analysis set
| Group | Baseline | Week 24 | ⊿ Week 24 | p | |
| VOI Z-score | Probiotic | 1.21 (0.69) | 1.22 (0.75) | 0.01 (0.17) | 0.357 |
| Placebo | 1.02 (0.6) | 1.04 (0.62) | 0.02 (0.11) | ||
| GM extent | Probiotic | 3.64 (1.82) | 3.56 (1.63) | –0.07 (0.45) | 0.013 |
| Placebo | 3.56 (1.91) | 3.73 (2.06)* | 0.16 (0.42) | ||
| VOI extent | Probiotic | 15.98 (20.76) | 16.41 (21.78) | 0.43 (4.99) | 0.527 |
| Placebo | 9.75 (19.04) | 10.74 (19.97)† | 0.98 (2.45) | ||
| Ratio | Probiotic | 3.97 (4.39) | 3.98 (4.4) | 0.01 (1.33) | 0.97 |
| Placebo | 2.5 (4.25) | 2.74 (4.41) | 0.24 (0.95) |
Data are indicated as mean (SD). p value shows inter-group difference (probiotics versus placebo) (Wilcoxon rank-sum test). Difference from baseline was analyzed by Wilcoxon signed rank Test), †p < 0.1, *p < 0.05. VSRAD, Voxel-based Specific Regional Analysis System for Alzheimer’s Disease; VOI, volume of interest; GM, gray matter atrophy in the whole brain; Ratio, VOI extent/GM extent.
Table 9
Subgroup analysis of VSRAD variability by baseline VOI Z-score
| Group | Baseline | Week 24 | ⊿ Week 24 | p | ||
| Subgroup VOI Z-score ≥ 1.0 | ||||||
| VOI Z-score | Probiotic | n = 22 | 1.69 (0.62) | 1.72 (0.71) | 0.02 (0.22) | 0.086 |
| Placebo | n = 16 | 1.61 (0.69) | 1.7 (0.67)* | 0.09 (0.12) | ||
| GM extent | Probiotic | n = 22 | 4.3 (2.14) | 4.15 (1.8) | –0.15 (0.51) | 0.056 |
| Placebo | n = 16 | 4 (2.15) | 4.16 (2.34) | 0.16 (0.44) | ||
| VOI extent | Probiotic | n = 22 | 29.32 (21.12) | 29.86 (22.84) | 0.54 (6.86) | 0.055 |
| Placebo | n = 16 | 26.57 (25.54) | 29.58 (25.41)** | 3 (3.26) | ||
| Ratio | Probiotic | n = 22 | 7.11 (3.92) | 7.09 (3.98) | –0.02 (1.83) | 0.287 |
| Placebo | n = 16 | 6.6 (5.28) | 7.41 (4.9)* | 0.81 (1.44) | ||
| Subgroup VOI Z-score < 1.0 | ||||||
| VOI Z-score | Probiotic | n = 20 | 0.68 (0.21) | 0.67 (0.26) | –0.01 (0.1) | 0.923 |
| Placebo | n = 31 | 0.71 (0.14) | 0.7 (0.16) | –0.01 (0.1) | ||
| GM extent | Probiotic | n = 20 | 2.91 (1.02) | 2.93 (1.14) | 0.02 (0.42) | 0.118 |
| Placebo | n = 31 | 3.34 (1.76) | 3.5 (1.89)† | 0.16 (0.42) | ||
| VOI extent | Probiotic | n = 20 | 1.31 (2) | 1.62 (2.73) | 0.31 (0.76) | 0.383 |
| Placebo | n = 31 | 1.07 (1) | 1.01 (1.28) | –0.06 (0.76) | ||
| Ratio | Probiotic | n = 20 | 0.52 (0.83) | 0.56 (0.89) | 0.05 (0.26) | 0.404 |
| Placebo | n = 31 | 0.39 (0.38) | 0.32 (0.41) | –0.06 (0.26) |
Data are indicated as mean (SD). p value shows inter-group difference (probiotics versus placebo) (Wilcoxon rank-sum test). Difference from baseline was analyzed by Wilcoxon signed rank Test), †p < 0.1, *p < 0.05, **p < 0.01. VSRAD, Voxel-based Specific Regional Analysis System for Alzheimer’s Disease; VOI, volume of interest; GM, gray matter atrophy in the whole brain; Ratio, VOI extent/GM extent.
Gut microbiota
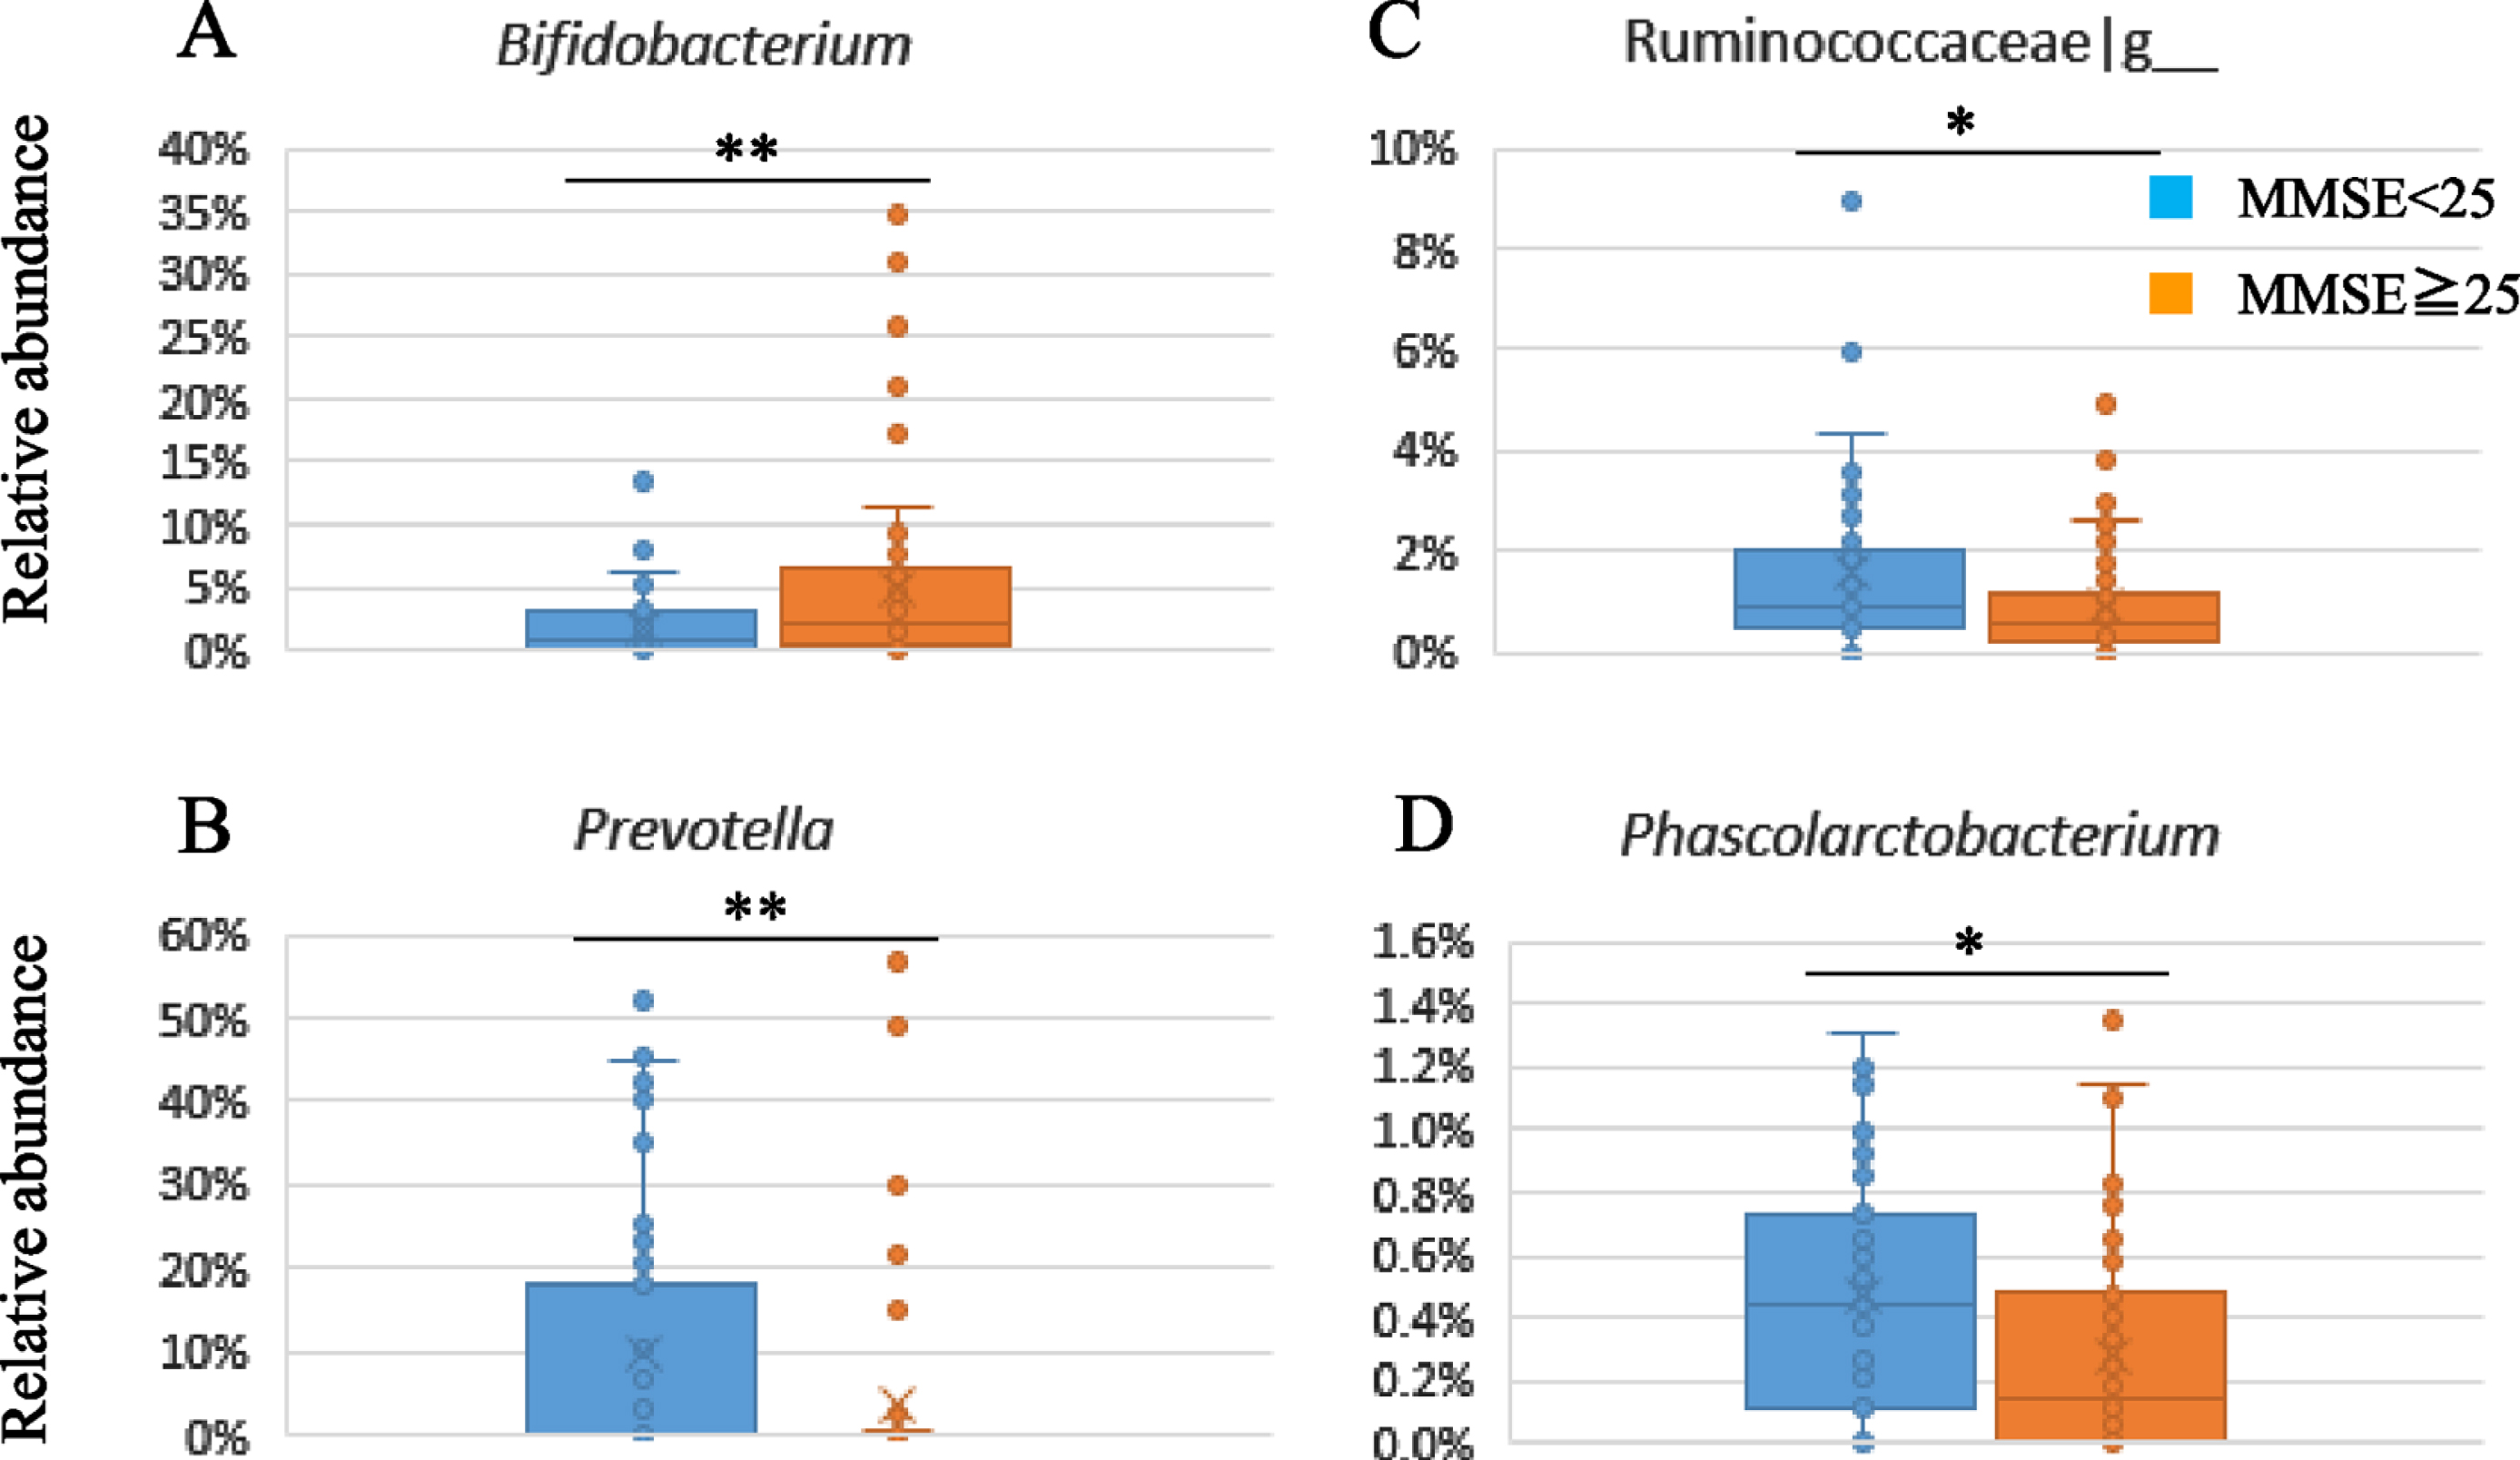
The fecal samples were analyzed by 16S rRNA gene sequencing to evaluate the composition of gut microbiota. Supplementary Table 3 shows the gut microbiota composition in the subgroups divided by baseline MMSE scores (≥25 versus < 25). There was a significant lower relative abundance of Actinobacteria at the phylum level and Bifidobacterium at the genus level (p = 0.006) in the lower subgroup of baseline MMSE score (< 25) compared to the higher subgroup (≥25) (Suppplememtary Table 3, Fig. 3A). On the other hand, the relative abundance of Prevotella (p = 0.009), Clostridiaceae|g__ (p = 0.007), Ruminococcaceae|g__ (p = 0.044), and Phascolarctobacterium (p = 0.041) were significantly higher in the lower subgroup (Fig. 3B-D).
Fig. 3
Subgroup analysis of gut microbiota composition by baseline MMSE scores.
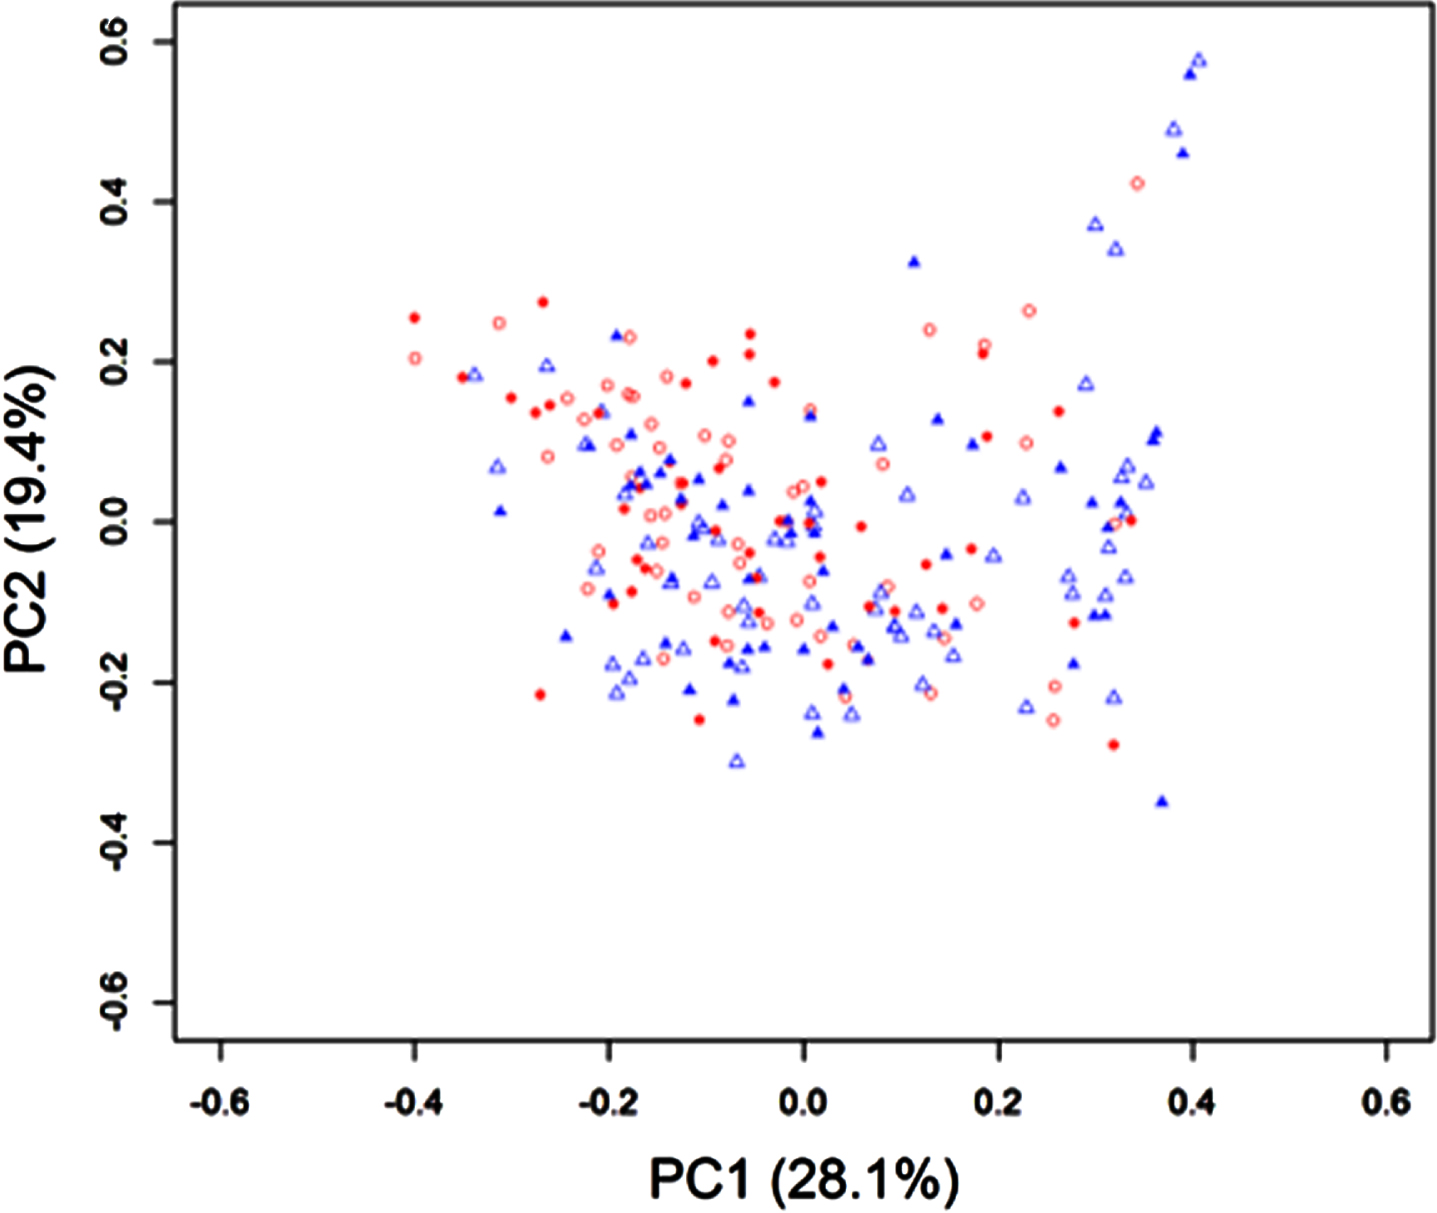
When we look at the influence of sample con-sumption on the gut microbiota composition, Bray-Curtis PCoA based on the genus level composition showed no significant difference between groups and before and after the sample intake (Fig. 4). Likewise, no significant change was observed from baseline by the probiotic supplementation, although there was some fluctuation in the placebo group (Firmicutes, p = 0.083; Lachnospira, p = 0.09; Haemophilus, p = 0.027) (Supplementary Table 4).
Fig. 4
Gut microbiota profiles by Bray-Curtis PCoA based on the genus level composition between groups and before and after the sample intake of Bifidobacterium breve MCC1274 or placebo. Open triangle: Placebo group at baseline; Open circle: Probiotic group at baseline; Filled triangle: Placebo group after intervention; Filled circle: Probiotic group after intervention.
DISCUSSION
In this study, neuropsychological tests by ADAS-Jcog and MMSE showed the improvement of cognitive function on some subscales scores but not the total scores by the consumption of B. breve MCC1274 in the MCI subjects. In addition, the probiotic supplementation for 24 weeks suppressed brain atrophy progression as assessed by VSRAD based on brain MRI. We also observed differences in the VSRAD scores as well as the gut microbiota composition between subgroups based on the baseline MMSE scores (≥25 versus < 25). No marked impact was observed on the gut microbiota by the probiotic consumption.
Several kinds of tests are used to confirm a diagnosis of MCI. The most widely used test to assess the development of anti-dementia drugs has been the Alzheimer’s Disease Assessment Scale–Cognitive subscale (ADAS-Cog) [27]. However, the original ADAS-cog had shown limited sensitivity to detect changes over time in the early-AD population when therapies were testing the AD amyloid hypothesis [28]. This limitation is thought to be due to the lack of measures to assess sensitivity to change in cognitive domains that are impaired early in the condition, such as attention and executive functions [29]. For this reason, variants of the original ADAScog were developed, such as ADAS-cog3 and ADAS-cog5, to help capture treatment effects over time and get around several ceiling effects but with mixed success [29]. We could confirm the limitations of the ADAS-cog11 (ADAS-Jcog) utilization to evaluate an intervention in the MCI population when looking at the overall score change comparing placebo to the probiotic B. breve MCC1274. However, in our study, participants taking B. breve MCC1274 deteriorated significantly less than those taking placebo for “orientation” (p = 0.021). The “orientation” measures the capacity of an individual to answer year correctly, month, day, week date, time of day, place, and person (ref: https://www.fda.gov/media/122843/download, p. 29). In addition, together with “word recall” and “word recognition”, it is one of the three tasks amongst the ADAS-cog11 demonstrating the most significant standardized response means in the MCI population [27].
The other test we have used in this study to detect cognitive function improvement by B. breve MCC1274 is the MMSE. The simplicity of this test (11 questions) makes it practical to assess people’s cognition quickly and, in particular, those suspected of suffering from MCI [30]. However, it is not as sensitive as RBANS, which we used successfully to demonstrate the cognitive skills enhancing abilities of B. breve MCC1274 recently in a similar Asian population [12]. FAS did not show any significant difference between groups; however, when separating total MMSE more severe (< 25) and less severe (≥25), we observe a significant effect of the probiotic for the ADAS-Jcog “orientation” subdomain (p = 0.022) over placebo as well as the MMSE “orientation in time” (p = 0.006) in participants with more severe cognitive impairment (MMSE < 25). A related score, “orientation in place”, showed an improvement trend over placebo (p = 0.108). Both subdomain tests related to orientation (in ADAS-Jcog and MMSE) got favorable results in the probiotic group, suggesting that B. breve MCC1274 consumption improves a brain region called the inferior parietal lobe, an area required for fulfilling orientation tasks [26].
We have calculated a modified MMSE score (mMMSE), which makes abstraction of the Serial-7 since it has been reported that Japanese subjects with MCI tend to perform better than in other populations [18]. By omitting Serial-7, we observe a nearly significant improvement of the mMMSE for the FAS (p = 0.0587) and participants with MMSE < 25 (p = 0.0604) (Fig. 2). However, no effect is seen for participants with milder cognitive impairment (MMSE≥25). These data strongly support the potential of B. breve MCC1274 consumption in improving cognitive function of the MCI subjects.
VSRAD allows images manipulation and statistical analysis based on the theory of VBM. VSRAD can evaluate the degree of brain atrophy in the medial temporal region, including the hippocampus, parahippocampal gyrus, and amygdala, called VOI, which shows profound changes in AD. One of the critical features of VBM is that it can absorb inter-personal differences in brain size and shape by morphologically transforming only the specific tissue of interest in a subject’s brain image and aligning it with one particular “standard capacity”. This allows statistical comparison of brain volumes of several different subjects on a shared image space on a voxel scale. Based on such voxel-scale analysis, four parameters, VOI Z-score, GM extent, VOI extent, and ratio scores, are calculated by VSRAD. In general, if the value of VOI Z-score is < 1, there is almost no brain atrophy; if the value is within 1–2, atrophy is slightly observed, and if the value is > 2, substantial atrophy is detected [22]. GM extent and VOI extent scores represent the percentage of atrophy in the gray matter of the whole brain and VOI, respectively.
Previous studies have demonstrated the correlation between the MMSE total score and the degree of atrophy in VOI regions, including the hippocampus, amygdala, and parahippocampal gyrus [21]. In terms of the VSRAD data, we first evaluated the association with cognitive function scores. As shown in Table 7, subgroup analysis based on the median MMSE score showed significant differences in all parameters except the GM extent score. In confirming the previous report, our study showed a progressive degree of atrophy in the VOI region in subjects with lower MMSE scores, demonstrating that these subjects’ impaired cognitive function is not mainly owing to aging-induced decline. Our data confirmed the usefulness of VSRAD imaging diagnosis.
Furthermore, the uniqueness of this study is that we investigated the correlation between brain atrophy and the MMSE and ADAS-Jcog at the subscale level, as shown in Supplementary Table 2. We found that the correlation was exceptionally high with categories related to recall and orientation. Regarding the ADAS-Jcog test, total score and “orientation” were correlated with all VSRAD categories, and “word recall” was correlated with VOI Z-score, GM extent, and VOI extent scores. On the other hand, the MMSE test showed that the total score was inversely correlated with VOI extent, and “orientation in time” was inversely correlated with all VSRAD parameters. Moreover, “recall” and mMMSE were inversely correlated with VOI Z-score, VOI extent, and Ratio scores. To the best of our knowledge, this study is the first to investigate the relationship between VSRAD and cognitive function scores in a subdomain, and our results look very reasonable since memory impairment and disorientation are both core symptoms at the early stage of dementia.
Regarding brain atrophy in the placebo and probiotic groups, several parameters reflecting brain atrophy significantly worsened in the placebo group, while none of the parameters changed in the probiotic group. In those with brain atrophy with a VSRAD Z-score ≥1 at baseline, the placebo group showed a significant increase in VOI Z-score, VOI extent, and Ratio scores within 24 weeks, indicating brain atrophy progression. On the other hand, in the probiotic group, these values did not change, suggesting that B. breve MCC1274 suppresses the progression of brain atrophy. Interestingly, we recently observed that the suppression of brain atrophy by B. breve MCC1274 consumption is also seen in a tau transgenic mouse model with a possible mechanism mediated by the modulation of inflammatory reaction (manuscript submitted for review).
While this is the first report of a probiotic stopping brain atrophy in an MCI population, there have been reports of small molecules possessing anti-inflammatory activity having similar effects. One of these is ibudilast, a phosphodiesterase inhibitor showing anti-inflammatory effects studied in a multiple sclerosis trial [31]. According to a meta-analysis of longitudinal randomized placebo-controlled trials, approved AD drugs such as acetylcholine esterase inhibitors showed limited but significant prevention of brain atrophy [32]. In contrast, memantine did not prevent brain atrophy [33]. Tramiprosate (homotaurine) demonstrated dose-dependent preservation of hippocampal volume using MRI and was proposed to act via its anti-inflammatory effect in amnestic MCI population [34]. Another clinical intervention using a combination of high-dose folic acid, vitamin B6, and B12 in MCI subjects was associated with reducing the inflammatory marker homocysteine and a 53% reduction of brain atrophy [35].
A critical type of specific inflammation that will lead to gray matter atrophy is vascular inflammation [36]. Peripheral inflammation can disrupt the blood-brain barrier (BBB) and allow peripheral monocytes and neutrophils to get in the brain parenchyma, exacerbating inflammation [37–39]. Inflammation to brain vasculature also affects astrocytic cell function. Astrocytes sense blood nutrients as blood vessels in the CNS are ensheathed by astrocytes endfeet that regulate BBB permeability and coordinate the entrance of nutrients into the brain [40]. Considering that brain vasculature is also part of the lymphatic drainage system [41], any damage caused by inflammation of cells involved in such system is likely to impact the brain profoundly and potentially contribute to brain atrophy [42, 43]. In support of this possibility, previous studies have shown in mice that gut microbiota associated with pro-inflammatory molecules production such as lipopolysaccharides can disrupt the BBB and that probiotic consumption that included Bifidobacterium strains had a positive impact on restoring [44, 45]. In that aspect, we speculate that consumption of the probiotic B. breve MCC1274 in MCI participants in this study may have regulated microglial cells activation. We observed this phenomenon previously in a pre-clinical model, where oral B. breve MCC1274 supplementation prevented memory impairment, decreased hippocampal amyloid-β levels, attenuated microglial activation, and repressed expression levels of pro-inflammatory cytokines in the brain of AppNL-G-F mice [46].
We have analyzed the gut microbiota composition of the study participants to get insights as to whether this could explain the prevention of brain atrophy and cognitive improvement. Multiple reports have shown the association of cognitive impairment with altered gut microbiome composition. The abundance of Proteobacteria is highly enriched while Firmicutes is significantly reduced in patients with AD [47]. Other studies have also shown decreased Firmicutes gut composition, increased Bacteroidetes, and decreased Bifidobacterium in AD subjects [7, 48]. In addition, the altered composition has also been reported in MCI patients, such as the higher prevalence of Bacteroides, enriched genera from Porphyromonadaceae family, and decreased the abundance of genera Blautia and Ruminococcus [49]. However, there is not yet a clear association of specific bacterial taxa with the pathogenicity of AD and MCI. The reasons for the reported differences between studies may be due analysis of populations from different countries and regions that are influenced by several variables such as diet, cultural factors, climate, and methodology for analysis. In this study, we could not compare the microbiota with healthy subjects; however, we observed an altered composition among MCI subjects with higher or lower MMSE scores, represented by lower relative abundance of Bifidobacterium and higher relative abundance of Prevotella, Clostridiaceae|g_, Ruminococcaceae|g_, and Phascolarctobacterium in the subgroup with lower MMSE baseline score (< 25). Prevotella is a genus with vast genetic diversity, and some of them have been associated with gut inflammation [50]. Guo et al. reported that patients with AD had increased Prevotella at the genus level compared with healthy controls [51]. Phascolarctobacterium can produce short-chain fatty acids, including acetate and propionate, and is more abundant in the AD spectrum [52]. Bifidobacterium is a dominant genus in the human gut, and both decrease and increase in abundance in AD patients have been reported [48, 52]. The Japanese population is known to have a higher prevalence of Bifidobacterium in the gut [53]. As far as we know, our study is the first report about the difference in gut microbiota composition in MCI subjects associated with the severity of cognitive impairments.
When considering the impact of the treatment on the gut microbiota, we found some fluctuation in the composition in the placebo group during the 24 weeks intervention, but there was no marked change in the probiotic group. These results may imply that probiotic supplementation plays some role in maintaining the balance of the gut microbiota; nevertheless, the impact appears to be limited. As reported, it might not be feasible to alter the gut microbiota of healthy human subjects or MCI with a single probiotic [54]. We observed previously in a pre-clinical model that sonicated cell components and acetate, a specific metabolite produced by Bifidobacterium, partially improved the cognitive function activity in mice where amyloid-β is injected into mouse brains. However, live bacteria showed the most potent activity [10]. We suppose that cell components and metabolites produced by the live probiotic strain and factors generated by interaction with dietary components are possibly contributing to the mechanisms of this strain, which requires future investigation.
The main limitations of our study were the methods we used for neuropsychological tests to observe the cognitive improvement of the probiotic in this MCI population. We also initially powered the study to include a minimum of 70 participants per group, but this number could not be reached due to circumstances created by the COVID-19 pandemic. Future clinical studies using Peripheral Benzodiazepine Receptor (PBR) Pet-imaging (brain inflammation evaluation), VSRAD, and adequate cognitive tests for the MCI population, such as RBANS, will help clarify B. breve MCC1274’s mechanism and disease-modifying properties. Although we found a high adherence to the probiotic supplementation, it will be ideal to confirm trial participants’ compliance using a strain specific primer when assessing fecal samples in the future.
In conclusion, improvement of cognitive function was observed in subdomains of ADAS-Jcog and MMSE in this study that are known to change early before dementia sets in. Those changes were also correlated with the effects of the probiotic on preventing brain atrophy progression after 24-weeks of daily intake. These results indicate that B. breve MCC1274 is a practical approach for preventing cognitive impairment of MCI subjects. However, further research is necessary to understand B. breve MCC1274 mechanism(s) of action.
ACKNOWLEDGMENTS
We are grateful to the participants for their cooperation in this study. Furthermore, thanks are given to Tsuneyoshi Ota (Juntendo University), Nobuhito Shibata, Masako Furuta (Juntendo Tokyo Koto Geriatric Medical Center), and Taro Osada (Juntendo University) for their support and valuable discussion.
This study has received grants from the JSPS KAKENHI (Grants-in-Aid for Scientific Research, JP19K11724). There was no direct involvement from the funding sources in this study. Morinaga Milk Industries Co., Ltd provided the samples. The corresponding author had the final responsibility to submit the paper for publication.
Authors’ disclosures available online (https://www.j-alz.com/manuscript-disclosures/22-0148r1).
SUPPLEMENTARY MATERIAL
[1] The supplementary material is available in the electronic version of this article: https://dx.doi.org/10.3233/JAD-220148.
REFERENCES
[1] | Landau SM , Harvey D , Madison CM , Reiman EM , Foster NL , Aisen PS , Petersen RC , Shaw LM , Trojanowski JQ , Jack CR , Weiner MW , Jagust WJ ((2010) ) Comparing predictors of conversion and decline in mild cognitive impairment. Neurology 75: , 230–238. |
[2] | Reid G ((2005) ) The importance of guidelines in the development and application of probiotics. Curr Pharm Des 11: , 11–16. |
[3] | Doulberis M , Papaefthymiou A , Polyzos SA , Boziki M , Deretzi G , Giartza-Taxidou E , Vardaka E , Grigoriadis N , Katsinelos T , Touloumtzi M , Papanikopoulou K , Anastasiadou K , Georgopoulos S , Dardiotis E , Anastasiadis S , Katsinelos P , Kountouras J ((2019) ) Microbes and Alzheimer’ disease: Lessons from H. pylori and gut microbiota. Eur Rev Med Pharmacol Sci 23: , 426–430. |
[4] | Pistollato F , Cano SS , Elio I , Vergara MM , Giampieri F , Battino M ((2016) ) Role of gut microbiota and nutrients in amyloid formation and pathogenesis of Alzheimer disease. Nutr Rev 74: , 624–634. |
[5] | Tremlett H , Bauer KC , Appel-Cresswell S , Finlay BB , Waubant E ((2017) ) The gut microbiome in human neurological disease: A review. Ann Neurol 81: , 369–382. |
[6] | Hasan Mohajeri M , La Fata G , Steinert RE , Weber P ((2018) ) Relationship between the gut microbiome and brain function. Nutr Rev 76: , 481–496. |
[7] | Kowalski K , Mulak A ((2019) ) Brain-gut-microbiota axis in Alzheimer’s disease. J Neurogastroenterol Motil 25: , 48–60. |
[8] | Cryan JF , Dinan TG ((2012) ) Mind-altering microorganisms: The impact of the gut microbiota on brain and behaviour. Nat Rev Neurosci 13: , 701–712. |
[9] | Xiang S , Ji J-L , Li S , Cao X-P , Xu W , Tan L , Tan C-C ((2022) ) Efficacy and safety of probiotics for the treatment of Alzheimer’s disease, mild cognitive impairment, and Parkinson’s disease: A systematic review and meta-analysis. Front Aging Neurosci 14: , 730036. |
[10] | Kobayashi Y , Sugahara H , Shimada K , Mitsuyama E , Kuhara T , Yasuoka A , Kondo T , Abe K , Xiao JZ ((2017) ) Therapeutic potential of Bifidobacterium breve strain A1 for preventing cognitive impairment in Alzheimer’s disease. Sci Rep 7: , 13510. |
[11] | Kobayashi Y , Kinoshita T , Matsumoto A , Yoshino K , Saito I , Xiao JZ ((2019) ) Bifidobacterium breve A1 supplementation improved cognitive decline in older adults with mild cognitive impairment: An open-label, single-arm study. J Prev Alzheimers Dis 6: , 70–75. |
[12] | Xiao J , Katsumata N , Bernier F , Ohno K , Yamauchi Y , Odamaki T , Yoshikawa K , Ito K , Kaneko T ((2020) ) Probiotic Bifidobacterium breve in improving cognitive functions of older adults with suspected mild cognitive impairment: A randomized, double-blind, placebo-controlled trial. J Alzheimers Dis 77: , 139–147. |
[13] | Kobayashi Y , Kuhara T , Oki M , Xiao JZ ((2019) ) Effects of bifidobacterium breve A1 on the cognitive function of older adults with memory complaints: A randomised, double-blind, placebo-controlled trial. Benef Microbes 10: , 511–520. |
[14] | Mueller SG , Schuff N , Yaffe K , Madison C , Miller B , Weiner MW ((2010) ) Hippocampal atrophy patterns in mild cognitive impairment and Alzheimer’s disease. Hum Brain Mapp 31: , 1339–1347. |
[15] | Duara R , Loewenstein DA , Potter E , Appel J , Greig MT , Urs R , Shen Q , Raj A , Small B , Barker W , Schofield E , Wu Y , Potter H ((2008) ) Medial temporal lobe atrophy on MRI scans and the diagnosis of Alzheimer disease. Neurology 71: , 1986–1992. |
[16] | Jack CR , Shiung MM , Gunter JL , O’Brien PC , Weigand SD , Knopman DS , Boeve BF , Ivnik RJ , Smith GE , Cha RH , Tangalos EG , Petersen RC ((2004) ) Comparison of different MRI brain athrophy rate measures with clinical disease progression in AD. Neurology 62: , 591–600. |
[17] | Li F , Takechi H , Saito R , Ayaki T , Kokuryu A , Kuzuya A , Takahashi R ((2019) ) A comparative study: Visual rating scores and the voxel-based specific regional analysis system for Alzheimer’s disease on magnetic resonance imaging among subjects with Alzheimer’s disease, mild cognitive impairment, and normal cognition. Psychogeriatrics 19: , 95–104. |
[18] | Sugishita M , Koshizuka Y , Sudou S , Sugishita K , Hemmi I , Karasawa H , Ihara M , Takashi A , Mihara B ((2018) ) The validity and reliability of the Japanese version of the Mini-Mental State Examination (MMSE-J) with the original procedure of the attention and calculation task (2001). Japan J Cogn Neurosci 20: , 91–110. |
[19] | Hirata Y , Matsuda H , Nemoto K , Ohnishi T , Hirao K , Yamashita F , Asada T , Iwabuchi S , Samejima H ((2005) ) Voxel-based morphometry to discriminate early Alzheimer’s disease from controls. Neurosci Lett 382: , 269–274. |
[20] | Matsuda H , Mizumura S , Nemoto K , Yamashita F , Imabayashi E , Sato N , Asada T ((2012) ) Automatic voxel-based morphometry of structural MRI by SPM8 plus diffeomorphic anatomic registration through exponentiated lie algebra improves the diagnosis of probable Alzheimer disease. Am J Neuroradiol 33: , 1109–1114. |
[21] | Matsuda H ((2016) ) MRI morphometry in Alzheimer’s disease. Ageing Res Rev 30: , 17–24. |
[22] | Oshikubo G , Akahane A , Unno A , Watanabe Y , Ikebuchi E , Tochigi M , Hayashi N ((2020) ) Utility of VSRAD for diagnosing Alzheimer’s disease in patients screened for dementia. J Int Med Res 48: , 300060520917270. |
[23] | Matsuda H ((2015) ) Volumetry of cerebral gray and white matter using VSRAD®. Brain Nerve 67: , 487–496. |
[24] | Horigome A , Hisata K , Odamaki T , Iwabuchi N , Xiao JZ , Shimizu T ((2021) ) Colonization of supplemented Bifidobacterium breve M-16V in low birth weight infants and its effects on their gut microbiota weeks post-administration. Front Microbiol 12: , 610080. |
[25] | Callahan BJ , McMurdie PJ , Rosen MJ , Han AW , Johnson AJA , Holmes SP ((2016) ) DADA2: High-resolution sample inference from Illumina amplicon data. Nat Methods 13: , 581–583. |
[26] | Peer M , Salomon R , Goldberg I , Blanke O , Arzy S ((2015) ) Brain system for mental orientation in space, time, and person. Proc Natl Acad Sci U S A 112: , 11072–11077. |
[27] | Kueper JK , Speechley M , Montero-Odasso M ((2018) ) The Alzheimer’s Disease Assessment Scale-Cognitive Subscale (ADAS-Cog): Modifications and responsiveness in pre-dementia populations. A narrative review. J Alzheimers Dis 63: , 423–444. |
[28] | Raghavan N , Samtani MN , Farnum M , Yang E , Novak G , Grundman M , Narayan V , Dibernardo A ((2013) ) The ADAS-Cog revisited: Novel composite scales based on ADAS-Cog to improve efficiency in MCI and early AD trials. Alzheimers Dement 9: , S21–31. |
[29] | Podhorna J , Krahnke T , Shear M , E Harrison J ((2016) ) Alzheimer’s Disease Assessment Scale-Cognitive subscale variants in mild cognitive impairment and mild Alzheimer’s disease: Change over time and the effect of enrichment strategies. Alzheimers Res Ther 8: , 8. |
[30] | Arevalo-Rodriguez I , Smailagic N , Roquéi Figuls M , Ciapponi A , Sanchez-Perez E , Giannakou A , Pedraza OL , Bonfill Cosp X , Cullum S ((2015) ) Mini-Mental State Examination (MMSE) for the detection of Alzheimer’s disease and other dementias in people with mild cognitive impairment (MCI). Cochrane Database Syst Rev 7: , CD010783. |
[31] | Fox RJ , Coffey CS , Conwit R , Cudkowicz ME , Gleason T , Goodman A , Klawiter EC , Matsuda K , McGovern M , Naismith RT , Ashokkumar A , Barnes J , Ecklund D , Klingner E , Koepp M , Long JD , Natarajan S , Thornell B , Yankey J , Bermel RA , Debbins JP , Huang X , Jagodnik P , Lowe MJ , Nakamura K , Narayanan S , Sakaie KE , Thoomukuntla B , Zhou X , Krieger S , Alvarez E , Apperson M , Bashir K , Cohen BA , Coyle PK , Delgado S , Dewitt LD , Flores A , Giesser BS , Goldman MD , Jubelt B , Lava N , Lynch SG , Moses H , Ontaneda D , Perumal JS , Racke M , Repovic P , Riley CS , Severson C , Shinnar S , Suski V , Weinstock-Guttman B , Yadav V , Zabeti A ((2018) ) Phase 2 trial of ibudilast in progressive multiple sclerosis. N Engl J Med 379: , 846–855. |
[32] | Kishi T , Matsunaga S , Oya K , Ikuta T , Iwata N ((2015) ) Protection against brain atrophy by anti-dementia medication in mild cognitive impairment and Alzheimer’s disease: Meta-analysis of longitudinal randomized placebo-controlled trials. Int J Neuropsychopharmacol 18: , pvv070. |
[33] | Wilkinson D , Fox NC , Barkhof F , Phul R , Lemming O , Scheltens P ((2012) ) Memantine and brain atrophy in Alzheimer’s disease: A 1-year randomized controlled trial. J Alzheimers Dis 29: , 459–469. |
[34] | Spalletta G , Cravello L , Gianni W , Piras F , Iorio M , Cacciari C , Casini AR , Chiapponi C , Sancesario G , Fratangeli C , Orfei MD , Caltagirone C , Piras F ((2016) ) Homotaurine effects on hippocampal volume loss and episodic memory in amnestic mild cognitive impairment. J Alzheimers Dis 50: , 807–816. |
[35] | Smith AD , Smith SM , de Jager CA , Whitbread P , Johnston C , Agacinski G , Oulhaj A , Bradley KM , Jacoby R , Refsum H ((2010) ) Homocysteine-lowering by b vitamins slows the rate of accelerated brain atrophy in mild cognitive impairment: A randomized controlled trial. PLoS One 5: , e12244. |
[36] | Yu CC , Chen HL , Chen MH , Lu CH , Tsai NW , Huang CC , Chang YY , Li SH , Chen YS , Chiang PL , Lin WC ((2020) ) Vascular inflammation is a risk factor associated with brain atrophy and disease severity in Parkinson’s disease: A case-control study. Oxid Med Cell Longev 2020: , 2591248. |
[37] | Huang X , Hussain B , Chang J ((2021) ) Peripheral inflammation and blood–brain barrier disruption: Effects and mechanisms. CNS Neurosci Ther 27: , 36–47. |
[38] | Phillipson M , Kubes P ((2011) ) The neutrophil in vascular inflammation. Nat Med 17: , 1381–1390. |
[39] | Varvel NH , Neher JJ , Bosch A , Wang W , Ransohoff RM , Miller RJ , Dingledine R ((2016) ) Infiltrating monocytes promote brain inflammation and exacerbate neuronal damage after status epilepticus. Proc Natl Acad Sci U S A 113: , E5665–5674. |
[40] | Abbink MR , van Deijk ALF , Heine VM , Verheijen MH , Korosi A ((2019) ) The involvement of astrocytes in early-life adversity induced programming of the brain. Glia 67: , 1637–1653. |
[41] | Sun BL , Wang LH , Yang T , Sun JY , Mao LL , Yang MF , Yuan H , Colvin RA , Yang XY ((2018) ) Lymphatic drainage system of the brain: A novel target for intervention of neurological diseases. Prog Neurobiol 164: , 118–143. |
[42] | Bolte AC , Dutta AB , Hurt ME , Smirnov I , Kovacs MA , McKee CA , Ennerfelt HE , Shapiro D , Nguyen BH , Frost EL , Lammert CR , Kipnis J , Lukens JR ((2020) ) Meningeal lymphatic dysfunction exacerbates traumatic brain injury pathogenesis. Nat Commun 11: , 4524. |
[43] | das Neves SP , Delivanoglou N , Da Mesquita S ((2021) ) CNS-draining meningeal lymphatic vasculature: Roles, conundrums and future challenges. Front Pharmacol 12: , 655052. |
[44] | Yang X , Yu D , Xue L , Li H , Du J ((2020) ) Probiotics modulate the microbiota–gut–brain axis and improve memory deficits in aged SAMP8 mice. Acta Pharm Sin B 10: , 475–487. |
[45] | Zhu S , Jiang Y , Xu K , Cui M , Ye W , Zhao G , Jin L , Chen X ((2020) ) The progress of gut microbiome research related to brain disorders. J Neuroinflammation 17: , 25. |
[46] | Abdelhamid M , Zhou C , Ohno K , Kuhara T , Taslima F , Abdullah M , Jung C-G , Michikawa M ((2021) ) Probiotic Bifidobacterium breve prevents memory impairment through the reduction of both amyloid-β production and microglia activation in APP knock-in mouse. J Alzheimers Dis 85: , 1555–1571. |
[47] | Liu P , Wu L , Peng G , Han Y , Tang R , Ge J , Zhang L , Jia L , Yue S , Zhou K , Li L , Luo B , Wang B ((2019) ) Altered microbiomes distinguish Alzheimer’s disease from amnestic mild cognitive impairment and health in a Chinese cohort. Brain Behav Immun 80: , 633–643. |
[48] | Vogt NM , Kerby RL , Dill-McFarland KA , Harding SJ , Merluzzi AP , Johnson SC , Carlsson CM , Asthana S , Zetterberg H , Blennow K , Bendlin BB , Rey FE ((2017) ) Gut microbiome alterations in Alzheimer’s disease. Sci Rep 7: , 13537. |
[49] | Ren T , Gao Y , Qiu Y , Jiang S , Zhang Q , Zhang J , Wang L , Zhang Y , Wang L , Nie K ((2020) ) Gut microbiota altered in mild cognitive impairment compared with normal cognition in sporadic Parkinson’s disease. Front Neurol 11: , 137. |
[50] | Ley RE ((2016) ) Prevotella in the gut: Choose carefully. Nat Rev Gastroenterol Hepatol 13: , 69–70. |
[51] | Guo M , Peng J , Huang X , Xiao L , Huang F , Zuo Z ((2021) ) Gut microbiome features of Chinese patients newly diagnosed with Alzheimer’s disease or mild cognitive impairment. J Alzheimers Dis 80: , 299–310. |
[52] | Hung CC , Chang CC , Huang CW , Nouchi R , Cheng CH ((2022) ) Gut microbiota in patients with Alzheimer’s disease spectrum: A systematic review and meta-analysis. Aging (Albany NY) 14: , 477–496. |
[53] | Nishijima S , Suda W , Oshima K , Kim SW , Hirose Y , Morita H , Hattori M ((2016) ) The gut microbiome of healthy Japanese and its microbial and functional uniqueness. DNA Res 23: , 125–133. |
[54] | Qian L , Gao R , Huang J , Qin H ((2019) ) Supplementation of triple viable probiotics combined with dietary intervention is associated with gut microbial improvement in humans on a high-fat diet. Exp Ther Med 18: , 2262–2270. |

