
Cerebrospinal Fluid Amyloid-β Oligomer Levels in Patients with Idiopathic Normal Pressure Hydrocephalus
Abstract
Background:
The amyloid-β oligomers, consisting of 10–20 monomers (AβO10–20), have strong neurotoxicity and are associated with cognitive impairment in Alzheimer’s disease (AD). However, their role in patients with idiopathic normal pressure hydrocephalus (iNPH) is poorly understood.
Objective:
We hypothesized that cerebrospinal fluid (CSF) AβO10–20 accumulates in patients with iNPH, and its clearance after CSF shunting contributes to neurological improvement. We measured CSF AβO10–20 levels before and after CSF shunting in iNPH patients evaluating their diagnostic and prognostic role.
Methods:
We evaluated two iNPH cohorts: “evaluation” (cohort-1) with 32 patients and “validation” (cohort-2) with 13 patients. Comparison cohorts included: 27 neurologically healthy controls (HCs), and 16 AD, 15 Parkinson’s disease (PD), and 14 progressive supranuclear palsy (PSP) patients. We assessed for all cohorts CSF AβO10–20 levels and their comprehensive clinical data. iNPH cohort-1 pre-shunting data were compared with those of comparison cohorts, using cohort-2 for validation. Next, we compared cohort-1’s clinical and CSF data: 1) before and after CSF shunting, and 2) increased versus decreased AβO10–20 levels at baseline, 1 and 3 years after shunting.
Results:
Cohort-1 had higher CSF AβO10–20 levels than the HCs, PD, and PSP cohorts. This result was validated with data from cohort-2. CSF AβO10–20 levels differentiated cohort-1 from the PD and PSP groups, with an area under receiver operating characteristic curve of 0.94. AβO10–20 levels in cohort-1 decreased after CSF shunting. Patients with AβO10–20 decrease showed better cognitive outcome than those without.
Conclusion:
AβO10–20 accumulates in patients with iNPH and is eliminated by CSF shunting. AβO10–20 can be an applicable diagnostic and prognostic biomarker.
INTRODUCTION
Idiopathic normal pressure hydrocephalus (iNPH) is a neurodegenerative disease involving gait disturbances, cognitive impairment, and urinary incontinence that was first described by Hakim et al. in 1965 [1]. iNPH is a treatable neurodegenerative condition, and 80%of patients usually improve with cerebrospinal fluid (CSF) shunt surgery [2]. However, its pathophysiology remains unclear.
According to the recently articulated “oligomer hypothesis”, the amyloid-β (Aβ) oligomer contributes to cognitive impairments in patients with Alzheimer’s disease (AD) [3]. The Aβ peptide tends to aggregate, and the oligomer is considered more toxic than the monomer [4]. It has been reported that a nonamer (called Aβ*56) has stronger neurotoxicity than monomers, trimers and hexamers [5, 6], and CSF concentrations of the Aβ oligomer, which usually contains 10–20 monomers, named AβO10–20, are higher in patients with AD than in healthy controls and are correlated with cognitive impairment severity [7].
We have previously published reports regarding the CSF concentrations of the Aβ42 toxic conformer in patients with iNPH, which usually contains 2–3 monomers. In these patients the toxic conformer ratio (i.e., the ratio of toxic conformer levels to total Aβ42 levels) is higher than in cognitively normal individuals and lower than in patients with AD. Patients with iNPH who have decreased toxic conformer ratios following CSF shunting display better outcomes than patients without such decrease [8]. Based on these data, we considered that the impairment of CSF absorption followed by CSF accumulation, impaired CSF secretion, and a brief period of CSF stagnation may lead to Aβ aggregation [9]. The hypothetically resulting cognitive impairment in the iNPH clinical course could be eventually restored by CSF shunting.
On the basis of the aforementioned findings, we hypothesized that CSF stagnation in patients with iNPH may also result in the accumulation of the AβO10–20 (amyloid-β oligomer containing 10 to 20 monomers), and that can be reversed by CSF shunting. To the best of our knowledge, the CSF levels of AβO10–20 in patients with iNPH have not been systematically investigated. We therefore aimed to measure the CSF AβO10–20 concentrations of patients with iNPH to verify its ability to serve as additional diagnostic or prognostic biomarker.
MATERIALS AND METHODS
Study populations
Our studies were performed on two iNPH cohorts: an evaluation cohort (cohort-1) and a validation cohort (cohort-2).
Cohort- 1 (evaluation cohort)
We diagnosed patients with iNPH according to the Japanese iNPH guidelines [10]. We enrolled 173 consecutive patients with iNPH who had undergone lumbo-peritoneal shunting at the Department of Neurosurgery of Juntendo University (Tokyo, Japan) between April 2011 and December 2017. The following patients were excluded from the study: 41 patients without at least 3 years of follow-up after surgery, 29 patients for whom no CSF had been obtained preoperatively or who had a previous tap test history at another institute, and 26 patients had not been performed dopamine transporter scintigraphy to assess the comorbidity of Parkinson’s disease (PD). Additionally, 32 patients aged < 70 years or > 85 years and 23 patients who had > 50 pg/ml of CSF phosphorylated tau (pTau) level were excluded because of age and the affection of the neurological condition and outcome reflected by the CSF pTau. Ultimately, we included 32 patients in the analysis cohort (iNPH cohort-1).
Cohort-2 (validation cohort)
For the validation cohort (iNPH cohort-2), we used data from 13 patients who were diagnosed through the neurology department of the National Hospital Organization Takasaki General Medical Centre (Takasaki, Japan) according to the same criteria used for iNPH cohort-1.
Comparison cohorts
To comparatively evaluate the AβO10–20 levels in patients with iNPH, we also enrolled neurologically healthy controls (HCs) and patients with other types of neurodegenerative disease (i.e., AD, PD, and progressive supranuclear palsy (PSP)) into comparison cohorts. Sixteen patients with AD were diagnosed by a neurologist according to criteria for probable AD published by the National Institute on Aging-Alzheimer’s Association workgroups on diagnostic guidelines for AD [11]. Fifteen patients with PD were diagnosed by a neurologist according to the Movement Disorder Society Clinical Diagnostic Criteria for PD [12]. Fourteen patients with PSP were clinically diagnosed by a neurologist according to the Movement Disorder Society criteria [13]. In total, from 14 patients with PSP, we diagnosed 9 of them as Richardson type, 3 as pure akinesia and gait freezing, and 2 as PSP-P. Twenty-seven HCs who were > 60 years of age and had Mini-Mental State Examination (MMSE) scores of 26 points or higher were enrolled. All individuals with AD, PD, PSP, and HCs had previously lumbar puncture for various reasons, such as additional diagnostic information, investigations into headache etiologies, preoperative insertion of a lumbar drainage catheter for aortic surgery, undergoing elective myelography for degenerative lumbar spine disease, or undergoing elective surgery with spinal anaesthesia.
Study design
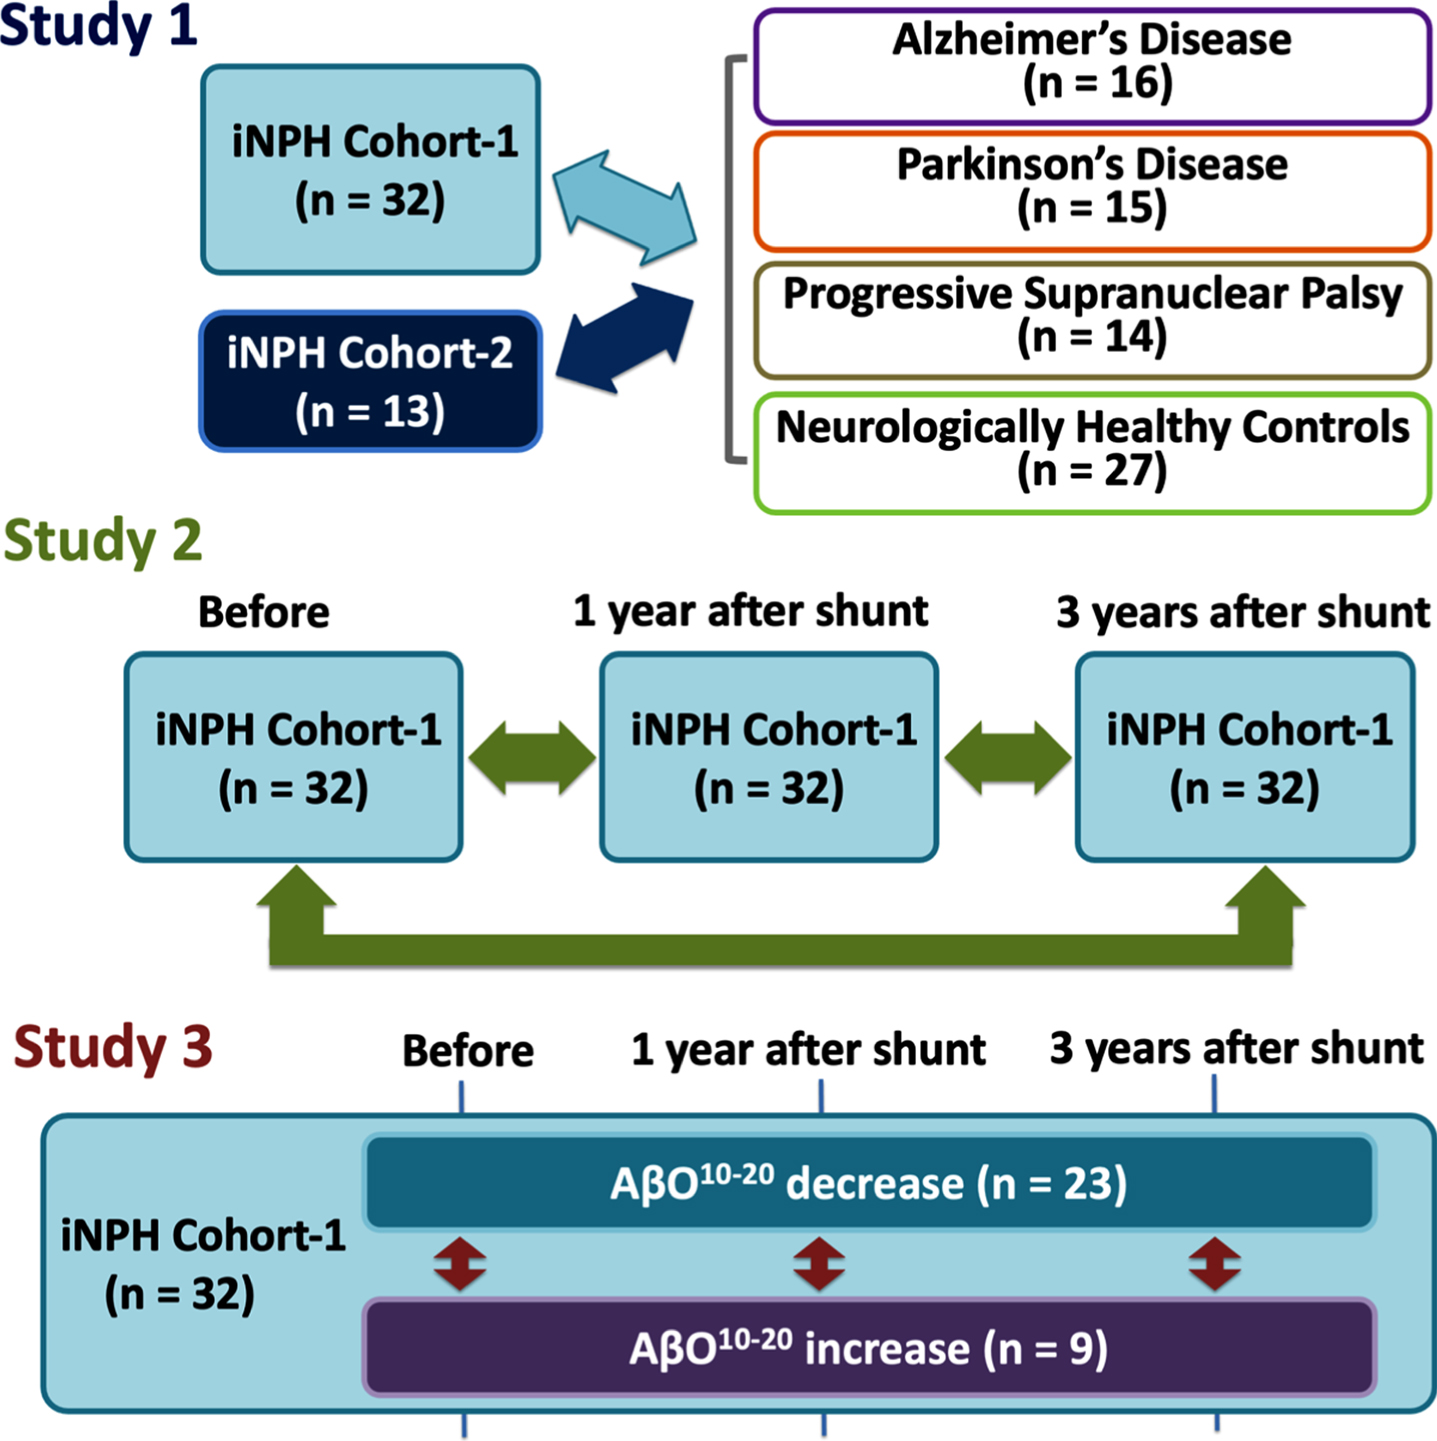
Our study was designed to include 3 distinctive parts, that we further assigned as Study 1, 2, and 3 (Fig. 1).
Fig. 1
Study designs. First, we compared iNPH cohorts with comparison cohorts: AD, PD, PSP, and HCs (Study 1). Second, we compared iNPH cohort-1’s measurement before and after CSF shunting (Study 2). Third, we subdivided iNPH cohort-1 members into AβO10–20 decrease or increase subgroups and compared them in terms of biomarkers and neurological statuses at before and 1 and 3 years after CSF shunting (Study 3). AD, Alzheimer’s disease; AβO10–20, amyloid-β oligomer10–20; CSF, cerebrospinal fluid; iNPH, idiopathic normal pressure hydrocephalus; HCs, healthy controls; PD, Parkinson’s disease; PSP, progressive supranuclear palsy.
Study 1. Difference between iNPH cohorts (evaluation and validation) and comparison cohorts
In study 1, we compared iNPH cohort-1 with the comparison cohorts (i.e., AD, PD, PSP, and HCs) in terms of baseline characteristics (i.e., age, sex, MMSE scores, and comorbidities) and CSF biomarker levels (i.e., phosphorylated tau (pTau), Tau, Aβ42,pTau/Aβ42ratio, and AβO10–20) to evaluate the applicability of AβO10–20 as additional diagnostic biomarker in patients with iNPH. Hypertension, diabetes, and dyslipidemia was diagnosed according to the guidelines and participants who were under treatment were assumed as to be diagnosed [14–16]. After that, we validated the results of those analyses with data from iNPH cohort-2. MMSE scores were assessed by a neuropsychologist. CSF biomarkers were quantified with an enzyme-linked immunosorbent assay (ELISA) kit as described below.
Study 2. Comparison between “before” and “after” CSF shunting in iNPH cohort-1
As a next main step, we compared the neurological condition and CSF biomarker levels in the iNPH cohort-1 patients between “before” and “after” CSF shunting to evaluate how CSF shunting affected the AβO10–20 level in iNPH patients.
The iNPH cohort-1 patients were followed-up for at least 3 years after CSF shunting. CSF samples were obtained preoperatively and 1 year after shunt surgery, as described below. Patients were assessed with MMSE, Frontal Assessment Battery (FAB), and modified Rankin Scale (mRS) by a neuropsychologist. The Japanese iNPH Grading Scale (iNPHGS) was also applied by a neurosurgeon before surgery, 1 and 3 years after surgery. CSF biomarkers (i.e., Aβ38, Aβ42, the toxic Aβ42conformer, and AβO10–20) were quantified with an enzyme-linked immunosorbent assay (ELISA) kit as described below.
Study 3. Comparison between AβO10–20 “decrease” and “increase” subgroups of iNPH cohort-1
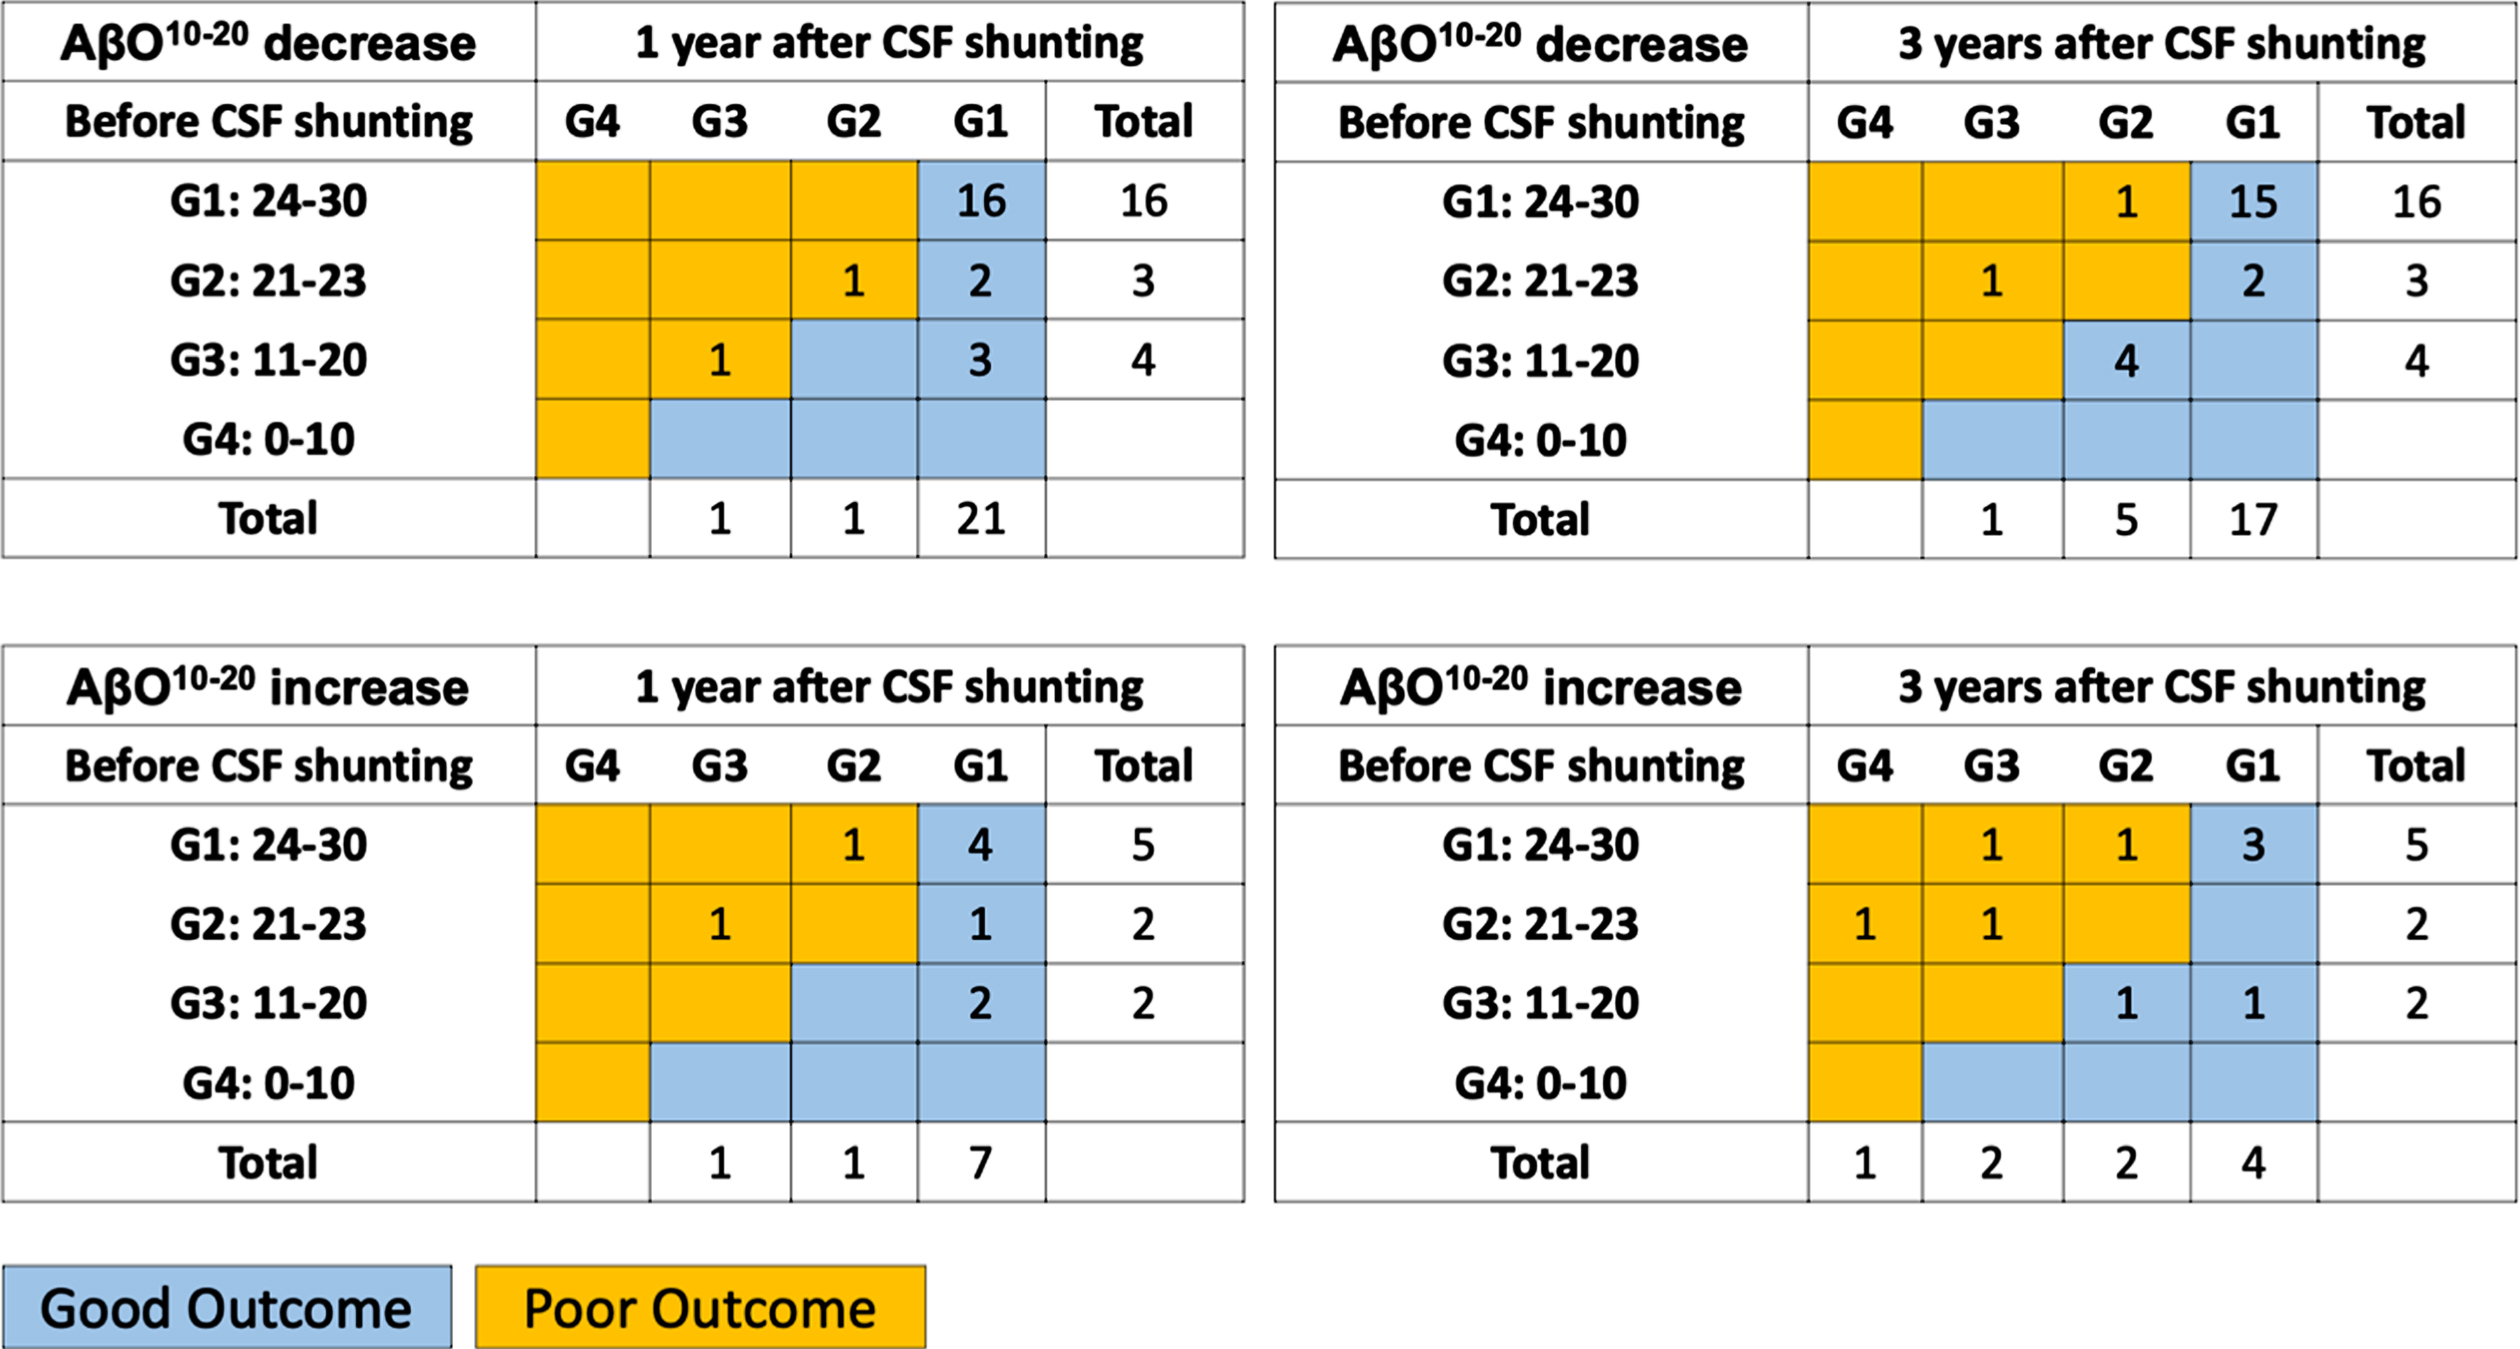
As a final step, we subdivided patients in iNPH cohort-1 according to the change of AβO10–20 levels between “before” and “after” CSF shunting to evaluate the potential use of AβO10–20 as prognostic biomarker in patients with iNPH because we presumed that AβO10–20 elimination contribute to cognitive improvement. Patients who had decreased AβO10–20 levels after CSF shunting were subcategorized into AβO10–20 decreased subgroup and the others were subcategorized into AβO10–20 increased subgroup. Patients were assessed for radiographical features such as the presence or absence of disproportionately enlarged subarachnoid space hydrocephalus (DESH) according to the clinical management guidelines for iNPH, for vascular burdens according to a classification system for deep subcortical white matter hyperintensities (DSWMH) and had calculated the Evans Index values before surgery [10, 17]. We compared CSF biomarker levels (i.e., tau, pTau, Aβ38, Aβ42, pTau/Aβ42ratio, Aβ42toxic conformer, Aβ42toxic conformer ratio, and AβO10–20) at baseline and 1 year after CSF shunting and neurological statuses obtained at baseline and 1 and 3 years after CSF shunting. We also compared cognitive outcome at 1 and 3 years after CSF shunting. Patients were divided into 4 grades of dementia severity according to MMSE score before, 1 and 3 years after CSF shunting. An MMSE score of 24–30 was defined as “non-dementia (Grade 1)”, 21–23 as “mild dementia (Grade 2)”, 11–20 as “moderate dementia (Grade 3)”, and 0–10 as “severe dementia (Grade 4)” [18, 19]. Patients who moved to a better grade were defined as “good outcome”, as were those who maintained grade 1, however those who maintained a lower than grade 1 or moved to a lower grade were defined as “poor outcome”.
CSF analysis
CSF samples were obtained via lumbar puncture performed in the L3–L4 or L4–L5 interspace with a spinal needle from each individual. In the patients with iNPH, lumbo-peritoneal shunting was performed according to our previously reported method [20]. We used an adjustable valve in all patients (Medtronic Neurosurgery, Goleta, CA, or Integra Codman, Raynham, MA). For postoperative follow-up, we adjusted the valve pressure and monitored proper shunt function with CSF withdrawal via valve reservoir puncture as previously reported and postoperative CSF samples in the patients with iNPH were obtained in the same way [8, 20]. If shunt malfunction was detected, the patient underwent shunt revision immediately.
To remove cells and debris, CSF samples were centrifuged at 1,690 g for 10 min at 4°C and then aliquoted. Hemorrhagic samples which had an erythrocyte count above 500/μL were excluded. The samples were divided into 1 ml polypropylene tubes and stored at –80°C till the assay. We thawed samples before the assay and the remaining in the tube was thrown away after each assay, therefore we had only one freeze-thaw cycle. The storage periods ranged from CSF collection to the assay time and varied among samples. CSF samples of iNPH cohort-1 was collected between April 2011 and December 2020 (median days, 1st and 3rd quartile that the samples stored between the initial evaluation to the assay was 1,245 [989.75 –1,848]), iNPH cohort-2 –between December 2016 and March 2019 (634 [387 –775]), AD group - between October 2008 and December 2014 (1,946.5 [1,775 –2,306.25]), PD group - between April 2010 and July 2014 (2,276 [2,080 –2,930.5]), PSP group - between May 2007 and July 2015 (2,695.5 [2,130.5 –4,025.75]), and HCs group - between October 2006 and June 2016 (2,695 [2,062 –3,928]). We used ELISA kits to measure the levels of tau (T1006; Nipro Corporation, Osaka, Japan), pTau (T1008; Nipro Corporation, Osaka, Japan), Aβ38 (code no.: 27717; IBL Japan, Fujioka, Japan), Aβ42 (INNOTEST; code no.: 81583; Fujirebio, Tokyo, Japan), the toxic Aβ42conformer (code no.: 27709; IBL Japan), and AβO10–20 (code no.: 298-80101; FUJIFILM Wako Pure Chemical Corporation, Osaka Japan). For the AβO10–20 ELISA kit, BAN50 was used as both the capture antibody and detector antibody. This kit specifically detects Aβ oligomers containing 10–20 monomers (40–200 kDa) and does not detect monomers, dimers, trimers, tetramers, or hexamers [7]. Luminescence measurements were used to detect our target AβO10–20 given that these represent < 1%of AβO10–20 overall. Therefore, we used a 96-well microplate reader (SpectraMax L; Molecular Devices Japan, Tokyo, Japan) and its accompanying software (SoftMax Pro 5.4.8). The lower limits of detection of ELISA kits for AβO10–20, Aβ42, Aβ38, Aβ42 toxic conformer, pTau, and tau were 0.41 pM, 62.5 pg/mL, 9.38 pg/mL, 3.13 pg/mL, 25 pg/mL, and 75 pg/mL respectively. We used two wells for each sample in the assay. All kits we used were of the same lot number. Coefficient variations were lower than 10%.
Statistics
Data distribution was evaluated graphically using histograms and Q-Q plots. In study 1, one-way ANOVA followed by the Tukey honestly significant difference test was performed in age and biomarkers. Kruskal-Wallis test followed by the Steel-Dwass test was performed in MMSE scores. Fisher’s exact test was conducted to compare proportions. Areas under receiver operating characteristic curves (AUROCs) were calculated as goodness-of-fit descriptors for predictors of iNPH status versus AD or PD and PSP status. In study 2, the Friedman’s test followed by Wilcoxon signed-rank test with Holm’s correction was conducted to evaluate differences between neurological statuses before and 1 and 3 years after CSF shunting, and the Paired T test was conducted to evaluate differences between biomarkers measured before and after CSF shunting. In study 3, T-test was performed in biomarkers levels and Evans Index and Mann-Whitney’s U-test was performed in MMSE scores, FAB scores, mRS scores, and scores in iNPHGS. Fisher’s exact test was performed in sex ratios, DESH prevalence, the percentages of patients with DSWMH scores of 0–1, comorbidity prevalence and percentages of patients improved in MMSE. All statistical analyses were performed with statistical software EZR version 1.41 based on R and R commander [21]. Results are shown as means±standard deviations for ages and CSF biomarker values and as medians and interquartile ranges for clinical evaluation battery scores. A p-value < 0.05 was considered statistically significant.
Ethics
This study was approved by the Ethics Committee of Juntendo University (approval no.: 17-022). All study participants or their legal guardians were briefed on the details of the study and provided written informed consent.
RESULTS
Comparisons of the iNPH cohorts with the HCs, AD, PD, and PSP groups (Study 1)
Comparisons of the iNPH cohorts and the HCs, AD, PD, and PSP groups revealed significant differences in the age, the sex ratios, and the proportions of patients with hypertension, diabetes, and dyslipidemia. From the total of 8 patients with previous stroke history, 5 patients of them had symptomatic lacunar infarction, 2 patients had symptomatic cerebellar infarction, and 1 patient had asymptomatic lacunar infarction, and they recovered neurologically without sequelae that can affect diagnosis and neurological outcome. The AβO10–20 levels in the iNPH cohort-1 and the AD group were significantly higher than in the HCs, PD, and PSP groups (Fig. 2). The Aβ42 levels in the AD group were significantly lower than those in iNPH cohort-1 and the HCs (p = 0.014, < 0.001 respectively). The pTau levels in the AD group were significantly higher than those in any other group (Table 1). An AβO10–20 cut-off level of 6.392 pM distinguished iNPH cohort-1 members from AD group members with 68.8%sensitivity, 65.6%specificity, and an AUROC of 0.678. An AβO10–20 cut-off level of 5.789 pM distinguished iNPH cohort-1 members from PD and PSP group members with 96.6%sensitivity, 81.2%specificity, and an AUROC of 0.944 (Fig. 3).
Table 1
Comparison of the iNPH cohorts with the HCs, AD, PD, and PSP groups (Study 1)
| iNPH cohort-1 (n = 32) | iNPH cohort-2 (n = 13) | AD (n = 16) | PD (n = 15) | PSP (n = 14) | HCs (n = 27) | p (ANOVA) | |
| Age, mean±SD | 75.88±3.60 | 76.54±4.27 | 75.63±7.98 | 70.80±8.60 | 71.00±11.31 | 77.48±6.17 | 0.015 |
| Sex, Male number (%) | 20 (62.5) | 5 (38.5) | 6 (37.5) | 8 (53.3) | 11 (78.6) | 8 (29.6) | 0.025 |
| MMSE score, median [25%–75%] | 26 [22 –28] | 22 [17 –26] | 22 [18 –22.25]** | N.A. | N.A. | 29 [28–30]***# # # | < 0.001 |
| Comorbidities, number (%) | p (Fisher’s exact test) | ||||||
| Hypertension | 16 (50) | N.A. | 4 (25) | 6 (40) | 6 (42.9) | 3 (11.1) | 0.017 |
| Diabetes | 4 (12.5) | 1 (7.7) | 3 (18.8) | 3 (20.0) | 6 (42.9) | 1 (3.7) | 0.038 |
| Dyslipidemia | 11 (34.4) | 2 (15.4) | 1 (6.2) | 4 (26.7) | 2 (14.3) | 0 (0) | 0.004 |
| Cardiac diseases | 1 (3.1) | N.A. | 1 (6.2) | 0 (0) | 2 (14.3) | 2 (7.4) | 0.463 |
| Stroke | 3 (9.4) | N.A. | 1 (6.2) | 1 (6.7) | 3 (21.4) | 0 (0) | 0.137 |
| CSF biomarkers at entry (mean±SD) | p (ANOVA) | ||||||
| pTau (pg/ml) | 27.0±7.29 | 28.0±18.3 | 102.3±35.5***# # # | 28.3±10.4 | 28.1±12.9 | 25.8±8.7 | < 0.001 |
| Tau (pg/ml) | 106.3±56.38 | 111.5±106.54 | 633.4±236.70***# # # | 217.09±146.52 | 133.50±120.86 | 202.15±166.88 | < 0.001 |
| Aβ42 (pg/ml) | 589.6±241.2 | 427.7±193.4 | 388.8±149.9* | 601.0±266.3 | 550.0±312.4 | 676.0±193.9# | 0.001 |
| pTau /Aβ42 | 0.055±0.030 | 0.075±0.042 | 0.292±0.120***# # # | 0.063±0.048 | 0.068±0.044 | 0.040±0.014 | < 0.001 |
| AβO10–20 (pM) | 6.90±1.45 | 6.73±0.92 | 6.01±1.18 | 3.30±0.88***# # # | 4.55±0.98***# # # | 3.53±1.20***# # # | < 0.001 |
p-values of one-way ANOVA and Fisher’s exact test are shown in table. Significance in multiple comparison is shown as *p < 0.05, **p < 0.01, or ***p < 0.001 (versus iNPH cohort-1); #p < 0.05, # #p < 0.01, or # # #p < 0.001 (versus iNPH cohort-2). AD, Alzheimer’s disease; Aβ, amyloid-β; AβO10–20, amyloid-β oligomer10–20; CSF, cerebrospinal fluid; iNPH, idiopathic normal pressure hydrocephalus; MMSE, Mini-Mental State Examination; HCs, healthy controls; PD, Parkinson’s disease; PSP, progressive supranuclear palsy; pTau, phosphorylated tau.
Fig. 2
AβO10–20 levels in each group. AβO10–20 levels for each individual group are represented in a scatter plot. The vertical axis shows the CSF concentrations of AβO10–20. Significance testing was done with the One-way ANOVA followed by the Tukey honestly significant difference test and is indicated as **p < 0.01 or ***p < 0.001 (Versus iNPH cohort-1) and # #p < 0.01 or # # #p < 0.001 (Versus iNPH cohort-2). AD, Alzheimer’s disease; AβO10–20, amyloid-β oligomer10–20; iNPH, idiopathic normal pressure hydrocephalus; HCs, healthy controls; PD, Parkinson’s disease; PSP, progressive supranuclear palsy.
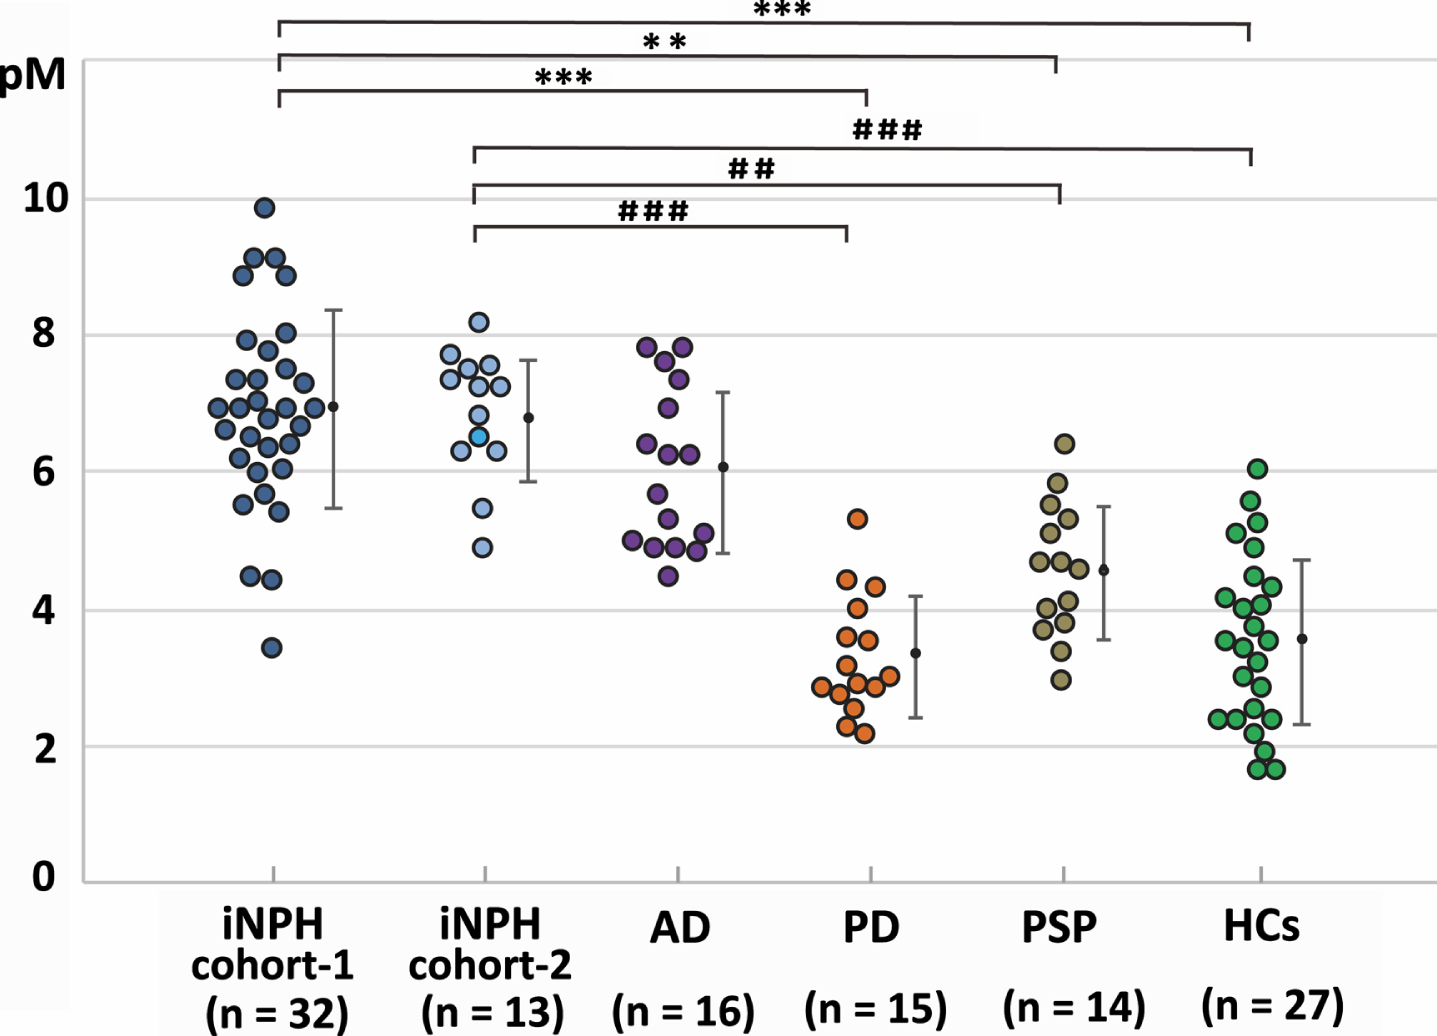
Fig. 3
AUROC analysis in study 1. AUROC analysis of AβO10–20 levels (blue), Aβ42 levels (green), and pTau levels (purple) as tools for differentiating groups. A) AβO10–20 levels differentiated members of iNPH cohort-1 from members of the AD groups with an AUC value of 0.678. B) AβO10–20 levels differentiated members of the iNPH cohort-1 from members of the PD and PSP groups with an AUC value of 0.944. AD, Alzheimer’s disease; AUC, area under the curve; Aβ42, amyloid beta 42; AβO10–20, amyloid-β oligomer10–20; CI, confidence interval; iNPH, idiopathic normal pressure hydrocephalus; PD, Parkinson’s disease; PSP, progressive supranuclear palsy; pTau, phosphorylated tau.
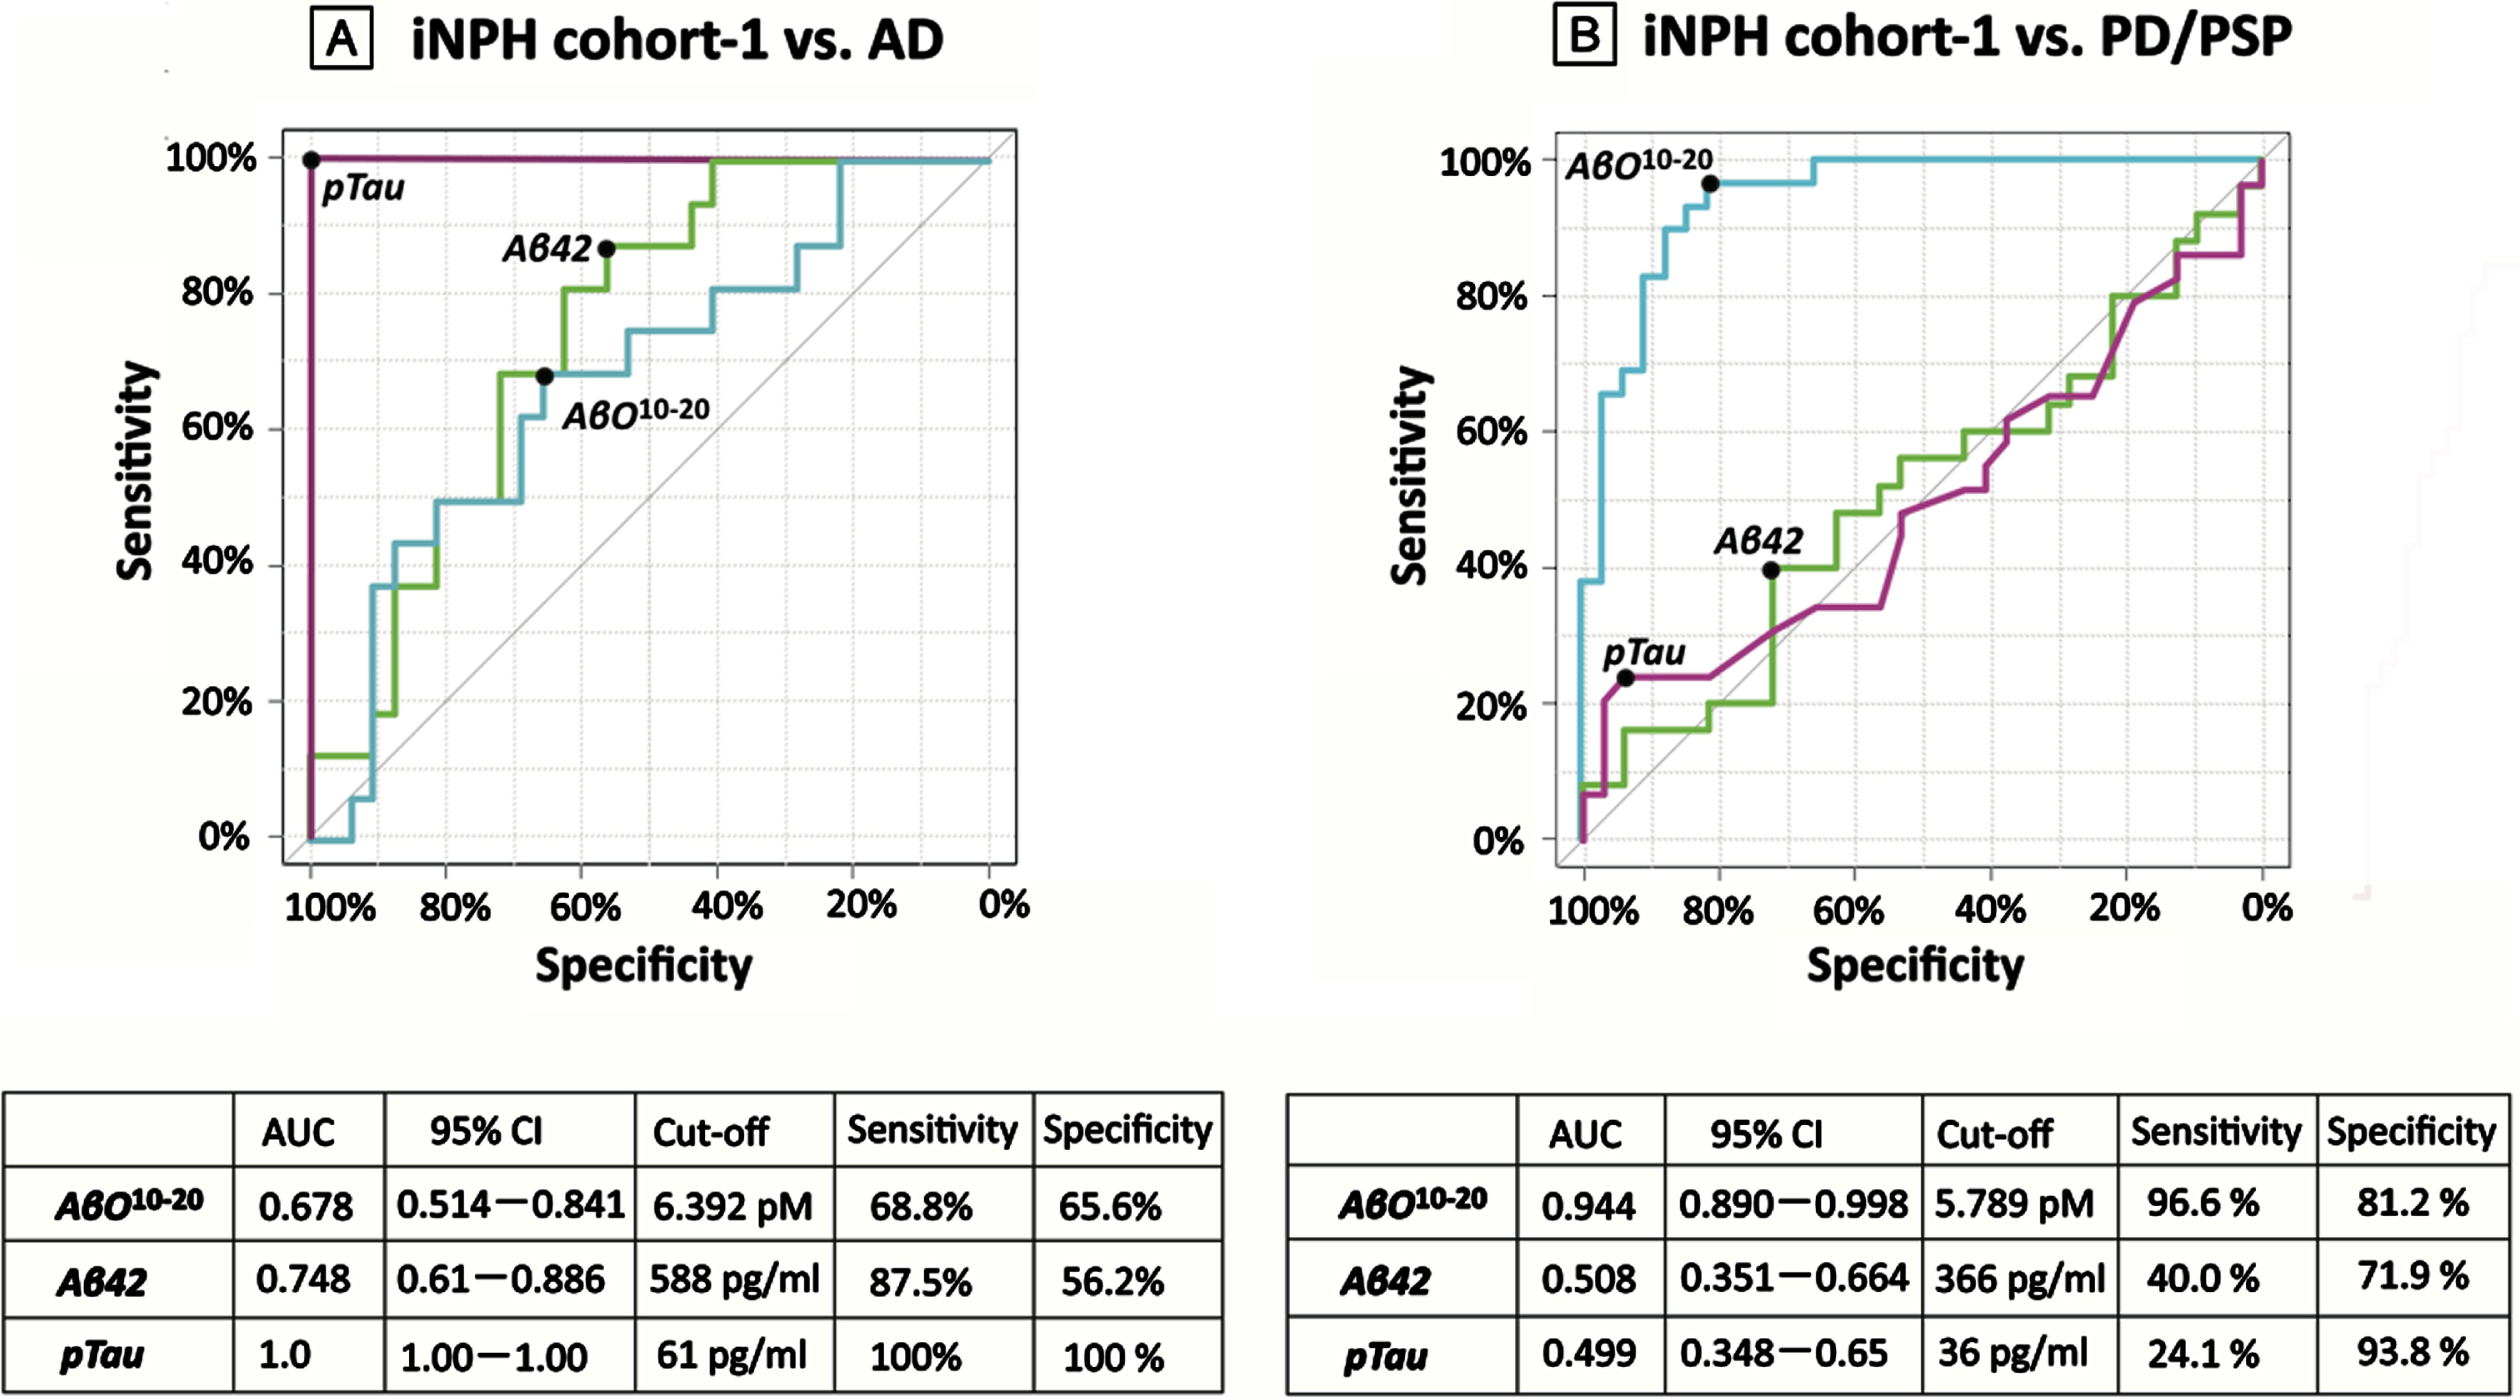
Table 2
Comparisons of measurements taken before and after CSF shunting in iNPH cohort-1 (Study 2)
| iNPH cohort-1 (n = 32) | ||||
| Before | 1 year | 3 years | p (Friedman’s test) | |
| MMSE score, Median [25%–75%] | 26 [22 –28] | 28 [26.75 –29]** | 27 [23 –28.25] | 0.003 |
| FAB score, Median [25%–75%] | 11.5 [9 –13.25] | 14 [12 –15]** | 14 [11.75 –15] | 0.016 |
| mRS score, Median [25%–75%] | 3 [2 –3] | 2 [1 –2.25]*** | 2 [1 –2.25]*** | < 0.001 |
| iNPHGS, Median [25%–75%] | ||||
| Total score | 5 [4 –6] | 3 [2 –4.25]*** | 4 [3 –5]* | < 0.001 |
| Gait disturbance | 2 [2 –3] | 1 [1 –2]*** | 1 [1 –2]** | < 0.001 |
| Cognitive impairment | 1 [1 –2] | 1 [0 –1]** | 1 [1 –1.25] | 0.002 |
| Urinary incontinence | 2 [1 –2] | 1 [1 –2]** | 1 [1 –2]* | 0.002 |
| Biomarkers, Mean±SD | ||||
| Aβ38 (pg/ml) | 2946.58±1233.27 | 4563.84±1399.68*** | N.A. | < 0.001 |
| Aβ42 (pg/ml) | 589.63±241.22 | 763.88±309.4** | N.A. | 0.004 |
| Aβ42 toxic conformer (pg/ml) | 66.94±30.07 | 78.06±31.80* | N.A. | 0.048 |
| Aβ42 toxic conformer ratio (%) | 13.72±10.00 | 12.11±7.51 | N.A. | 0.382 |
| AβO10–20 (pM) | 6.90±1.45 | 5.53±1.91*** | N.A. | < 0.001 |
p-values of Friedman’s test are shown in table. Significance in multiple comparison is shown as *p < 0.05, **p < 0.01 or ***p < 0.001. Aβ, amyloid-β; AβO10–20, amyloid-β oligomer10–20; CSF, cerebrospinal fluid; FAB, Frontal Assessment Battery; iNPH, idiopathic normal pressure hydrocephalus; iNPHGS, idiopathic normal pressure hydrocephalus grading scale; MMSE, Mini-Mental State Examination; mRS, modified Rankin scale.
In the validation analysis, the iNPH cohort-2 displayed significantly higher levels of AβO10–20 than the HCs, PD, and PSP subgroups did, while did not display any significant difference against AD. The result was consistent with the observed for iNPH cohort-1.
Comparisons of measurements recorded before and after CSF shunting in iNPH cohort-1 (Study 2)
In the iNPH cohort-1, gait disturbance was significantly improved and maintained for 3 years after CSF shunting. Cognitive function was significantly improved at 1 year after CSF shunting; however, these improvements were not maintained for 3 years.
In terms of biomarkers, Aβ38, Aβ42, and Aβ42 toxic conformer levels were significantly increased and AβO10–20 levels were significantly decreased relative to their pre–CSF shunting levels.
Comparison between AβO10–20 decrease and AβO10–20 increase subgroups (Study 3)
At baseline, AβO10–20 increase subgroup had lower levels of FAB score, Aβ42 toxic conformer, and AβO10–20. There was no significant difference in age, proportion of male, mRS scores, iNPHGS scores, Evans index, proportion of the patients with DESH, DSWMH score of 0 or 1, and comorbidities such as hypertension, diabetes, dyslipidemia, cardiac diseases, and stroke at the baseline (Supplementary Table 2). FAB scores in AβO10–20 increase subgroup were still lower than AβO10–20 decrease subgroup at 1 year after CSF shunting but the significance diminished at 3 years after CSF shunting. There was no significant difference in mRS score and iNPHGS scores at 1 and 3 years after CSF shunting. Although there was no significant difference at MMSE scores at 3 years after CSF shunting, proportion of patients who improved or maintained in MMSE scores were significantly higher in AβO10–20 decrease subgroup (Table 3, Fig. 4).
Table 3
Comparison between AβO10–20 decrease subgroup and AβO10–20 increase subgroup (Study 3)
| AβO10–20 decrease (n = 23) | AβO10–20 increase (n = 9) | p | |
| Before surgery | |||
| MMSE score, median [25%–75%] | 26 [22 –28] | 24 [22 –26] | 0.332 |
| FAB score, median [25%–75%] | 12 [10 –14.5] | 9 [8 –10] | 0.022* |
| pTau (pg/ml) | 26.83±7.83 | 27.44±6.09 | 0.833 |
| Tau (pg/ml) | 115.18±60.97 | 81.88±32.96 | 0.156 |
| Aβ38 (pg/ml) | 2957.91±1144.92 | 2914.0±1548.22 | 0.933 |
| Aβ42 (pg/ml) | 608.0±253.10 | 542.67±214.15 | 0.500 |
| pTau /Aβ42 | 0.053±0.029 | 0.060±0.034 | 0.528 |
| Aβ42 toxic conformer (pg/ml) | 74.36±32.25 | 48.78±11.74 | 0.029* |
| Aβ42 toxic conformer ratio (%) | 15.06±11.09 | 10.44±5.87 | 0.250 |
| AβO10–20 (pM) | 7.23±1.13 | 6.06±1.89 | 0.039* |
| 1 year after CSF shunting | |||
| MMSE score, median [25%–75%] | 28 [27 –29] | 27 [24–28] | 0.306 |
| Cognitive improvement, number of improved patients (%) | 21 (91.3) | 7 (77.8) | 0.557 |
| FAB score, median [25%–75%] | 14 [12 –15] | 12 [10 –14] | 0.048* |
| Aβ38 (pg/ml) | 4271.87±1225.50 | 5403.25±1609.58 | 0.047* |
| Aβ42 (pg/ml) | 708.78±286.60 | 904.67±337.69 | 0.108 |
| Aβ42 toxic conformer (pg/ml) | 81.82±33.58 | 68.89±26.41 | 0.312 |
| Aβ42 toxic conformer ratio (%) | 13.29±7.75 | 9.22±6.37 | 0.175 |
| AβO10–20 (pM) | 5.01±1.77 | 6.86±1.68 | 0.011* |
| 3 years after CSF shunting | |||
| MMSE score, median [25%–75%] | 27 [23 –28] | 23 [17 –29] | 0.447 |
| Cognitive improvement, number of improved patients (%) | 21 (91.3) | 5 (55.6) | 0.039* |
| FAB score, median [25%–75%] | 14 [12.5 –15] | 13 [11 –14] | 0.398 |
Significance is shown as *p < 0.05. Aβ, amyloid-β; AβO10–20, amyloid-β oligomer10–20; CSF, cerebrospinal fluid; FAB, Frontal Assessment Battery; MMSE, mini-mental state examination; mRS, modified Rankin scale, pTau, phosphorylated tau.
Fig. 4
Cognitive outcomes in AβO10–20 decrease and increase subgroups. A distribution of preoperative and postoperative grade of dementia severity according to MMSE scores in AβO10–20 decrease and increase subgroup displayed as the table. Numbers in each box indicate the number of patients. Blue boxes indicate patients in “good outcome” and orange boxes indicate patients in “poor outcome”. AβO10–20, amyloid beta oligomer10–20; CSF, cerebrospinal fluid; G, grade.
An AβO10–20 cut-off level of 5.648 pM distinguished AβO10–20 decrease subgroup members from AβO10–20 increase subgroup members with 55.6%sensitivity, 95.7%specificity, and an AUROC of 0.691 (Supplementary Figure 1).
DISCUSSION
AβO10–20 levels are elevated in patients with iNPH
In iNPH, CSF stagnation is one of the causes of Aβ deposition followed by cognitive impairment [9]. According to a previous report, CSF concentrations of Aβ42 in patients with iNPH are lower than or equal to those observed in HCs [22]. Hypometabolism of AβPP, dilution due to CSF accumulation, and aggregation of Aβ are considered the causes of these changes [23, 24]. Similarly, accelerated production and deposition of Aβ is considered as one of the hallmarks of AD pathology [25, 26]. Aβ42 has a tendency to aggregate and forms senile plaques and protofibrils in the brain of patients with AD [7]. However, cognitive impairment severity correlates poorly with Aβ plaque loads, but strongly with the levels of soluble Aβ oligomers [27].
The AβO10–20 levels in the iNPH cohort-1 were significantly higher than those in the HCs and the patients with PD or PSP. This result was validated with the data from iNPH cohort-2. Consistent with the findings of a previous research, the AD group had higher AβO10–20 levels than HCs [7]. However, there was significant difference in age among groups. Although it could affect biomarker profile in this analysis, there was no significant correlation between age and biomarker levels in each group (Supplementary Table 1) Contrary to our expectations, AβO10–20 levels in the patients with iNPH were approximately the same as in the patients with AD. This result can be interpreted in the sense that Aβ aggregation may be up to the same oligomer chain length in both the iNPH group as in the AD group. Although the antibody we used in the present study detects mainly 10–20-monomer oligomers [7], we were unable to evaluate their molecular weight. Therefore, we cannot exclude the possibility that larger Aβ chain aggregation produces larger macromolecules and apparently decreases the total oligomer numbers in a standard volume of the CSF sample.
Patients with iNPH sometimes show clinical symptoms that are similar to those of other neurodegenerative diseases, which complicates differential diagnosis. According to past reports, AD-related pathology can be observed in 18%–75%of patients with iNPH [28, 29], and 11%–86%of patients with iNPH exhibit parkinsonism [30–33]. Our results indicate that AβO10–20 are not good diagnostic biomarkers for differentiating iNPH from AD but are useful for differentiating iNPH from PD and PSP. However, as has been previously reported, AD can be differentiated from iNPH using CSF levels of pTau.
AβO10–20 decrease after CSF shunt placement contribute to cognitive improvement in iNPH patients
It has been established that CSF production is affected in iNPH, and CSF concentrations of AβPP-derived peptides increase after shunt surgery [34, 35]. It is possible that CSF elimination following shunt surgery improves CSF production and AβPP metabolism in the periventricular space [36–38]. In the present study, Aβ38 and Aβ42 levels in the iNPH cohort-1 members increased after CSF shunting as previously reported, and that may reflect an improvement in CSF turnover. As we expected, AβO10–20 levels decreased after CSF shunting. These results support our speculation that AβO10–20 accumulation may be caused by CSF stagnation, and it is probably relieved by CSF shunting. Aβ aggregation as an iNPH pathophysiological phenomenon may be restored to normal by the improved clearance of Aβ peptides.
As in AD, cognitive impairment in iNPH may also be affected by AβO10–20 levels. In the present study, AβO10–20 decrease subgroup showed better cognitive outcome at 3 years after shunt surgery than AβO10–20 increase subgroup and higher levels of AβO10–20 can predict AβO10–20 decrease with AUC of 0.691. AβO10–20 increase subgroup members had lower levels of FAB scores, AβO10–20 and Aβ42 toxic conformer at the baseline. Although there was no significance, AβO10–20 increase subgroup members had lower levels of MMSE score and higher proportion of patients with DSWMH score 2–4. These findings imply other concomitant pathology and probably vascular burden might have affected the results in the AβO10–20 increase subgroup members.
In the present study, iNPH cohort-1 members showed higher levels of Aβ42 toxic conformer than that we had previously reported. We considered that higher levels of Aβ42 in iNPH cohort-1 members leaded to such elevation because the levels of Aβ42 toxic conformer ratio were almost same as those we previously reported [8].
Study limitations
The main limitations of the current study were that we had only two cohorts of patients with iNPH and that the number of recruited participants was low. During patient recruitment, we excluded a number of patients from iNPH cohort-1 for several reasons, and these exclusions might have potentially affected the results of the present study. The exclusion of patients who had less than 3 years follow-up period can potentially be a reason to overestimate the outcome in iNPH cohort-1 because neurologically deteriorated patients might have been unable to visit our hospital. The exclusion of patients who had > 50 pg/ml of CSF pTau level also can be a reason to overestimate the outcome in iNPH cohort-1; however, their exclusion intended to remove the undesirable effect of comorbid AD pathophysiology.
Some parameters at baseline differed among enrolled cohorts in study 1, such as age and proportion of male patients and those with hypertension, diabetes, and dyslipidemia. Although there was no significant correlation between age and biomarker levels, these differences could have affected neurological outcome and biomarker profile. As aforementioned, although we excluded patients with iNPH who had past ischemic events, and there were no significant differences between the AβO10–20 decrease subgroup and AβO10–20 increase subgroup in the proportions of patients with DSWMH scores of 2–4, we did not do further investigations for vascular pathologies, such as performing cerebral blood flow studies. Therefore, vascular lesions may have affected biomarker measurements and neurological assessments.
Although we considered that amelioration of CSF stagnation may improve AβO10–20 accumulation, we could not quantify CSF flow or the volume of CSF eliminated through the shunt device. Future research should attempt to evaluate the amount of CSF produced and eliminated to test this consideration.
ACKNOWLEDGMENTS
We acknowledge the Laboratory of Proteomics and Biomolecular Science, the Laboratory of Molecular and Biochemical Research, the Research Support Centre, The Graduate School Research Program of Juntendo University, the Juntendo University Research Institute for Diseases of Old Age and the Juntendo University Graduate School of Medicine for technical assistance. This work was supported by the Japan Society for the Promotion of Science under Grants-in-Aid for Scientific Research [grant numbers 16KK0187, 17K10908, 18H02916, 20K09398] and Japan Agency for Medical Research and Development [grant number AMED JP20dm0207073].
Authors’ disclosures available online (https://www.j-alz.com/manuscript-disclosures/21-0226r3).
SUPPLEMENTARY MATERIAL
[1] The supplementary material is available in the electronic version of this article: https://dx.doi.org/10.3233/JAD-210226.
REFERENCES
[1] | Hakim S , Adams RD ((1965) ) The special clinical problem of symptomatic hydrocephalus with normal cerebrospinal fluid pressure. Observations on cerebrospinal fluid hydrodynamics. J Neurol Sci 2: , 307–327. |
[2] | Hashimoto M , Ishikawa M , Mori E , Kuwana N , Study of INPH on neurological improvement (SINPHONI) ((2010) ) Diagnosis of idiopathic normal pressure hydrocephalus is supported by MRI-based scheme: A prospective cohort study. Cerebrospinal Fluid Res 7: , 18. |
[3] | Selkoe DJ ((2002) ) Alzheimer’s disease is a synaptic failure. Science 298: , 789–791. |
[4] | Hardy J , Selkoe DJ ((2002) ) The amyloid hypothesis of Alzheimer’s disease: Progress and problems on the road to therapeutics. Science 297: , 353–356. |
[5] | Lesné SE , Sherman MA , Grant M , Kuskowski M , Schneider JA , Bennett DA , Ashe KH ((2013) ) Brain amyloid-β oligomers in ageing and Alzheimer’s disease. Brain 136: , 1383–1398. |
[6] | Lesne S , Koh MT , Kotilinek L , Kayed R , Glabe CG , Yang A , Gallagher M , Ashe KH ((2006) ) A specific amyloid-beta protein assembly in the brain impairs memory. Nature 440: , 352–357. |
[7] | Fukumoto H , Tokuda T , Kasai T , Ishigami N , Hidaka H , Kondo M , Allsop D , Nakagawa M ((2010) ) High-molecular-weight beta-amyloid oligomers are elevated in cerebrospinal fluid of Alzheimer patients. FASEB J 24: , 2716–2726. |
[8] | Akiba C , Nakajima M , Miyajima M , Ogino I , Motoi Y , Kawamura K , Adachi S , Kondo A , Sugano H , Tokuda T , Irie K , Arai H ((2018) ) Change of amyloid-β 1-42 toxic conformer ratio after cerebrospinal fluid diversion predicts long-term cognitive outcome in patients with idiopathic normal pressure hydrocephalus. J Alzheimers Dis 63: , 989–1002. |
[9] | Silverberg GD , Mayo M , Saul T , Rubenstein E , McGuire D ((2003) ) Alzheimer’s disease, normal-pressure hydrocephalus, and senescent changes in CSF circulatory physiology: A hypothesis. Lancet Neurol 2: , 506–511. |
[10] | Mori E , Ishikawa M , Kato T , Kazui H , Miyake H , Miyajima M , Nakajima M , Hashimoto M , Kuriyama N , Tokuda T , Ishii K , Kaijima M , Hirata Y , Saito M , Arai H , Japanese Society of Normal Pressure H ((2012) ) Guidelines for management of idiopathic normal pressure hydrocephalus: Second edition. Neurol Med Chir (Tokyo) 52: , 775–809. |
[11] | McKhann GM , Knopman DS , Chertkow H , Hyman BT , Jack CR Jr. , Kawas CH , Klunk WE , Koroshetz WJ , Manly JJ , Mayeux R , Mohs RC , Morris JC , Rossor MN , Scheltens P , Carrillo MC , Thies B , Weintraub S , Phelps CH ((2011) ) The diagnosis of dementia due to Alzheimer’s disease: Recommendations from the National Institute on Aging-Alzheimer’s Association workgroups on diagnostic guidelines for Alzheimer’s disease. Alzheimers Dement 7: , 263–269. |
[12] | Postuma RB , Berg D , Stern M , Poewe W , Olanow CW , Oertel W , Obeso J , Marek K , Litvan I , Lang AE , Halliday G , Goetz CG , Gasser T , Dubois B , Chan P , Bloem BR , Adler CH , Deuschl G ((2015) ) MDS clinical diagnostic criteria for Parkinson’s disease. Mov Disord 30: , 1591–1601. |
[13] | Hoglinger GU , Respondek G , Stamelou M , Kurz C , Josephs KA , Lang AE , Mollenhauer B , Muller U , Nilsson C , Whitwell JL , Arzberger T , Englund E , Gelpi E , Giese A , Irwin DJ , Meissner WG , Pantelyat A , Rajput A , van Swieten JC , Troakes C , Antonini A , Bhatia KP , Bordelon Y , Compta Y , Corvol JC , Colosimo C , Dickson DW , Dodel R , Ferguson L , Grossman M , Kassubek J , Krismer F , Levin J , Lorenzl S , Morris HR , Nestor P , Oertel WH , Poewe W , Rabinovici G , Rowe JB , Schellenberg GD , Seppi K , van Eimeren T , Wenning GK , Boxer AL , Golbe LI , Litvan I , Movement Disorder Society-endorsed PSP Study Group ((2017) ) Clinical diagnosis of progressive supranuclear palsy: The Movement Disorder Society criteria. Mov Disord 32: , 853–864. |
[14] | Umemura S , Arima H , Arima S , Asayama K , Dohi Y , Hirooka Y , Horio T , Hoshide S , Ikeda S , Ishimitsu T , Ito M , Ito S , Iwashima Y , Kai H , Kamide K , Kanno Y , Kashihara N , Kawano Y , Kikuchi T , Kitamura K , Kitazono T , Kohara K , Kudo M , Kumagai H , Matsumura K , Matsuura H , Miura K , Mukoyama M , Nakamura S , Ohkubo T , Ohya Y , Okura T , Rakugi H , Saitoh S , Shibata H , Shimosawa T , Suzuki H , Takahashi S , Tamura K , Tomiyama H , Tsuchihashi T , Ueda S , Uehara Y , Urata H , Hirawa N ((2019) ) The Japanese Society of Hypertension Guidelines for the Management of Hypertension (JSH 2019). Hypertens Res 42: , 1235–1481. |
[15] | Araki E , Goto A , Kondo T , Noda M , Noto H , Origasa H , Osawa H , Taguchi A , Tanizawa Y , Tobe K , Yoshioka N ((2020) ) Japanese clinical practice guideline for diabetes 2019. Diabetol Int 11: , 165–223. |
[16] | Kinoshita M , Yokote K , Arai H , Iida M , Ishigaki Y , Ishibashi S , Umemoto S , Egusa G , Ohmura H , Okamura T , Kihara S , Koba S , Saito I , Shoji T , Daida H , Tsukamoto K , Deguchi J , Dohi S , Dobashi K , Hamaguchi H , Hara M , Hiro T , Biro S , Fujioka Y , Maruyama C , Miyamoto Y , Murakami Y , Yokode M , Yoshida H , Rakugi H , Wakatsuki A , Yamashita S , Committee for Epidemiology and Clinical Management of Atherosclerosis ((2018) ) Japan Atherosclerosis Society (JAS) guidelines for prevention of atherosclerotic cardiovascular diseases 2017. J Atheroscler Thromb 25: , 846–984. |
[17] | Shinohara Y , Tohgi H , Hirai S , Terashi A , Fukuuchi Y , Yamaguchi T , Okudera T ((2007) ) Effect of the Ca antagonist nilvadipine on stroke occurrence or recurrence and extension of asymptomatic cerebral infarction in hypertensive patients with or without history of stroke (PICA Study). 1. Design and results at enrollment. Cerebrovasc Dis 24: , 202–209. |
[18] | Perneczky R , Wagenpfeil S , Komossa K , Grimmer T , Diehl J , Kurz A ((2006) ) Mapping scores onto stages: Mini-Mental State Examination and Clinical Dementia Rating. Am J Geriatr Psychiatry 14: , 139–144. |
[19] | Tsoi KK , Chan JY , Hirai HW , Wong SY , Kwok TC ((2015) ) Cognitive Tests to detect dementia: A systematic review and meta-analysis. JAMA Intern Med 175: , 1450–1458. |
[20] | Nakajima M , Miyajima M , Ogino I , Sugano H , Akiba C , Domon N , Karagiozov KL , Arai H ((2015) ) Use of external lumbar cerebrospinal fluid drainage and lumboperitoneal shunts with Strata NSC valves in idiopathic normal pressure hydrocephalus: A single-center experience. World Neurosurg 83: , 387–393. |
[21] | Kanda Y ((2013) ) Investigation of the freely available easy-to-use software ‘EZR’ for medical statistics. Bone Marrow Transplant 48: , 452–458. |
[22] | Santangelo R , Cecchetti G , Bernasconi MP , Cardamone R , Barbieri A , Pinto P , Passerini G , Scomazzoni F , Comi G , Magnani G ((2017) ) Cerebrospinal fluid amyloid-beta 42, total tau and phosphorylated tau are low in patients with normal pressure hydrocephalus: Analogies and differences with Alzheimer’s disease. J Alzheimers Dis 60: , 183–200. |
[23] | Jeppsson A , Wikkelso C , Blennow K , Zetterberg H , Constantinescu R , Remes AM , Herukka SK , Rauramaa T , Nagga K , Leinonen V , Tullberg M ((2019) ) CSF biomarkers distinguish idiopathic normal pressure hydrocephalus from its mimics. J Neurol Neurosurg Psychiatry 90: , 1117–1123. |
[24] | Graff-Radford NR ((2014) ) Alzheimer CSF biomarkers may be misleading in normal-pressure hydrocephalus. Neurology 83: , 1573–1575. |
[25] | Jack CR , Knopman DS , Jagust WJ , Petersen RC , Weiner MW , Aisen PS , Shaw LM , Vemuri P , Wiste HJ , Weigand SD , Lesnick TG , Pankratz VS , Donohue MC , Trojanowski JQ ((2013) ) Tracking pathophysiological processes in Alzheimer’s disease: An updated hypothetical model of dynamic biomarkers. Lancet Neurol 12: , 207–216. |
[26] | Jack CR Jr. , Bennett DA , Blennow K , Carrillo MC , Dunn B , Haeberlein SB , Holtzman DM , Jagust W , Jessen F , Karlawish J , Liu E , Molinuevo JL , Montine T , Phelps C , Rankin KP , Rowe CC , Scheltens P , Siemers E , Snyder HM , Sperling R , Contributors ((2018) ) NIA-AA Research Framework: Toward a biological definition of Alzheimer’s disease. Alzheimers Dement 14: , 535–562. |
[27] | Klein WL , Krafft GA , Finch CE ((2001) ) Targeting small Abeta oligomers: The solution to an Alzheimer’s disease conundrum? Trends Neurosci 24: , 219–224. |
[28] | Cabral D , Beach TG , Vedders L , Sue LI , Jacobson S , Myers K , Sabbagh MN ((2011) ) Frequency of Alzheimer’s disease pathology at autopsy in patients with clinical normal pressure hydrocephalus. Alzheimers Dement 7: , 509–513. |
[29] | Leinonen V , Koivisto AM , Savolainen S , Rummukainen J , Sutela A , Vanninen R , Jaaskelainen JE , Soininen H , Alafuzoff I ((2012) ) Post-mortem findings in 10 patients with presumed normal-pressure hydrocephalus and review of the literature. Neuropathol Appl Neurobiol 38: , 72–86. |
[30] | Molde K , Soderstrom L , Laurell K ((2017) ) Parkinsonian symptoms in normal pressure hydrocephalus: A population-based study. J Neurol 264: , 2141–2148. |
[31] | Cucca A , Biagioni MC , Sharma K , Golomb J , Gilbert RM , Di Rocco A , Fleisher JE ((2018) ) Comorbid normal pressure hydrocephalus with parkinsonism: A clinical challenge and call for awareness. Case Rep Neurol Med 2018: , 2513474. |
[32] | Akiguchi I , Ishii M , Watanabe Y , Watanabe T , Kawasaki T , Yagi H , Shiino A , Shirakashi Y , Kawamoto Y ((2008) ) Shunt-responsive parkinsonism and reversible white matter lesions in patients with idiopathic NPH. J Neurol 255: , 1392–1399. |
[33] | Allali G , Garibotto V , Assal F ((2016) ) Parkinsonism differentiates idiopathic normal pressure hydrocephalus from its mimics. J Alzheimers Dis 54: , 123–127. |
[34] | Johanson CE , Duncan JA , 3rd, Klinge PM , Brinker T , Stopa EG , Silverberg GD ((2008) ) Multiplicity of cerebrospinal fluid functions: New challenges in health and disease. Cerebrospinal Fluid Res 5: , 10. |
[35] | Jeppsson A , Zetterberg H , Blennow K , Wikkelso C ((2013) ) Idiopathic normal-pressure hydrocephalus Pathophysiology and diagnosis by CSF biomarkers. Neurology 80: , 1385–1392. |
[36] | Silverberg GD , Mayo M , Saul T , Carvalho J , McGuire D ((2004) ) Novel ventriculo-peritoneal shunt in Alzheimer’s disease cerebrospinal fluid biomarkers. Expert Rev Neurother 4: , 97–107. |
[37] | Agren-Wilsson A , Lekman A , Sjoberg W , Rosengren L , Blennow K , Bergenheim AT , Malm J ((2007) ) CSF biomarkers in the evaluation of idiopathic normal pressure hydrocephalus. Acta Neurol Scand 116: , 333–339. |
[38] | Allali G , Garibotto V , Mainta IC , Nicastro N , Assal F ((2018) ) Dopaminergic imaging separates normal pressure hydrocephalus from its mimics. J Neurol 265: , 2434–2441. |

