
Validation of Plasma Proteomic Biomarkers Relating to Brain Amyloid Burden in the EMIF-Alzheimer’s Disease Multimodal Biomarker Discovery Cohort
Abstract
We have previously investigated, discovered, and replicated plasma protein biomarkers for use to triage potential trials participants for PET or cerebrospinal fluid measures of Alzheimer’s disease (AD) pathology. This study sought to undertake validation of these candidate plasma biomarkers in a large, multi-center sample collection. Targeted plasma analyses of 34 proteins with prior evidence for prediction of in vivo pathology were conducted in up to 1,000 samples from cognitively healthy elderly individuals, people with mild cognitive impairment, and in patients with AD-type dementia, selected from the EMIF-AD catalogue. Proteins were measured using Luminex xMAP, ELISA, and Meso Scale Discovery assays. Seven proteins replicated in their ability to predict in vivo amyloid pathology. These proteins form a biomarker panel that, along with age, could significantly discriminate between individuals with high and low amyloid pathology with an area under the curve of 0.74. The performance of this biomarker panel remained consistent when tested in apolipoprotein E ɛ4 non-carrier individuals only. This blood-based panel is biologically relevant, measurable using practical immunocapture arrays, and could significantly reduce the cost incurred to clinical trials through screen failure.
INTRODUCTION
Clinical trials for Alzheimer’s disease (AD) modification have recently started to target the earlier prodromal and pre-symptomatic stages in the belief that disease modification efforts are most likely to be effective earlier in the disease process [1, 2]. However, conducting trials in prodromal/preclinical individuals necessitates the use of biomarkers to detect evidence of in vivo AD pathology. Currently, pathology detection is possible using biochemical measures in cerebrospinal fluid (CSF) obtained from lumbar puncture and by positron emission tomography (PET) coupled to ligands for amyloid imaging. Both methods are employed routinely in clinical studies but their limitations impact significantly upon the efficiency of clinical trials. Both CSF sampling and PET can be costly and invasive and are therefore not suitable for large-scale screening or where repeated measures are desirable. The relatively low prevalence of amyloid pathology in people with mild cognitive impairment (MCI), and even more so in cognitively healthy individuals, inevitably results in high screen failure rates when trying to detect prodromal or preclinical AD [3]. The cost of this screen failure by either CSF or PET can be prohibitive as well as contributing to the delay in start-up of clinical trials. More worryingly, given that such screening is likely to be mandatory as part of clinical implementation of a successful therapeutic, this screen failure rate is likely to constitute an obstacle to clinical translation through a combination of cost factors and the capacity of health systems to enable lumbar puncture or PET imaging at the scale likely to match demands of their populations. One option to overcome this issue is to employ prediction methods such as apolipoprotein E (APOE) genotyping prior to trial entry, as APOE ɛ4 carriers are more likely to harbor AD pathology. However, not all individuals with preclinical or prodromal AD have an APOE ɛ4 allele and furthermore APOE genotyping only reveals risk and does not indicate current pathological state. Therefore, in order to increase the efficiency of recruitment to clinical trials, a cost effective, minimally invasive method that can be implemented on a large scale to predict current AD pathology would be enormously valuable. A blood-based assay that predicted likely pathological load would become part of a diagnostic screening funnel triaging potential trials participants or users of therapy to direct markers of pathology such as CSF measures or PET imaging.
Over a decade ago, we conducted a large agnostic, or untargeted, proteome-wide, discovery study of blood biomarkers in dementia [4]. This study was successful in detecting a signal in the blood that reflected the presence of AD-type dementia and since then many other studies, by others and by ourselves, have aimed to replicate and improve upon this original signal and have identified blood-based protein biomarkers able to distinguish AD-type dementia ‘cases’ from cognitively healthy elderly ‘controls’ [5]. However, the relatively low rate of replication of individual biomarkers across studies may be in part due to issues of a study design that compares people with clinical AD, some of whom will not have pathology, to cognitively healthy elderly controls, many of whom will harbor silent pathology. Other factors limiting replication include technical issues such as assay variance and quality, differences in sampling and storage protocols and the frequently small size of many studies [6, 7]. Nonetheless, such studies demonstrate that there is a signature of disease detectable in blood and the task is now to find a signature that is reproducible.
To address this, we have gradually refined our study design, focusing on an ‘endophenotype’ approach predicating on outcomes not of clinical diagnosis, but of a phenotype indicative of disease such as brain atrophy measured by structural MRI or amyloid-β (Aβ) plaque burden measured by PET and CSF. Using this approach, we have identified putative plasma markers relating to in vivo AD pathology and disease progression using a range of proteomic approaches including mass spectrometry, SOMAscan, and immunocapture [8–15]. In addition, we also performed a series of iterative studies targeting complement and related inflammatory proteins; neuroinflammation itself being an endophenotype associated with disease and amyloid pathology [16]. Many of the proteins identified in these discovery-phase ‘endophenotype’ studies replicate across proteomic platforms and different cohort types. However, unsurprisingly given the wide range of techniques and study designs, not every protein identified replicates in every study. The aim of the present study was to determine the most replicable set of plasma protein markers predicting in vivo brain amyloid pathology, by testing 31 of our previously discovered candidate biomarkers in a large, multi-center cohort of individuals with high and low amyloid burden.
METHODS
Subjects: EMIF-AD Multimodal Biomarker Discovery study (EMIF-AD MBD) cohort
The EMIF-AD MBD is part of the European Medical Information Framework for Alzheimer’s Disease (EMIF-AD; http://www.emif.eu/), a European wide collaboration to facilitate the re-use of existing healthcare data and the sharing of cohort samples for the benefit of AD research. The EMIF-AD MBD study design, including subject selection criteria, clinical diagnoses, brain amyloid classification, and plasma sample collection have all been described previously [17]. In essence though, we sought to assemble a collection of samples from participants in cohort studies from across the full clinical disease spectrum from preclinical through prodromal to advanced disease, in each category seeking to balance those with amyloid pathology to those without. To do this we selected, using existing data, samples for inclusion from apparently normal, cognitively healthy elderly controls, from participants with diagnosed MCI and from people with established AD-type dementia. Samples were selected within each category with proven high and low amyloid load as previously described [17]. Overall, 1,221 participants were recruited to the EMIF-AD MBD study from 11 European cohorts. Each parent cohort was approved by the local medical ethics committee.
The present study selected two sub-cohorts of participants from the EMIF-AD MBD study, all with plasma samples available for analysis. Firstly, 1,000 individuals comprising 408 cognitively healthy individuals, 400 individuals with MCI, and 192 AD-type dementia patients were included for proteomic analysis in the University of Oxford laboratories. Secondly, 866 individuals (93 AD, 413 MCI, 360 control) were included for proteomic analysis in the laboratories at Cardiff University. 679 (78%) of the Cardiff sample set were also included in the Oxford sample set. Participants were included in these ‘Oxford’ and ‘Cardiff’ sample sets from across three multi-center studies: DESCRIPA [18], EDAR [19], and PharmaCog [20], and eight single center studies: Amsterdam [21], Antwerp [22], San Sebastian GAP [23], Gothenburg [24], Barcelona IDIBAPS [25], Lausanne [26], Leuven [27], and Barcelona St Pau [28]. Sample number differences between the ‘Oxford’ and ‘Cardiff’ sample sets were necessary due to plasma sample availability. Differences in the distribution of participants across multiple diagnostic categories between the ‘Oxford’ and ‘Cardiff’ sample sets are displayed in Supplementary Figure 1. The methods for addressing the challenge these differences presented are described in full in Bos et al. [17].
Plasma analyses
Targeted plasma protein analyses were conducted at both Oxford and Cardiff laboratories using Luminex xMAP (Cat#: HNDG1MAG-36K-06, HNDG2MAG-36K-05, HNDG3MAG-36K-07, HND2MAG-39K-02, HKI6MAG-99K-03, HNDG1MAG-36K-01), ELISA (Cat#: CSB-EL008551HU and CSB-E13319H), and MSD assays (in-house optimized using U-plex platform). All assays were performed according to the manufacturer’s instructions. Overall, concentrations of 25 proteins were determined at Oxford while 6 proteins were analyzed at Cardiff.
Brain amyloid measurements and group classifications
Measurement and classification of in vivo amyloid burden in the EMIF-AD MBD cohort has been described previously [17]. Briefly, where CSF was available, Aβ1-40 and Aβ1-42 were measured using the V-PLEX Plus Aβ Peptide Panel 1 (6E10) Kit from Meso Scale Discovery in a central laboratory (Gothenburg University, Sweden) and the Aβ42/40 ratio was established. The Aβ group was defined by the Aβ42/40 ratio, using a cut-off of <0.063 to determine abnormality. Where CSF samples were unavailable, then the locally measured CSF Aβ42 value and cut-off point provided by the parent cohort or the standardized uptake value ratio (SUVR) and cut-off point from an amyloid PET scan was used.
The above measurements were combined into a continuous variable using z-scoring. The Aβ Z-score was calculated using the mean and standard deviation of the control subjects as a reference. In cases where an individual had multiple measures of amyloid (e.g., CSF and PET), all data available were used to generate the mean and standard deviation for each measure. However, the measure included in the final Aβ Z-score was selected from each individual in the following order of priority: CSF Aβ42/40 ratio, local CSF Aβ42, or the amyloid PET SUVR. PET amyloid Z-scores were multiplied by –1 in order to be combined with CSF derived amyloid Z-scores.
CSF tau measurements
To assess in vivo tau pathology, continuous phosphorylated tau (p-tau) and total tau (t-tau) values were obtained from the parent cohorts [17]. As sites were not standardized to each other, the p-tau and t-tau values were Z-scored with controls within each data set as a reference.
MRI data
Full details on the MRI data acquisition, visual rating check, and region of interest measurements have been previously reported [17]. Briefly, TI-weighted images, acquired according to local protocols, were collected from each site, each image was visually assessed and Freesurfer used to obtain volumetric measurements.
Clinical and cognitive data
Baseline clinical information and neuropsychological test scores were collected from each local site, harmonized, pooled and stored in an online data platform using tranSMART [29]. Full details of the clinical information provided by each site and the harmonization process has been previously described [17].
In all cohorts, a diagnosis of AD-type dementia was made according to the National Institute of Neurological and Communicative Disorders and Stroke-Alzheimer’s Disease and Related Disorders Association (NINCDS-ADRDA) criteria [30]. The Petersen criteria [31] was used to diagnose MCI in nine cohorts, while two cohorts used the Winblad et al. criteria [32] for this diagnosis. Normal performance on neuropsychological assessment (1.5 SD of the average for age, gender, and education) was used by all cohorts to define cognitively healthy individuals. Further details describing the diagnostic criteria used by each cohort can be found in Bos et al. [17].
For those individuals with MCI at baseline, we identified their clinical diagnosis at the last available follow-up visit provided by each local site (average = 2.21 years). Those that changed in their diagnosis to AD-type dementia, or had a decrease of at least 3 Mini-Mental State Examination (MMSE) points, were classed as MCI-convertors. MMSE was provided for all individuals.
Apolipoprotein E (APOE) genotyping
APOE genotypes for single nucleotide polymorphisms (SNPs) rs429358 and rs7412 were either determined from genome-wide SNP genotyping data (generated via the Infinium Global Screening Array (GSA) with Shared Custom Content, Illumina Inc.) or by TaqMan assays (ThermoFisher Scientific, Foster City, CA) on a QuantStudio-12K-Flex system in 384-well format. After QC, there were sufficient data to classify 926 individuals as APOE ɛ4 carriers or non-carriers according to their genotype status at rs429358 (C-allele =ɛ4). Missing values for APOE ɛ4 status were imputed using regression analyses within study, based on significant predictors (age, gender, MMSE, cognitive scores) [17].
Statistical analyses
All statistical analyses were completed using R (version 3.3.2) and all statistical tests were two-tailed. Individual participant data was excluded where there was a long interval (>1 year), or missing data on the time interval, between plasma collection and measurement of the outcome variable (amyloid status, n = 69 and 30 excluded from Oxford and Cardiff sample sets, respectively; MMSE, n = 73 and 39 excluded from Oxford and Cardiff, respectively; brain volume, n = 121 and 97 excluded from Oxford and Cardiff, respectively). Baseline cohort characteristics between high and low amyloid groups were compared using Mann-Whitney U test. All regression analyses included age as a covariate. p-values and false discovery rate corrected q-values are reported.
Univariate statistics
Univariate statistics were performed using identical statistical methods for both the ‘Oxford’ and ‘Cardiff’ sample sets and the results for all 31 proteins are presented in this manuscript together. The relationship of each individual protein with group-wise outcome variables was tested using logistic regression. The relationship of proteins with continuous outcome variables was examined using linear regression.
ROC analysis was performed on each protein individually, and the outcome was the dichotomous amyloid status. Sensitivity, specificity and area under the curve (AUC) metrics were computed. The 95% confidence intervals were estimated using the bootstrap resampling method with n = 1000 repetitions [33]. The optimal operation point from the ROC curve was identified by maximizing the Youden’s J statistic [34].
Multivariate amyloid classifier
Logistic regression was used to assess the performance of a multi-protein model for the discrimination between individuals in the abnormal and normal brain amyloid groups. The AUC, sensitivity, specificity, and likelihood ratio (LR) of the model are reported. The optimal operation point from the ROC curve was identified by maximizing the Youden’s J statistic [34].
RESULTS
Clinical characteristics and inter-group differences
The clinical characteristics of the Oxford and Cardiff sample sets, stratified by amyloid status, are presented in Table 1. Across both sample sets, individuals with abnormal amyloid status were older (p < 0.001), more frequently APOE ɛ4 carriers (p < 0.001), and had lower MMSE scores (p < 0.001) compared to those with normal amyloid status. Within the Oxford set only, individuals with abnormal amyloid status were more frequently female (p < 0.05) compared to those with normal amyloid status.
Table 1
Demographics of subjects from the EMIF-AD MBD study
| Variable | Subjects included in Oxford sample set | Subjects included in Cardiff sample set | ||||
| Normal amyloid status | Abnormal amyloid status | p | Low amyloid status | High amyloid status | p | |
| N | 457 | 543 | / | 460 | 406 | / |
| Aβ Z-score | 0.49±0.62 | –1.35±0.48 | <0.001* | 0.45±0.62 | –1.36±0.51 | <0.001* |
| Age (y) | 66.52±8.71 | 69.81±8.12 | <0.001* | 66.61±8.25 | 70.47±8.22 | <0.001* |
| Female gender N (%) | 223 (49) | 301 (55) | <0.05* | 253 (55) | 226 (56) | 0.844 |
| CTL N (%) | 289 (63) | 119 (22) | / | 272 (59) | 88 (22) | / |
| MCI N (%) | 147 (32) | 253 (47) | / | 179 (39) | 234 (58) | / |
| AD N (%) | 21 (5) | 171 (31) | / | 9 (2) | 84 (21) | / |
| APOE genotype ɛ4+ N (%) | 147 (32) | 349 (64) | <0.001* | 134 (29) | 246 (61) | <0.001* |
| MMSE | 27.93±2.49 | 25.11±4.29 | <0.001* | 28.09±2.23 | 25.41±4.26 | <0.001* |
MCI, mild cognitive impairment; AD, Alzheimer’s disease, APOE, apolipoprotein E; CTL, cognitively healthy control; MMSE, Mini-Mental State Examination. Mean±standard deviation. *Statistically significant by Mann-Whitney U, p < 0.05.
Univariate statistics for amyloid status (high/low group)
Cross-sectional comparisons of protein concentrations between normal and abnormal amyloid status groups revealed seven proteins that remained statistically significant after multiple testing corrections (q < 0.05; ficolin-2 (FCN2), β2-microglobulin (B2M), alpha-1 antitrypsin (A1AT), apolipoprotein E (apoE), complement component 4 (C4), Cathepsin D (CTSD), complement factor I (CFI), Table 2). Five of these proteins have previously been discovered as biomarkers of in vivo brain amyloid pathology in one or more of our previous biomarker studies (FCN2, B2M, A1AT, apoE, and C4), and all five replicate the direction of change previously identified. Expression of cathepsin D has previously been found to be decreased in AD fibroblasts, and here we show that this protein is also decreased in plasma with increased in vivo AD pathology [35]. CFI was previously found as a biomarker for conversion from MCI to dementia, with decreased plasma protein concentration in MCI converters [36]. Therefore, the direction of change identified in this study, decreased CFI with increased pathology, agrees with this previous finding.
Table 2
Logistic regression (age as covariate) results for each protein with amyloid status as the outcome variable
| Sample set | protein | Logistic Regression | |||
| beta | p | q | N | ||
| Oxford | |||||
| FCN2 | –0.466 | 0.000* | 0.000* | 824 | |
| FGG | –0.071 | 0.300 | 0.521 | 891 | |
| Cystatin C | –0.135 | 0.049* | 0.124 | 898 | |
| Clusterin | –0.138 | 0.045* | 0.124 | 906 | |
| B2M | –0.266 | 0.000* | 0.004* | 832 | |
| AGP | –0.009 | 0.901 | 0.963 | 875 | |
| CP | –0.028 | 0.679 | 0.780 | 883 | |
| A2M | –0.017 | 0.813 | 0.900 | 896 | |
| ApoA1 | –0.073 | 0.290 | 0.521 | 886 | |
| ApoC3 | –0.001 | 0.991 | 0.991 | 900 | |
| apoE | –0.220 | 0.002* | 0.008* | 901 | |
| TTR | –0.039 | 0.572 | 0.772 | 901 | |
| CFH | –0.049 | 0.475 | 0.701 | 907 | |
| CRP | –0.139 | 0.049* | 0.124 | 854 | |
| A1AT | –0.213 | 0.004* | 0.016* | 784 | |
| PEDF | –0.006 | 0.933 | 0.964 | 853 | |
| SAP | –0.052 | 0.449 | 0.697 | 869 | |
| CC4 | –0.243 | 0.001* | 0.005* | 894 | |
| BDNF | –0.036 | 0.603 | 0.778 | 887 | |
| Cathepsin D | –0.238 | 0.001* | 0.005* | 880 | |
| sICAM-1 | –0.148 | 0.033* | 0.124 | 893 | |
| RANTES | –0.100 | 0.146 | 0.309 | 905 | |
| NCAM | –0.032 | 0.645 | 0.780 | 891 | |
| sVCAM-1 | –0.071 | 0.302 | 0.521 | 891 | |
| PAI.1 | –0.134 | 0.052 | 0.124 | 890 | |
| Cardiff | |||||
| CR1 | –0.077 | 0.378 | 0.617 | 770 | |
| TCC | –0.112 | 0.149 | 0.309 | 770 | |
| CFB | –0.042 | 0.567 | 0.772 | 788 | |
| CFI | –0.284 | 0.000* | 0.004* | 754 | |
| Eotaxin | –0.176 | 0.037* | 0.124 | 749 | |
| MCP | –0.031 | 0.680 | 0.780 | 769 | |
*Statistically significant < 0.05.
Logistic regression analysis was also performed separately for each diagnostic group and APOE ɛ4 carrier groups (ɛ4 non-carrier/ɛ4 carrier). These results are reported in Supplementary Tables 1–5.
ROC analysis was performed on each of the seven proteins found to replicate direction of change to determine their individual predictive ability for the discrimination of normal/abnormal amyloid status groups, and compared to the discriminant ability of age. Table 3 displays the results of the ROC analysis and Supplementary Figure 2 displays both the AUC and corresponding 95% confidence interval of each protein and age. The AUC for every protein is higher than chance, even when including the lower end of the confidence interval.
Table 3
AUC statistics per protein, for the classification of normal / abnormal brain amyloid status. Abbreviations: AUC, area under the curve; CI, 95% confidence interval
| Variable | Optimal cutpoint | Sensitivity | Specificity | AUC | CI. low | CI. high |
| FCN2 | 24607094.990 | 0.448 | 0.783 | 0.640 | 0.593 | 0.690 |
| Age | 00000067.355 | 0.641 | 0.560 | 0.619 | 0.578 | 0.659 |
| CFI | 00026793.107 | 0.547 | 0.623 | 0.585 | 0.531 | 0.639 |
| C4 | 00073789.784 | 0.436 | 0.713 | 0.580 | 0.533 | 0.630 |
| B2M | 00004232.708 | 0.433 | 0.698 | 0.577 | 0.526 | 0.628 |
| Cathepsin D | 00000322.630 | 0.586 | 0.547 | 0.576 | 0.528 | 0.625 |
| apoE | 00000106.020 | 0.667 | 0.445 | 0.554 | 0.504 | 0.602 |
| A1AT | 01675622.528 | 0.765 | 0.333 | 0.552 | 0.506 | 0.606 |
For these seven proteins, ROC analysis of amyloid status classification was also performed separately for each diagnostic group and APOE ɛ4 carrier groups (ɛ4 non-carrier/ɛ4 carrier). These results are reported in Supplementary Tables 6 and 7.
Multi-protein classifier of amyloid normal/abnormal status
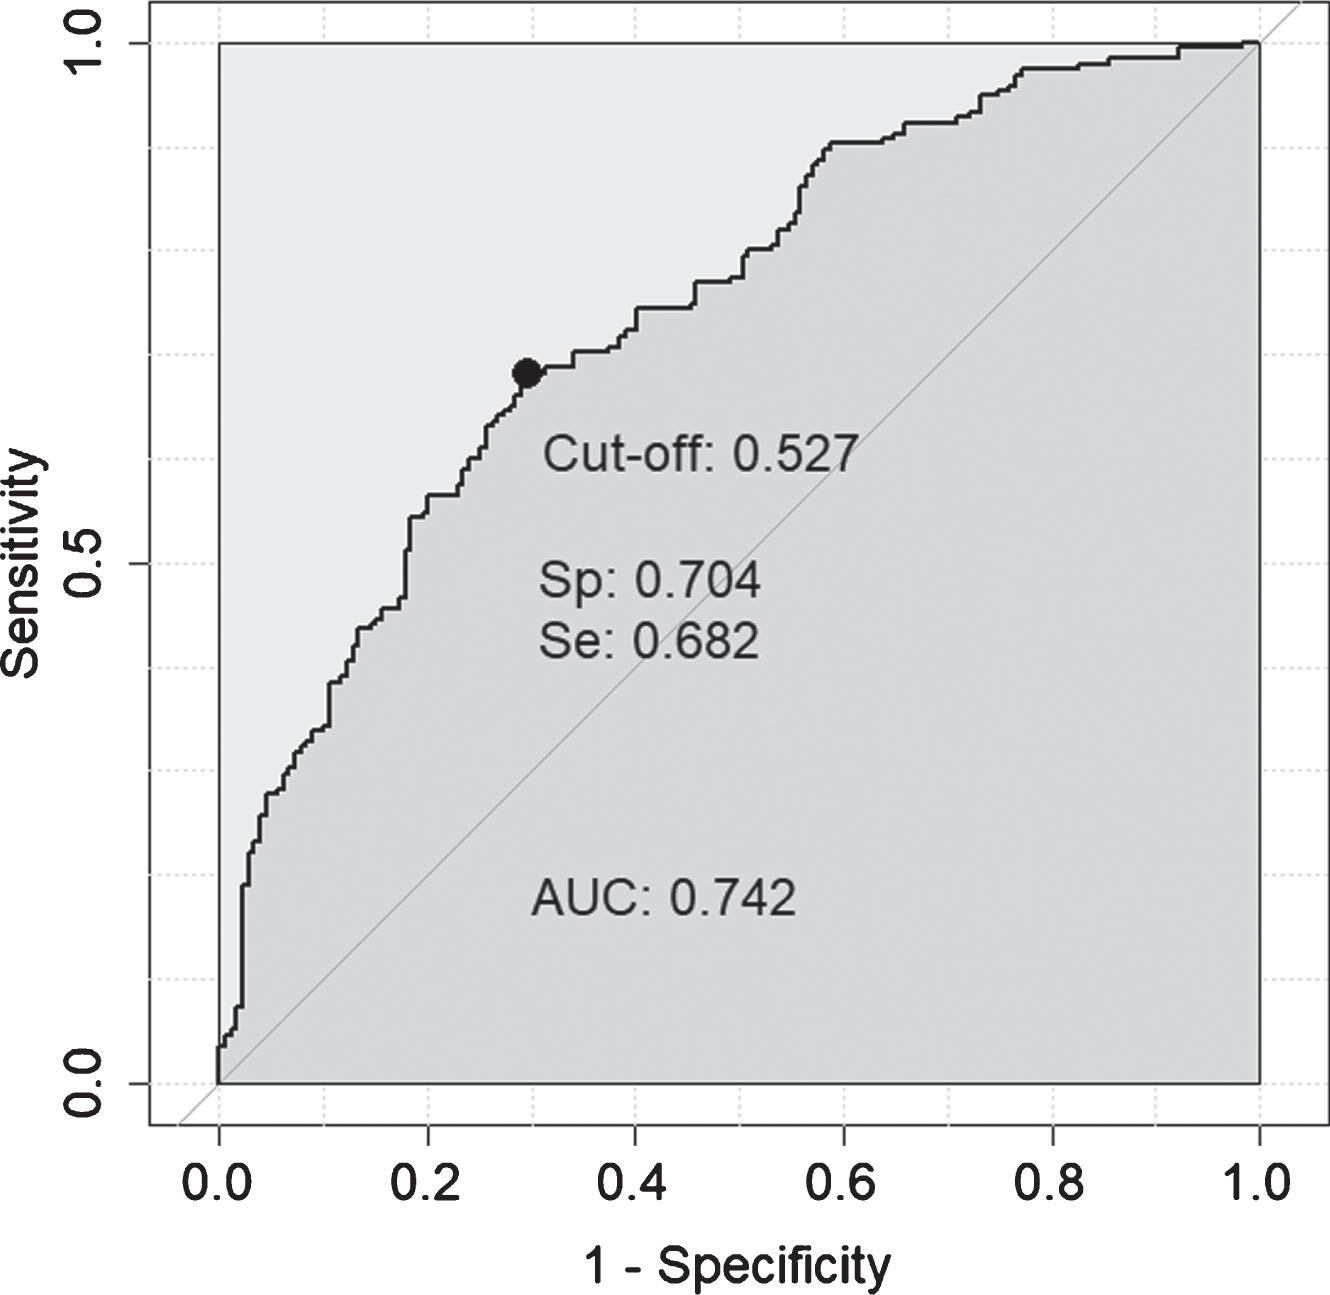
It is possible, if the individual protein associations with in vivo AD pathology are independent of each other, that a compound marker set of some or all of these proteins would have greater predictive value than any one protein alone. In order to test this, the seven proteins significant by logistic regression after multiple testing corrections (q < 0.05; FCN2, B2M, apoE, A1AT, CC4, cathepsin D, CFI) were included in a logistic regression classifier, along with age, to determine their predictive ability for amyloid status when combined. After missing data were removed this 8-feature model was tested on 374 individuals and achieved moderate accuracy (AUC = 0.742 (Fig. 1, sensitivity = 0.682, specificity = 0.704, LR = 2.3). In comparison, age alone achieved an AUC = 0.617.
Fig. 1
ROC curve obtained for the 8-feature classifier for prediction of amyloid normal/abnormal status. The 8-features included were: FCN2, B2M, apoE, A1AT, CC4, cathepsin D, CFI, and age.
To determine how this 8-feature model performs at different stages of the disease process and also in APOE ɛ4 carriers and non-carriers independently, we tested the classification ability of this model within each separate diagnostic group and APOE ɛ4 carriers and non-carriers. Table 4 displays the performance of this model within each group. The performance within the AD-type dementia group could not be accurately determined since removal of subjects with missing data left only 5% of the AD-type dementia cases as amyloid negative.
Table 4
ROC and AUC statistics for the 8-feature model for the classification of amyloid status within each diagnostic group, and APOE ɛ4 carriers and non-carriers
| AUC | Sensitivity | Specificity | LR | N | |
| Whole cohort (AD, MCI, CTL) | 0.742 | 0.682 | 0.704 | 2.30 | 374 |
| MCI | 0.743 | 0.658 | 0.785 | 3.06 | 193 |
| CTL | 0.768 | 0.682 | 0.776 | 3.04 | 142 |
| MCI and CTL combined | 0.724 | 0.677 | 0.661 | 2.00 | 335 |
| APOE ɛ4 non-carriers | 0.736 | 0.681 | 0.725 | 2.47 | 199 |
| APOE ɛ4 carriers | 0.836 | 0.757 | 0.767 | 3.25 | 175 |
MCI, mild cognitive impairment; AD, Alzheimer’s disease, APOE, apolipoprotein E; CTL, cognitively healthy control; AUC, area under the curve; LR, likelihood ratio.
Relationship of classifier proteins with continuous Aβ Z-score
We next wanted to determine whether this protein-amyloid relationship remains consistent using the Aβ Z-score (Table 5). All, except one protein (A1AT), were significantly related to Aβ Z-score after testing for multiple testing corrections (q < 0.05). A1AT was tending towards significance (q = 0.061).
Table 5
Linear and logistic regression (age as covariate) results for each protein with alternative outcome measures
| Aβ Z-score | P-Tau Z-score | T-Tau Z-score | Hippocampal volume | MMSE | MCI conversion to dementia | ||||||||||||||
| Sample set | protein | Linear regression | Linear regression | Linear regression | Linear regression | Linear regression | Logistic regression | ||||||||||||
| β | p | q | β | p | q | β | p | q | β | p | q | β | p | q | β | p | q | ||
| Oxford | |||||||||||||||||||
| FCN2 | –0.19 | 0.000* | 0.000* | –0.125 | 0.017* | 0.098 | –0.138 | 0.019* | 0.132 | –244.14 | 0.000* | 0.000* | –0.88 | 0.000* | 0.000* | –0.398 | 0.002* | 0.006* | |
| B2M | –00.125 | 0.001* | 0.001* | –0.019 | 0.715 | 0.876 | –0.001 | 0.991 | 0.991 | –14.6 | 0.758 | 0.758 | –0.174 | 0.183 | 0.214 | –0.039 | 0.729 | 0.901 | |
| apoE | –00.123 | 0.000* | 0.001* | –0.05 | 0.334 | 0.584 | –0.045 | 0.444 | 0.778 | 00–37.388 | 0.403 | 0.470 | –0.184 | 0.146 | 0.204 | –0.015 | 0.901 | 0.901 | |
| A1AT | –0.07 | 0.061 | 0.061 | –0.011 | 0.843 | 0.876 | –0.006 | 0.924 | 0.991 | –0172.168 | 0.000* | 0.001* | –0.239 | 0.078 | 0.181 | –0.096 | 0.520 | 0.901 | |
| CC4 | 1–0.117 | 0.001* | 0.001* | –0.088 | 0.09 | 0.209 | –0.045 | 0.445 | 0.778 | 00–70.691 | 0.112 | 0.261 | –0.131 | 0.306 | 0.306 | –0.153 | 0.207 | 0.483 | |
| Cathepsin D | 0–0.086 | 0.013* | 0.016* | –0.008 | 0.876 | 0.876 | –0.017 | 0.776 | 0.991 | –0046.917 | 0.306 | 0.429 | –0.195 | 0.118 | 0.204 | –0.032 | 0.792 | 0.901 | |
| Cardiff | |||||||||||||||||||
| CFI | 0*0.117 | 0.001* | 0.002* | –0.116 | 0.028* | 0.098 | –0.107 | 0.063 | 0.221 | *0052.396 | 0.256 | 0.429 | –0.442 | 0.001* | 0.002* | –0.932 | 0.000* | 0.000* | |
*Statistically significant < 0.05.
Relationship of classifier proteins with other markers of in vivo AD pathology or disease progression
In order to determine whether the classifier proteins were specific to brain amyloid pathology or if they could also perform as a biomarker of the other key hallmark of AD, brain tau pathology, linear regression was used to assess the continuous relationship with both p-tau and t-tau Z-scores (Table 5). None of the proteins were significantly related to either measure after multiple testing correction. We then used a similar approach to examine their relationship to hippocampal volume and MMSE score, and used logistic regression to examine their predictive ability for MCI conversion to dementia (Table 5). FCN2 displayed a significant relationship with all three measures (q < 0.05). CFI was found to be significantly related to both baseline MMSE and MCI conversion to dementia (q < 0.05). A1AT was found to be significantly related to hippocampal volume only (q < 0.05).
DISCUSSION
We have previously used a pathology endophenotype approach to discover plasma proteomic biomarkers designed to be predictive of in vivo AD pathology and disease progression. The aim of the present study was to replicate these previously identified candidate biomarkers in a large multi-center pragmatic sample collection collated from multiple cohorts, as well as to identify a plasma proteomic panel that could classify individuals into high or low brain amyloid groups. Our results show that in around 1,000 samples from multiple studies across Europe, seven biomarkers replicate, and we confirm a panel of proteins that identify abnormal levels of in vivo amyloid pathology with a sensitivity of 0.682 and a specificity of 0.704. While we chose to maximize the Youden’s index, which gave a balanced compromise between false negative and false positive results, similarly, any other operational point may also be suitable, depending on the clinical utility and priorities. Moreover, the model has predictive value in both APOE ɛ4 carrier and non-carrier individuals generating a biological predictor that could be used to reduce the screen failure rate in clinical trials.
The final 7-protein biomarker panel consists of: β2-microglobulin (B2M), cathepsin D (CTSD), ficolin-2 (FCN2), complement component 4 (C4), alpha-1 antitrypsin (A1AT), complement factor I (CFI), and apolipoprotein E (apoE). We did not find any significant improvement to AUC by introducing standardized quadratic terms for each of the significant variables. Specifically, our variables are: ‘Age’ and seven proteins: ‘FCN2’, ‘B2M’, ‘ApoE’, ‘A1AT’, ‘CC4’, CathepsinD’, and ‘CFI’. Using them as a linear combination, we achieved AUC = 0.742 and the most significant ones (p < 0.001) were Age, FCN2, and B2M. Their quadratic terms were found to be both, small (effect size) and statistically insignificant. Although initial discovery-phase studies used an unbiased approach to identify proteins that have a relationship with AD and its pathology, it is noteworthy that the resulting biomarker candidates are also biologically relevant to the disease process. B2M shares structural characteristics with fibrillar Aβ [37] and is one of a number of proteins that form amyloid deposits. Cathepsin D is increased in tangle bearing neurons [38], a process that might be induced by Aβ [39]. Ficolin-2 and mannose-binding lectin (MBL) are both activators of the lectin complement pathway [40] and CSF MBL levels have been shown to be reduced in AD [41]. The complement proteins (C4 and CFI) are two members of a pathway repeatedly shown to be associated with AD through genetics and neuropathology as well as from biomarker studies [42]. A1AT is an acute phase chemoreactant that is metabolized by the serpin enzyme complex (SEC) and hence might compete with and affect the activity of another SEC ligand, Aβ [43]. The relationship between the APOE ɛ2/ɛ3/ɛ4 polymorphism and AD is well established and complementary to our finding here that apoE protein is clearly a marker of amyloid load.
Recently, Nakamura et al. (2018) published an important study demonstrating that Aβ fragments can be reliably detected in blood and perform as well as current CSF biomarkers for predicting brain amyloid [44]. This approach using immunoprecipitation combined with mass spectrometry (IP+MS), was able to predict brain amyloid status with up to 90% accuracy. This finding builds upon other recent work by Ovod et al. (2017) who also used an IP+MS technique to identify blood Aβ with high concordance to amyloid PET [45]. While these papers are important in demonstrating the value of blood Aβ as a biomarker tool for brain pathology, replication in more studies with larger sample sizes is needed, and the proteomic technology employed will require refinement to enable implementation at scale. Nevertheless, these studies provide considerable further proof of concept for AD blood biomarkers. While the accuracy rates reported in our study are not as high as those reported when measuring blood Aβ levels, we are still able to achieve a level of accuracy sufficient to make a substantial impact upon the cost efficiency of clinical trials while using immunocapture—a practical and low-cost assay technology already in very wide use in both clinical and research laboratories.
Given that sample collection and storage protocols differed across the 11 cohorts included in the EMIF-AD MBD study [17], this pragmatic meta-collection reflects the challenges faced by any putative biomarker in the real-world of multi-site, multi-national clinical studies, and even more so in clinical practice, where standardization of sample collection is sought but rarely achieved. Replication of any putative biomarker set in such a collection of samples has a higher prior probability of effective utility in practice than replication in a single cohort or single site study with a fully standardized sample collection procedure. Nonetheless, the limitations of this study are also acknowledged; this study was designed to determine whether candidate biomarkers replicate in their ability to predict amyloid, it was not designed to determine the real-world value of the biomarkers or the biomarker panel they form for clinical trial screening. Selecting half of the samples from people with high amyloid enables proof of concept but clearly random prediction will already identify 50% of those with amyloid correctly. Additionally, missing data (4–11% per protein as a result of variable sample volume and quality and occasional assay performance failure) meant that when combining multiple proteins together in a biomarker panel the overall sample size with complete data was significantly reduced. However, even in this reduced sample set with 50% prediction accuracy possible by chance, the likelihood ratio with our biomarker panel is 2.3 in the whole cohort and 3 for preclinical disease, suggesting approximately a 15% and 20% improvement in detection respectively [46]. With a typical amyloid positivity rate of 30% and a representative cost of $3500 for an amyloid PET scan, recruiting 1,000 amyloid positive subjects would require 3,333 subjects at a total cost of $11.7 million. Pre-screening can reduce this cost. Utilizing the optimal model sensitivity and specificity values (Table 4) and assuming an assay cost of $150, the total cost of recruiting would be $7.8 million and require pre-screening 4900 subjects. Going further, model sensitivities and specificities are based on cut-offs that can be optimized to be fit-for-purpose for a given application. For the present model, optimizing the cut-off for minimum total cost would yield a sensitivity of 34% and a specificity of 93% requiring pre-screening 9700 subjects with a total recruitment cost of $6.6 million. When the positive prevalence is low and the cost of the truth assay is high relative to the pre-screen, such economic optimizations often favor specificity to reject a large portion of true negatives to save operating costs. Such economic trade-offs require a larger screening population and have a higher false negative rate. Screening in medical practice, however, favors higher sensitivity to optimize the yield of subjects for intervention. In short, low-cost pre-screening applications can save money and be tuned as needed for the application context.
To summarize, our overall goal is to facilitate clinical trials by contributing to rapid and effective selection of research participants most likely to have brain amyloid pathology and hence reducing screen failure rates, reducing cost and time of trial start-up and reducing exposure of potential participants to PET imaging or CSF lumbar puncture. In order to do this, we have previously investigated, discovered, and replicated plasma protein biomarkers that could be implemented as a clinical trial entry criterion to triage potential participants for amyloid PET or CSF measures. In the current study, seven of these biomarkers are replicated in a large, multi-center cohort. These seven proteins form a biomarker panel that is the product of over a decade of research, is biologically relevant and measurable using practical immunocapture arrays, and could significantly reduce the cost incurred to clinical trials by screen failure because of absence of amyloid pathology.
ETHICS STATEMENT
Written informed consent was obtained from all participants before inclusion in the study. The experiments were done in accordance with the Helsinki Declaration of 1975 and the medical ethics committee at each site approved the study (Supplementary Table 8).
DATA AVAILABILITY
The datasets generated and analyzed during the current study are available via the EMIF-AD Catalogue via submitted research questions which have to be approved by the data-owners from each parent cohort.
ACKNOWLEDGMENTS
This research was conducted as part of the EMIF-AD project which has received support from the Innovative Medicines Initiative Joint Undertaking under EMIF grant agreement n° 115372, resources of which are composed of financial contribution from the European Union’s Seventh Framework Programme (FP7/2007–2013) and EFPIA companies’ in-kind contribution. ANH and SL were supported by a MRC Mental Health Data Pathfinder award to the University of Oxford, and by the NIHR Oxford Health Biomedical Research Centre (BRC). FB is supported by the NIHR UCLH biomedical research centre. The Lausanne study was funded by a grant from the Swiss National Research Foundation (SNF 320030_141179). Cardiff University acknowledge Wellcome Trust support (grant: 104025/Z/14/Z) as part of the research project entitled “Wellcome Trust Consortium for Neuroimmunology of Mood Disorders and Alzheimer’s Disease”. The views expressed are those of the authors and not necessarily those of the MRC, the NHS, the NIHR or the Department of Health.
Authors’ disclosures available online (https://www.j-alz.com/manuscript-disclosures/19-0434r3).
SUPPLEMENTARY MATERIAL
[1] The supplementary material is available in the electronic version of this article: https://dx.doi.org/10.3233/JAD-190434.
REFERENCES
[1] | Cummings J , Lee G , Ritter A , Zhong K ((2018) ) Alzheimer’s disease drug development pipeline: 2018. Alzheimers Dement (N Y) 4: , 195–214. |
[2] | Cummings J , Lee G , Ritter A , Sabbagh M , Zhong K ((2019) ) Alzheimer’s disease drug development pipeline: 2019. Alzheimers Dement (N Y) 5: , 272–293. |
[3] | Jansen WJ , Ossenkoppele R , Knol DL , Tijms BM , Scheltens P , Verhey FR , Visser PJ , Aalten P , Aarsland D , Alcolea D , Alexander M , Almdahl IS , Arnold SE , Baldeiras I , Barthel H , van Berckel BN , Bibeau K , Blennow K , Brooks DJ , van Buchem MA , Camus V , Cavedo E , Chen K , Chetelat G , Cohen AD , Drzezga A , Engelborghs S , Fagan AM , Fladby T , Fleisher AS , van der Flier WM , Ford L , Forster S , Fortea J , Foskett N , Frederiksen KS , Freund-Levi Y , Frisoni GB , Froelich L , Gabryelewicz T , Gill KD , Gkatzima O , Gomez-Tortosa E , Gordon MF , Grimmer T , Hampel H , Hausner L , Hellwig S , Herukka SK , Hildebrandt H , Ishihara L , Ivanoiu A , Jagust WJ , Johannsen P , Kandimalla R , Kapaki E , Klimkowicz-Mrowiec A , Klunk WE , Kohler S , Koglin N , Kornhuber J , Kramberger MG , Van Laere K , Landau SM , Lee DY , de Leon M , Lisetti V , Lleo A , Madsen K , Maier W , Marcusson J , Mattsson N , de Mendonca A , Meulenbroek O , Meyer PT , Mintun MA , Mok V , Molinuevo JL , Mollergard HM , Morris JC , Mroczko B , Van der Mussele S , Na DL , Newberg A , Nordberg A , Nordlund A , Novak GP , Paraskevas GP , Parnetti L , Perera G , Peters O , Popp J , Prabhakar S , Rabinovici GD , Ramakers IH , Rami L , Resende de Oliveira C , Rinne JO , Rodrigue KM , Rodriguez-Rodriguez E , Roe CM , Rot U , Rowe CC , Ruther E , Sabri O , Sanchez-Juan P , Santana I , Sarazin M , Schroder J , Schutte C , Seo SW , Soetewey F , Soininen H , Spiru L , Struyfs H , Teunissen CE , Tsolaki M , Vandenberghe R , Verbeek MM , Villemagne VL , Vos SJ , van Waalwijk van Doorn LJ , Waldemar G , Wallin A , Wallin AK , Wiltfang J , Wolk DA , Zboch M , Zetterberg H ((2015) ) Prevalence of cerebral amyloid pathology in persons without dementia: A meta-analysis. JAMA 313: , 1924–1938. |
[4] | Hye A , Lynham S , Thambisetty M , Causevic M , Campbell J , Byers HL , Hooper C , Rijsdijk F , Tabrizi SJ , Banner S , Shaw CE , Foy C , Poppe M , Archer N , Hamilton G , Powell J , Brown RG , Sham P , Ward M , Lovestone S ((2006) ) Proteome-based plasma biomarkers for Alzheimer’s disease. Brain 129: , 3042–3050. |
[5] | Humpel C ((2011) ) Identifying and validating biomarkers for Alzheimer’s disease. Trends Biotechnol 29: , 26–32. |
[6] | Henriksen K , O’Bryant SE , Hampel H , Trojanowski JQ , Montine TJ , Jeromin A , Blennow K , Lonneborg A , Wyss-Coray T , Soares H , Bazenet C , Sjogren M , Hu W , Lovestone S , Karsdal MA , Weiner MW ((2014) ) The future of blood-based biomarkers for Alzheimer’s disease. Alzheimers Dement 10: , 115–131. |
[7] | O’Bryant SE , Gupta V , Henriksen K , Edwards M , Jeromin A , Lista S , Bazenet C , Soares H , Lovestone S , Hampel H , Montine T , Blennow K , Foroud T , Carrillo M , Graff-Radford N , Laske C , Breteler M , Shaw L , Trojanowski JQ , Schupf N , Rissman RA , Fagan AM , Oberoi P , Umek R , Weiner MW , Grammas P , Posner H , Martins R ((2015) ) Guidelines for the standardization of preanalytic variables for blood-based biomarker studies in Alzheimer’s disease research. Alzheimers Dement 11: , 549–560. |
[8] | Thambisetty M , Simmons A , Velayudhan L , Hye A , Campbell J , Zhang Y , Wahlund LO , Westman E , Kinsey A , Guntert A , Proitsi P , Powell J , Causevic M , Killick R , Lunnon K , Lynham S , Broadstock M , Choudhry F , Howlett DR , Williams RJ , Sharp SI , Mitchelmore C , Tunnard C , Leung R , Foy C , O’Brien D , Breen G , Furney SJ , Ward M , Kloszewska I , Mecocci P , Soininen H , Tsolaki M , Vellas B , Hodges A , Murphy DG , Parkins S , Richardson JC , Resnick SM , Ferrucci L , Wong DF , Zhou Y , Muehlboeck S , Evans A , Francis PT , Spenger C , Lovestone S ((2010) ) Association of plasma clusterin concentration with severity, pathology, and progression in Alzheimer disease. Arch Gen Psychiatry 67: , 739–748. |
[9] | Kiddle SJ , Thambisetty M , Simmons A , Riddoch-Contreras J , Hye A , Westman E , Pike I , Ward M , Johnston C , Lupton MK , Lunnon K , Soininen H , Kloszewska I , Tsolaki M , Vellas B , Mecocci P , Lovestone S , Newhouse S , Dobson R , Alzheimers Disease Neuroimaging Initiative ((2012) ) Plasma based markers of [11C] PiB-PET brain amyloid burden. PLoS One 7: , e44260. |
[10] | Hye A , Riddoch-Contreras J , Baird AL , Ashton NJ , Bazenet C , Leung R , Westman E , Simmons A , Dobson R , Sattlecker M , Lupton M , Lunnon K , Keohane A , Ward M , Pike I , Zucht HD , Pepin D , Zheng W , Tunnicliffe A , Richardson J , Gauthier S , Soininen H , Kloszewska I , Mecocci P , Tsolaki M , Vellas B , Lovestone S ((2014) ) Plasma proteins predict conversion to dementia from prodromal disease. Alzheimers Dement 10: , 799–807.e792. |
[11] | Sattlecker M , Kiddle SJ , Newhouse S , Proitsi P , Nelson S , Williams S , Johnston C , Killick R , Simmons A , Westman E , Hodges A , Soininen H , Kloszewska I , Mecocci P , Tsolaki M , Vellas B , Lovestone S , AddNeuroMed Consortium , Dobson RJ ((2014) ) Alzheimer’s disease biomarker discovery using SOMAscan multiplexed protein technology. Alzheimers Dement 10: , 724–734. |
[12] | Ashton NJ , Kiddle SJ , Graf J , Ward M , Baird AL , Hye A , Westwood S , Wong KV , Dobson RJ , Rabinovici GD , Miller BL , Rosen HJ , Torres A , Zhang Z , Thurfjell L , Covin A , Hehir CT , Baker D , Bazenet C , Lovestone S , AIBL Research Group ((2015) ) Blood protein predictors of brain amyloid for enrichment in clinical trials? Alzheimers Dement (Amst) 1: , 48–60. |
[13] | Voyle N , Baker D , Burnham SC , Covin A , Zhang Z , Sangurdekar DP , Tan Hehir CA , Bazenet C , Lovestone S , Kiddle S , Dobson RJ , AIBL research group ((2015) ) Blood protein markers of neocortical amyloid-beta burden: A candidate study using SOMAscan technology. J Alzheimers Dis 46: , 947–961. |
[14] | Westwood S , Leoni E , Hye A , Lynham S , Khondoker MR , Ashton NJ , Kiddle SJ , Baird AL , Sainz-Fuertes R , Leung R , Graf J , Hehir CT , Baker D , Cereda C , Bazenet C , Ward M , Thambisetty M , Lovestone S ((2016) ) Blood-based biomarker candidates of cerebral amyloid using PiB PET in non-demented elderly. J Alzheimers Dis 52: , 561–572. |
[15] | Westwood S , Baird AL , Hye A , Ashton NJ , Nevado-Holgado AJ , Anand SN , Liu B , Newby D , Bazenet C , Kiddle SJ , Ward M , Newton B , Desai K , Tan Hehir C , Zanette M , Galimberti D , Parnetti L , Lleo A , Baker S , Narayan VA , van der Flier WM , Scheltens P , Teunissen CE , Visser PJ , Lovestone S ((2018) ) Plasma protein biomarkers for the prediction of CSF amyloid and tau and [(18)F]-Flutemetamol PET scan result. Front Aging Neurosci 10: , 409. |
[16] | Morgan AR , Touchard S , Leckey C , O’Hagan C , Nevado-Holgado AJ , Barkhof F , Bertram L , Blin O , Bos I , Dobricic V , Engelborghs S , Frisoni G , Frolich L , Gabel S , Johannsen P , Kettunen P , Kloszewska I , Legido-Quigley C , Lleo A , Martinez-Lage P , Mecocci P , Meersmans K , Molinuevo JL , Peyratout G , Popp J , Richardson J , Sala I , Scheltens P , Streffer J , Soininen H , Tainta-Cuezva M , Teunissen C , Tsolaki M , Vandenberghe R , Visser PJ , Vos S , Wahlund LO , Wallin A , Westwood S , Zetterberg H , Lovestone S , Morgan BP ((2019) ) Inflammatory biomarkers in Alzheimer’s disease plasma. Alzheimers Dement 15: , 776–787. |
[17] | Bos I , Vos S , Vandenberghe R , Scheltens P , Engelborghs S , Frisoni G , Molinuevo JL , Wallin A , Lleo A , Popp J , Martinez-Lage P , Baird A , Dobson R , Legido-Quigley C , Sleegers K , Van Broeckhoven C , Bertram L , Ten Kate M , Barkhof F , Zetterberg H , Lovestone S , Streffer J , Visser PJ ((2018) ) The EMIF-AD Multimodal Biomarker Discovery study: Design, methods and cohort characteristics. Alzheimers Res Ther 10: , 64. |
[18] | Visser PJ , Verhey FRJ , Boada M , Bullock R , De Deyn PP , Frisoni GB , Frolich L , Hampel H , Jolles J , Jones R , Minthon L , Nobili F , Rikkert MO , Ousset PJ , Rigaud AS , Scheltens P , Soininen H , Spiru L , Touchon J , Tsolaki M , Vellas B , Wahlund LO , Wilcock G , Winblad B ((2008) ) Development of screening guidelines and clinical criteria for predementia Alzheimer’s disease. Neuroepidemiology 30: , 254–265. |
[19] | Reijs BLR , Ramakers IHGB , Elias-Sonnenschein L , Teunissen CE , Koel-Simmelink M , Tsolaki M , Wahlund LO , Waldemar G , Hausner L , Johannsen P , Vanderstichele H , Verhey F , Devanand DP , Visser PJ ((2017) ) Relation of odor identification with Alzheimer’s disease markers in cerebrospinal fluid and cognition. J Alzheimers Dis 60: , 1025–1034. |
[20] | Galluzzi S , Marizzoni M , Babiloni C , Albani D , Antelmi L , Bagnoli C , Bartres-Faz D , Cordone S , Didic M , Farotti L , Fiedler U , Forloni G , Girtler N , Hensch T , Jovicich J , Leeuwis A , Marra C , Molinuevo JL , Nobili F , Pariente J , Parnetti L , Payoux P , Del Percio C , Ranjeva JP , Rolandi E , Rossini PM , Schonknecht P , Soricelli A , Tsolaki M , Visser PJ , Wiltfang J , Richardson JC , Bordet R , Blin O , Frisoni GB , PharmaCog Consortium ((2016) ) Clinical and biomarker profiling of prodromal Alzheimer’s disease in workpackage 5 of the Innovative Medicines Initiative PharmaCog project: A ‘European ADNI study’. J Intern Med 279: , 576–591. |
[21] | van der Flier WM , Pijnenburg YAL , Prins N , Lemstra AW , Bouwman FH , Teunissen CE , van Berckel BNM , Stam CJ , Barkhof F , Visser PJ , van Egmond E , Scheltens P ((2014) ) Optimizing patient care and research: The Amsterdam Dementia Cohort. J Alzheimers Dis 41: , 313–327. |
[22] | Somers C , Struyfs H , Goossens J , Niemantsverdriet E , Luyckx J , De Roeck N , De Roeck E , De Vil B , Cras P , Martin JJ , De Deyn PP , Bjerke M , Engelborghs S ((2016) ) A decade of cerebrospinal fluid biomarkers for Alzheimer’s disease in Belgium. J Alzheimers Dis 54: , 383–395. |
[23] | Estanga A , Ecay-Torres M , Ibanez A , Izagirre A , Villanua J , Garcia-Sebastian M , Gaspar MTI , Otaegui-Arrazola A , Iriondo A , Clerigue M , Martinez-Lage P ((2017) ) Beneficial effect of bilingualism on Alzheimer’s disease CSF biomarkers and cognition. Neurobiol Aging 50: , 144–151. |
[24] | Wallin A , Nordlund A , Jonsson M , Blennow K , Zetterberg H , Ohrfelt A , Stalhammar J , Eckerstrom M , Carlsson M , Olsson E , Gothlin M , Svensson J , Rolstad S , Eckerstrom C , Bjerke M ((2016) ) Alzheimer’s diseasesubcortical vascular disease spectrum in a hospital-based setting: Overview of results from the Gothenburg MCI and dementia studies. J Cereb Blood Flow Metab 36: , 95–113. |
[25] | Fortea J , Sala-Llonch R , Bartres-Faz D , Bosch B , Llado A , Bargallo N , Molinuevo JL , Sanchez-Valle R ((2010) ) Increased cortical thickness and caudate volume precede atrophy in PSEN1 mutation carriers. J Alzheimers Dis 22: , 909–922. |
[26] | Tautvydaite D , Kukreja D , Antonietti JP , Henry H , von Gunten A , Popp J ((2017) ) Interaction between personality traits and cerebrospinal fluid biomarkers of Alzheimer’s disease pathology modulates cognitive performance. Alzheimers Res Ther 9: , 6. |
[27] | Adamczuk K , Schaeverbeke J , Nelissen N , Neyens V , Vandenbulcke M , Goffin K , Lilja J , Hilven K , Dupont P , Van Laere K , Vandenberghe R ((2016) ) Amyloid imaging in cognitively normal older adults: Comparison between F-18-flutemetamol and C-11-Pittsburgh compound B. Eur J Nucl Med Mol Imaging 43: , 142–151. |
[28] | Alcolea D , Carmona-Iragui M , Suarez-Calvet M , Sanchez-Saudinos MB , Sala I , Anton-Aguirre S , Blesa R , Clarimon J , Fortea J , Lleo A ((2014) ) Relationship between beta-secretase, inflammation and core cerebrospinal fluid biomarkers for Alzheimer’s disease. J Alzheimers Dis 42: , 157–167. |
[29] | Scheufele E , Aronzon D , Coopersmith R , McDuffie MT , Kapoor M , Uhrich CA , Avitabile JE , Liu J , Housman D , Palchuk MB ((2014) ) tranSMART: An open source knowledge management and high content data analytics platform. AMIA Jt Summits Transl Sci Proc 2014: , 96–101. |
[30] | McKhann G , Drachman D , Folstein M , Katzman R , Price D , Stadlan EM ((1984) ) Clinical diagnosis of Alzheimer’s disease: Report of the NINCDS-ADRDA Work Group under the auspices of Department of Health and Human Services Task Force on Alzheimer’s Disease. Neurology 34: , 939–944. |
[31] | Petersen RC ((2004) ) Mild cognitive impairment as a diagnostic entity. J Intern Med 256: , 183–194. |
[32] | Winblad B , Palmer K , Kivipelto M , Jelic V , Fratiglioni L , Wahlund LO , Nordberg A , Backman L , Albert M , Almkvist O , Arai H , Basun H , Blennow K , de Leon M , DeCarli C , Erkinjuntti T , Giacobini E , Graff C , Hardy J , Jack C , Jorm A , Ritchie K , van Duijn C , Visser P , Petersen RC ((2004) ) Mild cognitive impairment–beyond controversies, towards a consensus: Report of the International Working Group on Mild Cognitive Impairment. J Intern Med 256: , 240–246. |
[33] | DiCiccio T , Tibshirani R ((1987) ) Bootstrap confidence intervals and bootstrap approximations. J Am Stat Assoc 82: , 163–170. |
[34] | Ruopp MD , Perkins NJ , Whitcomb BW , Schisterman EF ((2008) ) Youden Index and optimal cut-point estimated from observations affected by a lower limit of detection. Biom J 50: , 419–430. |
[35] | Urbanelli L , Emiliani C , Massini C , Persichetti E , Orlacchio A , Pelicci G , Sorbi S , Hasilik A , Bernardi G , Orlacchio A ((2008) ) Cathepsin D expression is decreased in Alzheimer’s disease fibroblasts. Neurobiol Aging 29: , 12–22. |
[36] | Hakobyan S , Harding K , Aiyaz M , Hye A , Dobson R , Baird A , Liu B , Harris CL , Lovestone S , Morgan BP ((2016) ) Complement biomarkers as predictors of disease progression in Alzheimer’s disease. J Alzheimers Dis 54: , 707–716. |
[37] | Sawaya MR , Sambashivan S , Nelson R , Ivanova MI , Sievers SA , Apostol MI , Thompson MJ , Balbirnie M , Wiltzius JJ , McFarlane HT , Madsen AO , Riekel C , Eisenberg D ((2007) ) Atomic structures of amyloid cross-beta spines reveal varied steric zippers. Nature 447: , 453–457. |
[38] | Ginsberg SD , Hemby SE , Lee VM , Eberwine JH , Trojanowski JQ ((2000) ) Expression profile of transcripts in Alzheimer’s disease tangle-bearing CA1 neurons. Ann Neurol 48: , 77–87. |
[39] | Hoffman KB , Bi XN , Pham JT , Lynch G ((1998) ) β-amyloid increases cathepsin D levels in hippocampus. Neurosci Lett 250: , 75–78. |
[40] | Fujita T , Matsushita M , Endo Y ((2004) ) The lectin-complement pathway - its role in innate immunity and evolution. Immunol Rev 198: , 185–202. |
[41] | Lanzrein AS , Jobst KA , Thiel S , Jensenius JC , Sim RB , Perry VH , Sim E ((1998) ) Mannan-binding lectin in human serum, cerebrospinal fluid and brain tissue and its role in Alzheimer’s disease. Neuroreport 9: , 1491–1495. |
[42] | Aiyaz M , Lupton MK , Proitsi P , Powell JF , Lovestone S ((2012) ) Complement activation as a biomarker for Alzheimer’s disease. Immunobiology 217: , 204–215. |
[43] | Joslin G , Griffin GL , August AM , Adams S , Fallon RJ , Senior RM , Perlmutter DH ((1992) ) The serpin-enzyme complex (SEC) receptor mediates the neutrophil chemotactic effect of alpha-1 antitrypsin-elastase complexes and amyloid-beta peptide. J Clin Invest 90: , 1150–1154. |
[44] | Nakamura A , Kaneko N , Villemagne VL , Kato T , Doecke J , Doré V , Fowler C , Li Q-X , Martins R , Rowe C , Tomita T , Matsuzaki K , Ishii K , Ishii K , Arahata Y , Iwamoto S , Ito K , Tanaka K , Masters CL , Yanagisawa K ((2018) ) High performance plasma amyloid-β biomarkers for Alzheimer’s disease. Nature 554: , 249–254. |
[45] | Ovod V , Ramsey KN , Mawuenyega KG , Bollinger JG , Hicks T , Schneider T , Sullivan M , Paumier K , Holtzman DM , Morris JC , Benzinger T , Fagan AM , Patterson BW , Bateman RJ ((2017) ) Amyloid β concentrations and stable isotope labeling kinetics of human plasma specific to central nervous system amyloidosis. Alzheimers Dement 13: , 841–849. |
[46] | McGee S ((2002) ) Simplifying likelihood ratios. J Gen Intern Med 17: , 646–649. |

