
Healthy versus Entorhinal Cortical Atrophy Identification in Asymptomatic APOE4 Carriers at Risk for Alzheimer’s Disease
Abstract
Early detection of Alzheimer’s disease (AD) has been challenging as current biomarkers are invasive and costly. Strong predictors of future AD diagnosis include lower volume of the hippocampus and entorhinal cortex, as well as the ɛ4 allele of the Apolipoprotein E gene (APOE) gene. Therefore, studying functions that are critically mediated by the hippocampus and entorhinal cortex, such as spatial memory, in APOE ɛ4 allele carriers, may be key to the identification of individuals at risk of AD, prior to the manifestation of cognitive impairments. Using a virtual navigation task developed in-house, specifically designed to assess spatial versus non-spatial strategies, the current study is the first to differentiate functional and structural differences within APOE ɛ4 allele carriers. APOE ɛ4 allele carriers that predominantly use non-spatial strategies have decreased fMRI activity in the hippocampus and increased atrophy in the hippocampus, entorhinal cortex, and fimbria compared to APOE ɛ4 allele carriers who use spatial strategies. In contrast, APOE ɛ4 allele carriers who use spatial strategies have grey matter levels comparable to non-APOE ɛ4 allele carriers. Furthermore, in a leave-one-out analysis, grey matter in the entorhinal cortex could predict navigational strategy with 92% accuracy.
INTRODUCTION
Early detection and prevention of Alzheimer’s disease (AD) is imperative during the latent phase of the disease, known to precede clinical diagnosis by up to 25 years [1]. Current biomarkers for AD include PET and cerebrospinal fluid (CSF) measurements of Aβ and tau, and hippocampal and entorhinal cortex (EC) volumes [1, 2]. However, the methods to acquire these measures are invasive and are neither cost-effective nor readily available to the general population. For this reason, the development of early detection tools has proven to be difficult.
The key for early detection may lie in finding cognitive measures that strongly correlate with pre-existing biomarkers such as hippocampal and EC integrity. Lower function and volume of the hippocampus and EC are strong predictors of future cognitive impairment [3–6]. In addition, atrophy of these areas is a strong predictor of future diagnosis of AD in at risk patients with mild cognitive impairment (MCI) [7]. Spatial memory is a function that critically depends on the hippocampus and EC [8–12] and therefore, may be an ideal measure to assess the integrity of these structures. However, spatial memory impairments and hippocampal atrophy can be masked by the use of alternate memory systems such as the caudate nucleus of the striatum [13]. Previous research has demonstrated that individuals who predominantly use alternate caudate nucleus-dependent memory systems during navigation have equal cognitive performance to those who use hippocampus-dependent memory [13]. However, individuals who use caudate nucleus-dependent memory, on average, have decreased grey matter and function in the hippocampus compared to those who use hippocampus-dependent memory [14–16]. Therefore, we hypothesize that tests that dissociate the use of memory systems will enable us to identify individuals with atrophy in the hippocampus and EC, before the manifestation of cognitive impairments, thus opening a window of opportunity for early intervention.
Wayfinding difficulties are among the first cognitive symptoms observed in individuals who later develop AD [17]. Although several studies have examined spatial memory in older adults and in patients with MCI and AD, none have considered the assessment of non-hippocampal, habit-based strategies dependent on the caudate nucleus. The hippocampus involves learning the spatial relationships [10] between multiple landmarks in an environment to build a cognitive map, i.e., independent of the position of the observer. This form of hippocampus-dependent navigation is referred to as the spatial memory strategy. By contrast one can navigate with a less cognitively demanding habit-based strategy dependent on the caudate nucleus [16]. This form of caudate nucleus-dependent navigation is referred to as the response strategy. The response strategy plays a role in stimulus-response learning [18, 19], i.e., learning a series of stimulus-response associations, such as a pattern of left and right turns from a given starting position. The proportion of individuals who use hippocampus-dependent spatial strategies decreases across the lifespan [20], in favor of caudate nucleus-dependent response strategies [21]. We have recently shown that, in healthy young and older adults, use of spatial strategies is associated with increased grey matter and fMRI BOLD activity in the hippocampus [14–16, 22, 23].
Genetically, the ɛ4 allele of the polymorphic gene for apolipoprotein (APOE) is the strongest known genetic risk factor for sporadic AD [24]. Carriers of the APOE ɛ4 allele have an increased risk of developing AD (odds ratio = 2.0–4.2), making them an ideal population to study early markers of AD [25]. In this population, variability in hippocampal integrity can be assessed early on before the manifestation of cognitive symptoms. As such, here, in an experimental design double-blind to genotype, we investigated grey matter, volume, and function in the hippocampus and EC in relation to navigation strategies, within healthy carriers of the ɛ4 risk allele. Based on the literature and our own findings, we hypothesized that APOE ɛ4 allele carriers who use response strategies would show decreased fMRI BOLD activity in the hippocampus and increased atrophy in the hippocampal formation, including the hippocampus, EC, and surrounding white matter tracts, compared to APOE ɛ4 allele carriers who use hippocampal-dependent spatial strategies.
MATERIAL AND METHODS
Participants
A total of 66 (mean age = 66.1±4.5; 38 women and 28 men) participants were included in the current MRI study, screened from an initial sample of N = 515 (age 60–75 years). The initial sample of 515 older adults were screened for our inclusion criteria (Table 1), resulting in a sample of 139 healthy older adult participants. Approximately half of the 515 participants were excluded due to medical history or MRI confounding factors. An additional 40% were excluded after cognitive screening at the laboratory. Participants scoring below 26 on the Montreal Cognitive Assessment (MoCA) or 27 on the Mini-Mental State Examination (MMSE) were excluded from the study. Among the remaining 139 healthy older adults, all APOE ɛ4 allele carriers as well as a convenience sample of individuals of the other genotypes, were invited to participate in a structural and functional MRI study, such that a total of 66 participants were scanned and included in the final study. Exclusion criteria was applied in the same way to both the APOE ɛ4 allele carriers and the convenience sample of individuals of other genotypes. All participants were right-handed and had normal or corrected vision. None of the participants had any history of neurological or psychiatric disorders or of alcohol or drug abuse, assessed with a prescreening questionnaire. In addition, participants were screened for confounding factors that would affect cerebral blood flow during fMRI such as cardiovascular diseases, cholesterol, and diabetes. Informed consent was obtained from all participants in accordance to the guidelines of the local ethics committee. The study was approved by the institutional review boards at McGill University and the Douglas Mental Health University Institute.
Table 1
Older adult participant inclusion/exclusion criteria
| Inclusion criteria | Exclusion criteria |
| Age 60–75 y | Substance abuse: |
| Right handed | > 10 Cigarettes/day |
| 10+ years of education | > 10 Drinks/week |
| Good vision or optical correction | Drug abuse |
| Cholesterol or blood pressure medication <2 y | |
| Cardiovascular diseases | |
| Other medical conditions: | |
| Diabetes | |
| Kidney disease | |
| Asthma, respiratory disease | |
| Infectious illness | |
| Hormone disorder | |
| Lupus | |
| Arthritis in hands | |
| History of psychiatric or neurological illnesses: | |
| Stroke | |
| Parkinson’s disease | |
| Multiple sclerosis | |
| Head trauma/Concussion | |
| Depression (> 9 GDS) | |
| Dementia & Cognitive impairment (≥26 MoCA,≥27 MMSE) | |
| Anxiety disorder | |
| Bipolar disorder | |
| Schizophrenia | |
| Present of past history of cancer | |
| Eye diseases | |
| Motion sickness | |
| Ferrous metals in any part of the body | |
| Claustrophobia | |
| Extensive metal dental work |
APOE genotyping
Blood samples were collected by research nurses at the Douglas Mental Health University Institute. DNA extraction and PCR amplification were conducted using the ABI PRISM SNaPshot Multiplex Kit assay (Applied Biosystems; Foster city, CA). Genotyping for APOE was done at Génôme Québec using TaqMan® chemistry (Applied Biosystems). A fluorogenic probe used in TaqMan chemistry enables the detection of a specific PCR product and differentially labeled fluorogenic probes allow the allelic discrimination. The fluorescence emission detection was done using the 7900HT reader and the TaqMan technology has an average conversion rate around 98%, with an average error rate of 0.1%.
Participants were divided into two groups based on genotype. Participants with one or more APOE ɛ4 allele were in the ApoE4 group (n = 15; mean age = 65.6±4.5, mean education = 16.0±2.8) and participants who are not carriers of the APOE ɛ4 allele were in the non-ApoE4 group (n = 49; mean age = 66.5±4.6, mean education = 16.8±3.5). Genotyping failed for two participants. Experimenters were blind to the genotype of the participants and were not notified until all behavioral and imaging tests were complete. The final APOE ɛ4 carrier and non-carrier groups did not differ in their family history of AD.
Neuropsychological tasks
The MoCA [26] and MMSE [27] were administered to assess general cognitive function. The Rey-Auditory Verbal Learning Test [28] and Rey-Osterrieth Complex Figure [29] were administered to assess verbal and visual memory, respectively. The Stroop test [30] and the Digit symbol test [31] were administered to assess executive function.
Pre-scan training
Before the fMRI, older adult participants were given practice in a virtual environment both outside and inside the scanner. To navigate, they were given a four-key button-box, but were only asked to use the forward, left, and right keys. The practice virtual environment was a radial arm maze to ensure that all participants were equally comfortable with the procedural aspect of navigating.
All older adults underwent a mock scanning session several days before the fMRI scan. The mock scan was given to the older adults to decrease dropout rates due to claustrophobia, motion artifacts, failure to navigate using the keypad while lying in the scanner, and to ensure that they could be comfortable lying on their backs for a long period of time during the real scan. While in the mock scanner, participants performed a virtual radial maze task that took place in a completely different virtual environment with different task instructions from the one used in the fMRI scan. As the instructions and environment were different, information learned during the mock scan could not be used in the fMRI scan. In this task, participants were placed in a completely novel virtual environment and were presented with a single pathway at a given time. Participants had to memorize whether each pathway contained an object or not. These trials were interspersed with visuo-motor control trials in order to mimic the sequence of events presented during the fMRI scan.
fMRI task: Concurrent spatial discrimination learning task
The Concurrent Spatial Discrimination Learning Task (CSDLT) was created using the editor program of a commercially available computer game (Unreal Tournament 2003; Epic Games, Raleigh, NC). The task was adapted from a two-stage mouse model radial maze involving concurrent spatial discrimination learning aimed at assessing memory flexibility in mice [32]. The task takes place in a radial maze and consists of a center platform from which branch out 12 pathways. An enriched environment made up of mountains, trees, and other landmarks surrounds the radial maze (Fig. 1). At the end of each pathway, there is a set of stairs that leads down to a small pit where, in half of the pathways, an object is located. The 12 pathways of the maze are divided up into six adjacent pairs of pathways. Within each pair of pathways, one pathway, always the same one, contains an object and the other is always empty. During the experimental learning phase (Stage 1), participants are repeatedly presented with the six pairs of pathways in a pseudo-random order (Fig. 1a). They are asked to learn within each pair of pathways which one contains an object and to go down that pathway to retrieve the object. Upon descending the stairs at the end of the pathway and entering the pit, participants are automatically transported back to the center platform and presented with the next pair of pathways. The number of correct pathways the participant visits within each trial is measured as choice accuracy. A trial consists of the presentation of all six pairs of pathways. Participants are trained until a choice accuracy criterion of 11/12 is reached within two consecutive trials in order to ensure that they have learned the object locations. A minimum of six trials was administered to all participants.
Fig.1
The two stages of the Concurrent Spatial Discrimination Learning Task (CSDLT) with a schematic representation of the behavioral paradigm. The CSDLT is a virtual 12-arm radial maze in which participants must learn the location of objects within six pairs of pathways using either a spatial or response strategy. a) Example of a pair of pathways presented during the learning phase where the target object would be found next to the pyramid (Stage 1). After the participants learn the location of the objects to criterion (11/12 correct choices) in 6 pairs of pathways, a probe trial is administered where the perspective shifted such that the pathways formed new pairs but the objects remain in the same locations. b) Example of a recombined pair of pathways during the probe phase (Stage 2). These probe trials allow for the dissociation of those who used a spatial strategy from those who used a response strategy. Individuals who used a spatial strategy will find target locations despite the new pairing of pathways and the change in perspective (e.g., they will take the pathway slightly to the right of the pyramids). On the other hand, older adults who used a response strategy during acquisition (e.g., when I see pyramids take a left) will make errors on the probe trial because the stimulus-response association will lead them to the incorrect pathway (e.g., when I see the pyramids, take a left).
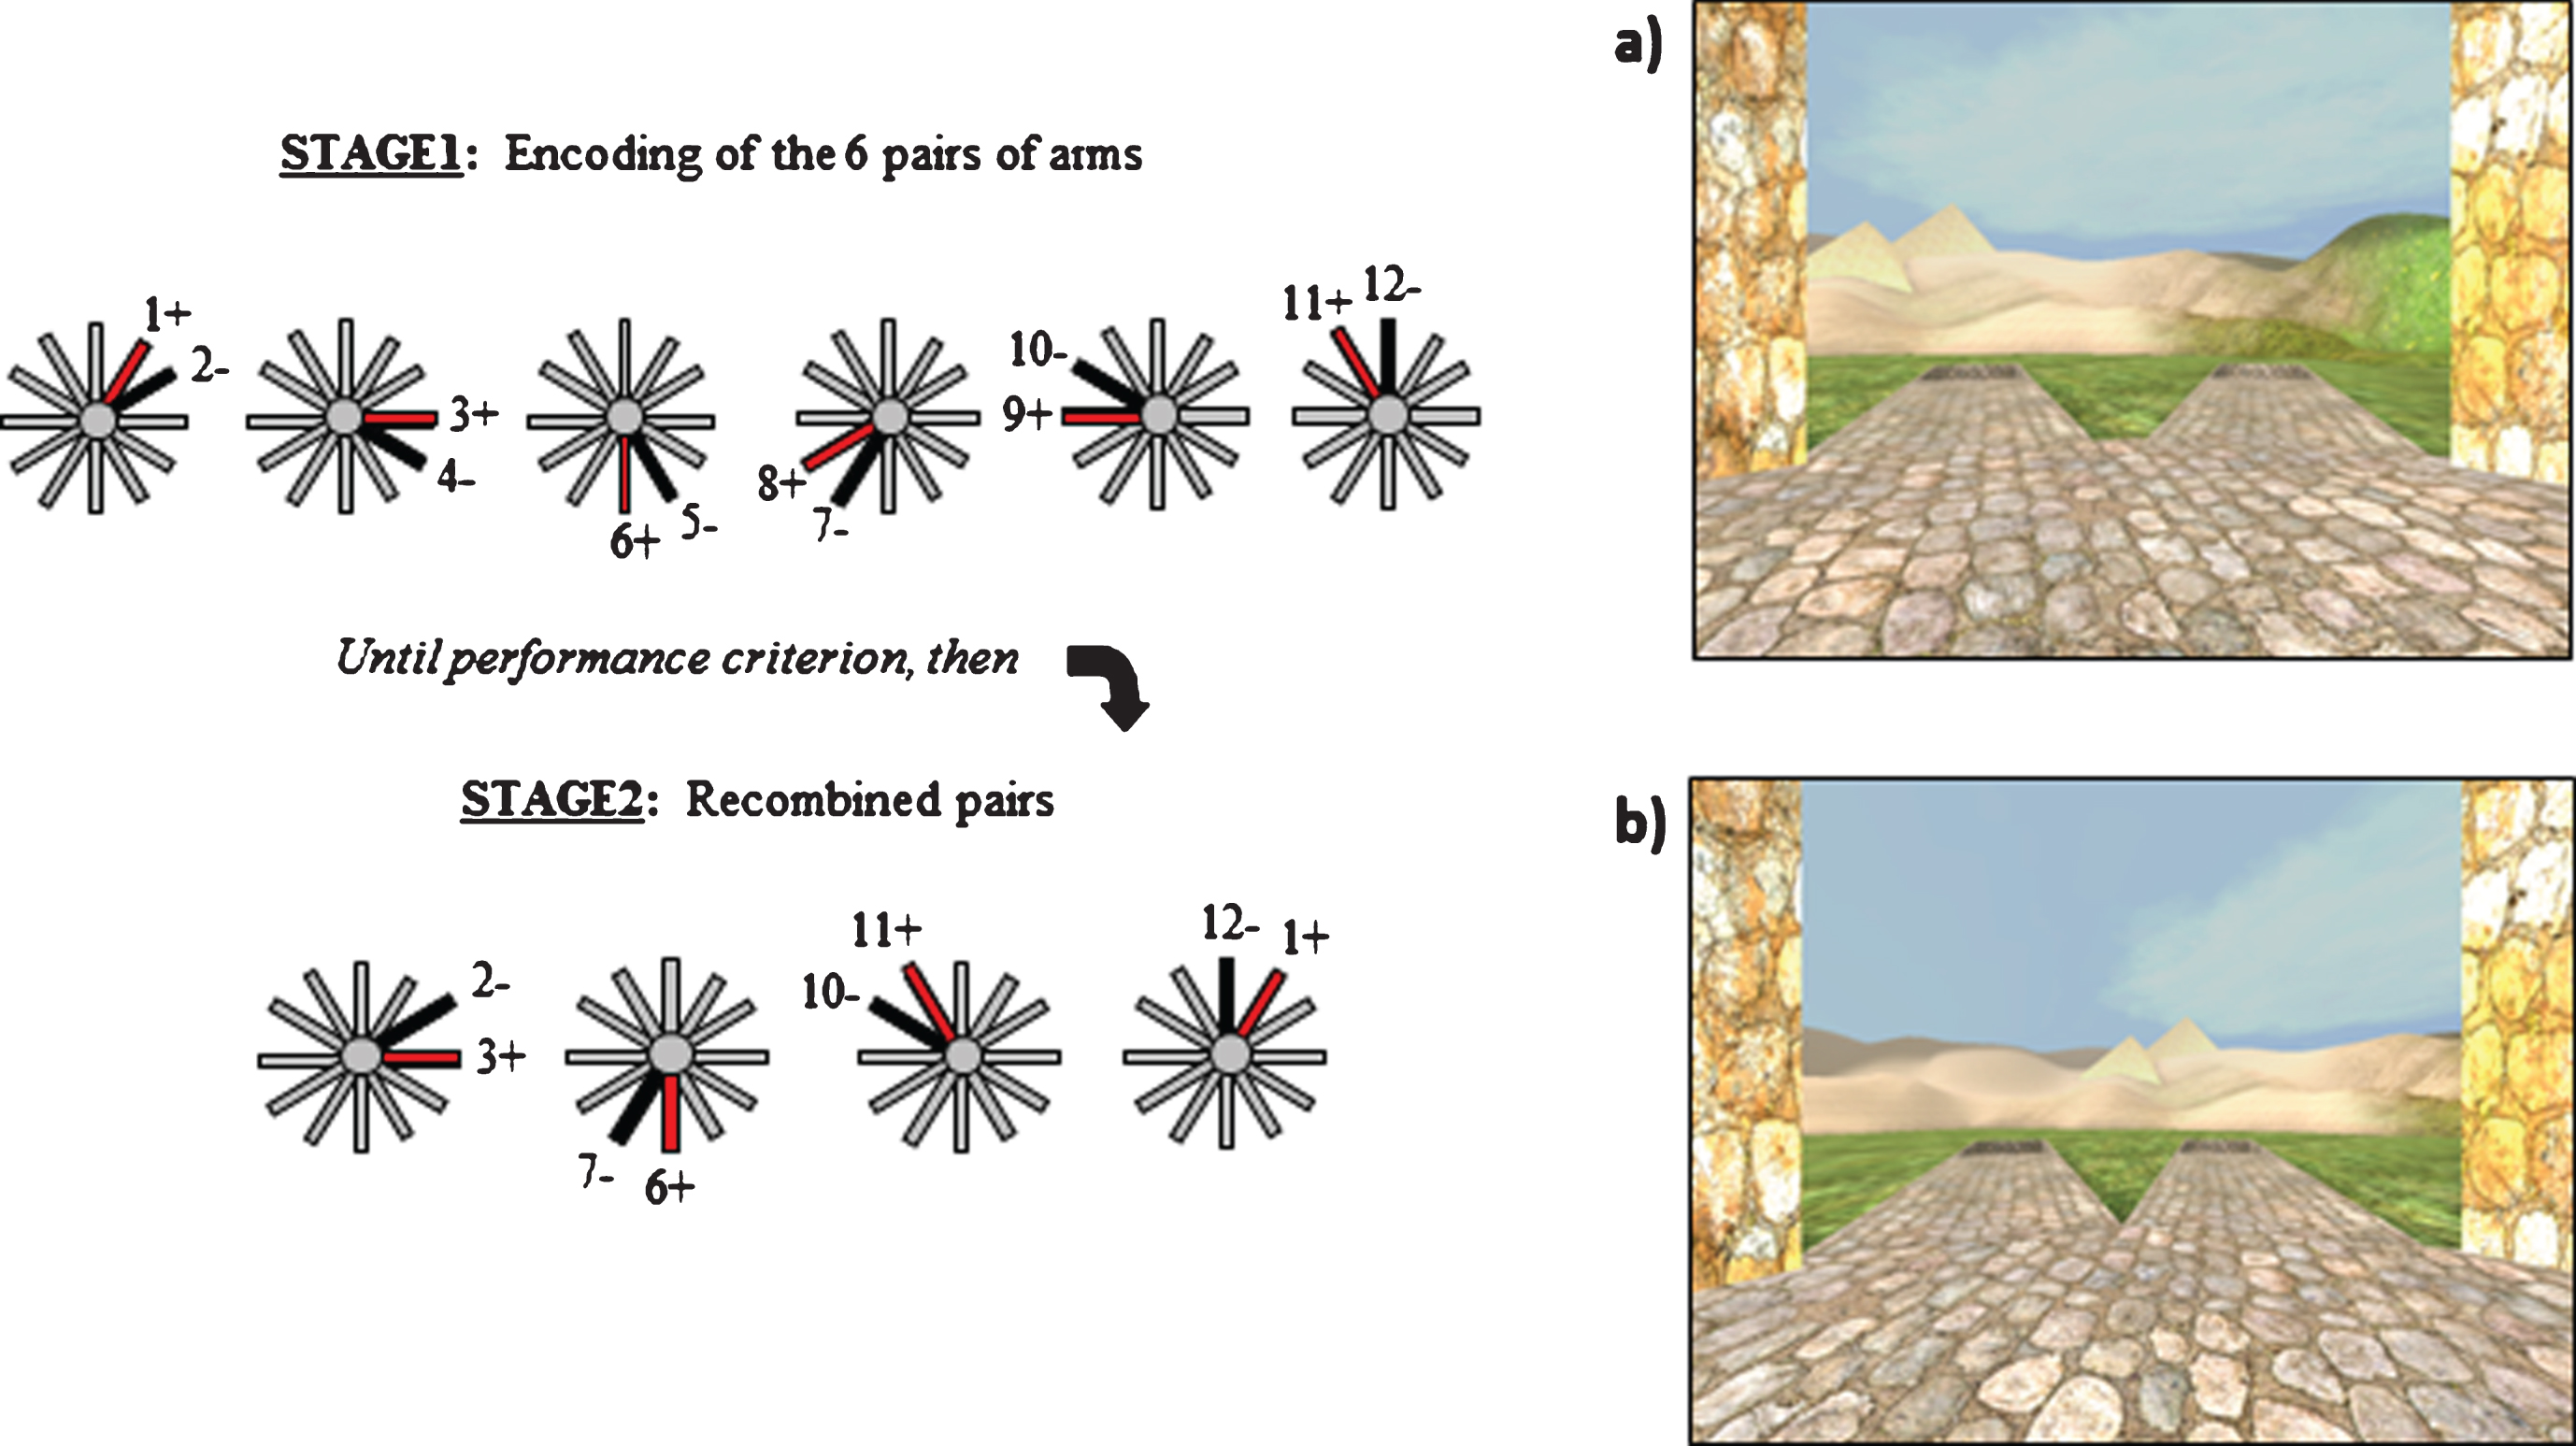
Upon reaching criterion, participants proceed to the probe phase (Stage 2) called the recombined pairs condition (Fig. 1b). During this phase, the pathways presented to the participants are rearranged into new pairs. However, the objects remain in the same locations. Four pairs of recombined pathways are presented twice in a pseudo-random order. Only four recombined pairs allowed for the presentation of adjacent pathways with only one pathway containing an object. This stage was designed so that only individuals who are flexible, evidenced by the fact that they used a spatial strategy by learning the spatial relationships between the objects and environmental landmarks, are able to find the objects within the recombined pairs. In other words, when the pairs of pathways that are presented are recombined, participants who know the relationships between the target objects and landmarks are capable of discerning the target pathway from the non-target pathway. Alternatively, people who used a stimulus-response strategy (e.g., “when I see the pyramid (stimulus), take the pathway to the right (response)) are unable to perform the task with the same flexibility. In this case, since the pairs of presented pathways were rearranged, “the pathway to the right when I see the pyramid” in this stage (Fig. 1b) is not the same “pathway to the right when I see the pyramid” as in the learning stage (Fig. 1a). Thus, the probe phase provides an objective method to distinguish between participants who are flexible at using the spatial relationships between the environmental landmarks and the target pathway from a different viewpoint and those who are inflexible to do so. Given that the probe has 8 trials and the probability of a success on an individual trial is 0.5, 7 out of 8 successes was used as the cutoff to obtain a binomial probability of p < 0.05. The probability that someone will get 7 out of 8 trials correct by chance is less than 5%. Therefore 7/8 correct was used as the cut-off to distinguish those that used a spatial strategy from those that used a response strategy [15, 21–23, 33].
On the CSDLT, three participants (one in the non-ApoE4 group and two in the ApoE4 group) did not reach the learning criterion and one participant (non-ApoE4) reached criterion but did not perform the probe trial for lack of time and therefore their data were excluded from the analyses.
Visuo-motor control task
Interspersed between the experimental tasks is a visuo-motor control task. The control task consists of a radial pathway maze with no background environment. In addition, within each pair of pathways, the location of the objects is completely random. Participants are presented with four pairs of pathways and asked to visit a pathway at random. The experimenter explicitly states that there is nothing to learn during this task and that the location of the objects is completely random with nothing to predict the location. Furthermore, to prevent participants from learning anything or rehearsing previously learned information, they are distracted with a counting task. During the entire duration of the control task, participants are required to count backwards by three from 1000. The aim of the control is to have a task identical to the experimental condition but with no learning involved [21]. All experimental trials are contrasted against control trials to remove from our analysis the brain activity resulting from the visuo-motor aspects of virtual navigation. Furthermore, the control trials are interspersed with the experimental trials, allowing us to control for scanner drifts that occur within each 11-min scanning session.
MRI and fMRI data acquisition
The scanning sessions consisted of multiple 11-min scans. The number of scans differed between participants depending on the number of experimental trials they required to reach criterion on the CSDLT. Each scanning session varied from one to two hours. During the learning phase (Stage 1), the 11-min scans included trials of approximately 45-s duration that alternated between experimental and control conditions. Before each trial, participants were prompted with a panel that reminded them of the instructions for the task ahead. Once participants reached criterion, two probe trials were given, interleaved with control trials. The start and finish of each trial was marked with in-house “spy” software that records keystrokes and scanner frame times. The keystrokes made by the experimenter indicated the start and finish of experimental and control trials. They were used to select frame times that correspond to the experimental and control trials and exclude frames collected during the transition between trials.
Scanning was conducted at the Douglas Brain Imaging Center with a 3 Tesla Siemens Trio scanner. Participants were comfortably placed in the scanner with their heads immobilized with cushions. They were provided with a mirror placed above the head coil in order to visualize the projection screen on which the virtual environments were displayed. After a 1-min localizer scan, an MPRAGE anatomical scan of approximately 9 min was performed before the functional scans. A three-dimensional gradient echo acquisition was used to collect 192 contiguous 1 mm T1-weighted images in the sagittal plane (TR = 2300 ms; TE = 2.98 ms; flip angle = 9; field of view =256 mm2; 1 mm×1 mmx 1 mm resolution). Whole brain functional scans were acquired using 42 contiguous 3 mm axial slices parallel to the hippocampus covering the entire brain (TR = 2220 ms; TE = 30 ms; field of view = 192 mm2; matrix size = 64×64; 300 whole brain acquisitions/run).
MRI and fMRI statistical analysis
Voxel-based morphometry (VBM) was used to investigate morphological differences between the different groups. MRI scans were spatially normalized by linear transformation into a standard stereotaxic Talairach space [34]. They were corrected for intensity non-uniformity (shading artifact) using the N3 software package [35]. Each voxel was automatically labeled as white matter, grey matter, cerebrospinal fluid, or background using INSECT (Intensity Normalized Stereotaxic Environment for the Classification of Tissues) [36]. The skull and dura were then masked from the brain. The grey matter was smoothed using an 8 mm FWHM (full-width at half-maximum) Gaussian kernel. Grey matter in the hippocampal formation and caudate nucleus were compared between groups. Furthermore, generalized linear model was used to assess the association between performance on the CSDLT and gray matter in the hippocampal formation. Outputs of the statistical analyses were displayed as a statistical map overlaid on an average MRI scan. The statistical maps show regions of grey matter that significantly differ between groups. Based on our a priori hypothesis, an uncorrected p-value of 0.001 was used to calculate the t-statistical threshold for significance (all participants: N = 60, t = 3.23; APOE ɛ4 allele carriers: n = 13, t = 3.93; non-ɛ4 carriers: n = 47, t = 3.28) for voxels in the predicted regions of interest, namely, the hippocampal formation and caudate nucleus. For the whole brain, a Bonferroni correction for multiple comparisons was used to calculate the t-statistical threshold (all participants: N = 60, t = 5.24; APOE ɛ4 allele carriers: n = 13, t = 10.02; non-ɛ4 carriers: n = 47, t = 5.43).
Fully-automated segmentation of the hippocampus subfields was carried out using the Multiple Automatically Generated Templates (MAGeT) Brain algorithm [37, 38]. This technique is a modified multi-atlas segmentation technique designed to use a limited number of high-quality manually segmented atlases as input. Participant scans were preprocessed using N4 intensity correction [39] and the application of a headmask before MAGeT Brain segmentation in order to aid registration. In the current study, the hippocampal subfields atlas of the Winterburn Atlas [40] was used as the atlas input on five manually segmented brains. In MAGeT Brain, segmentation of each participant is bootstrapped through a template library which consists of a subset of the participant population. 21 templates, a number shown to be optimal for segmentation accuracy [38], were selected as a demographically representative set, with four ɛ2 allele carriers, 10 ɛ3 homozygous participants and seven ɛ4 allele carries were selected to be part of the template set. Each template is segmented through nonlinear atlas-to-template registration followed by label propagation, yielding a unique definition of the subfields for each of the templates. This bootstrapping results in 21 candidate labels produced for each participant, and candidate labels are fused through a voxel-wise majority vote to produce a final output segmentation. Nonlinear registration was performed using a version of the Automatic Normalization Tools (ANTS) registration technique [41] that is compatible with the minc toolkit (https://github.com/vfonov/mincANTS). Total hippocampal volume was calculated based on the total sum of the left and right volumes of the CA1, CA2/CA3, CA4/dentate gyrus, subiculum, and stratum radiatum, lacunosum, and moleculare subfields. Total fimbria volume was calculated by summing the left and right volumes. Each output segmentation was visually inspected for quality control and assigned a pass or fail based on quality. All scans passed the manual inspection for quality control. Group comparisons were performed between spatial and response strategy users. For all structural analyses, bootstrapped bias-corrected and accelerated 95% CIs were used to assess statistical significance and account for deviations from parametric assumptions.
fMRI data pre-processing and analysis was conducted using SPM8 (http://www.fil.ion.ucl.ac.uk/spm/). The first three frames from each run were discarded to control for field inhomogeneities. Scans were corrected for motion and registered to the mean image using a least-squares approach and a 6-parameter (rigid body) spatial transformation. Slice timing was performed to correct for differences in slice acquisition times. The structural scan was coregistered to the mean functional image. Next, the functional and structural scans were normalized to the MNI template and the functional scans were smoothed using an 8 mm full-width at half maximum (FWHM) kernel. Statistical t-map images contrasting all experimental trials to control trials were generated. To view the analyses, statistical maps were overlaid on an average structural scan of the group. Based on our a priori hypothesis, an uncorrected p-value of 0.001 was used for voxels in the predicted regions of interest, namely, the hippocampal formation and caudate nucleus. For the whole brain, a Bonferroni correction for multiple comparisons was used to calculate the t-statistical threshold.
Detailed methods for Leave-one-out analyses
1. Following the results of our VBM study in APOE ɛ4 allele carriers showing a peak in the right and left EC, a region of interest analysis was performed in this region. Probe scores were regressed against grey matter in the EC using VBM. In each VBM analysis, one participant was left out (Example: Subject# 2 – See Table 2 for values). Each VBM output was examined and peaks in the right and left EC were found. The peak coordinates (MNI coordinates: x, y, z) in the left and right EC were noted (Example: Right: 25, –1, –33; Left: –33, –15, –28) and these coordinates were used to extract grey matter values (GM values) for all participants at those coordinates. Linear regression analyses were performed with the individual GM values as the independent variable and the probe scores as the dependent variable.
Table 2
Results of the one-man out analysis
| Participant | EC Peak | Regression Equation (Y = Probe, X = GM value) | Weighted correlation | GM value | Predicted probe score | Weighted predicted probe score | Final predicted probe score | Real probe score | Predicted Strategy | Real Strategy | ||||||
| Right | Left | Right | Left | Right | Left | Right | Left | Right | Left | Right | Left | |||||
| 1 | 25, –2, –33 | –32, –12, –27 | Y = –20.96+(32.6*X) | Y = –11.98+(24.97*X) | 0.50 | 0.50 | 0.77 | 0.79 | 4.17 | 7.70 | 2.09 | 3.85 | 5.94 | 5 | Response | Response |
| 2 | 25, –1, –33 | –33, –15, –28 | Y = –21.2+(32.93*X) | Y = –15.19+(28.88*X) | 0.51 | 0.49 | 0.78 | 0.82 | 5.05 | 8.42 | 2.55 | 4.16 | 6.71 | 6 | Response | Response |
| 3 | 25, –1, –33 | –32, –14, –28 | Y = –21.09+(32.93*X) | Y = –12.68+(24.97*X) | 0.51 | 0.49 | 0.90 | 0.77 | 8.52 | 6.59 | 4.37 | 3.21 | 7.58 | 8 | Spatial | Spatial |
| 4 | 25, –2, –33 | –33, –14, –28 | Y = –18.62+(29.83*X) | Y = –10.61+(22.64*X) | 0.52 | 0.48 | 0.88 | 0.77 | 7.53 | 6.83 | 3.90 | 3.29 | 7.19 | 8 | Spatial | Spatial |
| 5 | 25, –2, –33 | –33, –12, –29 | Y = –18.43+(29.68*X) | Y = –6.94+(18.4*X) | 0.50 | 0.50 | 0.77 | 0.73 | 4.36 | 6.56 | 2.18 | 3.28 | 5.46 | 4 | Response | Response |
| 6 | 25, –2, –33 | –33, –14, –28 | Y = –19.15+(30.49*X) | Y = –12.41+(25.01*X) | 0.51 | 0.49 | 0.85 | 0.71 | 6.87 | 5.34 | 3.48 | 2.62 | 6.10 | 7 | Response | Spatial |
| 7 | 25, –2, –33 | –32, –13, –28 | Y = –11.46+(23.88*X) | Y = –19.67+(31.1*X) | 0.48 | 0.52 | 0.78 | 0.78 | 7.27 | 4.73 | 3.47 | 2.47 | 5.94 | 5 | Response | Response |
| 8 | 25, –2, –33 | –32, –13, –28 | Y = –19.72+(31.14*X) | Y = –12.24+(24.64*X) | 0.52 | 0.48 | 0.81 | 0.72 | 5.45 | 5.44 | 2.83 | 2.62 | 5.45 | 6 | Response | Response |
| 9 | 25, –1, –33 | –32, –13, –28 | Y = –19.28+(30.6*X) | Y = –11.79+(24.1*X) | 0.53 | 0.47 | 0.85 | 0.82 | 6.78 | 7.99 | 3.59 | 3.76 | 7.35 | 8 | Spatial | Spatial |
| 10 | 25, –3, –33 | –32, –14, –27 | Y = –16.39+(27.51*X) | Y = –11.86+(24.16*X) | 0.55 | 0.45 | 0.83 | 0.71 | 6.46 | 5.36 | 3.54 | 2.42 | 5.96 | 4 | Response | Response |
| 11 | 25, –2, –33 | –32, –13, –28 | Y = –19.09+(30.43*X) | Y = –11.25+(23.32*X) | 0.52 | 0.48 | 0.89 | 0.80 | 7.92 | 7.41 | 4.12 | 3.55 | 7.67 | 8 | Spatial | Spatial |
| 12 | 25, –1, –33 | –32, –13, –28 | Y = –19.7+(31.34*X) | Y = –13.8+(26.66*X) | 0.52 | 0.48 | 0.83 | 0.67 | 6.30 | 3.93 | 3.30 | 1.87 | 5.17 | 5 | Response | Response |
| 13 | 25, –2, –33 | –32, –13, –28 | Y = –20.23+(31.84*X) | Y = –12.63+(25.26*X) | 0.52 | 0.48 | 0.90 | 0.84 | 8.48 | 8.48 | 4.43 | 4.05 | 8.48 | 8 | Spatial | Spatial |
2. The regression analysis produced a predictive equation model that can be used to estimate probe scores:
1 Probe = Y intercept+ (slope * GM value)
2 Example: Right: Y = –21.2+ (32.93*X); Left: Y = –15.19 + (28.88*X)
3 The correlation between the probe scores and GM values was calculated for the right and left EC.
4 Example: Right: r = 0.903; Left: r = 0.884
3. Depending on the analysis, the correlation between GM in the EC and probe scores was stronger in either the right or left. As such, these correlation values were used to weight the predicted probe scores.
Example: Right: r = 0.51; Left: r = 0.49
4. The GM values of the missing participant at those peak coordinates were then determined by looking at the extracted GM map of the individual.
Example: Right: 0.78; Left: 0.82
5. These GM values were inserted into the regression equation and a probe score was estimated.
Example: Right: 5.05 = –21.2 + (32.93*0.78); Left: 8.42 = –15.19 + (28.88*0.82)
6. A weighted predicted probe score for the left and right EC was calculated by multiplying the predicted probe score with the weighted correlation value.
Example: Right: 2.55 = 0.505 * 5.05; Left: 4.16 = 0.495 * 8.42
7. The weighted predicted probe scores for the right and left were then summed to produce a final predicted probe score and strategy assessment. If the predicted probe score was ≥7 (as per the a priori classification of strategy, published in Konishi et al. [23]), they were categorized as a spatial strategy user. If the score was <7, they were categorized as a response strategy user.
Example: 6.71 = 2.55 + 4.16
Example: Strategy = Response
8. The predicted probe score and strategy were compared to the real probe score and strategy of the participant to determine whether GM in the EC can predict strategy.
Example: Predicted Probe = 6.71; Predicted Strategy = Response
Real Probe = 6; Real Strategy = Response
9. This procedure was repeated for the group of participants, with the exclusion of a different participant every time. Predicted results for each participant are illustrated in Table 2.
RESULTS
Older adults in the APOE ɛ4 and non-APOE ɛ4 groups did not differ in the number of trials needed to reach criterion on the CSDLT (t (1,59) =0.850; p > 0.05). On average, older adults required 8.68±4.58 trials to learn the task. The proportion of individuals who use spatial and response strategies between APOE ɛ4 allele carriers (spatial: n = 6; response: n = 7) and non-carriers (spatial: n = 20; response: n = 27) was also the same (χ2 = 0.05, p > 0.05). Probe performance also did not differ between the ApoE4 and non-ApoE4 groups (p > 0.05).
We contrasted fMRI BOLD activity, between APOE ɛ4 allele carriers who used a spatial or a response strategy, across all learning trials and found that, as per our hypotheses, those who used a spatial strategy had greater fMRI BOLD activity in both the right and left hippocampus compared to those who used a response strategy (right: t (1,12) = 7.29, p < 0.001, MNI coordinates: x = 24, y = –12, z = –12; left: t (1,12) = 5.53, p < 0.001, MNI coordinates: x = –18, y = –12, z = –18; Fig. 2a). By contrast, those who used a response strategy had greater fMRI BOLD activity in the right caudate nucleus than those who used a spatial strategy (t (1,12) = 4.01, p < 0.001, MNI coordinates: x = 15, y = 12, z = 15; Fig. 2b). Although earlier reports suggested that older adult ɛ4 allele carriers have decreased fMRI BOLD activity in the hippocampus during memory tasks [42], our results demonstrate that this is only true in those who use the response strategy. Those who use a spatial strategy have significantly more fMRI BOLD activity in the hippocampus compared to those who use a response strategy. We performed the same analyses in the non-ɛ4 carriers. Consistent with our earlier findings [16, 21, 23], spatial learners had early fMRI BOLD activity in the hippocampus (t (1,46) = 4.52, p < 0.0005; x = –39, y = –27, z = –15) and response learners had late fMRI BOLD activity in the CN (t (1,46) = 4.03, p < 0.0005; x = –12, y = 7, z = 12). In addition, spatial learners also had late fMRI activity in the CN (t (1,46) = 4.64, p < 0.0001; x = 21, y = –14, z = 24) which we previously reported in young adults who shifted to a response strategy with practice, akin to the development of habits. Importantly, response learners in the non-ɛ4 groups showed no early fMRI activity in the hippocampus, as per our earlier findings. In all older adults, there was significant fMRI BOLD activity in the left caudate nucleus at the end of learning (i.e., during the last experimental trial) compared to the control condition (t = 3.41; p < 0.001; MNI coordinates: x = –12, y = 5.8, z = 8.9). These results are consistent with our earlier findings [23] that showed greater caudate fMRI BOLD activity in late learning in healthy older adults.
Fig.2
BOLD activity and grey matter contrasts between APOE ɛ4 allele carriers who used a spatial strategy and APOE ɛ4 allele carriers who used a response strategy. a) APOE ɛ4 allele carriers who used a spatial strategy (n = 6) have significantly more BOLD activity in the right (t = 7.29; p < 0.001; MNI coordinates: x = 24, y = –12, z = –12) and left (t = 5.53; p < 0.001; MNI coordinates: x = –18, y = –12, z = –18) hippocampus compared to ɛ4 allele carriers who used a response strategy (n = 7) when averaged across all learning trials. b) APOE ɛ4 allele carriers who used a response strategy have significantly more fMRI BOLD activity in the right caudate nucleus (t = 4.01; p < 0.001; MNI coordinates: x = 15, y = 12, z = 15) compared to ɛ4 allele carriers who used a spatial strategy at the end of learning (last experimental trial). c) APOE ɛ4 allele carriers who used a spatial strategy have significantly more grey matter in the entorhinal cortex compared to APOE ɛ4 allele carriers who used a response strategy (t = 8.2; p < 0.001; MNI coordinates: x = 25, y = 0.1, z = –33.4). Results are superimposed onto an average anatomical MRI and displayed in the sagittal and coronal plane. d) There is no difference in levels of entorhinal cortex grey matter between APOE ɛ4 allele carriers who used a spatial strategy and non-ɛ4 allele carriers who used a spatial strategy, suggesting that the APOE ɛ4 carriers who used a spatial strategy have normal levels of grey matter, measured with MRI, throughout the brain. e) APOE ɛ4 allele carriers who used a response strategy have less grey matter in the entorhinal cortex compared to non-ɛ4 allele carriers who used a response strategy (t = 3.34; p < 0.002; MNI coordinates: x = 32, y = –1.8 z = –43.1). These results show that APOE ɛ4 carriers using a response strategy have significant fMRI BOLD activity in the caudate nucleus at a cost for fMRI BOLD activity in the hippocampus, as was found in those using a spatial strategy. Furthermore, these results show that APOE ɛ4 carriers using a response strategy have significantly less grey matter in the entorhinal cortex compared to all other groups.
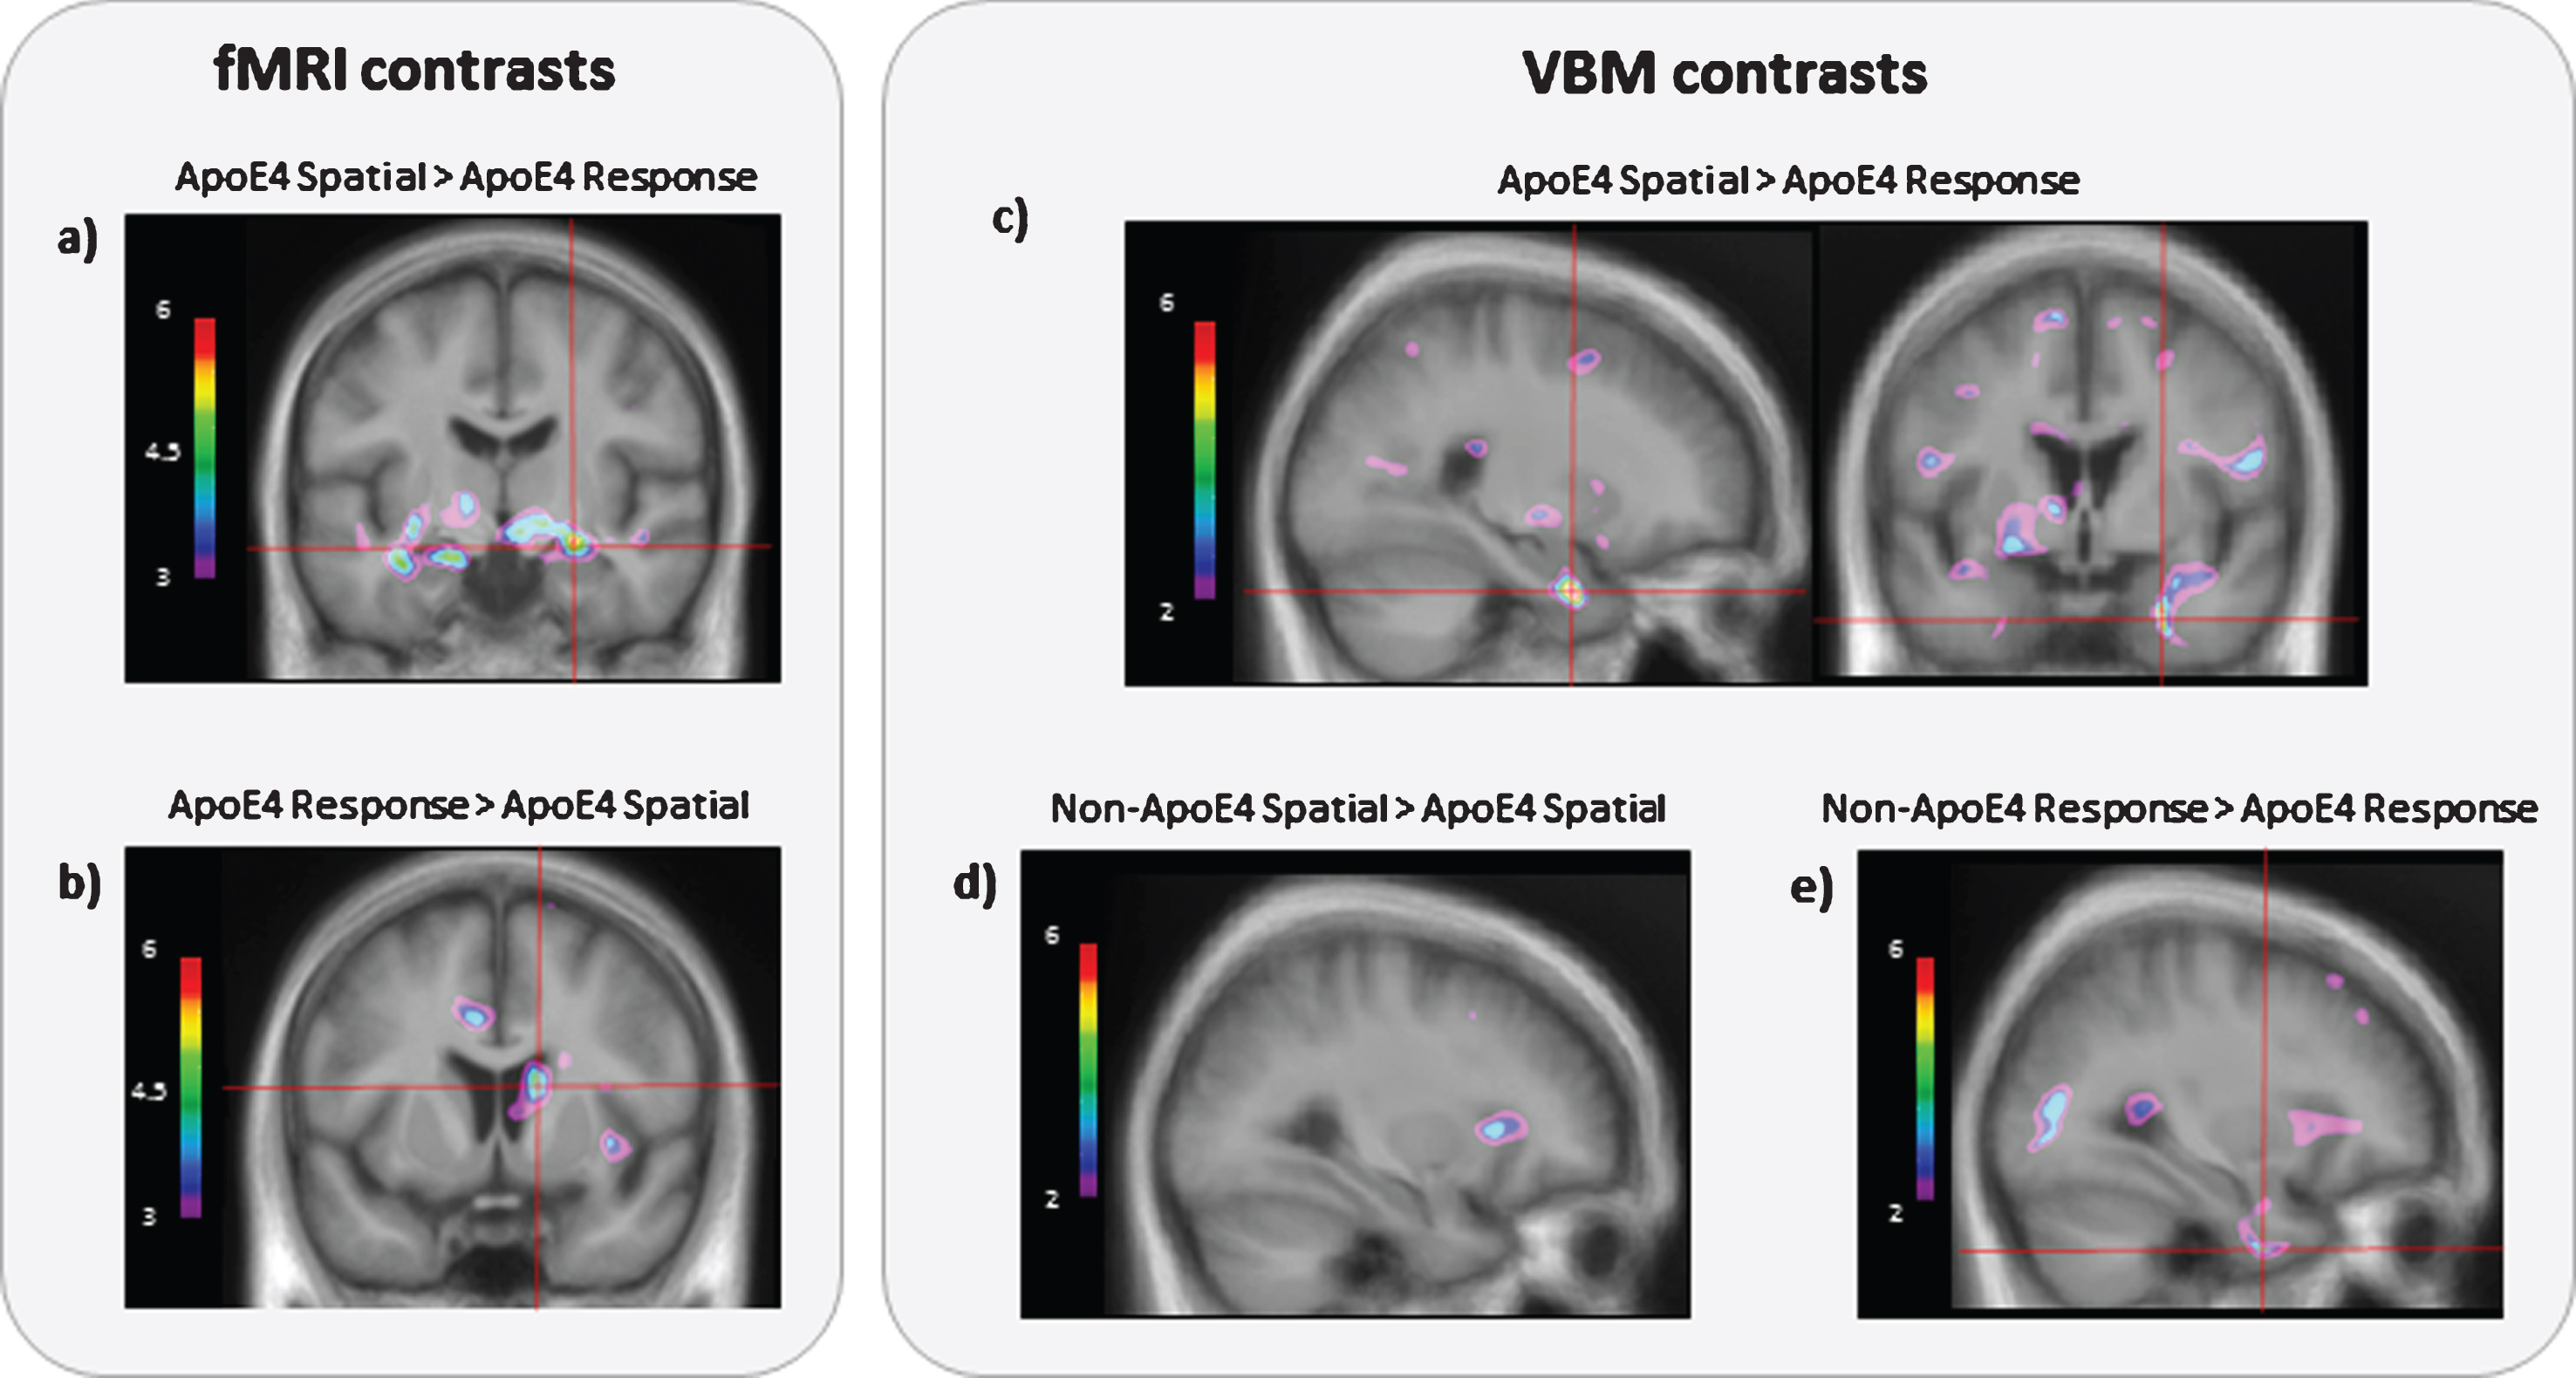
We compared grey matter in APOE ɛ4 allele carriers who used spatial and response strategies and as per our hypotheses, we found that APOE ɛ4 allele carriers who used a response strategy had significantly less grey matter in the right EC than those who used a spatial strategy (t (1,12) = 8.2, p < 0.001, MNI coordinates: x = 25, y = 0.1, z = –33.4; Fig. 2c). We also correlated probe scores against grey matter and found a significant positive correlation in both the left and right EC (right: r = 0.84, p < 0.001, bootstrapping BCa 95% CI [0.60, 0.97], MNI coordinates: x = 26, y = –1.7, z = –33.1; left: r = 0.84, p < 0.001, bootstrapping BCa 95% CI [0.63, 0.95], MNI coordinates: x = –33, y = –14, z = –27.9; Fig. 3a, b). In order to assess whether grey matter levels in APOE ɛ4 allele carriers who use a spatial strategy are normal, we compared them to non-APOE ɛ4 individuals and no differences in grey matter were found (no peaks passed threshold, Fig. 2d). When ɛ4 carriers and non-ɛ4 carriers who used a response strategy were contrasted, we found that ɛ4 carriers had less grey matter in the EC (t (1,33) = 3.34, p < 0.002, MNI coordinates: x = –32, y = –1.8, z = –43.1; Fig. 2e). These results suggest that entorhinal grey matter is reduced specifically in APOE ɛ4 allele carriers who use a response strategy, whereas there is no such reduction in APOE ɛ4 carriers who use a spatial strategy. Instead, APOE ɛ4 carriers who use a spatial strategy and non-APOE ɛ4 carriers have similar levels of grey matter in the EC, hippocampus, and throughout all other brain regions (Fig. 2d).
Fig.3
Structural differences between APOE ɛ4 allele carriers who used a spatial strategy and APOE ɛ4 allele carriers who used a response strategy. Positive correlations between CSDLT spatial strategy probe scores (n = 13) and grey matter in the a) right (r = 0.84; p < 0.001, bootstrapped BCa 95% CI [0.60, 0.97]; MNI coordinates: x = 26, y = –1.7, z = –33.1) and b) left entorhinal cortices (r = 0.84; p < 0.001, bootstrapped BCa 95% CI [0.63, 0.95]; MNI coordinates: x = –33, y = –14, z = –27.9) of APOE ɛ4 allele carriers. In APOE ɛ4 allele carriers, increased use of spatial strategies is associated with increased grey matter in the entorhinal cortex. c) APOE ɛ4 allele carriers who use a spatial strategy (n = 6; mean = 277.00 SEM±7.92) have a larger total hippocampal volume compared to APOE ɛ4 allele carriers who use a response strategy (n = 7; mean = 239.43 SEM±10.18; F = 3.96, p = 0.072, bootstrapped BCa 95% CI [31.17, 946.04]) d) APOE ɛ4 allele carriers who use a spatial strategy (mean = 5448.00 SEM±146.37) also have a larger total fimbria volume compared to APOE ɛ4 allele carriers who use a response strategy (mean = 4962.43 SEM±187.28; F = 8.04, p < 0.05, bootstrapped BCa 95% CI [8.59, 67.01]).
![Structural differences between APOE ɛ4 allele carriers who used a spatial strategy and APOE ɛ4 allele carriers who used a response strategy. Positive correlations between CSDLT spatial strategy probe scores (n = 13) and grey matter in the a) right (r = 0.84; p < 0.001, bootstrapped BCa 95% CI [0.60, 0.97]; MNI coordinates: x = 26, y = –1.7, z = –33.1) and b) left entorhinal cortices (r = 0.84; p < 0.001, bootstrapped BCa 95% CI [0.63, 0.95]; MNI coordinates: x = –33, y = –14, z = –27.9) of APOE ɛ4 allele carriers. In APOE ɛ4 allele carriers, increased use of spatial strategies is associated with increased grey matter in the entorhinal cortex. c) APOE ɛ4 allele carriers who use a spatial strategy (n = 6; mean = 277.00 SEM±7.92) have a larger total hippocampal volume compared to APOE ɛ4 allele carriers who use a response strategy (n = 7; mean = 239.43 SEM±10.18; F = 3.96, p = 0.072, bootstrapped BCa 95% CI [31.17, 946.04]) d) APOE ɛ4 allele carriers who use a spatial strategy (mean = 5448.00 SEM±146.37) also have a larger total fimbria volume compared to APOE ɛ4 allele carriers who use a response strategy (mean = 4962.43 SEM±187.28; F = 8.04, p < 0.05, bootstrapped BCa 95% CI [8.59, 67.01]).](https://content.iospress.com:443/media/jad/2018/61-4/jad-61-4-jad170540/jad-61-jad170540-g003.jpg)
Based on our a priori hypotheses, a region of interest analysis was done on the volume of the hippocampus and surrounding white matter tracts. APOE ɛ4 carriers who use a spatial strategy had significantly more white matter volume in the fimbria (F (1,12) = 8.04, p < 0.05, bootstrapped BCa 95% CI [8.59, 67.01]; Fig. 3d) and have a larger hippocampus (F (1,12) = 3.96, p = 0.072, bootstrapped BCa 95% CI [31.17, 946.04]; Fig. 3c) compared to APOE ɛ4 carriers who use a response strategy.
The two groups, i.e., spatial and response APOE ɛ4 carriers, performed equally on standard neuropsychological tests of verbal memory, such as the Rey Auditory Verbal Learning Test, visuospatial memory, such as the Rey Osterrieth Complex Figure, and executive function, such as the Stroop test and the Digit symbol test (Table 3; all ps > 0.05).
Table 3
Demographics and performance on neuropsychological tests
| APOE-ɛ4 carriers | Non-ɛ4 carriers | ||||
| Spatial | Response | Spatial | Response | ||
| N | 6 | 7 | 20 | 27 | X2 = 0.05,p = 0.82 |
| Age | 65.5±5.1 | 64.9±3.5 | 65.2±4.6 | 67.0±4.3 | F (1, 59) = 0.83, p = 0.37 |
| Sex | 3F:3M | 4F:3M | 11F:9M | 17F:10M | ɛ4: X2 = 0.07, p = 0.80 |
| Non-ɛ4: X2 = 0.30, p = 0.58 | |||||
| Education | 16.8±2.5 | 16.0±3.1 | 17.8±3.4 | 15.8±3.5 | F (1, 59) = 0.30, p = 0.59 |
| MoCA | 27.0±0.9 | 27.6±1.3 | 28.2±1.4 | 27.5±1.8 | F (1, 59) = 1.68, p = 0.20 |
| MMSE | 28.7+2.0 | 29.1±0.4 | 29.0±1.3 | 28.9±1.1 | F (1, 59) = 0.58, p = 0.45 |
| RAVLT {Delayed Recall) | 8.0±3.0 | 10.1±3.6 | 10.1±4.2 | 9.2±3.5 | F (1,59) = 1.65, p = 0.21 |
| ROCF (Delayed Recall) | 20.8±7.1 | 21.1±6.8 | 20.3±5.8 | 16.0±5.0 | F (1,58) = 1–60, p = 0.21 |
| Stroop | 32.2±8.4 | 31.4±8.9 | 28.8±6.2 | 32.2±8.1 | F (1, 58) = 0.77, p = 0.38 |
| Digit symbol | 65.0±15.6 | 61.4±12.2 | 65.7±11.3 | 60.3±12.4 | F (1, 59) = 0.06, p = 0.82 |
Following the results of our VBM study in APOE ɛ4 allele carriers showing a peak in the right and left EC, a region of interest analysis was performed in this region. Probe scores were regressed against grey matter in the EC using VBM. In each VBM analysis, one participant was left out. Each VBM output was examined and peaks in the right and left EC were found. The peak coordinates (MNI coordinates: x, y, z) in the left and right EC were noted and these coordinates were used to extract grey matter values for all participants at those coordinates. Linear regression analyses were performed with the individual grey matter values as the independent variable and the probe scores as the dependent variable (See Methods for Details). The predicted probe score and strategy were compared to the real probe score and strategy of the participant to determine whether grey matter in the EC can predict strategy. Based on our leave-one-out analyses, grey matter in the right and left EC was able to accurately predict the strategy of 92% (12/13) of APOE ɛ4 allele carriers. The predicted probe scores were cross-validated with the actual probe scores (r = 0.839, p < 0.001; bootstrapped BCa 95% CI [0.69, 0.95]). A binomial test was used to test the probability of observing our outcome (12 of 13 accurate predictions) under a “straw man” null model. One sensible null model would be a predictor that chooses the most common label (response strategy) for all predictions. Such a null model would have an accuracy of 54% (7/13). A binomial test with this comparison is significant (p < 0.01), indicating that a null model is by chance unlikely to produce the observed accuracy.
DISCUSSION
To our knowledge, the present study is the first to report functional and structural differences among healthy older APOE ɛ4 allele carriers who use different navigational strategies. Differences were found despite the fact that these individuals are “super healthy”, they have normal memory performance, they are free of numerous imaging confounds, and they have no neurological and psychiatric illnesses including depression, major neurocognitive disorders, and addiction. “Super healthy” spatial and response APOE ɛ4 allele carriers score identically on all standard neuropsychological tests and all navigation tests, with the only exception that response learners used an alternate memory strategy that is not dependent on the hippocampus. Since it is known that the EC and hippocampus are the first regions to show MRI pathology in patients who later get diagnosed with AD [43], the current paper reports a novel method to help identify a cohort of participants who have biomarkers associated with increased risk of AD, years before clinical symptoms. Navigation strategies in conjunction with other AD biomarkers such as APOE genotype may help further identify individuals with increased risk of AD. This task may therefore provide a new method for early detection of individuals at a high risk for AD, thus, potentially improving our capacity to design preventive approaches. Furthermore, in a leave-one-out analysis, grey matter in the EC predicted navigational strategy with 92% accuracy suggesting a tight relationship between these factors in APOE ɛ4 carriers. A prospective study showing that APOE ɛ4 carriers who use response strategies will have significantly higher conversion rates to AD years later, compared to those who use spatial strategies, will help further validate our current findings.
The current results are highly consistent with previous work in navigation strategies. Decades of rodent research has shown evidence that lesions to the hippocampus causes severe spatial memory deficits [19, 44–58]. The role of the caudate nucleus of the striatum in stimulus-response learning was first demonstrated in 1989 and has been reproduced numerous times [18, 19, 49, 54, 59]. In humans, we first demonstrated in Iaria et al. [16] and Bohbot et al. [14] that spatial strategies are associated with increased fMRI BOLD activity and grey matter in the hippocampus in young adults. In contrast, response strategies are associated with increased fMRI BOLD activity and grey matter in the caudate nucleus. In Etchamendy et al. [21], Dahmani & Bohbot [15], Konishi et al. [60], and West et al. [61] these results were replicated in separate cohorts of young adults using different tasks. In older adults, we also found that spatial strategies are associated with increased fMRI BOLD activity [23], grey matter [22], and volume in the hippocampus [62] compared to response strategies. In the current manuscript, we replicate these findings in APOE ɛ4 allele carriers, a population of individuals at increased risk of AD. APOE ɛ4 allele carriers who predominantly use spatial strategies have more fMRI BOLD activity and volume in the hippocampus and more grey matter in the EC compared to APOE ɛ4 allele carriers who predominantly use response strategies. As such, despite the low sample size, the current findings are highly consistent with previous rodent and human work in navigation strategies.
Importantly, the various groups were indistinguishable in all learning and memory performance measures, suggesting that navigational strategies may be key for early detection of AD risk. The current sample represents an asymptomatic population where standard neuropsychological tests are not sensitive to detect cognitive differences associated to the pathology detected in the EC and hippocampus. These results are consistent with the fact that AD-related structural and functional neurodegeneration occurs years before the onset of cognitive impairments [3, 4]. Past studies have shown spatial memory deficits in APOE ɛ4 carriers. Patients with amnestic MCI (aMCI) who are APOE ɛ4 carriers perform significantly worse on spatial memory tasks compared to those who are non-ɛ4 carriers [63–65]. In fact, the APOE ɛ4 aMCI patients performed similar to patients with AD. In these studies, spatial memory was able to distinguish cognitive differences between aMCI patient with and without the ɛ4 allele, even when other neuropsychological tests were not able to distinguish differences. In the current study, we did not observe any behavioral differences between APOE ɛ4 carriers and non-ɛ4 carriers. It is possible that due to our detailed screening procedure we excluded any APOE ɛ4 carriers with cognitive deficits. This is consistent with Adamson et al. [66] who tested cognitively normal older adults on a spatial learning task and found differences in fMRI BOLD activity in the hippocampus between APOE ɛ4 carriers and non-ɛ4 carriers but no cognitive differences. In very cognitive healthy population, it is possible that spatial memory tasks are sensitive to functional and structural differences in the hippocampus, despite no differences in cognitive performance. These studies demonstrate the sensitivity of these task to hippocampal integrity above standard neuropsychological tests.
One possibility is that multiple strategies dependent on different memory systems may compensate for latent memory impairments. For example, in Bohbot et al. [67], patients with brain damage to the hippocampus were not impaired on a virtual navigation task when they employed the caudate nucleus-dependent response strategy, but these patients were impaired when using a hippocampus-dependent spatial strategy. Weniger et al. [68] tested patients with aMCI on two wayfinding tasks in a virtual park and maze and found that patients that later converted to AD had smaller hippocampal volumes compared to non-converters, even though there were no performance differences between the two groups. Weniger et al. [68] did not dissociate navigation strategies, and thus patients with hippocampal atrophy may have used an alternate memory system to solve the task. These studies illustrate the importance of dissociating navigational strategies in order to distinguish hippocampus-dependent memory strategies from alternate mechanisms dependent on the caudate nucleus that could serve to hide an otherwise sub-clinical impairment. As such, navigational strategies could complement the current diagnostic biomarkers available for MCI and AD, and may potentially predict cognitive impairment earlier than standard neuropsychological tests, allowing for early intervention. Furthermore, assessing navigation strategies is a cost-effective and feasible method of assessing risk of AD relative to the currently available brain imaging methods. Navigation strategies may compliment APOE genotyping by further identifying populations at risk, early on in asymptomatic stages. Efforts are currently underway to further validate and automate these task for widespread distribution.
Although causal relationships cannot be drawn from the current findings, it is possible that hippocampal atrophy in response strategy users is the driving cause for decreased fMRI BOLD activity in the hippocampus. However, the opposite may also be true such that decreased use of spatial strategies and thus decreased fMRI BOLD activity in the hippocampus may lead to structural changes. In other words, the decreased fMRI activity in response strategy users may be the consequence of hippocampal atrophy or it may be the cause of hippocampus atrophy. Give that there are genetic and environmental factors such as BDNF genotype [33], stress [69], and repetitive behaviors [70] that promote the use of response strategies, we hypothesize that it is most likely a combination of both.
The current study should be viewed in the light of certain limitations. Studies examining the effects of the ɛ4 allele often suffer from sample size limitations due to the low frequency of the genotype in the general population. Similarly, in the current study, the MRI sample was relatively small and VBM, when applied to small samples sizes can be imprecise. However, despite the low sample size, the VBM results were consistent with other analytical methods including MAGeT (volume) and fMRI, thereby supporting the current findings. Another limitation to note is that although participants were screened and excluded for any pre-existing diagnosis of MCI or AD, this was based on a self-reporting of diagnosis. We did not conduct an extensive neuropsychological assessment of MCI beyond excluding participants who scored below 26 on the MoCA and 27 on the MMSE and as such, it is possible that some participants may exhibit subtle cognitive deficits that may meet criteria for early MCI.
Current results suggest that the use of non-hippocampus dependent strategies that rely on the caudate nucleus may be used at a cost for the hippocampus and EC. Since caudate nucleus-dependent response strategies lead to performance scores that are indistinguishable from hippocampus-dependent strategies, the negative impact may go undetected for many years, thereby placing APOE ɛ4 allele carriers at a greater risk for AD. As such, caution should be exerted when healthy adults with a genetic risk of AD engage in activities that may promote caudate-nucleus dependent strategies [71, 72]. Instead, healthy adults with a genetic risk of AD may benefit from activities that stimulate the hippocampus, such as spatial memory training. These results suggest that strategy assessment may be key to identify mechanisms in participants at risk of AD and discriminate atrophy of the hippocampus and EC among APOE ɛ4 allele carriers. Future studies with a larger sample of APOE ɛ4 allele carriers will need to be conducted in order to confirm the clinical relevance of the current findings.
ACKNOWLEDGMENTS
This work was supported by CIHR Grant no. 86727, 82638, and 301763. We would like to thank Ms. Louisa Dahmani for editorial comments on the manuscript.
Authors’ disclosures available online (https://www.j-alz.com/manuscript-disclosures/17-0540r2).
REFERENCES
[1] | Shaw LM , Korecka M , Clark CM , Lee VM , Trojanowski JQ ((2007) ) Biomarkers of neurodegeneration for diagnosis and monitoring therapeutics. Nat Rev Drug Discov 6: , 295–303. |
[2] | Bateman RJ , Xiong C , Benzinger TL , Fagan AM , Goate A , Fox NC , Marcus DS , Cairns NJ , Xie X , Blazey TM , Holtzman DM , Santacruz A , Buckles V , Oliver A , Moulder K , Aisen PS , Ghetti B , Klunk WE , McDade E , Martins RN , Masters CL , Mayeux R , Ringman JM , Rossor MN , Schofield PR , Sperling RA , Salloway S , Morris JC ((2012) ) Clinical and biomarker changes in dominantly inherited Alzheimer’s disease. N Engl J Med 367: , 795–804. |
[3] | Jagust W , Gitcho A , Sun F , Kuczynski B , Mungas D , Haan M ((2006) ) Brain imaging evidence of preclinical Alzheimer’s disease in normal aging. Ann Neurol 59: , 673–681. |
[4] | Kaye JA , Swihart T , Howieson D , Dame A , Moore MM , Karnos T , Camicioli R , Ball M , Oken B , Sexton G ((1997) ) Volume loss of the hippocampus and temporal lobe in healthy elderly persons destined to develop dementia. Neurology 48: , 1297–1304. |
[5] | Small SA , Tsai WY , DeLaPaz R , Mayeux R , Stern Y ((2002) ) Imaging hippocampal function across the human life span: Is memory decline normal or not? Ann Neurol 51: , 290–295. |
[6] | Stoub TR , Bulgakova M , Leurgans S , Bennett DA , Fleischman D , Turner DA , deToledo-Morrell L ((2005) ) MRI predictors of risk of incident Alzheimer disease: A longitudinal study. Neurology 64: , 1520–1524. |
[7] | Desikan RS , Cabral HJ , Hess CP , Dillon WP , Glastonbury CM , Weiner MW , Schmansky NJ , Greve DN , Salat DH , Buckner RL , Fischl B , Alzheimer’s Disease Neuroimaging I ((2009) ) Automated MRI measures identify individuals with mild cognitive impairment and Alzheimer’s disease. Brain 132: , 2048–2057. |
[8] | Fyhn M , Molden S , Witter MP , Moser EI , Moser MB ((2004) ) Spatial representation in the entorhinal cortex. Science 305: , 1258–1264. |
[9] | O’Keefe J , Dostrovsky J ((1971) ) The hippocampus as a spatial map. Preliminary evidence from unit activity in the freely-moving rat. Brain Res 34: , 171–175. |
[10] | O’Keefe J , Nadel L ((1978) ) The Hippocampus as a Cognitive Map, Clarendon Press, Oxford. |
[11] | Sargolini F , Fyhn M , Hafting T , McNaughton BL , Witter MP , Moser MB , Moser EI ((2006) ) Conjunctive representation of position, direction, and velocity in entorhinal cortex. Science 312: , 758–762. |
[12] | Bohbot VD , Jech R , Bures J , Nadel L , Ruzicka E ((1997) ) Spatial and nonspatial memory involvement in myasthenia gravis. J Neurol 244: , 529–532. |
[13] | Bohbot VD , Iaria G , Petrides M ((2004) ) Hippocampal function and spatial memory: Evidence from functional neuroimaging in healthy participants and performance of patients with medial temporal lobe resections. Neuropsychology 18: , 418–425. |
[14] | Bohbot VD , Lerch J , Thorndycraft B , Iaria G , Zijdenbos AP ((2007) ) Gray matter differences correlate with spontaneous strategies in a human virtual navigation task. J Neurosci 27: , 10078–10083. |
[15] | Dahmani L , Bohbot VD ((2015) ) Dissociable contributions of the prefrontal cortex to hippocampus- and caudate nucleus-dependent virtual navigation strategies. Neurobiol Learn Mem 117: , 42–50. |
[16] | Iaria G , Petrides M , Dagher A , Pike B , Bohbot VD ((2003) ) Cognitive strategies dependent on the hippocampus and caudate nucleus in human navigation: Variability and change with practice. J Neurosci 23: , 5945–5952. |
[17] | Klein DA , Steinberg M , Galik E , Steele C , Sheppard JM , Warren A , Rosenblatt A , Lyketsos CG ((1999) ) Wandering behaviour in community-residing persons with dementia. Int J Geriatr Psychiatry 14: , 272–279. |
[18] | White NM , McDonald RJ ((2002) ) Multiple parallel memory systems in the brain of the rat. Neurobiol Learn Mem 77: , 125–184. |
[19] | Packard MG , Hirsh R , White NM ((1989) ) Differential effects of fornix and caudate nucleus lesions on two radial maze tasks: Evidence for multiple memory systems. J Neurosci 9: , 1465–1472. |
[20] | Bohbot VD , McKenzie S , Konishi K , Fouquet C , Kurdi V , Schachar R , Boivin M , Robaey P ((2012) ) Virtual navigation strategies from childhood to senescence: Evidence for changes across the life span. Front Aging Neurosci 4: , 28. |
[21] | Etchamendy N , Konishi K , Pike GB , Marighetto A , Bohbot VD ((2012) ) Evidence for a virtual human analog of a rodent relational memory task: A study of aging and fMRI in young adults. Hippocampus 22: , 869–880. |
[22] | Konishi K , Bohbot VD ((2013) ) Spatial navigational strategies correlate with gray matter in the hippocampus of healthy older adults tested in a virtual maze. Front Aging Neurosci 5: , 1. |
[23] | Konishi K , Etchamendy N , Roy S , Marighetto A , Rajah N , Bohbot VD ((2013) ) Decreased functional magnetic resonance imaging activity in the hippocampus in favor of the caudate nucleus in older adults tested in a virtual navigation task. Hippocampus 23: , 1005–1014. |
[24] | Bertram L , Tanzi RE ((2012) ) The genetics of Alzheimer’s disease. Prog Mol Biol Transl Sci 107: , 79–100. |
[25] | Farrer LA , Cupples LA , Haines JL , Hyman B , Kukull WA , Mayeux R , Myers RH , Pericak-Vance MA , Risch N , van Duijn CM ((1997) ) Effects of age, sex, and ethnicity on the association between apolipoprotein E genotype and Alzheimer disease. A meta-analysis. APOE and Alzheimer Disease Meta Analysis Consortium. JAMA 278: , 1349–1356. |
[26] | Nasreddine ZS , Phillips NA , Bedirian V , Charbonneau S , Whitehead V , Collin I , Cummings JL , Chertkow H ((2005) ) The Montreal Cognitive Assessment, MoCA: A brief screening tool for mild cognitive impairment. J Am Geriatr Soc 53: , 695–699. |
[27] | Folstein MF , Folstein SE , McHugh PR ((1975) ) “Mini-mental state”. A practical method for grading the cognitive state of patients for the clinician. J Psychiatr Res 12: , 189–198. |
[28] | Rey A ((1964) ) L’examen clinique en psychologie. Presses Universitaires de France, Paris. |
[29] | Osterrieth PA ((1944) ) Le test de copie d’une figure complexe. Arch Psychol 30: , 206–356. |
[30] | Stroop JR ((1935) ) Studies of interference in serial verbal reactions. J Exp Psychol 18: , 643–662. |
[31] | Wechsler DA ((1955) ) Wechsler Adult Intelligence Scale, Psychological Corporation, New York. |
[32] | Marighetto A , Etchamendy N , Touzani K , Torrea CC , Yee BK , Rawlins JN , Jaffard R ((1999) ) Knowing which and knowing what: A potential mouse model for age-related human declarative memory decline. Eur J Neurosci 11: , 3312–3322. |
[33] | Banner H , Bhat V , Etchamendy N , Joober R , Bohbot VD ((2011) ) The brain-derived neurotrophic factor Val66Met polymorphism is associated with reduced functional magnetic resonance imaging activity in the hippocampus and increased use of caudate nucleus-dependent strategies in a human virtual navigation task. Eur J Neurosci 33: , 968–977. |
[34] | Talairach J , Tournoux P ((1988) ) Co-planar stereotaxic atlas of the human brain. Thieme, New York. |
[35] | Sled JG , Zijdenbos AP , Evans AC ((1998) ) A nonparametric method for automatic correction of intensity nonuniformity in MRI data. IEEE Trans Med Imaging 17: , 87–97. |
[36] | Zijdenbos AP , Forghani R , Evans AC ((2002) ) Automatic “pipeline” analysis of 3-D MRI data for clinical trials: Application to multiple sclerosis. IEEE Trans Med Imaging 21: , 1280–1291. |
[37] | Chakravarty MM , Steadman P , van Eede MC , Calcott RD , Gu V , Shaw P , Raznahan A , Collins DL , Lerch JP ((2013) ) Performing label-fusion-based segmentation using multiple automatically generated templates. Hum Brain Mapp 34: , 2635–2654. |
[38] | Pipitone J , Park MT , Winterburn J , Lett TA , Lerch JP , Pruessner JC , Lepage M , Voineskos AN , Chakravarty MM , Alzheimer’s Disease Neuroimaging Initiative ((2014) ) Multi-atlas segmentation of the whole hippocampus and subfields using multiple automatically generated templates. Neuroimage 101: , 494–512. |
[39] | Tustison NJ , Avants BB , Cook PA , Zheng Y , Egan A , Yushkevich PA , Gee JC ((2010) ) N4ITK: Improved N3 bias correction. IEEE Trans Med Imaging 29: , 1310–1320. |
[40] | Winterburn JL , Pruessner JC , Chavez S , Schira MM , Lobaugh NJ , Voineskos AN , Chakravarty MM ((2013) ) A novel in vivo atlas of human hippocampal subfields using high-resolution 3 T magnetic resonance imaging. Neuroimage 74: , 254–265. |
[41] | Avants BB , Epstein CL , Grossman M , Gee JC ((2008) ) Symmetric diffeomorphic image registration with cross-correlation: Evaluating automated labeling of elderly and neurodegenerative brain. Med Image Anal 12: , 26–41. |
[42] | Filippini N , Ebmeier KP , MacIntosh BJ , Trachtenberg AJ , Frisoni GB , Wilcock GK , Beckmann CF , Smith SM , Matthews PM , Mackay CE ((2011) ) Differential effects of the APOE genotype on brain function across the lifespan. Neuroimage 54: , 602–610. |
[43] | Braak H , Braak E ((1991) ) Neuropathological stageing of Alzheimer-related changes. Acta Neuropathol 82: , 239–259. |
[44] | Walker JA , Olton DS ((1979) ) Spatial memory deficit following fimbria-fornix lesions: Independent of time for stimulus processing. Physiol Behav 23: , 11–15. |
[45] | Morris RGM ((1981) ) Spatial localization does not require the presence of local cues. Learn Motiv 12: , 239–260. |
[46] | Cho YH , Jaffard R ((1995) ) Spatial location learning in mice with ibotenate lesions of entorhinal cortex or subiculum. Neurobiol Learn Mem 64: , 285–290. |
[47] | Handelmann GE , Olton DS ((1981) ) Spatial memory following damage to hippocampal CA3 pyramidal cells with kainic acid: Impairment and recovery with preoperative training. Brain Res 217: , 41–58. |
[48] | Jacobson TK , Gruenbaum BF , Markus EJ ((2012) ) Extensive training and hippocampus or striatum lesions: Effect on place and response strategies. Physiol Behav 105: , 645–652. |
[49] | McDonald RJ , White NM ((1993) ) A triple dissociation of memory systems: Hippocampus, amygdala, and dorsal striatum. Behav Neurosci 107: , 3–22. |
[50] | McDonald RJ , White NM ((1994) ) Parallel information processing in the water maze: Evidence for independent memory systems involving dorsal striatum and hippocampus. Behav Neural Biol 61: , 260–270. |
[51] | Meck WH , Church RM , Olton DS ((1984) ) Hippocampus, time, and memory. Behav Neurosci 98: , 3–22. |
[52] | Murray EA , Baxter MG , Gaffan D ((1998) ) Monkeys with rhinal cortex damage or neurotoxic hippocampal lesions are impaired on spatial scene learning and object reversals. Behav Neurosci 112: , 1291–1303. |
[53] | Murray EA , Mishkin M ((1998) ) Object recognition and location memory in monkeys with excitotoxic lesions of the amygdala and hippocampus. J Neurosci 18: , 6568–6582. |
[54] | Packard MG , McGaugh JL ((1992) ) Double dissociation of fornix and caudate nucleus lesions on acquisition of two water maze tasks: Further evidence for multiple memory systems. Behav Neurosci 106: , 439–446. |
[55] | Praag H , Dreyfus CF , Black IB ((1994) ) Dissociation of motor hyperactivity and spatial memory deficits by selective hippocampal lesions in the neonatal rat. J Cogn Neurosci 6: , 321–331. |
[56] | Steffenach HA , Sloviter RS , Moser EI , Moser MB ((2002) ) Impaired retention of spatial memory after transection of longitudinally oriented axons of hippocampal CA3 pyramidal cells. Proc Natl Acad Sci U S A 99: , 3194–3198. |
[57] | Stubley-Weatherly L , Harding JW , Wright JW ((1996) ) Effects of discrete kainic acid-induced hippocampal lesions on spatial and contextual learning and memory in rats. Brain Res 716: , 29–38. |
[58] | van Praag H , Qu PM , Elliott RC , Wu H , Dreyfus CF , Black IB ((1998) ) Unilateral hippocampal lesions in newborn and adult rats: Effects on spatial memory and BDNF gene expression. Behav Brain Res 92: , 21–30. |
[59] | Packard MG , McGaugh JL ((1996) ) Inactivation of hippocampus or caudate nucleus with lidocaine differentially affects expression of place and response learning. Neurobiol Learn Mem 65: , 65–72. |
[60] | Konishi K , Bhat V , Banner H , Poirier J , Joober R , Bohbot VD ((2016) ) APOE2 Is Associated with spatial navigational strategies and increased gray matter in the hippocampus. Front Hum Neurosci 10: , 349. |
[61] | West GL , Konishi K , Diarra M , Benady-Chorney J , Drisdelle BL , Dahmani L , Sodums DJ , Lepore F , Jolicoeur P , Bohbot VD ((2017) ) Impact of video games on plasticity of the hippocampus.. Mol Psychiatry. doi: 10.1038/mp.2017.155 |
[62] | Konishi K , McKenzie S , Etchamendy N , Roy S , Bohbot VD ((2017) ) Hippocampus-dependent spatial learning is associated with higher global cognition among healthy older adults. Neuropsychologia 106: , 310–321. |
[63] | Laczo J , Andel R , Vlcek K , Macoska V , Vyhnalek M , Tolar M , Bojar M , Hort J ((2011) ) Spatial navigation and APOE in amnestic mild cognitive impairment. Neurodegener Dis 8: , 169–177. |
[64] | Laczo J , Andel R , Vyhnalek M , Vlcek K , Magerova H , Varjassyova A , Tolar M , Hort J ((2010) ) Human analogue of the morris water maze for testing subjects at risk of Alzheimer’s disease. Neurodegener Dis 7: , 148–152. |
[65] | Laczo J , Andel R , Vyhnalek M , Vlcek K , Nedelska Z , Matoska V , Gazova I , Mokrisova I , Sheardova K , Hort J ((2014) ) APOE and spatial navigation in amnestic MCI: Results from a computer-based test. Neuropsychology 28: , 676–684. |
[66] | Adamson MM , Hutchinson JB , Shelton AL , Wagner AD , Taylor JL ((2011) ) Reduced hippocampal activity during encoding in cognitively normal adults carrying the APOE varepsilon4 allele. Neuropsychologia 49: , 2448–2455. |
[67] | Bohbot VD , Kalina M , Stepankova K , Spackova N , Petrides M , Nadel L ((1998) ) Spatial memory deficits in patients with lesions to the right hippocampus and to the right parahippocampal cortex. Neuropsychologia 36: , 1217–1238. |
[68] | Weniger G , Ruhleder M , Lange C , Wolf S , Irle E ((2011) ) Egocentric and allocentric memory as assessed by virtual reality in individuals with amnestic mild cognitive impairment. Neuropsychologia 49: , 518–527. |
[69] | Schwabe L , Dalm S , Schachinger H , Oitzl MS ((2008) ) Chronic stress modulates the use of spatial and stimulus-response learning strategies in mice and man. Neurobiol Learn Mem 90: , 495–503. |
[70] | Iaria G , Petrides M , Dagher A , Pike B , Bohbot VD ((2003) ) Cognitive strategies dependent on the hippocampus and caudate nucleus in human navigation: Variability and change with practice. J Neurosci 23: , 5945–5952. |
[71] | Bohbot VD , Del Balso D , Conrad K , Konishi K , Leyton M ((2013) ) Caudate nucleus-dependent navigational strategies are associated with increased use of addictive drugs. Hippocampus 23: , 973–984. |
[72] | West GL , Drisdelle BL , Konishi K , Jackson J , Jolicoeur P , Bohbot VD ((2015) ) Habitual action video game playing is associated with caudate nucleus-dependent navigational strategies. Proc Biol Sci 282: , 20142952. |

