
Family History of Alzheimer’s Disease is Associated with Impaired Perceptual Discrimination of Novel Objects
Abstract
Early detection may be the key to developing therapies that will combat Alzheimer’s disease (AD). It has been consistently demonstrated that one of the main pathologies of AD, tau, is present in the brain decades before a clinical diagnosis. Tau pathology follows a stereotypical route through the medial temporal lobe beginning in the entorhinal and perirhinal cortices. If early pathology leads to very subtle changes in behavior, it may be possible to detect these changes in subjects years before a clinical diagnosis can currently be made. We aimed to discover if cognitively normal middle-aged adults (40–60 years old) at increased risk for AD due to family history would have impaired performance on a cognitive task known to challenge the perirhinal cortex. Using an oddity detection task, we found that subjects with a family history of AD had lowered accuracy without demonstrating differences in rate of acquisition. There were no differences between subjects’ medial temporal lobe volume or cortical thickness, indicating that the changes in behavior were not due to significant atrophy. These results demonstrate that subtle changes in perceptual processing are detectable years before a typical diagnosis even when there are no differences detectable in structural imaging data. Anatomically-targeted cognitive testing may be useful in identifying subjects in the earliest stages of AD.
INTRODUCTION
Alzheimer’s disease (AD) is a neurodegenerative disorder that irreversibly impairs cognitive processes, most notably in the domain of memory. AD is the most common form of dementia, accounting for an estimated 60–80% of all dementia cases [1]. While there are drugs on the market that may temporarily ameliorate the symptoms of AD, there are currently no treatments that will significantly delay, halt, or reverse the disease course. A major difficulty facing the development and application of disease modifying therapies is that the cascade of early physiological changes that precede clinical symptoms have not yet been definitively identified [2]. If the earliest pathological changes were to be detected in humans, potential therapeutic targets could be identified and biomarkers could be established to identify patients before the disease becomes irreversible.
There are two pathological hallmarks of AD: amyloid-β neuritic plaques and tau neurofibrillary tangles [3]. Of the two factors, levels of tau pathology are known to correlate strongly with changes in cognitive function [3]. We propose that it may be possible to detect subtle, but specific, changes to cognitive processes mediated by areas known to exhibit early tau pathology. Previous studies have shown that tau is present in healthy human brains beginning as early as 20 years of age [4]. The development of tau follows a stereotypical route through the brain, beginning in the entorhinal and perirhinal cortices (ERC and PRC, respectively), before entering the hippocampus [5].
Numerous avenues of research have indicated that medial temporal lobe areas such as the ERC and PRC sit at the junction of the ventral visual stream and memory areas and may play a role in both visual representation and memory [6, 7]. The perceptual mnemonic/feature conjunction model of Bussey and Saksida suggests that the PRC is critical for combining complex features of an object into a unified representation, and any PRC abnormalities would result in difficulty distinguishing complex objects while leaving memory and lower level visual processes relatively intact [8].
Previous research has demonstrated that AD pathology spares the primary visual areas until advanced stages of the disease, and AD patients do not show an impairment in most basic visual processes such as visual acuity or color recognition [9]. Due to early pathology in the medial temporal lobe (MTL), we believe that in the initial stages of AD, patients have difficulty with complex visual tasks such as differentiating visually similar objects. This would manifest as impairments that are subtle, but may result in confusion over medications, landmarks, and everyday objects. Visual object processing has also been shown to correlate with instrumental activities of daily living, indicating its importance for maintaining independence in patients [10]. Anecdotal evidence from our laboratory lends support to this theory. For example, the husband of a patient in the Vanderbilt Memory Disorders Clinic reported that his spouse had difficulty remembering the location in which she parked the car on a recent trip to the grocery store. The patient argued that she did not have difficulty remembering where she parked, but she could not identify her car because all of the cars looked very similar to hers. This case demonstrates the necessity of complex object discrimination in dailylife.
Methods are being developed to visualize tau pathology using positron emission tomography (PET); however, this method involves the use of radiation, is expensive, and is not available at all sites. If tau pathology is present in the PRC decades before a diagnosis, it may be possible to use anatomically targeted cognitive testing to identify subjects who will go on to develop AD in the future. One way to probe the function of the PRC is a task known as oddity detection [6]. In this task, subjects are asked to identify the “odd man out” from several perceptually similar items. Previous work has shown that damage to the PRC results in a reduced ability to distinguish similar complex objects, while damage to the hippocampus results in a reduced ability to distinguish similar scenes [7, 11]. This deficit is particularly notable when the objects to be compared contain a high degree of feature ambiguity, and when subjects are shown unfamiliar objects such as Greebles [6].
We aimed to determine whether it was possible to use the oddity detection task to identify subtle cognitive changes in healthy middle aged (40–60 years old) subjects at increased risk for AD due to first-degree family history. We did not anticipate that subjects in this age group would exhibit overt tissue atrophy. To confirm this, we performed structural magnetic resonance imaging (MRI) and analyzed brain volumes and cortical thicknesses in medial temporal lobe structures. Because the PRC is associated with the comparison of features within a single item [7, 8, 12], we hypothesized that at-risk subjects would be impaired at distinguishing perceptually similar stimuli featuring a single object (faces, familiar objects, and Greebles) compared to controls. We did not anticipate a difference between subject groups in distinguishing scenes because scene processing involves the hippocampus, and we did not expect that cognitively intact subjects in this age group would have hippocampal pathology. If a significant difference was found between the at-risk group and the control group, it would indicate that early AD pathology may indeed be affecting cognition in a subtle, yet detectable way.
METHODS
Subjects
All subjects provided informed, written consent in accordance with the Vanderbilt University Institutional Review Board. Middle-aged subjects (40–60 years) were recruited from the community and were considered at risk for AD if they had at least one biological parent who had been diagnosed with the disease. Subjects were asked to provide the age of onset of their parent’s symptoms. Subjects were excluded from the study if they reported a history of alcohol or drug abuse, cerebrovascular disease, traumatic brain damage, any neurological disease, colorblindness, uncorrected vision (<20/30), uncorrected hearing loss, or if they were unable to undergo MRI due to implanted metal devices or a history of claustrophobia.
Apolipoprotein E carrier status
Apolipoprotein E ɛ4 (ApoE4) is the most common risk gene for AD [13] and we anticipated that the at-risk group would have more carriers of ApoE4 than the control group. Subjects were genotyped for carrier status of ApoE (2, 3, 4). Buccal cells were collected from each subject (Oragene Discover OGR-500 kit, DNA Genotek Inc., Ottowa, ON, Canada) and DNA was isolated and genotyped by Vanderbilt Technologies for Advanced Genomics Subjects using Applied Biosystems Taqman 7900 HT Instrument (Life Technologies, Grand Island, NY, USA) with primers to rs7412 and rs429358.
Neuropsychological testing
To ensure that subjects did not demonstrate overt cognitive dysfunction, we performed a comprehensive battery of neuropsychological tests including: Mini-Mental State Exam (MMSE), Delis Kaplan Executive Function System (DKEFS) Logical Memory Test Immediate Recall (LM-I), Delayed Recall (LM-D), and Recognition (LM-R), Rey-Osterrieth Visual Figure Test Copy (REYO-C), Immediate Recall (REYO-I), and Delayed Recall (REYO-D), DKEFS Verbal Fluency (FAS), DKEFS Semantic Fluency (CAT), the Consortium to Establish a Registry for Alzheimer’s Disease (CERAD) Word List Learning Immediate Recall (CERAD-I), Delayed Recall (CERAD-D), and Recognition (CERAD-R), Benton Judgment of Line Orientation (JLO), Boston Naming Test (BNT), and the Beck Depression Inventory (BDI). Any subject that scored >1.5 standard deviations below normative means on any neuropsychological tests was removed from the study.
Oddity detection task
Participants’ primary task was to identify the “odd man out” of four visually similar items, i.e., the one item (target) that was different from the other three (foils). Four sets of stimuli were used for this task: faces, objects, Greebles, and scenes. The faces, objects, and Greebles were drawn from the TarrLab database (courtesy of Michael J. Tarr, Center for the Neural Basis of Cognition and Department of Psychology, Carnegie Mellon University, http://www.tarrlab.org/. Funding provided by NSF award 0339122.) Additional objects were drawn from the Amsterdam Library of Object Images [14]. Scene stimuli were photographs taken by the authors (RJM, PCK) in the Nashville area.
The stimuli for each category were organized into pairs according to visual similarity with one member of the pair acting as the target item and the second member acting as the foil. The use of each pair member as the target stimulus was counterbalanced across participants. For faces, objects, and scenes, visual similarity was subjectively judged by the authors and the foil was presented from three different viewpoints. The Greeble pairs were members of the same ‘family’ and ‘gender’, and each target Greeble was presented with three rotations of the foil Greeble on each trial (see Fig. 1). Rotations were randomly assigned as 0°, 90°, 180°, or 270°, with a unique rotation for each of the four Greebles within a single trial. All stimuli images were scaled to 300×300 pixels. While all stimuli sets had different viewpoints of the images, only the Greeble stimuli wereinverted.
Fig.1
Example of different stimulus types during the oddity detection task. Subjects were asked to state the number below the item that was different from the other three. In this example, the correct answer for the objects example is 4, the correct answer for the faces example is 1, the correct answer for the scenes example is 3, and the correct answer for the Greebles example is 3.
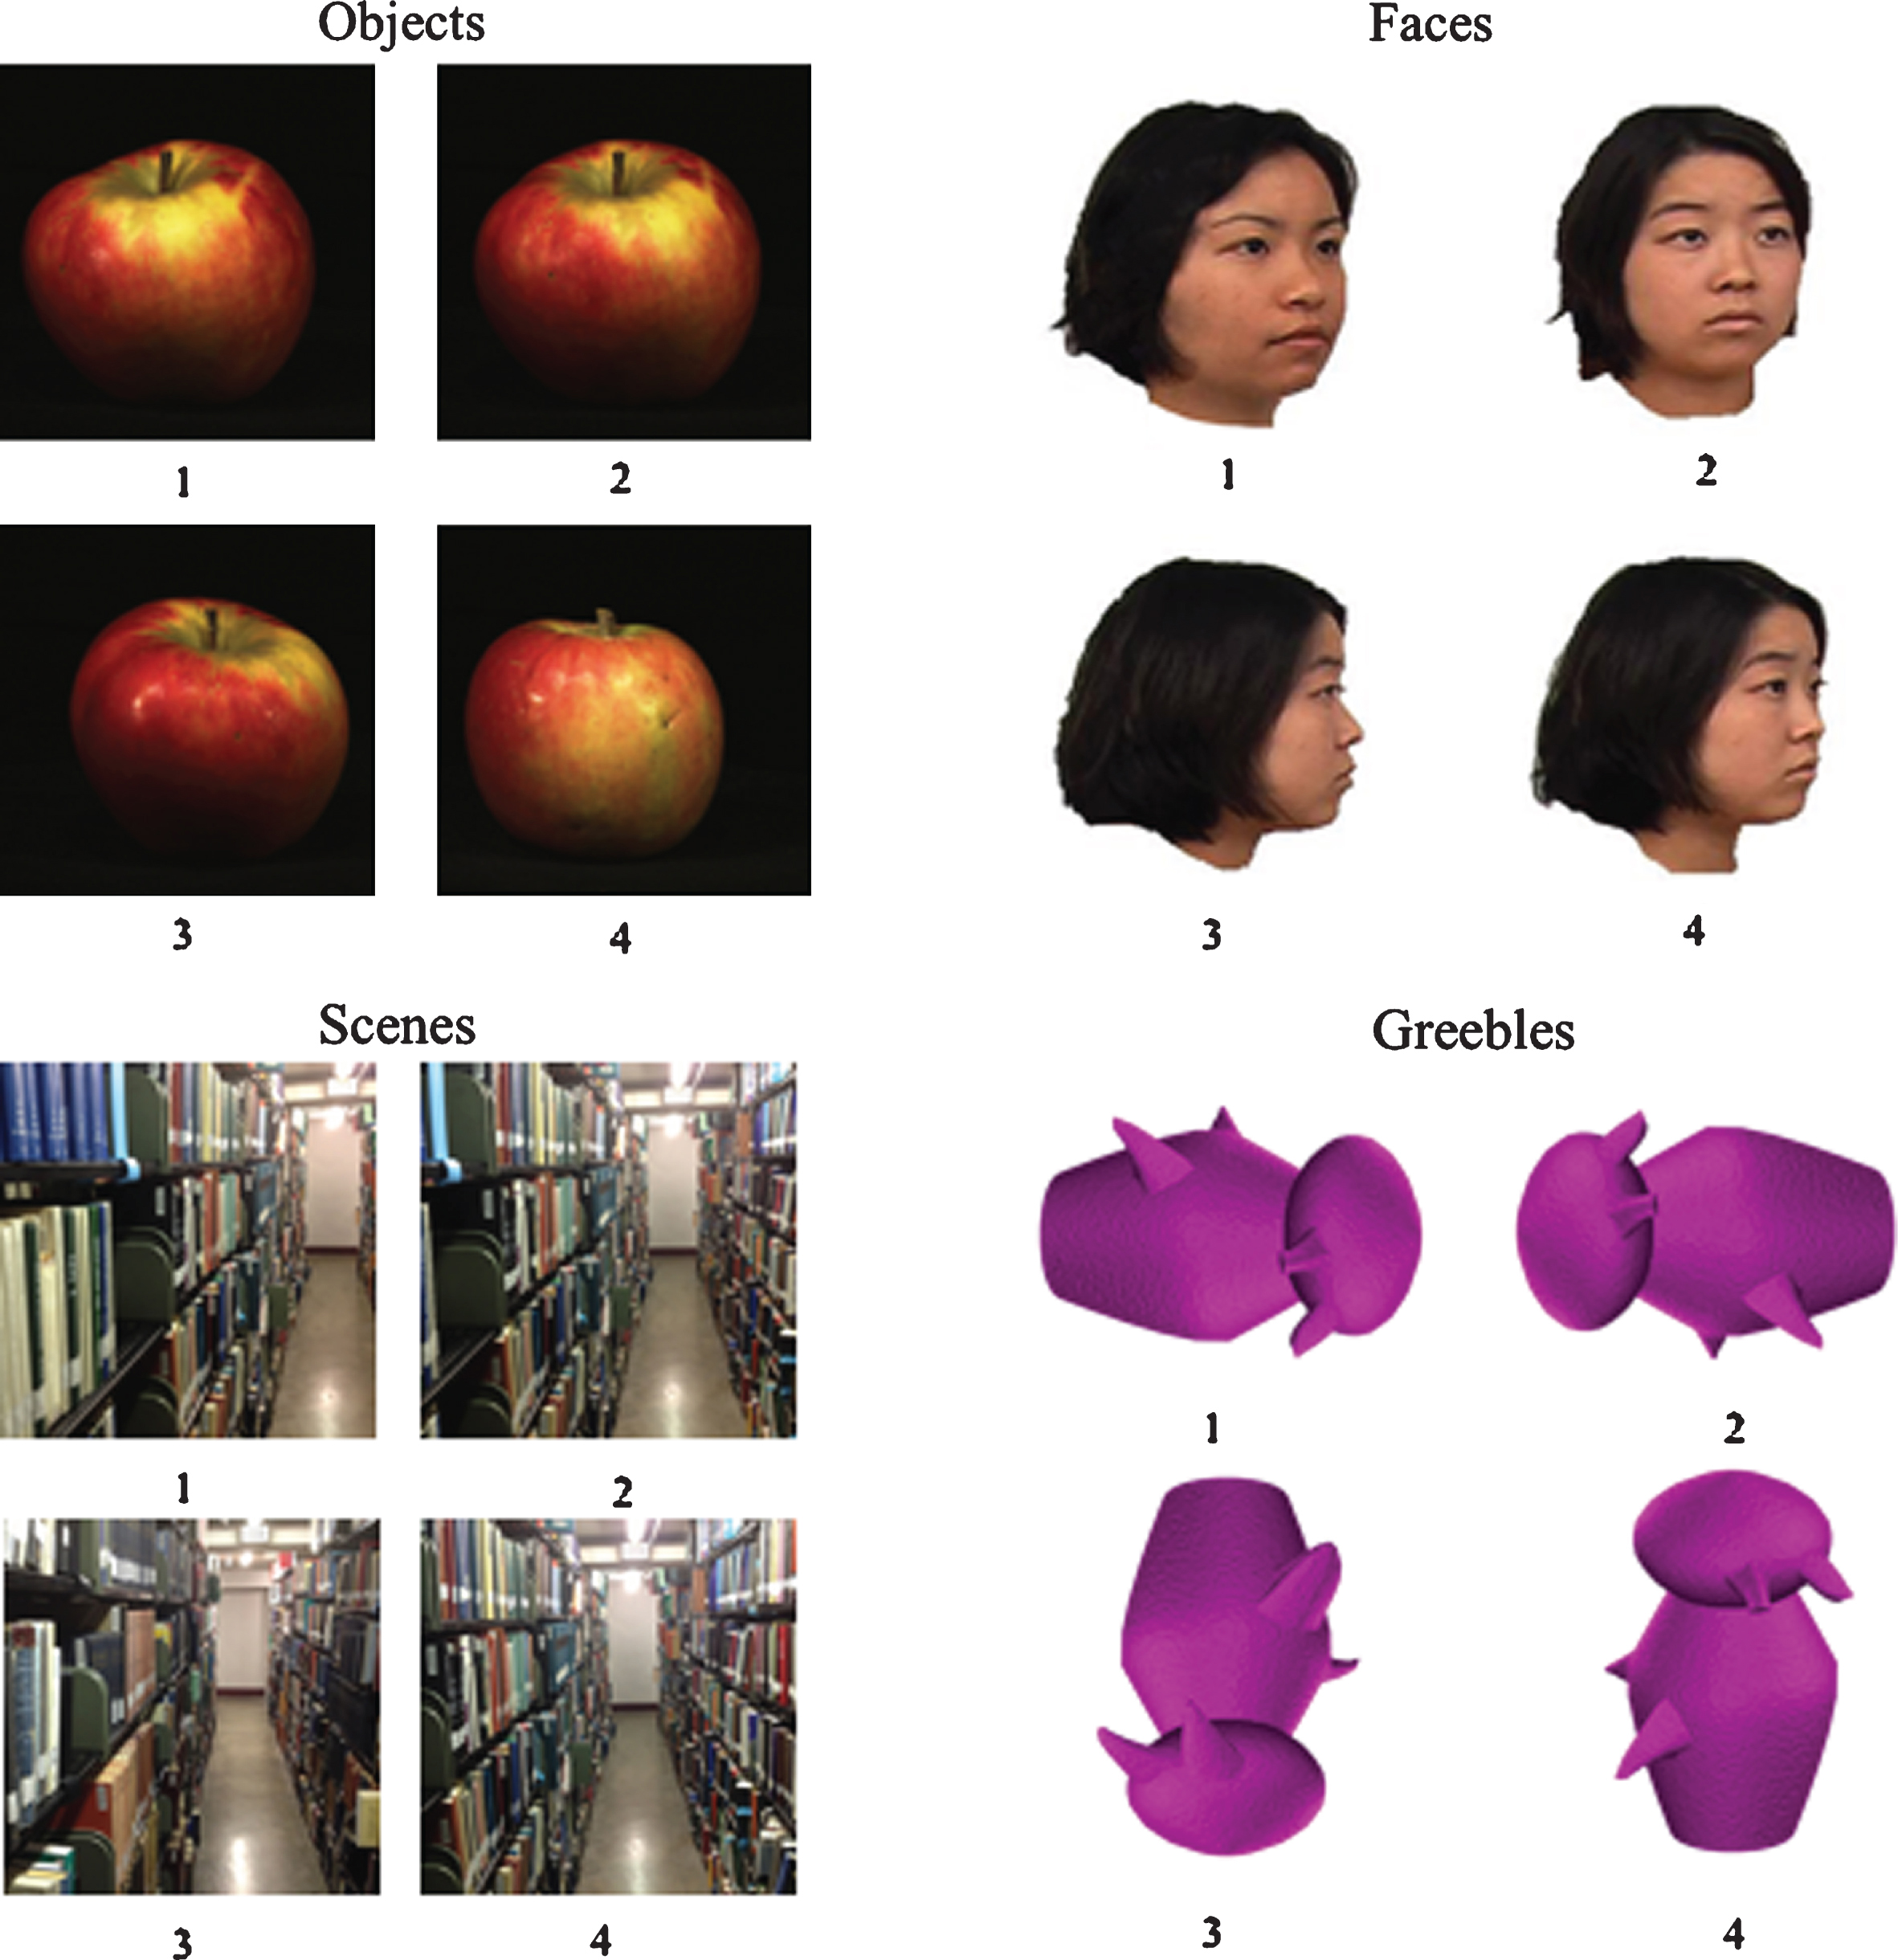
The on-screen position of the target item was randomized for each trial. Beneath each item was a digit (1, 2, 3, or 4) (see Fig. 1). Participants verbally reported the digit that corresponded to the item they believed to be the target to the experimenter, who then entered the response. Due to the nature of a perceptual discrimination task, subjects were told to emphasize accuracy over speed. There were no response time limits, and stimuli remained onscreen until the participant made a decision. After a response, the next set of stimuli were displayed on the screen. Participants performed four blocks each consisting of a different stimulus set. For faces and Greebles, there were 32 trials per block and for objects and scenes there were 28 trials per block. The order of the blocks was partially counterbalanced across participants using a balanced Latin Square routine [15].
The stimuli were displayed on a flat screen monitor (1024×768 pixel resolution, 75 Hz refresh rate) using Experiment Builder (SR Research Ltd.). Participants were seated comfortably in a chair with their heads on a chin rest that was positioned such that their eyes were approximately 57 cm away from the monitor. The stimuli were 300×300 pixels (roughly 13 cm, 13° visual angle).
MRI acquisition
All neuroimaging was performed at 3T (Philips Achieva, Best, The Netherlands) using a 32-channel receive array head coil and a body coil for radiofrequency transmission. For volumetric calculations, a T1-weighted image was acquired (MPRAGE, TE = 3.7, TR = 8 ms, spatial resolution = 1×1×1 mm3).
Volumetric and cortical thickness analysis
The volume of the PRC, ERC, and hippocampus, and the cortical thickness of the PRC and ERC were calculated using FreeSurfer (version 5.3.0). FreeSurfer methods for segmentation of brain volumes have been previously described [16–28]. ROIs were chosen based on regions that are known to show the earliest AD pathology. All ROIs were defined using atlases implemented in FreeSurfer. Left and right hippocampal volumes were defined using the automated segmentation routine, left and right entorhinal volumes and cortical thickness were parcellated using the Desikan-Killiany Atlas [29], and left and right PRC volumes and cortical thickness were parcellated using the ex vivo Broadmann Area Atlas [30]. It is worth noting that the Broadmann Area Atlas defines the PRC as BA35, however the PRC may include BA35 and BA36. Additionally, BA35 overlaps with the transentorhinal cortex which, as previously mentioned, is the first region to show the accumulation of tau pathology [4]. Volumes were normalized by total brainvolume.
Statistics
Statistical analysis was performed using IBM SPSS Statistics Version 22 (IBM Corporation Amonk, NY, USA) Specific statistical tests are explained in detail in the results section. Statistical significance was defined as α ≤ 0.05.
RESULTS
Subjects
A total of 34 subjects with a family history of AD (at-risk) and 23 subjects with no family history of AD (control) completed the study. Subjects were matched on age, sex, race, and education (Table 1). It should be noted that at-risk subjects trended toward higher education than control subjects (p = 0.054). The average parental age of onset of symptoms for the at-risk group was 70.5 years. As expected, the at-risk group had more ApoE4 carriers than the control group (p = 0.002). No differences in neuropsychological testing, oddity detection, or neuroimaging were found between ApoE4 carriers andnon-carriers.
Table 1
Demographic data. Subjects were matched on age, sex, education, apolipoprotein E epsilon 4 carrier status, and race. To quantify cardiovascular risk factors, body mass index was calculated for each subject and subjects were asked to report how often they exercise, their history of heart disease, sleep apnea, and diabetes, if they were currently smoking, and if they had ever smoked regularly (*p < 0.05)
| Family History (n = 34) | No Family History (n = 23) | Significance | |
| Age±SD | 53.1±6 years | 52.8±6 years | p = 0.87 |
| Age of Onset of Parental Symptoms | 70.5±9 years | N/A | N/A |
| Sex | 80% female | 60% female | p = 0.09 |
| ApoE4 carrier | 62% | 22% | p = 0.002* |
| Education±SD | 16.4±3 years | 18.3±4 years | p = 0.054 |
| Race | 6% non-white | 18% non-white | p = 0.14 |
| Exercise (out of 4)±SD | 3.5±0.9 | 3.2±1 | p = 0.23 |
| Body mass index±SD | 28±5 | 27±6 | p = 0.50 |
| History of heart disease | 0 | 0 | — |
| History of sleep apnea | 6% | 9% | p = 0.63 |
| Diabetes | 3% | 0 | p = 0.43 |
| Recent smoking | 9% | 9% | p = 0.95 |
| Lifetime smoking | 26% | 27% | p = 0.90 |
Neuropsychological testing
All subjects were cognitively normal at the time of testing, i.e., they did not score >1.5 S.D. below the expected range of scores for his or her age. Subjects did not significantly differ on any neuropsychological test (Table 2), although there was a trend toward a difference in the memory portions of theRey-Osterrieth Complex Visual Figure Test (immediate recall p = 0.05, delayed recall p = 0.08).
Table 2
Neuropsychological Testing. There was no influence of family history on any neuropsychological tests
| Test | Family History | No Family History | Significance |
| BDI (SD) | 2.3 (2.8) | 2.5 (2.7) | p = 0.84 |
| Laterality Index (SD) | 93 (19) | 82 (43) | p = 0.21 |
| MMSE (SD)* | 29.9 (0.3) | 29.8 (0.5) | p = 0.45 |
| LM-I (SD) | 29 (7) | 28 (6) | p = 0.71 |
| LM-D (SD) | 24 (7) | 24 (7) | p = 0.95 |
| LM-R (SD)* | 26 (2) | 26 (2) | p = 0.69 |
| REYO-C (SD)* | 35 (2) | 35 (1) | p = 0.30 |
| REYO-I (SD) | 21 (6) | 24 (4) | p = 0.052 |
| REYO-D (SD) | 21 (6) | 23 (4) | p = 0.08 |
| Verbal fluency (FAS) (SD)* | 43 (12) | 48 (14) | p = 0.27 |
| Semantic Fluency (CAT) (SD) | 57 (10) | 60 (10) | p = 0.23 |
| Trails A (SD)* | 26 (8) | 28 (7) | p = 0.14 |
| Trails B (SD) | 56 (13) | 60 (12) | p = 0.22 |
| CERAD-I (SD) | 24 (3) | 25 (3) | p = 0.24 |
| CERAD-D (SD)* | 8 (2) | 8 (1) | p = 0.14 |
| CERAD-R (SD)* | 9.9 (0.4) | 9.9 (0.3) | p = 0.76 |
| J-LO (SD)* | 24 (4) | 25 (4) | p = 0.11 |
| BNT (SD)* | 57 (3) | 57 (3) | p = 0.73 |
| Tower (SD) | 480 (186) | 476 (166) | p = 0.93 |
BDI, Beck Depression Inventory; MMSE, Mini-Mental State Exam, LM-I, Delis Kaplan Executive Function System (DKEFS) Logical Memory Test Immediate Recall; LM-D, DKEFS Logical Memory Test Delayed Recall; LM-R, DKEFS Logical Memory Test Recognition; REYO-C, Rey Osterrieth Complex Figure Test (REYO) Copy; REYO-I, REYO Immediate Recall; REYO-D, REYO Delayed Recall; FAS, DKEFS Verbal Fluency; CAT, DKEFS Semantic Fluency; CERAD-I, Consortium to Establish a Registry for Alzheimer’s Disease (CERAD) Word List Learning- Immediate Recall; CERAD-D, CERAD Word List Learning Delayed Recall; CERAD-R, CERAD Word List Learning Recognition; J-LO, Benton Judgment of Line Orientation; BNT, Boston Naming Test; Tower, DKEFS Tower Test. *Data were not normally distributed, Mann-Whitney U test was used instead of student’s t-test.
Oddity detection task
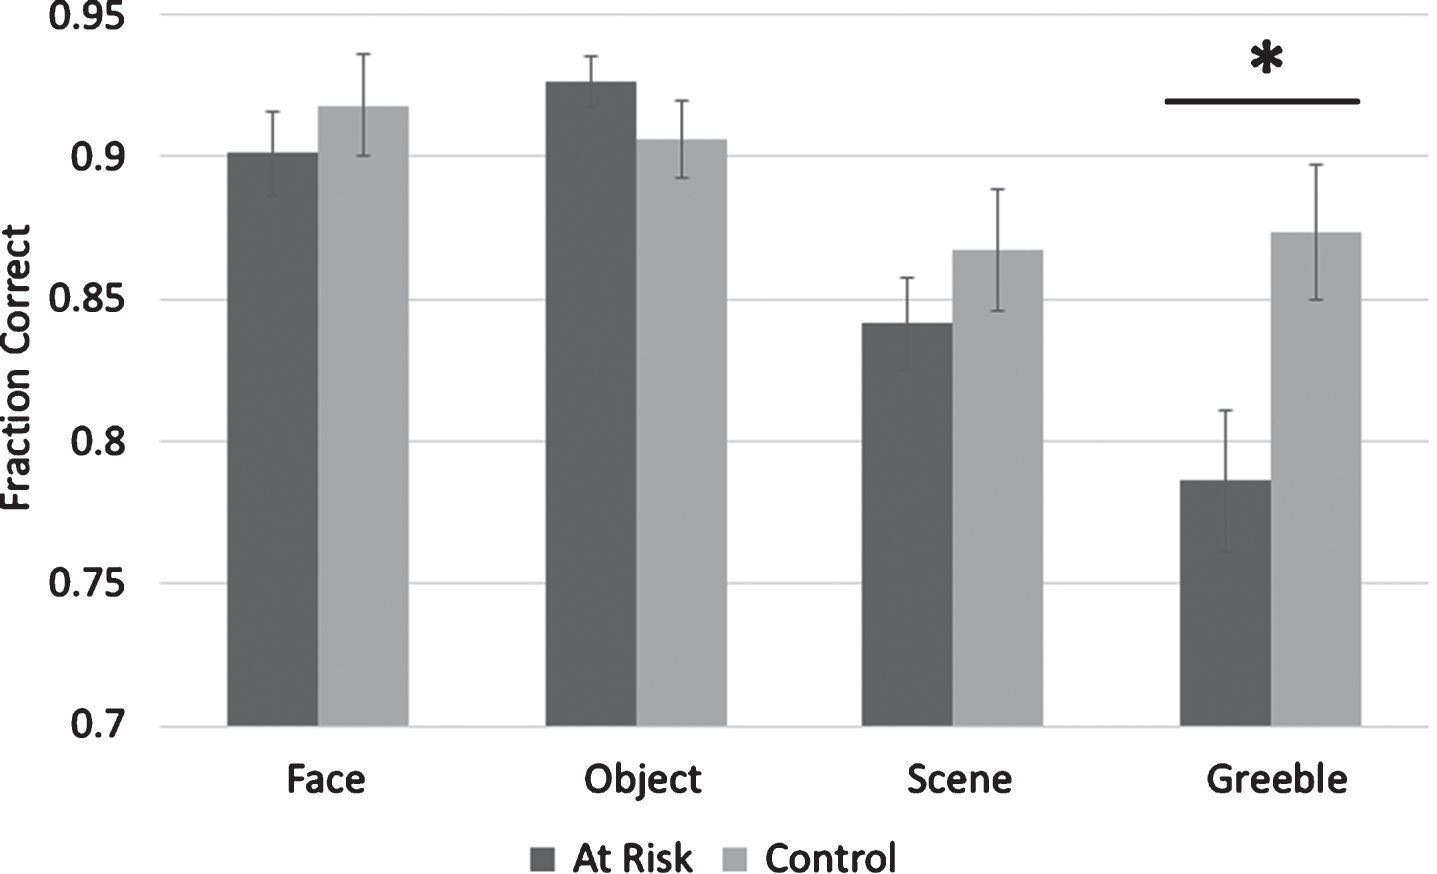
A correct trial was defined as a trial where the subject correctly identified the target item. The proportion of correct trials were subjected to a mixed-design repeated measures Analysis of Variance (ANOVA) with a within-subject factor of Stimulus Type (faces, scenes, objects, and Greebles) and a between-subject factor of Group (at-risk and control) (Fig. 2). This analysis showed a main effect of Stimulus Type (F (3,56) = 13.8, p < 0.001) and an interaction of Group and Stimulus Type(F (3,156) = 3.8, p = 0.01), but no main effect of Group (F (1,52) = 0.174, p = 0.68). After further analysis of the interaction using independent t-tests, a significant difference between groups was found in the Greebles condition (t(52) = 2.28, p = 0.03). Because there was a trend toward a difference between groups in education, we also re-analyzed the results using an Analysis of Covariance (ANCOVA) with a within-subject factor of Stimulus Type (faces, scenes, objects, and Greebles), a between-subject factor of Group (at-risk and control) and years of education as a covariate. We again found a main effect of stimulus type (F3,147 = 3.302, p = 0.022), an interaction between Stimulus Type and Group (F3,147 = 3.609, p = 0.015), but no main effect of Group (F1,49 = 1.2, p = 0.278). When Greebles accuracy was analyzed using a univariate general linear model with education as a covariate, the difference remained significant (F2,49 = 3.37, p = 0.04). We also analyzed groups based on carrier status of ApoE4 with a within-subject factor of Stimulus Type (faces, scenes, objects, and Greebles) and a between subject factor of ApoE4 Carrier Status (carrier and non-carrier). We did not find an interaction of Carrier Status and Stimulus Type (F3,150 = 0.111, p = 0.954) or a main effect of Carrier Status (F1,50 = 0.073, p = 0.788).
Fig.2
Accuracy data. There is a significant difference between groups in the Greeble condition of the oddity detection task. *p < 0.05, error bars are±SEM.
To further investigate the main effect of Stimulus Type, paired t-tests were used to compare accuracy across the different stimulus types. It was found that there was not a significant difference between overall face accuracy and object accuracy (t(53) = 0.99, p = 0.33); however, subjects performed significantly better in face accuracy than scene accuracy (t(53) = 3.87, p < 0.001) and Greeble accuracy (t(53) = 4.15, p < 0.001). Subjects also performed significantly better in object accuracy than scene accuracy (t(53) = 5.4, p < 0.001) and Greeble accuracy (t(53) = 5.4, p < 0.001). There was a trend for subjects to perform better in scene accuracy than Greeble accuracy (t(53) = 1.9, p = 0.058). In summary, face accuracy and object accuracy were higher than scene accuracy, which tended to be higher than Greeble accuracy.
Reaction times were collected for this task, and entered into a mixed-design repeated measures ANOVA with a within-subject factor of Stimulus Type (faces, scenes, objects, and Greebles) and a between subject factor of Group (at-risk and control). It should again be noted that subjects were instructed to emphasize accuracy over speed on these tasks, so reaction time was not of primary interest. Reaction times over all Stimuli Type tended to be long (on average >10 s) and reaction times included the time for the subject to verbally respond, and the experimenter to input the response. We found a main effect of Stimulus Type (F3,156 = 59.4, p = <0.001), but no main effect of Group (F1,49 = 0.035, p = 0.85), or an interaction (F3,156 = 0.91, p = 0.44). When we followed up on the main effect finding of stimulus type using paired t tests we found that all stimulus types were significantly different from all other stimulus types (all p values <0.001). Greebles had the highest average RT (19.828 s) followed by scenes (13.672 s), faces (10.667 s), and objects (7.819 s).
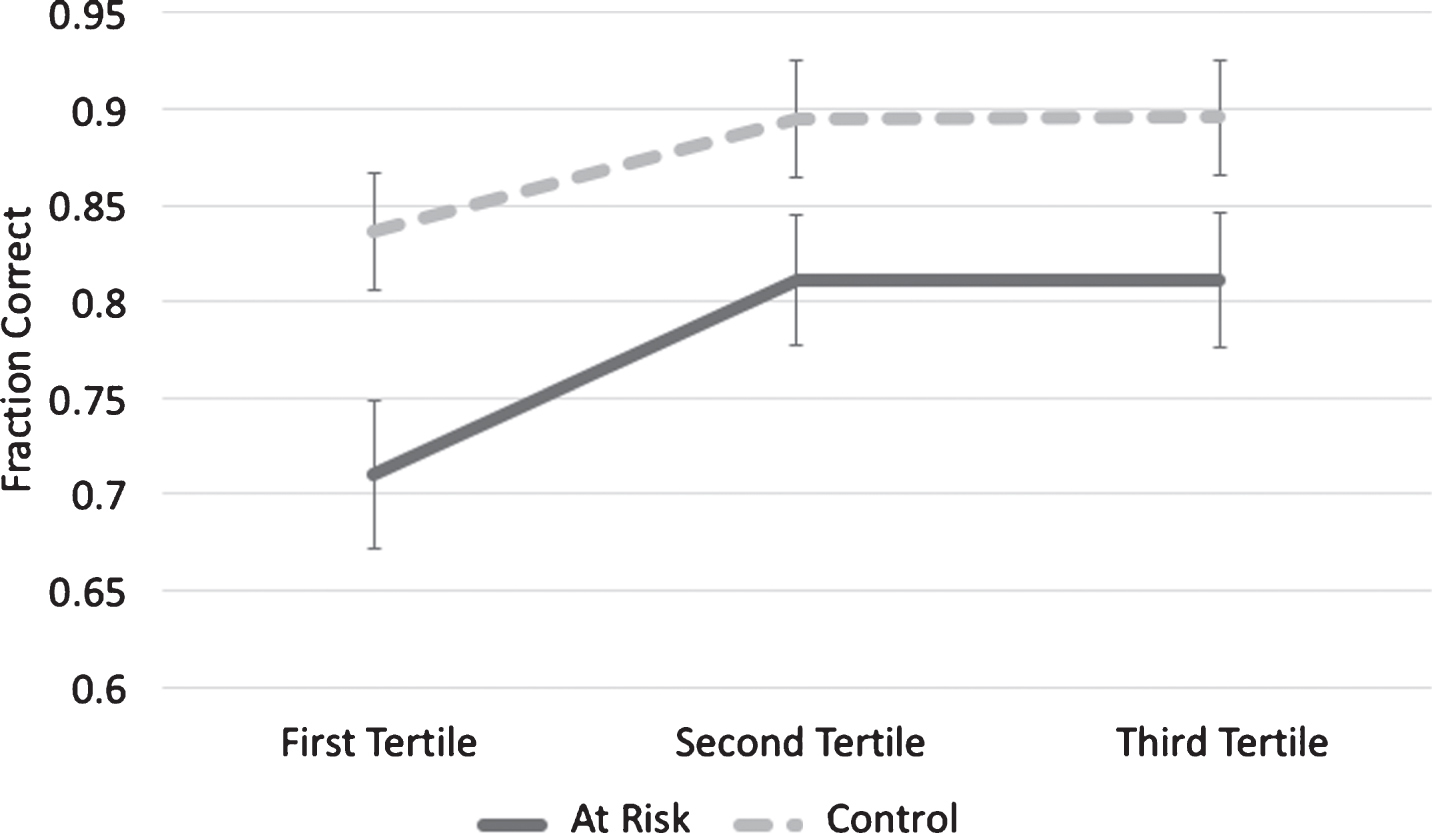
Several subjects reported that it was difficult at the beginning of the Greebles condition to know what details to look for, but after a number of trials it became easier. We wanted to determine if there was indeed a learning effect in this condition and, if so, whether the two subject groups demonstrated different rates of learning. To accomplish this, accuracy data from the Greebles condition was split into tertiles for each group (Fig. 3) and subjected to a mixed-design repeated measures ANOVA with a within-subject factor of Tertile (first tertile, second tertile, and third tertile) and a between-subject factor of Group (at-risk and control). There was a main effect of Tertile (F (2,90) = 6.50, p < 0.01) and of Group (F (1,45) = 6.30, p = 0.02). However, there was no interaction (F (2,90) = 0.45, p = 0.64). This indicates that there was a learning effect in both groups, and although at-risk group was consistently less accurate than the control group, the two groups did not learn at different rates.
Fig.3
Rate of Acquisition. Both groups demonstrated a learning effect during the Greeble condition. There was no difference in rate of acquisition in the at-risk group (p = 0.64).
Neuroimaging
After segmenting the brain into pre-defined regions of interest (left and right PRC, ERC, and hippocampus), volumes were calculated and normalized by total brain volume. The cortical thickness of each cortical region (the PRC and ERC) were also calculated. The normalized volumes were entered into a multivariate general linear model with risk group as the fixed factor, volume or thickness as the dependent variable and age and sex as covariates. The corrected model found no differences between groups in any region studied (Table 3).
Table 3
Structural imaging data with age and sex as covariates. There were no differences between groups in normalized volume or cortical thickness in any region studied
| Region of Interest | Family | No Family | F | Significance | |
| History | History | ||||
| Mean | Mean | ||||
| Normalized Volume | Left perirhinal cortex | 0.0019 | 0.0020 | 0.769 | 0.52 |
| (mm3 ROI/mm3 total) | Right perirhinal cortex | 0.0015 | 0.0014 | 0.128 | 0.94 |
| Left entorhinal cortex | 0.0013 | 0.00014 | 1.137 | 0.34 | |
| Right entorhinal cortex | 0.0014 | 0.0014 | 0.161 | 0.92 | |
| Left hippocampus | 0.0033 | 0.0034 | 1.641 | 0.19 | |
| Right hippocampus | 0.0033 | 0.0033 | 0.199 | 0.90 | |
| Cortical Thickness (mm) | Left perirhinal cortex | 2.42 | 2.49 | 1.234 | 0.31 |
| Right perirhinal cortex | 2.69 | 2.38 | 1.253 | 0.30 | |
| Left entorhinal cortex | 2.59 | 2.74 | 1.858 | 0.15 | |
| Right entorhinal cortex | 2.82 | 2.85 | 1.196 | 0.32 |
DISCUSSION
Current neuropsychological testing fails to identify individuals with AD until pathology is relatively advanced and likely irreversible. Research has shown that AD pathology is present in the brain decades before most diagnoses, and this pathology is likely disrupting neuronal function in subtle ways [2]. Because tau pathology begins to accumulate in the PRC early in life, we predicted that a task that challenges the PRC might be able to identify subtle behavioral differences between subjects at risk for AD and age-matched controls. We found that subjects at risk for AD are worse at distinguishing the “odd man out” when viewing Greeblestimuli.
Previous studies have shown that the PRC is involved in distinguishing stimuli with complex visual features within a single item (i.e., faces and objects), while the hippocampus is involved in the perceptual processing of scenes [11]. We did not see a difference between the groups with respect to performance in scenes, which may indicate that hippocampal functioning is intact. However, it is also possible that the scene stimuli were less difficult to visually process than the Greeble stimuli, as we do not have an objective measure of task difficulty or feature ambiguity. While we did not observe a difference between groups in real world objects or faces, we did see a difference in the processing of Greebles. One reason for this may be the relative novelty of Greebles compared to objects and faces. In this case, we use the term “novel” to describe a class of objects that have most likely never been encountered by a subject prior to the experiment [39, 40]. Work done in humans, non-human primates, and rats have shown that perirhinal neurons preferentially fire in response to novel objects [41, 42].
While Greebles were unfamiliar items to the subjects, we believe that the more likely driver of the behavioral difference in the Greeble condition was feature ambiguity. Feature ambiguity refers to the degree of perceptual overlap between features on complex objects. Human subjects with damage to the PRC perform worse on the Odd Man Out task as feature ambiguity within items increases. Of the stimuli that were used, subjects reported that the Greebles contained the highest degree of feature ambiguity, which may further explain why this stimulus in particular showed an effect between groups. Feature ambiguity was not explicitly controlled in this task, and studies have shown that MTL damage will result in difficulty discriminating objects, and this difficulty increases with feature ambiguity [43]. Future studies should categorize by and high and low feature ambiguity across all stimulus types to determine if feature ambiguity underlies the difference in Greebles, or if there was something unique about the Greeble stimuli such as their relative novelty to subjects.
Although the primary cognitive process being examined in this study was perceptual discrimination of similar items, other cognitive processes are also necessary to successfully complete this task. For example, subjects must selectively attend to the relevant features of the items that they are examining. Selective attention has been shown to discriminate between subjects with mild cognitive impairment, a prodromal form of AD, and age-matched controls [44, 45]. It has also been suggested that executive control may be impaired in subjects with mild cognitive impairment [46]. We do not believe that selective attention or executive control were driving the differences in these groups for two reasons. First, selective attention and executive control would not likely impact the Greebles condition more than any other condition. In particular, selective attention is required for the processing of the scene stimuli, which did not differ between the two groups. Second, we examined executive function using neuropsychological testing and did not find any differences between groups in any of the tests. There was an element of learning to this task, and an argument could be made that the at-risk subjects simply took longer to learn the task than control subjects. However, this was not the case (see Fig. 3). Both groups became more accurate with time, indicating that there is a learning effect to this task. The at-risk group consistently remained less accurate across time compared to the control group, but learned at a similar rate.
Unlike the other stimuli, the Greebles required mental rotation of the images both around the x-axis (the object remained in the same upright orientation but was rotated left or right) and along the z-axis (the object was turned 90° or 180° from the upright orientation). Many studies have suggested that the more an object needs to be mentally rotated for a task, the higher the neural activity observed [47–49]. Mentally rotating an object 180° may require more mental effort than rotating it laterally, so it is possible that this extra effort may influence performance in this task. In contrast, a previous study demonstrated that rotations around the z axis resulted in better performance than rotations around the x- or y-axes [50]. Another study examined mental rotation ability in subjects at risk for AD and found that there were no behavioral differences in reaction time or accuracy, but there were increases in activation in the right superior parietal lobule, the right insula, the right middle frontal gyrus, and the right inferior frontal gyrus [51]. In the future, the oddity detection task could be paired with functional MRI to determine if there are any differences in activation in any of the brain areas associated with mental rotation.
The PRC is not the only area of the brain that is affected by early AD pathology. The ERC also exhibits early tau pathology, and this brain region is a potential target area for behavioral testing. Animal studies have primarily implicated the ERC in spatial and temporal memory [52]. Future studies may be able to use virtual reality to test the spatial memory abilities in subjects at risk for AD. Human studies have used neuroimaging to show that the ERC is also involved in associative memory [53, 54], a process that is impaired in AD [55–57]. Testing associative memory with methods such as a face/name memory test may provide clearer insight to the earliest processes occurring in AD.
Despite behavioral differences in the oddity detection task, there were no differences between groups in volumetric measurements of the brain. Significant tissue atrophy due to pathology has likely not occurred at this stage [5]. Braak and Braak have demonstrated that during the early stages of AD, tau pathology has already begun to build in the MTL [4, 58]. It is possible that in this group of subjects, tau pathology has already begun and is disrupting neuronal signaling in the PRC and ERC. In subjects who will go on to develop AD, this build-up of tau may be accelerating during middle age. While there is some evidence that tau pathology precedes and contributes to the development of amyloid pathology, this has yet to be definitively proven [2]. A novel PET ligand for tau has demonstrated that tau concentration in the MTL is the best predictive marker of clinical function [59]. Cognitive tests do not correlate with amyloid load in a middle aged cohort of subjects [60] and amyloid pathology in the MTL appears to develop subsequent to tau pathology [2]. We hypothesize that performance in this task is likely related to tau buildup, and future studies should include PET scanning and/or the testing of cerebrospinal fluid for tau and amyloid markers to determine if this task correlates with abnormal tau and/or amyloid pathology.
Patients who have been diagnosed with AD likely began to accumulate pathology decades before diagnosis. During the early stages of the disease, this pathology is limited and may be vulnerable to therapeutic interventions. The oddity detection task may be able to distinguish subjects at this stage based on PRC function. A previous study demonstrated that subjects at risk for AD develop “false memories” for novel objects that are highly visually similar to previously seen items [61]. That study also attributed this result to early damage in the PRC. Perhaps by developing a cognitive battery of tests of PRC function in conjunction with physiological biomarkers (MRI, PET scanning, cerebrospinal fluid-based biomarkers, etc.), a comprehensive profile of patient function and risk could be developed.
One issue with stratifying subjects based on family history alone is that family history was established via self-report. While we asked subjects questions about their parents’ diagnoses in an attempt to establish a true AD diagnosis, without an autopsy it would be impossible to say for certain that the parent had AD and not some other type of dementia. It is surprising that there was no difference in cognitive performance between carriers and non-carriers of the ApoE4 allele because there is strong evidence that possession of the ApoE4 allele results in increased risk of AD [31]. The effect of ApoE4 on cognition throughout the lifespan is still unclear. It has been proposed that ApoE4 may exhibit antagonistic pleiotropy, i.e., it may be beneficial in early life but lead to increased susceptibility to disease later in life [32]. However, other studies have failed to find an association between ApoE4 and cognition in early life [33], later life [34], or throughout the lifespan [35]. Subjects were relatively young (40–60), so perhaps ApoE4 exerts its influence later in the course of the disease. One study did find a relationship between ApoE4 carrier status and cognition in cognitively healthy middle aged adults [36]; however, 80% of the ApoE4 carriers also had a first degree family history of the disease, making it difficult to tease apart the influence of ApoE4 alone. ApoE4 carrier status is often used as the primary determinate of risk in studies of healthy subjects at risk for AD, but family history may be a more powerful risk factor for AD than ApoE4 alone. Having a first-degree relative diagnosed with the disease increases the overall risk by 2–4 times, and AD is estimated to be 58% heritable [37]. Additionally, ApoE4 is only one gene, but genome-wide association studies have identified many genes that may modify the risk of AD [38]. Future studies should stratify subjects based on family history and no ApoE4, family history with ApoE4, and controls (no family history, no ApoE4) to further investigate this result.
In conclusion, we have demonstrated that middle-aged subjects at risk for developing AD demonstrate a clear difference in perceptual processing decades before the expected onset of the disease. This difference is most apparent in novel stimuli with a high degree of feature ambiguity. This task may have clinical utility in identifying subjects with early AD pathology decades before a diagnosis.
ACKNOWLEDGMENTS
This work was supported through grants from the National Institute on Aging (RO1AG038471, awarded to BAA) and the National Institute of Neurological Disorders and Stroke (RO1NS078828, awarded to MJD). Additional stipend support for EJM was provided by the National Institute of Mental Health (T32MH064913) and the Howard Hughes Medical Institute (HHMI MIG 56006779).
Authors’ disclosures available online (http://j-alz.com/manuscript-disclosures/16-0772r2).
REFERENCES
[1] | Alzheimer’s Association ((2015) ) 2015 Alzheimer’s disease facts and figures. Alzheimers Dement 11: , 332–384. |
[2] | Braak H , Del Tredici K ((2015) ) The preclinical phase of the pathological process underlying sporadic Alzheimer’s disease. Brain 138: , 2814–2833. |
[3] | Duyckaerts C , Delatour B , Potier M-C ((2009) ) Classification and basic pathology of Alzheimer disease. Acta Neuropathol 118: , 5–36. |
[4] | Braak H , Braak E ((1997) ) Frequency of stages of Alzheimer-related lesions in different age categories. Neurobiol Aging 18: , 351–357. |
[5] | Braak H , Braak E ((1991) ) Neuropathological stageing of Alzheimer-related changes. Acta Neuropathol 82: , 239–259. |
[6] | Barense MD , Gaffan D , Graham KS ((2007) ) The human medial temporal lobe processes online representations of complex objects. Neuropsychologia 45: , 2963–2974. |
[7] | Lee ACH ((2006) ) Differentiating the roles of the hippocampus and perirhinal cortex in processes beyond long-term declarative memory: A double dissociation in dementia. J Neurosci 26: , 5198–5203. |
[8] | Bussey T , Saksida L , Murray E ((2005) ) The perceptual-mnemonic/feature conjunction model of perirhinal cortex function. Q J Exp Psychol B 58: , 269–282. |
[9] | Mendez MF , Mendez MA , Martin R , Smyth KA , Whitehouse PJ ((1990) ) Complex visual disturbances in Alzheimer’s disease. Neurology 40: , 439–443. |
[10] | Jefferson AL , Barakat LP , Giovannetti T , Paul RH , Glosser G ((2006) ) Object perception impairments predict instrumental activities of daily living dependence in Alzheimer’s disease. J Clin Exp Neuropsychol 28: , 884–897. |
[11] | Erez J , Lee ACH , Barense MD ((2013) ) It does not look odd to me: Perceptual impairments and eye movements in amnesic patients with medial temporal lobe damage. Neuropsychologia 51: , 168–180. |
[12] | Buckley MJ , Booth MC , Rolls ET , Gaffan D ((2001) ) Selective perceptual impairments after perirhinal cortex ablation. J Neurosci 21: , 9824–9836. |
[13] | Raber J , Huang Y , Ashford JW ((2004) ) ApoE genotype accounts for the vast majority of AD risk and AD pathology. Neurobiol Aging 25: , 641–650. |
[14] | Geusebroek J-M , Burghouts GJ , Smeulders AWM ((2004) ) The Amsterdam Library of Object Images. Int J Comput Vision 61: , 103–112. |
[15] | Reese HW ((1997) ) Counterbalancing and other uses of repeated-measures Latin-square designs: Analyses and interpretations. J Exp Child Psychol 64: , 137–158. |
[16] | Dale AM , Fischl B , Sereno MI ((1999) ) Cortical surface-based analysis. I. Segmentation and surface reconstruction. Neuroimage 9: , 179–194. |
[17] | Dale AM , Sereno MI ((1993) ) Improved localization of cortical activity by combining EEG and MEG with MRI cortical surface reconstruction: A linear approach. J Cogn Neurosci 5: , 162–176. |
[18] | Fischl B , Dale AM ((2000) ) Measuring the thickness of the human cerebral cortex from magnetic resonance images. Proc Natl Acad Sci U S A 97: , 11050–11055. |
[19] | Fischl B , Liu A , Dale AM ((2001) ) Automated manifold surgery: Constructing geometrically accurate and topologically correct models of the human cerebral cortex. IEEE Trans Med Imaging 20: , 70–80. |
[20] | Fischl B , Salat DH , Busa E , Albert M , Dieterich M , Haselgrove C , van der Kouwe A , Killiany R , Kennedy D , Klaveness S , Montillo A , Makris N , Rosen B , Dale AM ((2002) ) Whole brain segmentation: Automated labeling of neuroanatomical structures in the human brain. Neuron 33: , 341–355. |
[21] | Fischl B , Salat DH , van der Kouwe AJW , Makris N , Ségonne F , Quinn BT , Dale AM ((2004) ) Sequence-independent segmentation of magnetic resonance images. Neuroimage 23: (Suppl 1), S69–S84. |
[22] | Fischl B , Sereno MI , Dale AM ((1999) ) Cortical surface-based analysis. II: Inflation, flattening, and a surface-based coordinate system. Neuroimage 9: , 195–207. |
[23] | Fischl B , van der Kouwe A , Destrieux C , Halgren E , Ségonne F , Salat DH , Busa E , Seidman LJ , Goldstein J , Kennedy D , Caviness V , Makris N , Rosen B , Dale AM ((2004) ) Automatically parcellating the human cerebral cortex. Cereb Cortex 14: , 11–22. |
[24] | Han X , Jovicich J , Salat D , van der Kouwe A , Quinn B , Czanner S , Busa E , Pacheco J , Albert M , Killiany R , Maguire P , Rosas D , Makris N , Dale A , Dickerson B , Fischl B ((2006) ) Reliability of MRI-derived measurements of human cerebral cortical thickness: The effects of field strength, scanner upgrade and manufacturer. Neuroimage 32: , 180–194. |
[25] | Jovicich J , Czanner S , Greve D , Haley E , van der Kouwe A , Gollub R , Kennedy D , Schmitt F , Brown G , Macfall J , Fischl B , Dale A ((2006) ) Reliability in multi-site structural MRI studies: Effects of gradient non-linearity correction on phantom and human data. Neuroimage 30: , 436–443. |
[26] | Ségonne F , Dale AM , Busa E , Glessner M , Salat D , Hahn HK , Fischl B ((2004) ) A hybrid approach to the skull stripping problem in MRI. Neuroimage 22: , 1060–1075. |
[27] | Reuter M , Rosas HD , Fischl B ((2010) ) Highly accurate inverse consistent registration: A robust approach. Neuroimage 53: , 1181–1196. |
[28] | Reuter M , Schmansky NJ , Rosas HD , Fischl B ((2012) ) Within-subject template estimation for unbiased longitudinal image analysis. Neuroimage 61: , 1402–1418. |
[29] | Desikan RS , Ségonne F , Fischl B , Quinn BT , Dickerson BC , Blacker D , Buckner RL , Dale AM , Maguire RP , Hyman BT , Albert MS , Killiany RJ ((2006) ) An automated labeling system for subdividing the human cerebral cortex on MRI scans into gyral based regions of interest. Neuroimage 31: , 968–980. |
[30] | Augustinack JC , Huber KE , Stevens AA , Roy M , Frosch MP , van der Kouwe AJW , Wald LL , Van Leemput K , McKee AC , Fischl B , Alzheimer’s Disease Neuroimaging Initiative ((2013) ) Predicting the location of human perirhinal cortex, Brodmann’s area 35, from MRI. Neuroimage 64: , 32–42. |
[31] | Corder EH , Saunders AM , Strittmatter WJ , Schmechel DE , Gaskell PC , Small GW , Roses AD , Haines JL , Pericak-Vance MA ((1993) ) Gene dose of apolipoprotein E type 4 allele and the risk of Alzheimer’s disease in late onset families. Science 261: , 921–923. |
[32] | Small BJ , Rosnick CB , Fratiglioni L , Bäckman L ((2004) ) Apolipoprotein E and cognitive performance: A meta-analysis. Psychol Aging 19: , 592–600. |
[33] | Ihle A , Bunce D , Kliegel M ((2012) ) APOE ɛ4 and cognitive function in early life: A meta-analysis. Neuropsychology 26: , 267–277. |
[34] | Bondi MW , Salmon DP , Galasko D , Thomas RG , Thal LJ ((1999) ) Neuropsychological function and apolipoprotein E genotype in the preclinical detection of Alzheimer’s disease. Psychol Aging 14: , 295–303. |
[35] | Bunce D , Bielak AAM , Anstey KJ , Cherbuin N , Batterham PJ , Easteal S ((2014) ) APOE genotype and cognitive change in young, middle-aged, and older adults living in the community. J Gerontol A Biol Sci Med Sci 69: , 379–386. |
[36] | Greenwood PM , Lambert C , Sunderland T , Parasuraman R ((2005) ) Effects of apolipoprotein E genotype on spatial attention, working memory, and their interaction in healthy, middle-aged adults: Results From the National Institute of Mental Health’s BIOCARD study. Neuropsychology 19: , 199–211. |
[37] | Jarvik L , LaRue A , Blacker D , Gatz M , Kawas C , McArdle JJ , Morris JC , Mortimer JA , Ringman JM , Ercoli L , Freimer N , Gokhman I , Manly JJ , Plassman BL , Rasgon N , Roberts JS , Sunderland T , Swan GE , Wolf PA , Zonderman AB ((2008) ) Children of persons with Alzheimer disease: What does the future hold? Alzheimer Dis Assoc Disord 22: , 6–20. |
[38] | Tosto G , Reitz C ((2013) ) Genome-wide association studies in Alzheimer’s disease: A review. Curr Neurol Neurosci Rep 13: , 381. |
[39] | Gauthier I , Tarr MJ , Anderson AW , Skudlarski P , Gore JC ((1999) ) Activation of the middle fusiform “face area” increases with expertise in recognizing novel objects. Nat Neurosci 2: , 568–573. |
[40] | Gauthier I , Tarr MJ ((1997) ) Becoming a “Greeble” expert: Exploring mechanisms for face recognition. Vision Res 37: , 1673–1682. |
[41] | Linstow Roloff von E , Muller RU , Brown MW ((2016) ) Finding and not finding rat perirhinal neuronal responses to novelty. Hippocampus 26: , 1021–1032. |
[42] | Brown MW , Banks PJ ((2015) ) In search of a recognition memory engram. Neurosci Biobehav Rev 50: , 12–28. |
[43] | Barense MD , Bussey TJ , Lee ACH , Rogers TT , Davies RR , Saksida LM , Murray EA , Graham KS ((2005) ) Functional specialization in the human medial temporal lobe. J Neurosci 25: , 10239–10246. |
[44] | Redel P , Bublak P , Sorg C , Kurz A , Forstl H , Müller HJ , Schneider WX , Perneczky R , Finke K ((2012) ) Deficits of spatial and task-related attentional selection in mild cognitive impairment and Alzheimer’s disease. Neurobiol Aging 33: , 195.e27–42. |
[45] | McLaughlin PM , Anderson ND , Rich JB , Chertkow H , Murtha SJE ((2014) ) Visual selective attention in amnestic mild cognitive impairment. J Gerontol B Psychol Sci Soc Sci 69: , 881–891. |
[46] | Belleville S , Fouquet C , Duchesne S , Collins DL , Hudon C ((2014) ) Detecting early preclinical Alzheimer’s disease via cognition, neuropsychiatry, and neuroimaging: Qualitative review and recommendations for testing. J Alzheimers Dis 42: (Suppl 4), S375–S382. |
[47] | Shepard RN , Metzler J ((1971) ) Mental rotation of three-dimensional objects. Science 171: , 701–703. |
[48] | Prime DJ , Jolicoeur P ((2010) ) Mental rotation requires visual short-term memory: Evidence from human electric cortical activity. J Cogn Neurosci 22: , 2437–2446. |
[49] | Zacks JM ((2008) ) Neuroimaging studies of mental rotation: A meta-analysis and review. J Cogn Neurosci 20: , 1–19. |
[50] | Gauthier I , Hayward WG , Tarr MJ , Anderson AW , Skudlarski P , Gore JC ((2002) ) BOLD activity during mental rotation and viewpoint-dependent object recognition. Neuron 34: , 161–171. |
[51] | Yassa MA , Verduzco G , Cristinzio C , Bassett SS ((2008) ) Altered fMRI activation during mental rotation in those at genetic risk for Alzheimer disease. Neurology 70: , 1898–1904. |
[52] | Morrissey MD , Takehara-Nishiuchi K ((2014) ) Diversity of mnemonic function within the entorhinal cortex: A meta-analysis of rodent behavioral studies. Neurobiol Learn Mem 115: , 95–107. |
[53] | Stark CE , Squire LR ((2001) ) Simple and associative recognition memory in the hippocampal region. Learn Mem 8: , 190–197. |
[54] | Braskie MN , Small GW , Bookheimer SY ((2009) ) Entorhinal cortex structure and functional MRI response during an associative verbal memory task. Hum Brain Mapp 30: , 3981–3992. |
[55] | Sperling R ((2007) ) Functional MRI studies of associative encoding in normal aging, mild cognitive impairment, and Alzheimer’s disease. Ann N Y Acad Sci 1097: , 146–155. |
[56] | Pike KE , Kinsella GJ , Ong B , Mullaly E , Rand E , Storey E , Ames D , Saling M , Clare L , Parsons S ((2012) ) Names and numberplates: Quasi-everyday associative memory tasks for distinguishing amnestic mild cognitive impairment from healthy aging. J Clin Exp Neuropsychol 34: , 269–278. |
[57] | Rentz DM , Amariglio RE , Becker JA , Frey M , Olson LE , Frishe K , Carmasin J , Maye JE , Johnson KA , Sperling RA ((2011) ) Face-name associative memory performance is related to amyloid burden in normal elderly. Neuropsychologia 49: , 2776–2783. |
[58] | Braak H , Braak E ((1991) ) Neuropathological stageing of Alzheimer-related changes. Acta Neuropathol 82: , 239–259. |
[59] | Brier MR , Gordon B , Friedrichsen K , McCarthy J , Stern A , Christensen J , Owen C , Aldea P , Su Y , Hassenstab J , Cairns NJ , Holtzman DM , Fagan AM , Morris JC , Benzinger TLS , Ances BM ((2016) ) Tau and Aβ imaging, CSF measures, and cognition in Alzheimer’s disease. Sci Transl Med 8: , 338ra66–338ra66. |
[60] | Mielke MM , Machulda MM , Hagen CE , Christianson TJ , Roberts RO , Knopman DS , Vemuri P , Lowe VJ , Kremers WK , Jack CR Jr , Petersen RC ((2016) ) Influence of amyloid and APOE on cognitive performance in a late middle-aged cohort. Alzheimers Dement 12: , 281–291. |
[61] | Yeung L-K , Ryan JD , Cowell RA , Barense MD ((2013) ) Recognition memory impairments caused by false recognition of novel objects. J Exp Psychol Gen 142: , 1384–1397. |

