Optimized Standard Operating Procedures for the Analysis of Cerebrospinal Fluid Aβ42 and the Ratios of Aβ Isoforms Using Low Protein Binding Tubes
Abstract
Background: Reduced cerebrospinal fluid (CSF) concentration of amyloid-β1-42 (Aβ1-42) reflects the presence of amyloidopathy in brains of subjects with Alzheimer’s disease (AD).
Objective: To qualify the use of Aβ1-42/Aβ1-40 for improvement of standard operating procedures (SOP) for measurement of CSF Aβ with a focus on CSF collection, storage, and analysis.
Methods: Euroimmun ELISAs for CSF Aβ isoforms were used to set up a SOP with respect to recipient properties (low binding, polypropylene), volume of tubes, freeze/thaw cycles, addition of detergents (Triton X-100, Tween-20) in collection or storage tubes or during CSF analysis. Data were analyzed with linear repeated measures and mixed effects models.
Results: Optimization of CSF analysis included a pre-wash of recipients (e.g., tubes, 96-well plates) before sample analysis. Using the Aβ1-42/Aβ1-40 ratio, in contrast to Aβ1-42, eliminated effects of tube type, additional freeze/thaw cycles, or effect of CSF volumes for polypropylene storage tubes. ‘Low binding’ tubes reduced the loss of Aβ when aliquoting CSF or in function of additional freeze/thaw cycles. Addition of detergent in CSF collection tubes resulted in an almost complete absence of variation in function of collection procedures, but affected the concentration of Aβ isoforms in the immunoassay.
Conclusion: The ratio of Aβ1-42/Aβ1-40 is a more robust biomarker than Aβ1-42 toward (pre-) analytical interfering factors. Further, ‘low binding’ recipients and addition of detergent in collection tubes are able to remove effects of SOP-related confounding factors. Integration of the Aβ1-42/Aβ1-40 ratio and ‘low-binding tubes’ into guidance criteria may speed up worldwide standardization of CSF biomarker analysis.
INTRODUCTION
CSF amyloid-β1-42 (Aβ1-42) and tau proteins (total tau, phosphorylated tau) reflect the presence of amyloidopathy and tau pathology in the brain of subjects with Alzheimer’s disease (AD). The combination of both proteins has been qualified by the European Medicines Agency as a tool for patient enrolment in clinical trials, while the Letter of Support from the Food and Drug Administration encourages their use in clinical trials [1, 2]. Algorithms based on a combination of CSF AD biomarkers, together with imaging methods, were integrated into revised criteria for AD diagnosis [3, 4]. However, since no reference method has yet been approved, published cut-off values are center- and CSF-collection-specific. Consequently, the translation of cut-off values from one study to another clinical setting can lead to misclassification of subjects for inclusion in clinical trials or wrong decision-making for affected subjects.
Several papers provided guidance for (pre-) analytical handling of CSF [5, 6], but focused almost exclusively on individual proteins. The clinical accuracy of CSF biomarker cut-off values is affected in part by the absence of uniform Standard Operating Procedures (SOP) for CSF collection, storage, and analysis (Supplementary Figure 1). There is still a need for a consensus on how to collect and store CSF before analysis, taking into account the impact of these factors on the results of diagnostic tests.
Even though CSF Aβ1-42 levels reflect cortical amyloid load in the brain as determined by neuro-pathology [7] and amyloid PET imaging [8], it has recently become evident that the ratio of Aβ1-42/Aβ1-40 (or Aβ1-42/Aβ1-38) more accurately measu-res brain amyloid pathology [9–11]. The Aβ1-42/Aβ1-40 ratio might be less affected by pre-analytical variables than Aβ1-42 alone [12].
We have used the Euroimmun assays for CSF Aβ isoforms (Aβ1-42, Aβ1-40, Aβ1-38) to document the robustness of procedures for collection, storage, and analysis of CSF. Several factors were included in the study design (e.g., recipient type, volumes of tubes, freeze/thaw cycles). In addition, detergents were added at the time of CSF collection, during CSF analysis in the laboratory, or in tubes which were stored at –80°C. Data were analyzed with linear repeated measures and mixed effects models. The outcome of the study was used to optimize and extend the guidance for CSF analysis.
MATERIALS AND METHODS
CSF collection
CSF was collected prospectively from patients undergoing lumbar puncture due to clinical suspicion of normal pressure hydrocephalus at the Memory clinic, Skåne University Hospital, Sweden. In these patients, 40 mL of CSF was collected as part of the clinical routine investigation. De-identified CSF samples from 19 individuals were investigated. The detailed procedure for CSF collection and storage is shown in Fig. 1. For each subject, 20 different protocols were applied. Several vials with 5 mL of CSF were collected during the lumbar puncture from the same subject in two types of tubes [low binding (LoB), polypropylene (PP)] with or without additives [Tween-20 (Tw20; Panreac AppliChem, MO, USA) or Triton-X100 (TrX100; VWR Chemicals,Stockholm, Sweden)]. Each tube was graduated in order to obtain the exact collection volume. A possible gradient effect was overcome by randomization of the order in which the different samples were collected. The randomization cannot change the occurrence of a possible gradient effect over time. On the other hand, randomization will limit the possibility that the gradient effect is confounded with the protocol number in the statistical analysis. By randomizing the order of protocols over subjects, the possible gradient effect will be on average leveled out when comparing the protocols over subjects. However, Bjerke et al. [13] reported the absence of a gradient effect by analysis of Aβ1-42 concentrations in four 10 mL portions of CSF.
In a part of the tubes, 25 μL of 10% Tw20 or TrX100 was added (final concentration: 0.05% v/v). All vials were mixed by inverting them 25 times, kept at room temperature (RT) for 20 min, followed by centrifugation (2000 g, RT, 10 min). From these original tubes, CSF was transferred into microtubes (0.5 mL/1.5 mL, LoB/PP). After one week of storage at –80°C, one 1.5 mL PP or LoB tube containing 1.3 mL CSF was thawed, aliquoted, and stored at –80°C before testing. Among the tested procedures, there was no SOP using a collection LoB tube and a PP storage tube.
The following tubes have been selected for the study based on their current use in the laboratory for observational studies: LoB tubes from Eppendorf: 5 mL: Code: 0030108302; 1.5 mL: Code: 0030108116; 0.5 mL: 0030108094; PP tubes from Sarstedt: 5 mL: 62.554.502; 1.5 mL: 72.706; 0.5 mL: 72.730.006.
For the cases included in the study, CSF collection started on September 23, 2014 and ended on December 2, 2014. Sample analysis was done in Q1 2015.
All patients gave their written informed consent allowing their CSF samples to be used for research. The Ethics Committee in Lund, Sweden, has approved the use of de-identified CSF samples to measure CSF Aβ metabolites.
Assays
CSF was analyzed after at least one freeze/thaw cycle using commercial β-amyloid1-42, and β-amyloid1-40 assays (Euroimmun, Lübeck, Germany) and research assays for β-amyloid1-38 (produced by ADxNeuroSciences). Details of the test procedures are described in Supplementary Table 1.
Optimization of the quantification of Aβ isoforms in CSF
Experiments were done to optimize CSF collection procedure and the test conditions.
Pre-analytical phase
Before CSF analysis, the impact of a pre-wash step of recipients on test results was analyzed. Results were integrated in protocols for sample analysis. Pre-wash was done by the addition of sample diluent to recipients for a period of 30 min at RT, followed by removing the liquid from the wells by tapping. No sample diluent remained in the wells before samples were added for analysis.
Since detergents can interfere with the binding of proteins to antibodies, it was of utmost importance to verify their interference in the assay. TrX100 or Tw20 was added to a part of the CSF samples at the time of collection with the aim to limit adsorption of Aβ1-42 to the recipients. First, detergent was added to the calibrator solutions, with identical Tw20 and TrX100 concentrations as used for CSF collection. Moreover, detergents were added to the biotinylated detector mAb solution (“BIOTIN” reagent in the test kit). Secondly, CSF samples from one subject were used to estimate the bias (= difference in concentration) in CSF Aβ1-42 in function of the test procedure. Results of the CSF analyses were compared after calibration against a non-detergent or detergent-containing calibrator series.
Analytical phase, CSF analysis, and acceptance criteria
CSF and controls (= calibrators in phosphate-buffered solution) were analyzed in duplicate in one laboratory (ADx NeuroSciences, Gent, Belgium) by one operator with one lot number of each ELISA. After thawing CSF at RT, CSF samples from one subject were tested in a single 96-well plate to limit inter-plate variability. Samples of one subject were measured for the different analytes on the same day. Reported values (= mean of two OD values) were used to calculate concentrations using a 4-PL curve fit algorithm.
Acceptance criteria for validation of individual tests were established in-house and included (i) back-calculated values of each calibrator’s concentration not to exceed 15% of the nominal concentration in the linear range of the assay, (ii) % CV between concentrations < 20%, and (iii) kit controls within specifications as described in the kit insert.
Post-analytical phase
We tried to recover Aβ1-42 from recipients with CSF with decreased Aβ1-42 concentrations after storage in order to verify whether the difference resulted from degradation of the analyte or from adsorption of the analyte to the tubes. For this purpose, tubes with CSF, collected in the absence of detergent, were treated with different concentrations (0.002–0.05%) of Tw20. Aβ1-42 concentrations in the CSF after addition of detergent were compared to samples to which no detergent was added.
Statistical analysis
Model selection and fitting
Experiments provided repeated measures data. The different measurements of CSF collected from the same subject form a multivariate response. Measurements made on the same subject are correlated, while measurements between different subjects are considered independent (with CSF of different subjects tested in different assay runs).
Concentrations were log-transformed prior to modeling. Correlations between measurements made on the same subject were modeled by introducing a random subject effect and through the specification of different covariance structures. Restricted maximum likelihood estimation was used to compare the models with different approaches to variance modeling but the same fixed-effects model. For comparison of both detergents, the correlation was modeled with a random effect for subject. For all other analyses, the correlated errors model (without random effect) with heterogeneous compound symmetry covariance structure was selected (based on Akaike and Bayesian information criteria). This model imposes the same pair-wise correlations among all measurements on the same subject, but allows for heterogeneous variances among subjects. Model fit was approved based on residual diagnostics. The final models were rerun with ML estimation and Kenward-Rogerapproximation to the degrees of freedom for inference on fixed effects.
CSF protocol experiment
A first model was fitted to study the differences in concentrations between the 20 protocols. This model contained only the fixed 20-level factor “CSF-protocol”. Results were reported as mean (over all subjects) standardized concentrations for each protocol with a 95% confidence interval (CI). Concentrations were standardized by dividing the mean protocol-specific concentrations by the mean concentration of the reference procedure (protocol 7). A standardized concentration of 110 (90) means a 10% increase (decrease) in concentration compared to the reference procedure.
A second model was fitted to further evaluate the impact of the different protocol parameters. The model contained the main effects for the factors ‘collection’ (first tube) and ‘storage’ (second tube) recipient, volume of the storage tube, an additional freeze/thaw cycle and addition of detergent, together with interactions of detergent with each of four other factors and two three-way interactions (for detergent, freeze-thaw condition and storage tube and for detergent, volume and type of storage tube). The reported effects of a factor are relative changes (%) in concentration, keeping the other factors constant. For instance, the estimated effect of the collection tube is the expected percent difference in concentration when CSF of the same subject is collected in PP compared to LoB collection tubes, but transferred to the same storage tube of the same volume, with the same number of freeze/thaw cycles.
RESULTS
Run validation and intra-assay variability
We included an extensive run validation before sample analysis in function of the different protocols. Run-validation criteria were met for all runs. Back-calculated concentrations for each calibrator concentration or kit controls were within the predefined acceptance limits.
The intra-assay variability (i.e., variability between concentrations calculated for each OD, replicate measurement) of CSF samples are presented in Supplementary Table 2. The median intra-assay % CV of concentrations was <2.45 and <2.61 for detergent-free and detergent-containing samples, respectively. Intra-assay variability was not affected by selected analyte, the presence of detergent in the sample, their concentrations, or the curve-fit algorithm (4-PL, 5-PL). Concentrations obtained with a 4-PL curve were used for all further data analyses.
The concentration ranges (median, p25, p75) of the CSF samples included in the study are shown in Supplementary Table 3.
Optimizing the quantification of Aβ1-42
Pre-treatment of recipients
Before CSF sample analysis, the impact of a pre-wash step of recipients on sample analysis was optimized (Supplementary Figure 2), resulting in the integration of a pre-wash step in the protocol for sample analysis (Supplementary Figure 3). The integration of a pre-wash step of tubes and 96-well plates in the test procedure with sample diluent resulted in a significant reduction of adsorption of Aβ1-42 to the recipient, independent of the selected recipient type.
Interference of detergent in the assay
Our study verified the impact of detergent on the assay during incubation of samples (or calibrators). Samples are incubated simultaneously with the biotinylated detector antibody (‘BIOTIN’). OD values were lower when 0.05% detergent (Tw20 or TrX100) is present during sample incubation (Fig. 2A). Determined kit control concentrations were identical independent of the selected detergent or when adding the detergent to the calibrator or the “BIOTIN” component.
The overall difference in CSF Aβ1-42 amounted to 32.0 (1.4)% (Mean (SD)) for the TrX100 protocol when CSF results are compared after calibration against a non-detergent or detergent-containing calibrator series. In contrast, when detergent is added to ‘BIOTIN’ during incubation of calibrators and CSF, no difference in CSF Aβ1-42 is noted compared to incubation with ‘BIOTIN’ without extra addition of detergent (Fig. 2B). Results were comparable when Tw20 was used as detergent (data not shown).
Since our study design included different CSF compositions (no detergent, Tw20, TrX100) and the fact that no (major) difference in function of the selected detergent was observed, we performed all CSF analyses with ‘BIOTIN’ to which 0.05% (final concentration) Tw20 was added. It was the major goal of our study to optimize the collection procedures and not to determine absolute differences.
Optimization of the CSF collection procedure
Figure 3 shows standardized mean concentrations for each CSF protocol, ordered from the highest to the lowest standardized concentration. Protocol 7 was considered as the reference for further analysis. Details of the effect sizes and p-values are described in Supplementary Table 4 and Supplementary Table 5.
When looking at the effect of the protocols without the addition of detergent (left side, blue scales) on the Aβ isoform concentrations, protocol 7 indeed resulted in the highest mean concentration, together with protocol 8. Both protocols use LoB collection and storage tubes and have no additional freeze-thaw cycle.
The addition of identical volumes of CSF to storage LoB tubes of different sizes (protocol 8 versus protocol 7) did not influence the concentration of any of the analytes significantly. An additional freeze/thaw cycle (protocols 9 and 10) has no or only a minor effect, depending on the isoform (max –7.7% (–2.6, –12.9%) for Aβ1-42).
Changing the collection tube to PP (protocols 1 and 2) also has no or only a moderate effect depending on the analyte (max –11.8% (–7.5, –15.9%) for Aβ1-42). However, when also the storage tube (second tube) is changed to PP (protocols 3 and 4), larger decreases in concentrations are observed. Furthermore, adding an additional freeze/thaw cycle (protocol 5 and 6) resulted in a larger decrease in concentration as for the protocols with LoB storage tubes (max –62.4% (–60.4, –64.2% for Aβ1-42). Also the effect of using tubes with higher volumes is stronger.
In general, the quantified changes in protein concentration in function of the different steps in the collection procedure are greater for Aβ1-42 compared to the other analytes. Aβ1-42/Aβ1-40 ratios are more robust to changes in the CSF protocol compared to Aβ1-42. The Aβ1-42/Aβ1-40 ratio almost levels the effect of an additional freeze/thaw cycle and of the CSF volume in PP storage tubes (no significant differences among protocols 3, 4, 5, and 6).Also the effect of a PP storage tube compared to a LoB storage tube is attenuated. The effect of an additional freeze/thaw cycle in a LoB storage tube (protocol 9 and 10) disappears when using the Aβ1-42/Aβ1-40 ratio. The Aβ1-42/Aβ1-38 ratio also attenuates the effects of changes to the CSF protocol, albeit to a lesser extent than the Aβ1-42/Aβ1-40ratio.
In contrast, the presence of detergent in CSF in the collection tube showed no effect on the result of Aβ concentration determination, except for a few small differences as described further.
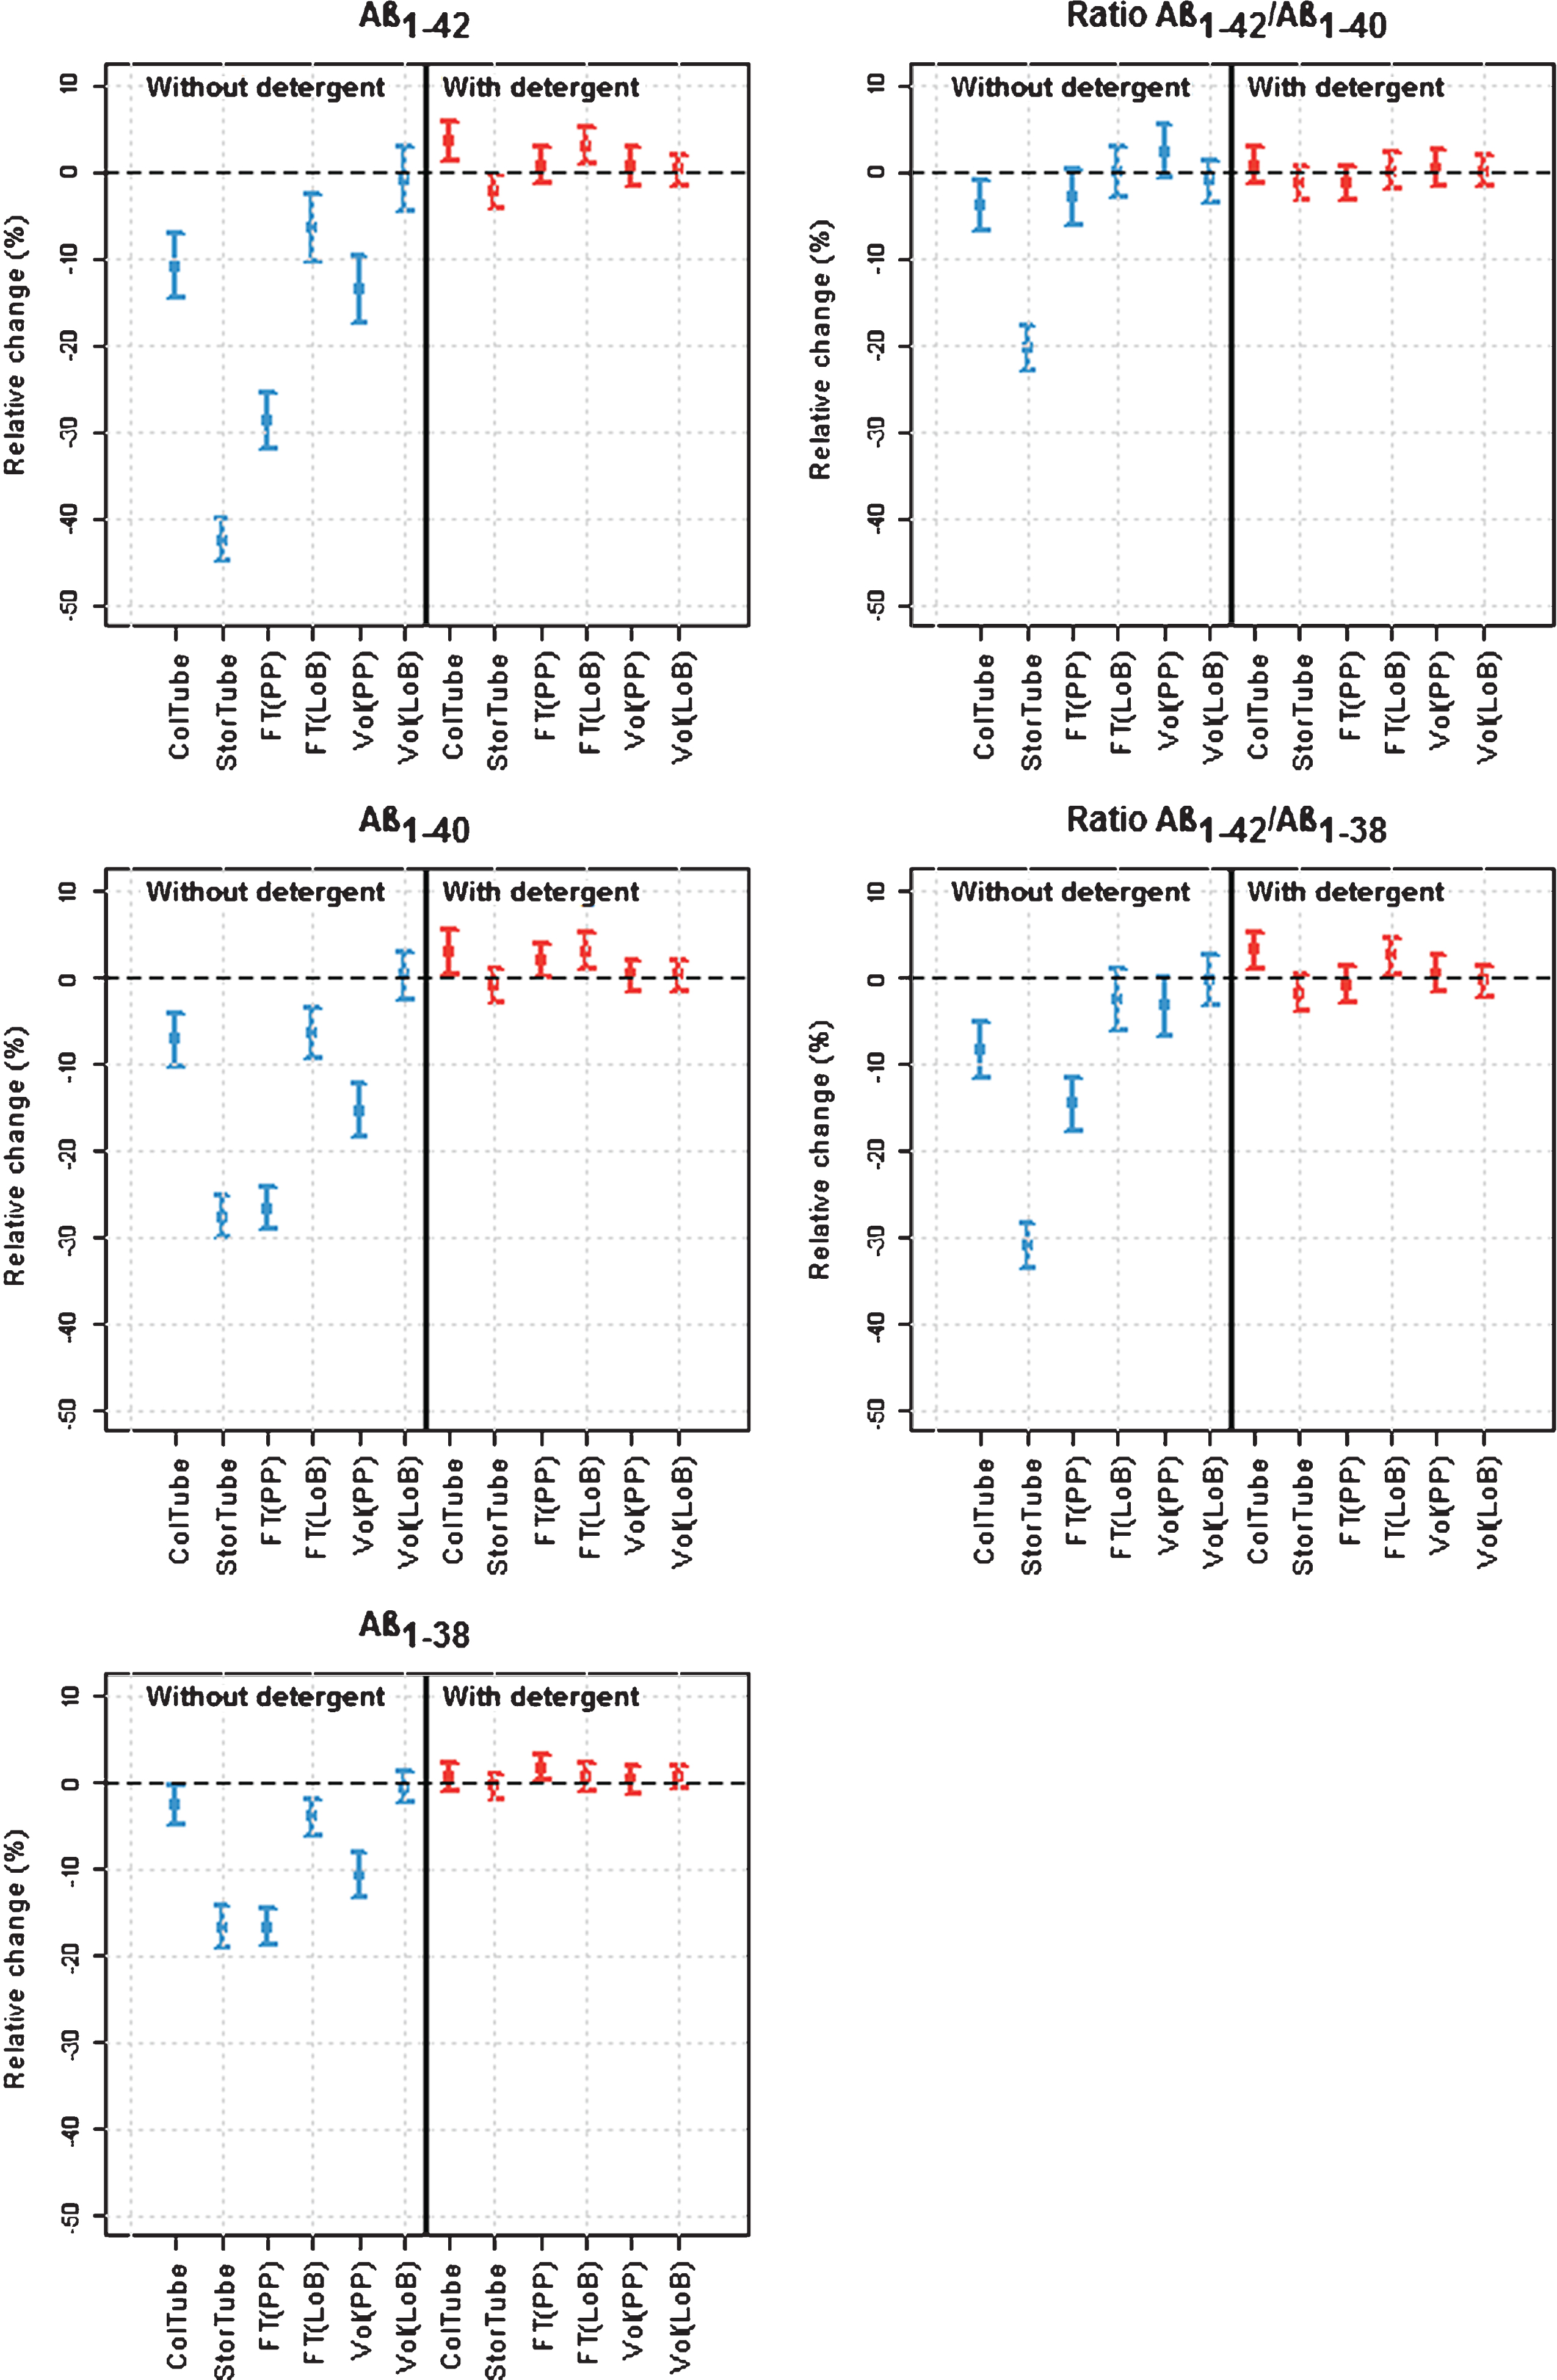
In the second analysis (Fig. 4, Supplementary Table 5), the effects of the different factors and their relationship were estimated for each analyte and the relevant ratios. In the absence of detergent, it was shown that collection of CSF in PP tubes resulted in significantly lower concentrations compared to collection in LoB tubes for all Aβ analytes, amounting to 11.0%, 7.3%, and 2.7% for Aβ1-42, Aβ1-40, and Aβ1-38, respectively. When using the ratio of Aβ isoforms, the difference was only 4.0% for Aβ1-42/Aβ1-40, in contrast to 8.6% for the Aβ1-42/Aβ1-38 ratio. The transfer to a PP storage tube had a larger effect and decreased the concentration by 42.5%, 27.8%, and 16.7% for Aβ1-42, Aβ1-40, and Aβ1-38, respectively. When using the ratio of Aβ isoforms, the difference was 20.4% for Aβ1-42/Aβ1-40 and 31.0% for the Aβ1-42/Aβ1-38 ratio.
The effects of freezing and tube volume were dependent on the storage tube type. An additional freeze-thaw cycle reduced CSF Aβ levels by more than 25% for Aβ1-42 and Aβ1-40, and to a lesser extent for Aβ1-38 (16.7%) in a PP tube. The ratio Aβ1-42/Aβ1-40 was not significantly affected by the extra freeze-thaw cycle, whereas the ratio Aβ1-42/Aβ1-38 showed a decrease by 14.7%. In contrast to PP tubes, the effect of freezing was almost absent when LoB storage tubes were used.
The model revealed significant effects for Aβ1-42 (–13.6%), Aβ1-40 (–15.5%), and Aβ1-38 (–10.6%), in function of the tube volume, an effect being dependent on the storage tube type. The ratio Aβ1-42/Aβ1-40 was not significantly affected by the larger volume, whereas the ratio Aβ1-42/Aβ1-38 showed a decrease by 3.4% (p = 0.0478). In contrast to PP tubes, the effect was not significant for LoB storage tubes.
With the addition of detergent at the time of CSF collection, most effects were leveled. However, in some cases opposite effects were observed and measured concentrations were increased by a maximum of 5%. This is the case for an additional freeze/thaw cycle in PP tubes [Aβ1-38 (p = 0.0307), Aβ1-40 (p = 0.0474)] and LoB tubes [Aβ1-40 (p < 0.001), Aβ1-42 (p < 0.001), ratio Aβ1-42/Aβ1-38 (p = 0.0291)], a PP compared to LoB collection tube [(Aβ1-40 (p = 0.036), Aβ1-42 (p < 0.001), and the ratio Aβ1-42/Aβ1-38 (p < 0.001)], and a PP compared to LoB storage tube [Aβ1-42 (p = 0.0314)]. For the ratio Aβ1-42/Aβ1-40, none of the factors significantly affected the Aβ levels in the presence of detergent.
Post-analytics: Recovery of Aβ1-42 from recipients
This set of experiments was performed to verify whether the loss of immunoreactivity after storage is related to a degradation of the analyte or to the adsorption of the analyte to the walls of the tubes. Treatment of individual tubes with CSF, collected in the absence of detergent, with 0.002, 0.01, or 0.05% Tw20 resulted in a dose-dependent recovery of Aβ1-42 from the recipients. Optimal results were already obtained with Tw20 at a concentration of 0.01% (v/v) (Supplementary Figure 4). We could not recover Aβ1-42 from recipients by using Guanidinium-HCl as the extraction medium (data not shown).
DISCUSSION
Procedures to quantify Aβ isoforms in CSF have been optimized with ELISAs that used optimized CSF volumes C = No matrix interference (at the time of sample incubation) to limit previously published matrix interferences [13, 14]. The present paper demonstrates that adsorption of Aβ1-42 to recipients can be reduced considerably by using low binding tubes, pre-wash of recipients with detergent-containing buffers, and by integration of the ratio Aβ1-42/Aβ1-40 in the work flow. While addition of detergent to CSF collection tubes resulted in an almost complete absence of variations of the results of the test protocols, it might increase the complexity of its use in a routine clinical environment. The rate of adsorption to PP recipients is much higher for Aβ1-42 than for the other Aβ isoforms. The Aβ1-42/Aβ1-40 ratio is less affected by changes in the CSF protocol as compared to Aβ1-42 alone. This ratio limited the effect of additional freeze/thaw cycles and the effect of CSF volumes in PP storage tubes. The use of ‘low binding’ tubes reduced the loss of Aβ when aliquoting CSF or after additional freeze/thaw cycles. Adsorption of Aβ to recipients after serial transfer (Protocol 5, 6) can be reduced by addition of detergent to storage tubes.
Several publications reported protocols for CSF analysis [5, 6, 15–17]. In some cases, the recommendations must be taken with caution due to (i) insufficient details on experimental procedures, (ii) an inadequate statistical approach for data analysis, and (iii) not considering the interplay between different interfering factors. Optimization of sample test procedures needs a multi-factorial approach; the importance of confounding factors must be balanced against their effect on subject classification [18]. On the other hand, pre-analytical standardization of CSF analysis requires native biological samples since other matrices can react differently in function of the applied experimental procedures, as shown by Bjerke et al. [19].
Adsorption of Aβ1-42 to glass, polystyrene, or even polypropylene was already documented more than two decades ago. Other biomarkers, such as tau, were less affected [20, 21]. Perret-Liaudet et al. [22] revealed that most polypropylene tubes are composed of co-polymers, containing at least polyethylene and anti-oxidantia. Aβ1-42 adsorption occurred fast, measurable within 15 min of storage–an effect not augmented by longer incubation times. Our results extended the observation of Lewczuk et al. [12] who showed that the ratio of Aβ1-42/Aβ1-40 (either using Aβ1-specific or AβN-specific mAbs) in CSF is less dependent on recipient type (polycarbonate, (modified) polystyrene) than Aβ1-42 alone. Adsorption problems described by Toombs et al. [23] could have been solved by inclusion of a pre-wash step of recipients with detergent-containing buffers as documented here.
The addition of detergents, which are considered temporary blockers, or other components during sample collection and processing can (i) have a detrimental effect on the analysis of other analytes by modifying the equilibrium between protein-bound or free analyte in the CSF, (ii) influence the ratio of Aβ isoforms which are known to possess different hydrophobicity characteristics, (iii) affect sample homogeneity, (iv) change commutability results with a reference method, or (v) influence inter-center variability. Sample homogeneity (as verified using the intra-assay variability) was not modified in our study by the presence of detergent in the sample.
Ultimately, the addition of detergents can change biomarker concentrations, which requires the establishment of new cut-off values. Previously, it was shown that detergent added to commercial CSF rever-sed adsorption problems of AβN-42 [24], improved inter-day reproducibility in CSF for AβN-42, but not for AβN-40, AβN-38, or tau proteins [25], increased Aβ1-42 concentrations [26], resulted in better recoveries after additional freeze-thaw cycles [14], and had no effect on the diagnostic accuracy to identify subjects with AD [26]. The latter study supports the idea that the addition of detergent to CSF of control and AD subjects will result in a comparable effect on the equilibrium between protein-bound and matrix-free analyte in CSF, independent of the disease state of the subject or absolute concentrations of Aβ1-42, as such resulting in comparable group separations or clinical value.
Differences in surface characteristics of recipients (e.g., tubes, tips, pre-handling materials) can explain part of the problems linked to inter-center variability [27]. In contrast to Toombs et al. [28], the present results showed only a minor (less than 6.2%) difference in analyte concentrations in function of the addition of identical volume of CSF in polypropylene tubes of different sizes (not in low binding tubes). Tube filling volumes did not influence measured concentrations of tau and P-tau in CSF [29]. Technical details of these studies are often missing.
The ratio of Aβ isoforms can become a more robust biomarker than Aβ1-42, not only at the analytical level, but also clinically, as they can predict progression from mild cognitive impairment to AD [30] or improve differential diagnosis [10, 11, 31].
There are some limitations to our study protocol. The study was performed with two different detergents. Since no significant differences were found between the selected detergents, data were analyzed assuming the detergents had an identical effect. The study was performed with an ad-hoc design that has limitations to study the interplay among several factors. Among the tested procedures, there was no protocol using a collection LoB tube and a PP storage tube. As such, the reported effect of the storage tube type should be interpreted as the effect after collection in a PP tube. The additional freeze/thaw cycle was only performed in protocols with the same collection and storage tube type. A possible association between the effects of freezing and a different collection and storage tube cannot be evaluated. The sample analysis was done with one assay design for a specific analyte. It will be important for future use of the presented collection procedures to document their impact on CSF concentrations of the tau proteins (total tau, phosphorylated tau), which have been included in guidance criteria for dementia diagnosis.
In conclusion, the study provides recommendations for a future international standard operating procedure for CSF analysis:
– Use recipients with qualified low protein binding properties during sample handling.
– It is recommended to limit the dead volume (free space) in the tubes.
– Integrate the ratio of Aβ1-42/Aβ1-40 in the analysis.
– Do not include detergent at the time of collection of CSF in order to limit potential problems for other analytes (e.g., tau, synapse proteins) or for bridging with the reference methods, which are under development.
– Verify adsorption problems for recipients. If needed, integrate a pre-wash step.
– Taking into account their clinical value, the recommendations promise to speed-up the worldwide standardization for CSF AD biomarker analysis.
ACKNOWLEDGMENTS
The study was supported by the Swedish Research Council, the Strategic Research Area MultiPark (Multidisciplinary Research in Parkinson’s disease) at Lund University, the Swedish Brain Foundation, The Swedish Alzheimer foundation, Åke Wiberg Foundation, and the Swedish federal government under the ALF agreement. The funding sources had no role in the design and conduct of the study, in the collection, analysis, interpretation of the data, nor in the preparation, review, or approval of the manuscript.
Authors’ disclosures available online (http://www.j-alz.com/manuscript-disclosures/16-0286r1).
Appendices
The supplementary material is available in the electronic version of this article: http://dx.doi.org/10.3233/JAD-160286.
REFERENCES
[1] | European Medicines Agency ((2011) ) Qualification opinion of Alzheimer’s disease novel methodologies/biomarkers for BMS-708163. http://www.ema.europa.eu/docs/en_GB/document_library/Regulatory_and_procedural_guideline/2011/02/WC500102018.pdf. |
[2] | U.S. Food and Drug Administration. Drug Development Tools (DDT) Letters of Support. http://www.fda.gov/Drugs/DevelopmentApprovalProcess/ucm434382.htm |
[3] | Dubois B , Feldman HH , Jacova C , Hampel H , Molinuevo JL , Blennow K , DeKosky ST , Gauthier S , Selkoe D , Bateman R , Cappa S , Crutch S , Engelborghs S , Frisoni GB , Fox NC , Galasko D , Habert M-O , Jicha GA , Nordberg A , Pasquier F , Rabinovici G , Robert P , Rowe C , Salloway S , Sarazin M , Epelbaum S , de Souza LC , Vellas B , Visser PJ , Schneider L , Stern Y , Scheltens P , Cummings JL ((2014) ) Advancing research diagnostic criteria for Alzheimer’s disease: The IWG-2 criteria. Lancet Neurol 13: , 614–629. |
[4] | McKhann GM , Knopman DS , Chertkow H , Hyman BT , Jack CR Jr , Kawas CH , Klunk WE , Koroshetz WJ , Manly JJ , Mayeux R , Mohs RC , Morris JC , Rossor MN , Scheltens P , Carrillo MC , Thies B , Weintraub S , Phelps CH ((2011) ) The diagnosis of dementia due to Alzheimer’s disease: Recommendations from the National Institute on Aging-Alzheimer’s Association workgroups on diagnostic guidelines for Alzheimer’s disease. Alzheimers Dement 7: , 263–269. |
[5] | Blennow K , Hampel H , Weiner M , Zetterberg H ((2010) ) Cerebrospinal fluid and plasma biomarkers in Alzheimer disease. Nat Rev Neurol 6: , 131–144. |
[6] | Vanderstichele H , Bibl M , Engelborghs S , Le Bastard N , Lewczuk P , Molinuevo JL , Parnetti L , Perret-Liaudet A , Shaw LM , Teunissen C , Wouters D , Blennow K ((2012) ) Standardization of preanalytical aspects of cerebrospinal fluid biomarker testing for Alzheimer’s disease diagnosis: A consensus paper from the Alzheimer’s Biomarkers Standardization Initiative. Alzheimers Dement 8: , 65–73. |
[7] | Engelborghs S , De Vreese K , Van de Casteele T , Vanderstichele H , Van Everbroeck B , Cras P , Martin J-J , Vanmechelen E , De Deyn PP ((2008) ) Diagnostic performance of a CSF-biomarker panel in autopsy-confirmed dementia. Neurobiol Aging 29: , 1143–1159. |
[8] | Palmqvist S , Zetterberg H , Mattsson N , Johansson P , Alzheimer’s Disease Neuroimaging Initiative, Minthon L , Blennow K , Olsson M , Swedish BioFINDER, Study Group, Hansson O ((2015) ) Detailed comparison of amyloid PET and CSF biomarkers for identifying early Alzheimer disease. Neurology 85: , 1240–1249. |
[9] | Parnetti L , Chiasserini D , Eusebi P , Giannandrea D , Bellomo G , De Carlo C , Padiglioni C , Mastrocola S , Lisetti V , Calabresi P ((2012) ) Performance of Aβ1-40, Aβ1-42, total tau, and phosphorylated tau as predictors of dementia in a cohort of patients with mild cognitive impairment. J Alzheimers Dis 29: , 229–238. |
[10] | Janelidze S , Zetterberg H , Mattsson N , Palmqvist S , Vanderstichele H , Lindberg O , van Westen D , Stomrud E , Minthon L , Blennow K , for the Swedish BioFINDER study group, Hansson O ((2016) ) CSF Aβ42/Aβ40 and Aβ42/Aβ38 ratios: Better diagnostic markers of Alzheimer disease. Ann Clin Transl Neurol 3: , 154–165. |
[11] | Struyfs H , Van Broeck B , Timmers M , Fransen E , Sleegers K , Van Broeckhoven C , De Deyn P , Streffer JR , Mercken M , Engelborghs S ((2015) ) Diagnostic accuracy of cerebrospinal fluid amyloid-β isoforms for early and differential dementia diagnosis. J Alzheimers Dis 45: , 813–822. |
[12] | Lewczuk P , Beck G , Esselmann H , Bruckmoser R , Zimmermann R , Fiszer M , Bibl M , Maler JM , Kornhuber J , Wiltfang J ((2006) ) Effect of sample collection tubes on cerebrospinal fluid concentrations of tau proteins and amyloid β peptides. Clin Chem 52: , 332–334. |
[13] | Bjerke M , Portelius E , Minthon L , Wallin A , Anckarsäter H , Anckarsäter R , Andreasen N , Zetterberg H , Andreasson U , Blennow K ((2010) ) Confounding factors influencing amyloid Beta concentration in cerebrospinal fluid. Int J Alzheimers Dis 2010: , pii:986310. |
[14] | Cullen VC , Fredenburg RA , Evans C , Conliffe PR , Solomon ME ((2012) ) Development and advanced validation of an optimized method for the quantitation of Aβ42 in human cerebrospinal fluid. AAPS J 14: , 510–518. |
[15] | Le Bastard N , De Deyn PP , Engelborghs S ((2015) ) Importance and impact of preanalytical variables on Alzheimer disease biomarker concentrations in cerebrospinal fluid. Clin Chem 61: , 734–743. |
[16] | Teunissen CE , Verwey NA , Kester MI , van Uffelen K , Blankenstein MA ((2010) ) Standardization of assay procedures for analysis of the CSF biomarkers amyloid β(1-42), tau, and phosphorylated tau in Alzheimer’s disease: Report of an International Workshop. Int J Alzheimers Dis 2010: , pii: 635053. |
[17] | Zimmermann R , Lelental N , Ganslandt O , Maler JM , Kornhuber J , Lewczuk P ((2011) ) Preanalytical sample handling and sample stability testing for the neurochemical dementia diagnostics. J Alzheimers Dis 25: , 739–745 . |
[18] | Niemantsverdriet E , Goossens J , Struyfs H , Martin J-J , Goeman J , De Deyn PP , Vanderstichele H , Engelborghs S ((2016) ) Diagnostic impact of cerebrospinal fluid biomarker (pre-) analytical variability in Alzheimer’s disease. J Alzheimers Dis 51: , 97–106. |
[19] | Bjerke M , Andreasson U , Kuhlmann J , Portelius E , Pannee J , Lewczuk P , Umek RM , Vanmechelen E , Vanderstichele H , Stoops E , Lewis J , Vandijck M , Kostanjevecki V , Jeromin A , Salamone SJ , Schmidt O , Matzen A , Madin K , Eichenlaub U , Bittner T , Shaw LM , Zegers I , Zetterberg H , Blennow K ((2015) ) Assessing the commutability of reference material formats for the harmonization of amyloid beta measurements. Clin Chem Lab Med. doi: 10.1515/cclm-2015-0733 |
[20] | Andreasen N , Hesse C , Davidsson P , Minthon L , Wallin A , Winblad B , Vanderstichele H , Vanmechelen E , Blennow K ((1999) ) Cerebrospinal fluid β-amyloid(1-42) in Alzheimer disease: Differences between early-and late-onset Alzheimer disease and stability during the course of disease. Arch Neurology 56: , 673–680. |
[21] | Vanderstichele H , Blennow K , D’Heuvaert N , Buyse M-A , Wallin A , Andreasen N , Seubert P , Van de Voorde A , Vanmechelen E ((1998) ) Development of a specific diagnostic test for measurement of β-amyloid (1-42) [βA4(1-42)] in CSF. In Progress in Alzheimer’s and Parkinson’s Diseases, Fisher A , Hanin I , Yoshida M , eds. Plenum Press, New York, pp. 773–778. |
[22] | Perret-Liaudet A , Pelpel M , Tholance Y , Dumont B , Vanderstichele H , Zorzi W , ElMoualij B , Schraen S , Moreaud O , Gabelle A , Thouvenot E , Thomas-Anterion C , Touchon J , Krolak-Salmon P , Kovacs GG , Coudreuse A , Quadrio I , Lehmann S ((2012) ) Cerebrospinal fluid collection tubes: A critical issue for Alzheimer disease diagnosis. Clin Chem 58: , 787–789. |
[23] | Toombs J , Paterson RW , Schott JM , Zetterberg H ((2014) ) Amyloid-beta 42 adsorption following serial tube transfer. Alzheimers Res Ther 6: , 5. |
[24] | Pica-Mendez AM , Tanen M , Dallob A , Tanaka W , Laterza OF ((2010) ) Nonspecific binding of Aβ42 to polypropylene tubes and the effect of Tween-20. Clin Chim Acta 411: , 1833. |
[25] | Toombs J , Paterson RW , Nicholas JM , Petzold A , Schott JM , Zetterberg H ((2015) ) The impact of Tween 20 on repeatability of amyloid β and tau measurements in cerebrospinal fluid. Clin Chem Lab Med 53: , e329–e332. |
[26] | Berge G , Lauridsen C , Sando SB , Holder DJ , Møller I , Aasly JO , Bråthen G , Savage MJ , White LR ((2015) ) Effect of Tween-20 on core biomarkers measured in cerebrospinal fluid from patients with Alzheimer’s disease, mild cognitive impairment, or healthy control individuals. J Alzheimers Dis 49: , 493–502. |
[27] | Mattsson N , Andreasson U , Persson S , Carrillo MC , Collins S , Chalbot S , Cutler N , Dufour-Rainfray D , Fagan AM , Heegaard NHH , Hsiung G-YR , Hyman B , Iqbal K , Lachno DR , Lleó A , Lewczuk P , Molinuevo JL , Parchi P , Regeniter A , Rissman R , Rosenmann H , Sancesario G , Schröder J , Shaw LM , Teunissen CE , Trojanowski JQ , Vanderstichele H , Vandijck M , Verbeek MM , Zetterberg H , Blennow K , Käser SA Alzheimer’s Association QC Program Work Group. ((2013) ) CSF biomarker variability in the Alzheimer’s Association QC program work group. Alzheimers Dement 9: , 251–261. |
[28] | Toombs J , Paterson RW , Lunn MP , Nicholas JM , Fox NC , Chapman MD , Schott JM , Zetterberg H ((2013) ) Identification of an important potential confound in CSF AD studies: Aliquot volume. Clin Chem Lab Med 51: , 2311–2317. |
[29] | Leitão MJ , Baldeiras I , Herukka S-K , Pikkarainen M , Leinonen V , Simonsen AH , Perret-Liaudet A , Fourier A , Quadrio I , Veiga PM , de Oliveira CR ((2015) ) Chasing the effects of pre-analytical confounders - a multicenter study on CSF-AD Biomarkers. Front Neurol 6: , 153. |
[30] | Vanderstichele H , De Meyer G , Andreasen N , Kostanjevecki V , Wallin A , Olsson A , Blennow K , Vanmechelen E ((2005) ) Amino-Truncated β-amyloid42 peptides in cerebrospinal fluid and prediction of progression of mild cognitive impairment. Clin Chem 51: , 1650–1660. |
[31] | Lewczuk P , Lelental N , Spitzer P , Maler JM , Kornhuber J ((2015) ) Amyloid-β 42/40 cerebrospinal fluid concentration ratio in the diagnostics of Alzheimer’s disease: Validation of two novel assays. J Alzheimers Dis 43: , 183–191. |
Figures and Tables
Fig.1
CSF collection protocol. PP, polypropylene, LoB, Low binding; F/T, freeze/thaw cycle; CSF, cerebrospinal fluid. Materials; LoB tubes from Eppendorf: 5 mL: Code: 0030108302; 1.5 mL: Code: 0030108116; 0.5 mL: 0030108094; PP tubes from Sarstedt: 5 mL: 62.554.502; 1.5 mL: 72.706; 0.5 mL: 72.730.006.
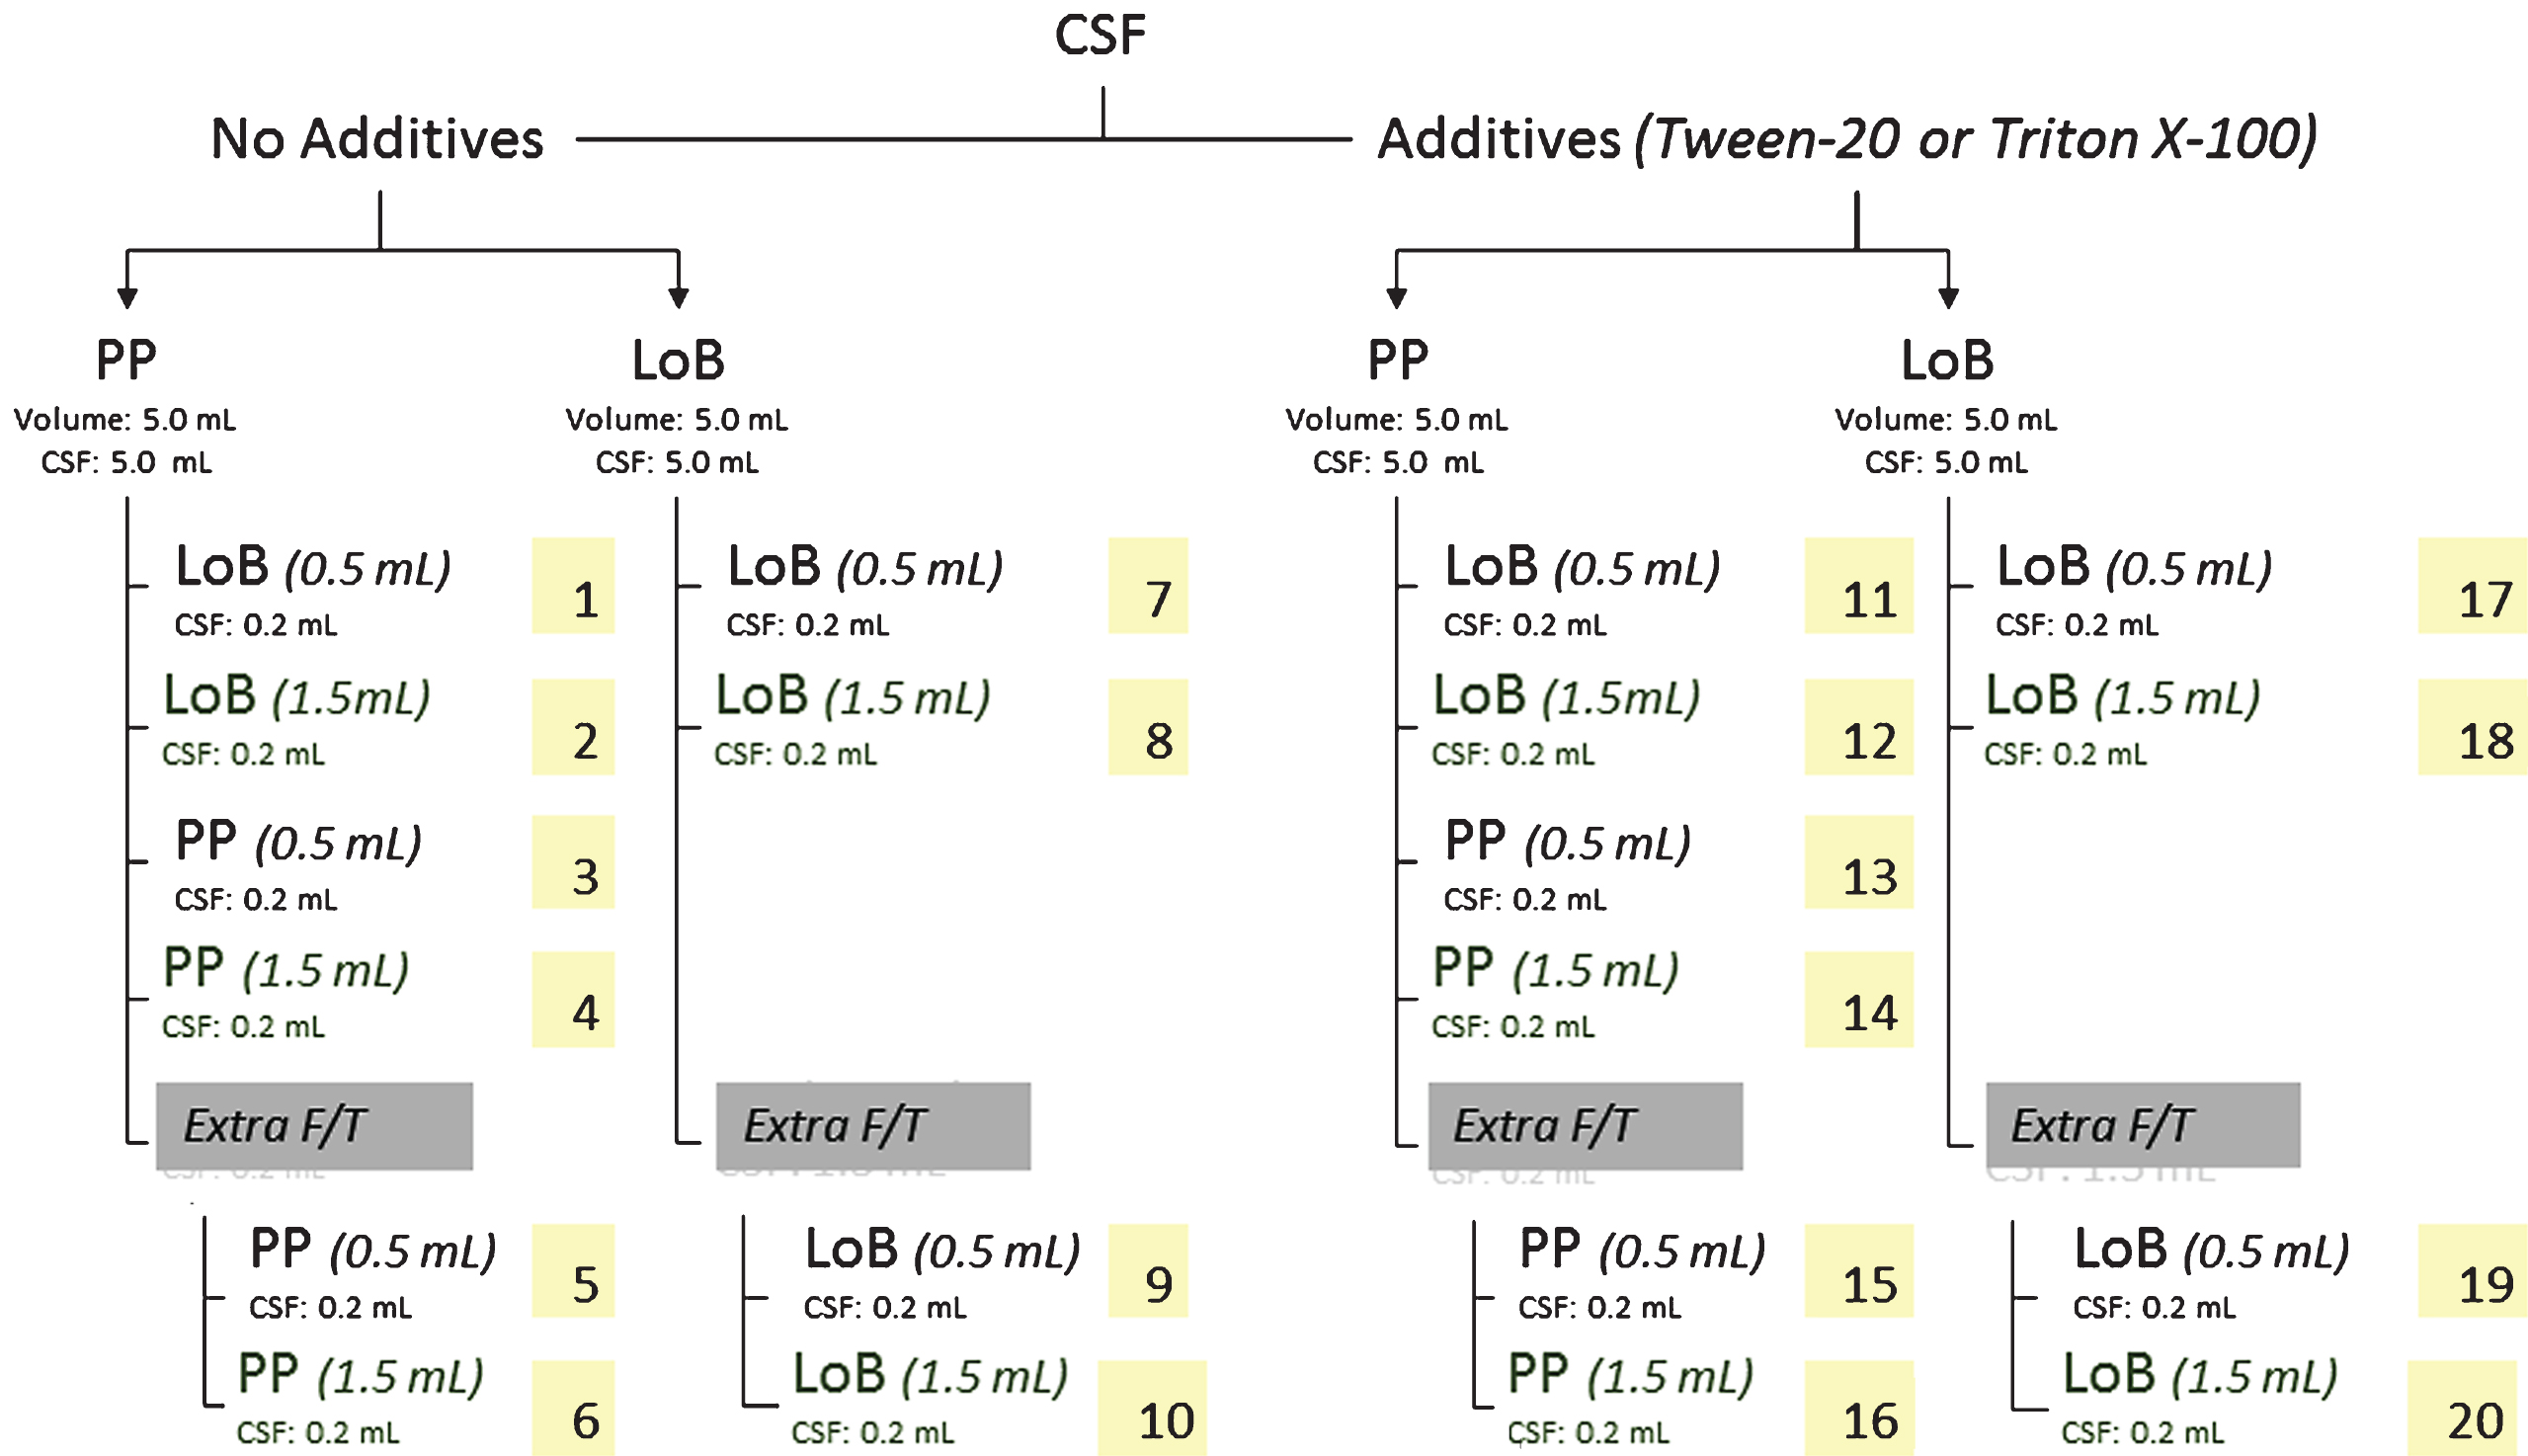
Fig.2
A) Effect of 0.05% detergent on the Aβ1-42 calibration curve. A representative calibration curve is presented. Each point of the curve is the mean of duplicate OD values. The addition of detergent (Tw20 or TrX100) to calibrators only reduced OD values, which can result in higher calculated analyte concentrations in CSF as compared to the use of calibrators without extra addition of a detergent (Results were confirmed several times). B) Effect of addition of detergent to ‘BIOTIN’ or in CSF collection tubes on CSF Aβ1-42 concentration. Addition of detergent to the “BIOTIN” component (= biotinylated antibody, incubated simultaneously with samples or calibrators) resulted in a reduction in OD values for samples and calibrators. In addition, CSF in which detergent was added at the time of collection showed higher OD values as compared to CSF without detergent. This was due to an effect on the equilibrium between protein-bound and free analyte in the biological matrix, resulting in higher analyte concentrations. As shown by the vertical lines, no difference in concentration is obtained when an assay with detergent in “BIOTIN” is compared to an assay performed without the addition of detergent, for each type of sample.
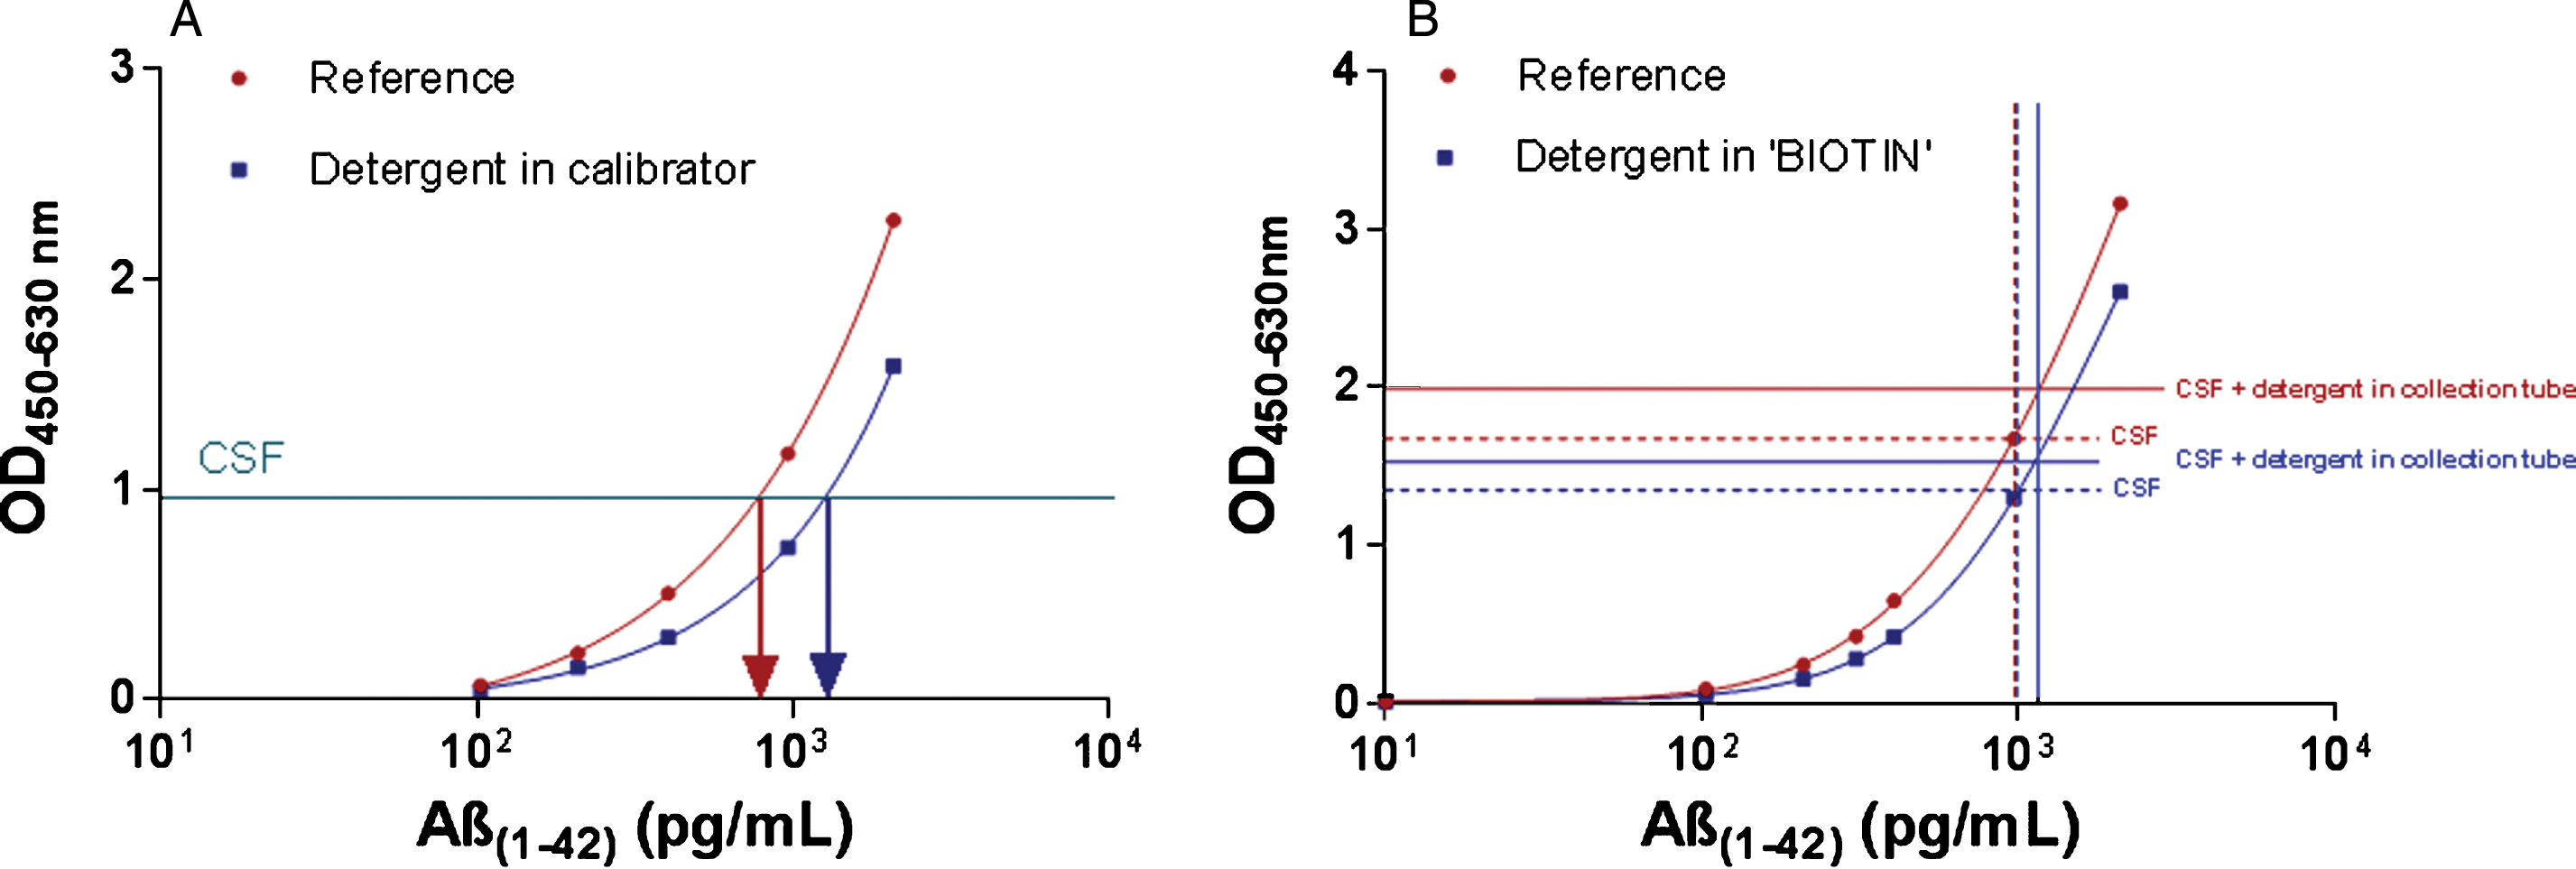
Fig.3
Standardized mean concentration for each CSF protocol and analyte. Standardized mean concentrations (±95% confidence intervals) for each CSF protocol, ordered from the highest to the lowest standardized concentration using protocol 7 as the reference. Numbers on the x-axis are linked to the numbers in the collection protocol (Fig. 1). Effect sizes and p-values are described in Supplementary Table 4. LoB, low binding; PP, polypropylene.
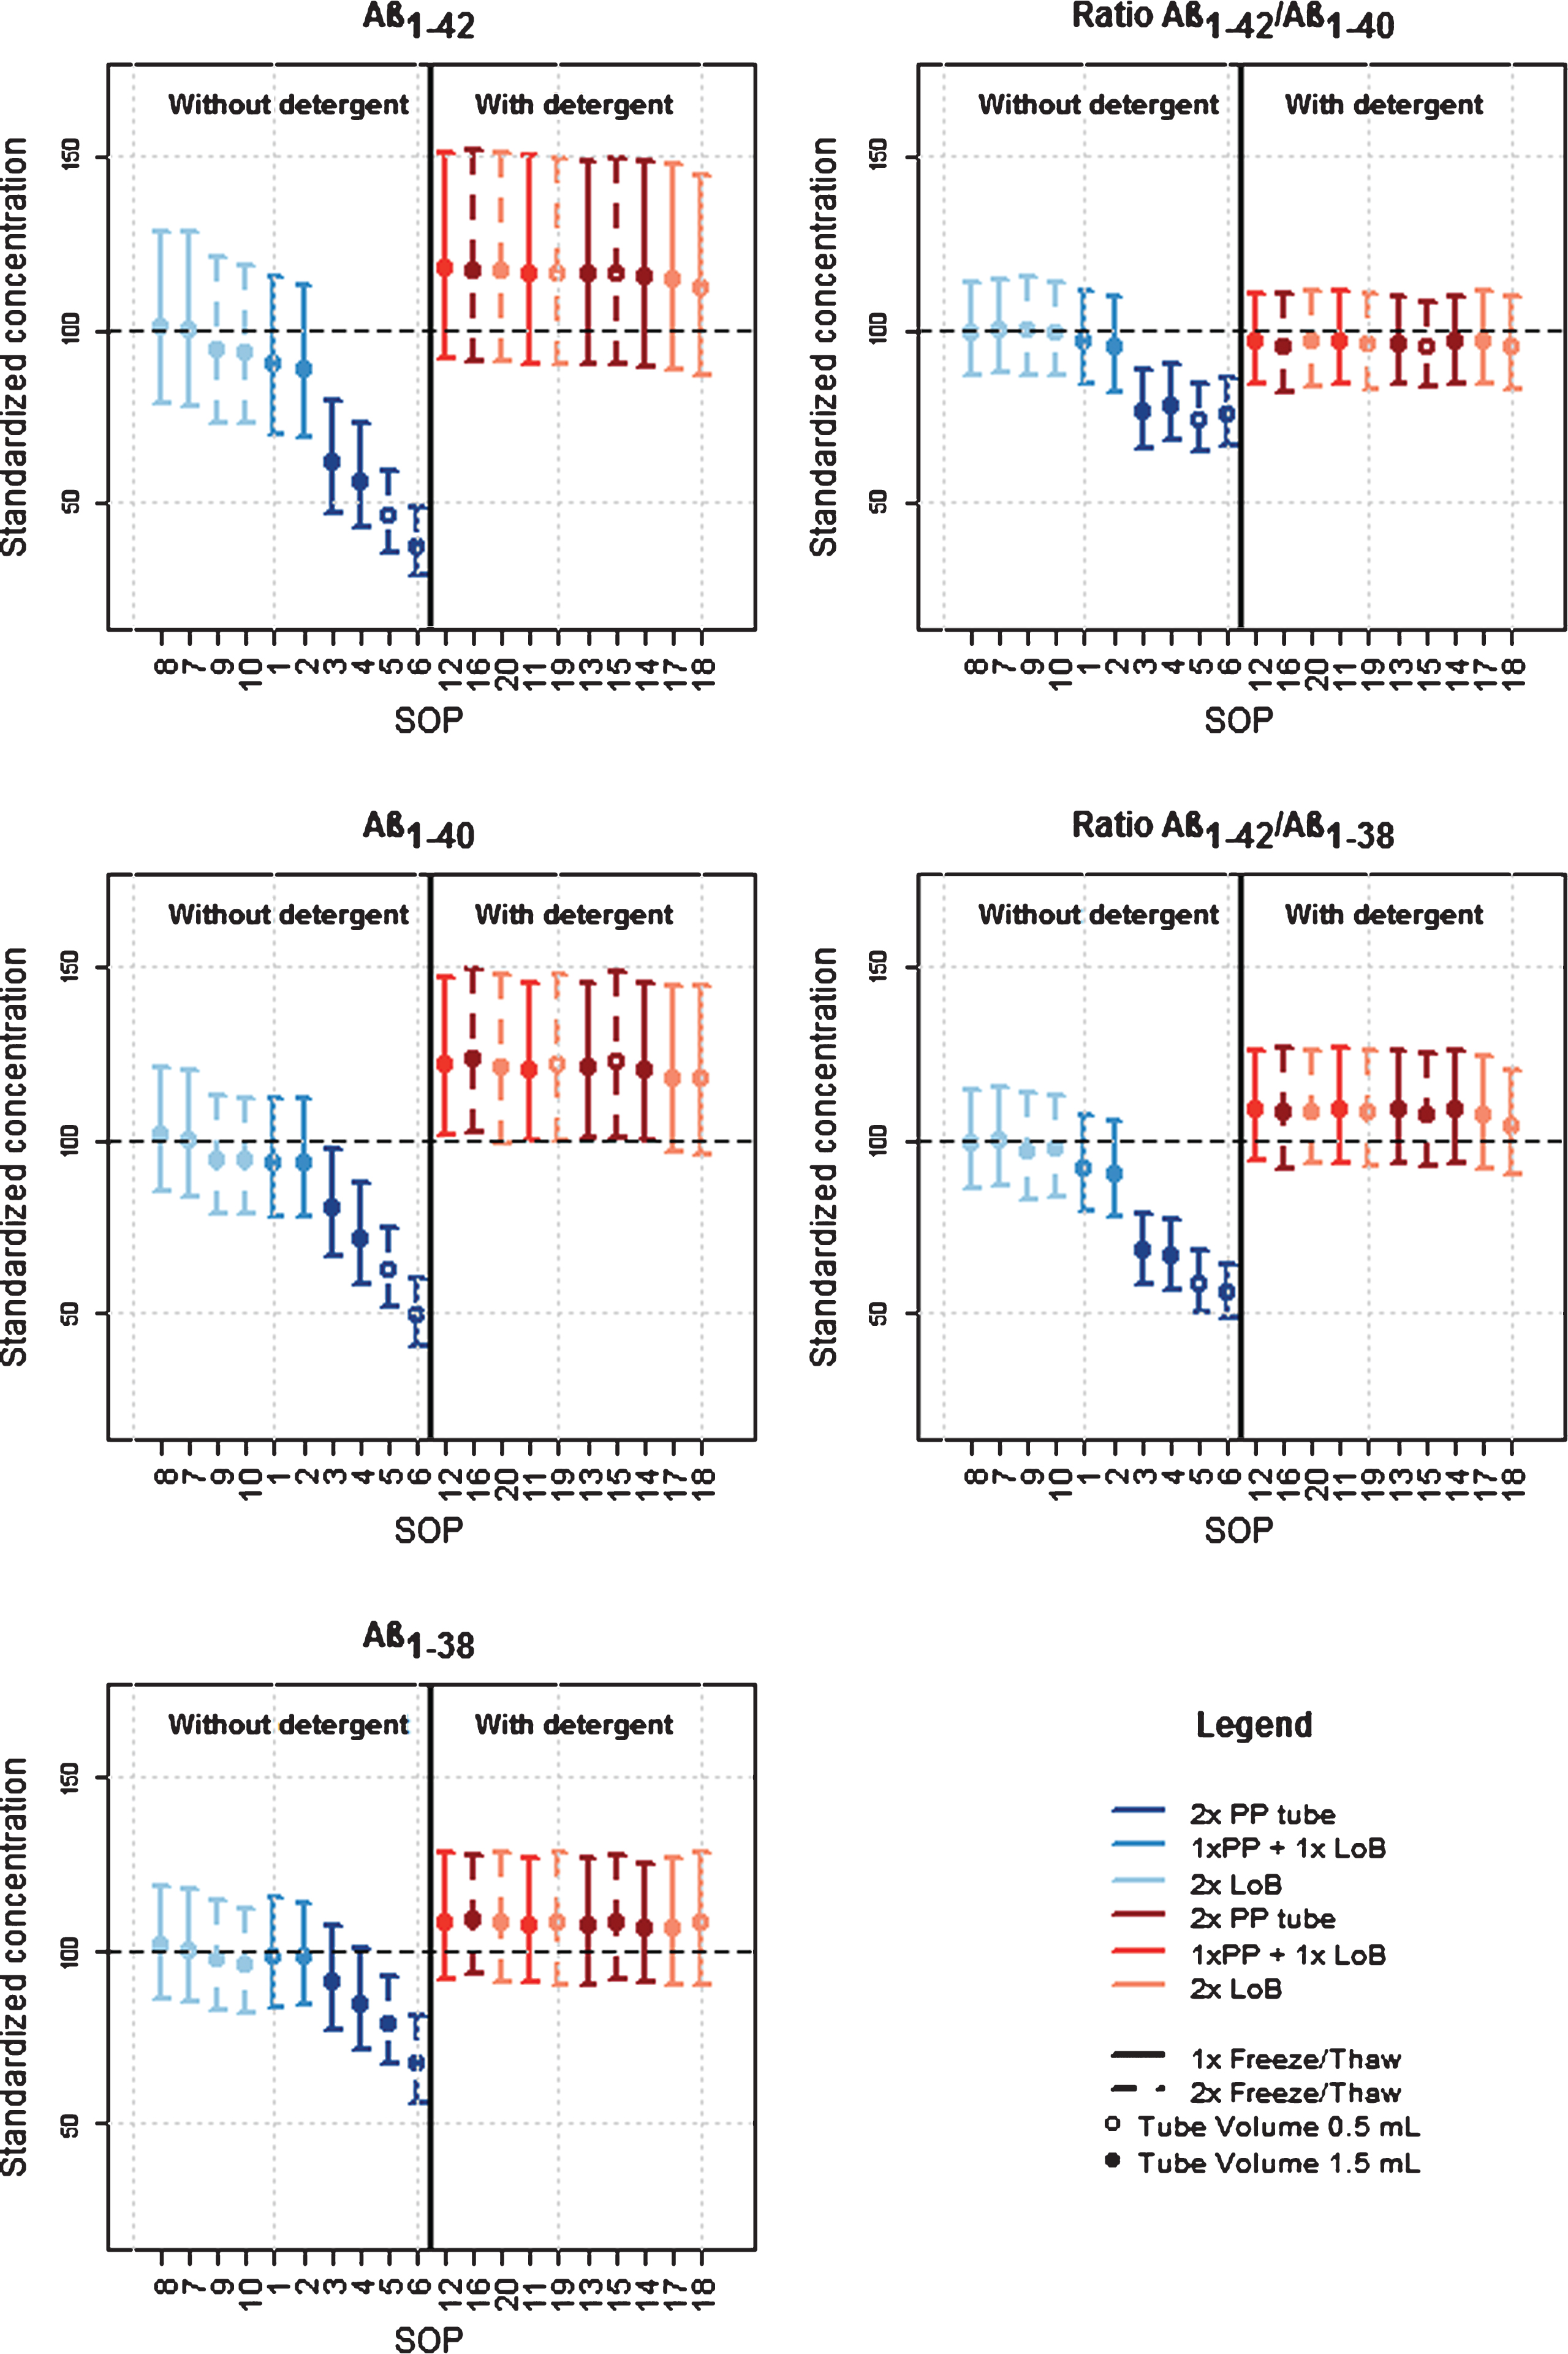
Fig.4
Effects of different factors and their relationship for each analyte or their ratios. Results are shown as mean ± 95% confidence intervals for each factor in the analysis; LoB, low binding; PP, polypropylene; col, collection; FT, Freeze-thaw; Stor, storage; vol, volume.