
Diagnostic Impact of Cerebrospinal Fluid Biomarker (Pre-)Analytical Variability in Alzheimer’s Disease
Abstract
Intra- and inter-laboratory variability of cerebrospinal fluid (CSF) biomarker analyses remains an important issue. We investigated the clinical-diagnostic impact of CSF biomarker concentration shifts in mild cognitive impairment (MCI) and autopsy-confirmed Alzheimer’s disease (AD) dementia patients. MCI patients (n = 85), autopsy-confirmed AD dementia patients (n = 72), and cognitively healthy controls (n = 100) were included in this prospective, longitudinal study. AD dementia patients were followed up until death, and controls were included from 1992 until 2003. In-house validated cutoff values of biomarkers were applied: Aβ1-42 <638.5 pg/mL, T-tau>296.5 pg/mL, P-tau181P >56.5 pg/mL. Both increments and decrements (from ± 5% to ± 40% ) were added to the true (=observed) CSF biomarker values, imitating the anticipated differences in biomarker concentrations. Within certain limits, the clinical diagnostic performance of AD CSF biomarkers remains largely unchanged and clinical diagnostic accuracy deviated less than 8.2% from the reference when concentration shifts ranging between –20% and +20% were added to one of the three CSF biomarkers in MCI and autopsy-confirmed AD patients. Notwithstanding the fact that (pre- and post-)analytical parameters can affect the clinical classification, the present exploratory study provides evidence that for a specific context of use, the impact on clinical accuracy of biomarker concentration shifts might be lower than originally expected. In conclusion, induced shifts of ±20% in only one of the three biomarkers has limited impact on the clinical accuracy of AD CSF biomarkers in MCI and autopsy-confirmed AD patients when using the IWG-2 criteria.
INTRODUCTION
Amyloid-β of 42 amino acids (Aβ1-42), total tau protein (T-tau), and tau phosphorylated at threonine 181 (P-tau181P) are qualified cerebrospinal fluid (CSF) biomarkers to identify subjects with (prodromal) Alzheimer’s disease (AD) [1–5].
Nowadays, CSF Aβ and tau proteins can reliably be analyzed with several analytical techniques, including but not limited to the classic single-analyte ELISAs or multi-analyte tests based on xMAP technology [6–11]. The overall clinical accuracy for using above mentioned biomarkers is, besides the population of the selected subjects, affected by the method of measurement, which is in part a combination of assay precision and bias (assay accuracy) (Supplementary Figure 1). Lot-to-lot variation remains an important issue for worldwide integration of cutoff values. Lot-to-lot variability for Aβ1-42 accounted for 22% (ELISA) and 10% (xMAP) of the overall variability [12]. The delivery to the market of assays with low lot-to-lot variability is the accountability of the vendor of the assays [13, 14], while the reliability of the generated concentrations, which is linked to the qualification of the lab and the operators who perform the assays, is the accountability of the end-user [15]. Intra-laboratory variability is also most pronounced for Aβ1-42 as demonstrated by coefficients of variation (CV) in a recent study using ELISA (Aβ1-42: 14.4% , T-tau: 8.5% , P-tau181P: 12.6% ) [14]. The same study reported largest inter-laboratory variability values for P-tau181P (Aβ1-42: 7.3% , T-tau: 6.7% , P-tau181P: 27.6% ) [14], whereas a former study also demonstrated largest inter-laboratory variability values for Aβ1-42 [12].
Intra- and inter-laboratory variability of these CSF biomarker analyses, together with an absolute value assignment for the markers, remains an important issue for their further integration into clinical routine [12, 15–18]. In order to reduce CSF biomarker variability, several international initiatives to standardize (pre-)analytical steps of CSF biomarker analyses are running [19–21]. As the clinical relevance of CSF biomarker variability has not yet been investigated in extenso, we have set up an exploratory study to determine the impact of differences in CSF biomarker levels on the diagnostic performance in mild cognitive impairment (MCI) subjects and autopsy-confirmed AD dementia patients. The size of the shifts were selected to reflect anticipated differences in biomarker levels due to (pre-)analytical conditions. A CSF biomarker profile was considered to be pathological if the CSF Aβ1-42 concentration was below the cutoff, in combination with T-tau and/or P-tau181P values above the cutoff (IWG-2 criteria). The present exploratory study should be considered as technology-independent statements.
MATERIALS AND METHODS
Study population
Seventy-two dementia patients with autopsy-confirmed AD, 85 patients with MCI and clinical follow-up, and 100 cognitively healthy controls were included. Patients were recruited through the Memory Clinic of Hospital Network Antwerp, Middelheim, and Hoge Beuken, and through centers referring to the Biobank of the Institute Born-Bunge as described before [1]. Data including gender, age at time of CSF sampling, age at conversion to AD dementia (in case of the MCI group), and age at death (if applicable) were available for the majority of the patients.
The inclusion criteria for the control group were: (1) no neurological or psychiatric antecedents and (2) no organic disease involving the central nervous system following extensive clinical examination. The control group consisted of patients with mechanical low back pain requiring a selective lumbar radiculography (n = 25), patients with disorders of the peripheral nervous system (polyneuropathy, peripheral facial nerve palsy) (n = 10), and patients with subjective complaints in whom disorders of the central and peripheral nervous system were ruled out by means of an extensive clinical work-up (n = 65).
MCI patients were diagnosed applying Petersen’s diagnostic criteria [22], i.e., (1) cognitive complaint, preferably corroborated by an informant; (2) objective cognitive impairment, quantified as performance of more than 1.5 SD below the appropriate mean on the neuropsychological subtests; (3) largely normal general cognitive functioning; (4) essentially intact activities of daily living (basic and instrumental activities of daily living were determined by a clinical interview with the patient and an informant); and (5) not demented. Based on clinical follow-up the MCI group consisted of patients who were still diagnosed as MCI at follow-up (stable MCI group; n = 38) and patients who progressed to AD dementia (progressive MCI group; n = 47).
AD dementia was diagnosed according to the NINCDS/ADRDA criteria [23]. All neuropathological diagnoses of AD were established according to neuropathological criteria of Montine [24] by the same neuropathologist (JJM) who was blinded for biomarker results. The neuropathological examination was performed on the right hemisphere of the brain as previously described [1, 8].
Part of the study results have been published previously [1]. This study was approved by the ethics committee of UAntwerp, Antwerpen, Belgium. Informed consent was obtained from all patients.
CSF sampling and storage
The samples were collected at Middelheim General Hospital and centers referring to the Biobank of the Institute Born-Bunge according to standard collection protocols as described previously [1]. CSF was obtained by lumbar puncture (LP) at the L3/L4 or L4/L5 interspace. MCI patients underwent LP at baseline as part of their diagnostic work-up. CSF samples were collected in polypropylene vials (Nalgene cat.no.5000–1020 (1.5 mL) and 5000–0050 (4.5 mL)), immediately frozen in liquid nitrogen, and subsequently stored at –75°C until analysis.
CSF analyses and interpretation of CSF biomarker results
CSF levels of Aβ1-42, T-tau, and P-tau181P were determined with commercially available single-analyte ELISA kits (INNOTEST® β-AMYLOID (1-42) , INNOTEST® hTAU-Ag, and INNOTEST® PHOSPHO-TAU (181P) ; Fujirebio Europe). Results of autopsy-confirmed AD patients and controls have been published previously [1], and have been combined with a series of MCI subjects. In principle, the outcome of this study is independent on the method of measurement and can be applied to other immunoassay methods for the same variables. For each assay run, tests were performed as described earlier [1]. The only difference with the formerly published protocol was that the threshold of acceptance for intra-assay variation was decreased to 20% (calculated as (max-min) x 100/average). The laboratory technician was blinded for the clinical and definitive pathological diagnoses when performing the tests. The concentration ranges of the test kits are described in the package inserts (Aβ1-42: 125-2000 pg/mL, T-tau: 75-1200 pg/mL, P-tau181P: 15.6–500 pg/mL). The three CSF biomarker levels were interpreted based on cutoff values, selected as the maximal sum of sensitivity and specificity [25], to discriminate independent sets of autopsy-confirmed AD patients and age-matched cognitively healthy elderly: Aβ1-42 <638.5 pg/mL, T-tau >296.5 pg/mL, P-tau181P >56.5 pg/mL [26]. Consistent with the IWG-2 criteria for AD [27], a CSF biomarker profile was considered to be pathological if the CSF Aβ1-42 value was <638.5 pg/mL, in combination with T-tau values >296.5 pg/mL and/or P-tau181P values >56.5 pg/mL.
Induced biomarker concentration shift exercise
Both increments and decrements (from ±5% to ±40%) were added to the true (=observed) CSF biomarker values of the definite AD, MCI, and control subjects to estimate the impact of an induced concentration shift on the clinical classification. The added concentration shifts of only one of the three CSF biomarkers was investigated. For example, if Aβ1-42 values were increased or decreased, the other two markers were analyzed with their true CSF biomarker values.
The effect of concentration shifts was investigated by recalculating the sensitivity, specificity, and clinical diagnostic accuracy (Supplementary Figure 2) values to discriminate autopsy-confirmed AD from controls, and to discriminate between progressive MCI and stable MCI, using the above mentioned CSF biomarker cutoffs and the CSF biomarker IWG-2 criteria for AD [26, 27]. Results were reported as relative difference with respect to the reference diagnostic sensitivity, and specificity, obtained with the true biomarker concentrations.
Statistical analyses
Statistical analyses were performed using IBM SPSS Statistics 22 and GraphPad Prism 6. To describe and analyze our entire cohort, categorical variables were analyzed with a chi-square test, and percentages were reported. Demographic comparisons were based on one-way Anova tests with Bonferroni Posthoc tests, or in case of no normal distribution, Mann Whitney U tests. Mean values with standard deviations were reported. For all analyses, p-values below 0.05 were considered significant. Diagnostic performance of the CSF biomarkers was estimated by diagnostic accuracy (sensitivity and specificity).
RESULTS
Population (Table 1)
There was no significant difference in the proportion of gender in the AD, MCI, and control groups (p = 0.924). The control group was significantly younger at inclusion than the AD and MCI groups (p < 0.001), but the MCI and AD groups were age-matched. The interval between clinical inclusion and autopsy was short in most AD cases as 56 of the 71 CSF samples were taken within one year preceding death (mean ± SD, 0.8 ± 1.4 years). In the MCI group, the follow-up term was based on inclusion date and last clinical evaluation, resulting in an average of three years (mean ± SD, 3.4 ± 2.5 years). For all three biomarkers, no significant differences were found in average biomarker levels between the control subjects and the MCI stable group. Comparing the AD patients with progressive MCI patients and the progressive MCI patients with the stable MCI patients, no significant difference with regard to average P-tau181 levels were found, whereas average Aβ1-42 and T-tau levels significantly differed between the latter groups.
CSF analyses and diagnostic performance of CSF biomarkers
AD versus healthy control subjects (Figs. 1 and 2, and Supplementary Tables 1–3)
For the applied context of use, namely the identification of an AD biomarker profile, no major difference in clinical diagnostic performance of the CSF biomarker IWG-2 criteria for AD was observed for a range of induced differences in concentration to one of the three true biomarker values. Indeed, shifts in true analyte concentrations resulted in a deviation of clinical diagnostic accuracy of less than 5% (Fig. 1). Only if Aβ1-42 concentrations were decreased with 40% and 30% shifts, the clinical diagnostic accuracy deviated 6.4% and 5.3% of the reference, respectively (Fig. 1). The smallest effects on clinical diagnostic performance were observed for an induced shift of P-tau181P compared to the other two biomarkers (Fig. 1). The effects of induced concentration shifts are higher when one considers sensitivity or specificity (Fig. 2, Supplementary Tables 1–3).
Progressive MCI versus stable MCI (Figs. 3 and 4, and Supplementary Tables 4–6)
When considering the true values of the three CSF biomarkers, the sensitivity, specificity, and clinical diagnostic accuracy of conversion from MCI to AD dementia within the MCI groups were 68.1% , 79.0% , and 72.9% , respectively. A shift in true analyte concentrations of one of the three biomarkers between –20% and +20% resulted in a deviation of clinical diagnostic accuracy for discriminating progressive from stable MCI of less than 8.2% (Fig. 3). Moreover, the clinical diagnostic performance of induced concentration shifts of T-tau or P-tau181P deviated not more than 2.4% from the reference if ±40% shifts were added to the true CSF biomarker data of T-tau or P-tau181P, whereas the clinical diagnostic accuracy of a shift in Aβ1-42 was lower and deviated up to 15.2% from the reference in the same range of induced shifts. The effects were higher when one considers sensitivity or specificity (Fig. 4, Supplementary Tables 4–6).
Effect of concentration shifts at the individual patient level (Supplementary Table 7)
A change of diagnostic category, based on an AD CSF biomarker profile (abnormal/normal), was investigated for each individual separately. The CSF biomarkers were considered abnormal if suggestive for AD. If a shift in Aβ1-42 level was introduced, we detected the highest number of changes in diagnostic classification based on the CSF biomarker profiles (AD n = 12/72, controls n = 16/100, MCI progressive n = 22/47, MCI stable n = 11/38), whereas only a few changes were found if shifts were induced in the two tau biomarkers. In total, 61 subjects changed in classification if a shift of Aβ1-42 was induced (±40% n = 12, ±30% n = 18, ±20% n = 17, ±10% n = 6, ±5% n = 8). After induced shifts of T-tau 31 subjects changed in classification (±40% n = 9, ±30% n = 6, ±20% n = 6, ±10% n = 4, ±5% n = 6) and for P-tau181P 23 subjects changed with respect to their original classification (±40% n = 6, ±30% n = 4, ±20% n = 7, ±5% n = 6). Nevertheless, if concentration shifts of ± 10% were added to Aβ1-42, T-tau, or P-tau181P, the change in AD biomarker profile was only 5% , 4% , and 3% in the total population (n = 257) for each biomarker, respectively.
DISCUSSION
CSF Aβ1-42, T-tau, and P-tau181P are qualified biomarkers for AD that have been integrated in the IWG-2 diagnostic criteria for (prodromal) AD [27]. The U.S. Food and Drug Administration encourages their use for enrichment in clinical trials as exemplified by the recently published letter of support [28]. Intra- and inter-laboratory variability of these CSF biomarker analyses remains an important issue, as are differences in absolute concentrations when results are generated with different immunoassay formats [12]. Several international initiatives were established to standardize [12, 19, 20] and harmonize (pre-)analytical steps of CSF biomarkers analyses [12, 18, 20, 29, 31]. The overall difference in concentration is a combination of pre-analytical factors (e.g., sample collection and storage, freeze-thaw cycles), the uncertainties at the level of the assay (e.g., precision of the method) and the qualification of the laboratory (Supplementary Figure 1). The analytical accuracy of the clinical classification is further complicated by the absence of an international reference method [32], although major progress was made recently by using a mass spectrometry method for Aβ1-42 [33, 34]. In order to study the clinical-diagnostic impact of a shift in CSF biomarker concentrations, we evaluated the effect for the individual biomarkers in a group of MCI and autopsy-confirmed AD patients.
One multicenter study using single parameter ELISA kits demonstrated that lot-to-lot variability was a major cause of intra-laboratory variability which was most pronounced for Aβ1-42. Inter-laboratory variability mainly affected P-tau levels [14]. Although the impact of variability on the interpretation of individual CSF biomarkers (normal/abnormal) was pronounced (ranging from 10% to 29% ), a change of diagnostic category based on an AD CSF biomarker profile was limited to 12–16% of the cases [14].
In the present study, we demonstrated that the clinical diagnostic accuracy when using AD CSF biomarker concentration values for the three biomarkers [27] remained largely unchanged and above the 80% threshold when ±5% to ±40% shifts in concentration levels were added to one of the three true biomarker values in autopsy-confirmed AD cases. Due to the fact that several hallmarks are linked to the pathophysiology of AD (e.g., plaques, tangles), it is logical to use combinations of different biomarkers for the neurochemical diagnosis of AD. We therefore opted to use the IWG-2 criteria although this meanwhile implies that alterations in one biomarker might be compensated by unaltered levels of the other biomarkers. The approach to integrate a shift in only one analyte at once is linked to the fact that (1) the influence of the well-known pre-analytical variables for CSF biomarker testing is not identical for all analytes, (2) each immunoassay has been designed with a specific set of components and buffers to perform the assay, (3) the characteristics of the analytes with respect to short term stability, freeze-thawing, or absorption, differ between analytes, while (4) many clinical laboratories still use single-analyte immunoassays for the qualification of the CSF biomarkers. However, the impact of concentration shifts in one biomarker on sensitivity and specificity, for example the use of Aβ1-42 to define a cutoff value to identify the presence of amyloidopathy in the brain, was much higher (Figs. 2 and 4). This means that when a laboratory uses a cutoff established in another laboratory, they could be operating with similar clinical diagnostic accuracy but with markedly different sensitivity and specificity. Hence, a proportion of patients (in our study, for Aβ1-42 n = 61/257, T-tau n = 31/257, P-tau181P n = 23/257) would get a different diagnosis in both labs. The present study also shows that the smallest effects were observed for P-tau181P, pointing to the fact that Aβ1-42 and T-tau are more important CSF biomarkers for discrimating AD patients from control subjects. Nevertheless, P-tau181P is a fundamental component of the AD biomarker panel and the combined assessment of Aβ1-42, T-tau, and P-tau181P renders the highest diagnostic power to discriminate between AD and non-AD dementias [35].
Although the running international standardization and harmonization efforts are very valuable, certainly from an analytical point of view, their influence on the clinical diagnostic performance of these CSF biomarkers might be smaller than initially hypothesized. Indeed, applying a concentration shift of ±20% of Aβ1-42 changed the diagnostic biomarker classification (AD patients were no longer identified as such) in 6% of subjects. For T-tau and P-tau181P, respectively 13% and 4% of the AD subjects displayed changed biomarker profile when a shift of ±20% was applied.
The induced variation exercise was performed in very well-characterized (autopsy-confirmed) AD patients, whereas in daily clinical practice, the impact of CSF biomarker shifts might be more important, especially in case of subjects showing biomarker values around the cutoff levels. Therefore, a clinical MCI group was included in our study as well. In this study group, shifts in true biomarker data deviated the clinical diagnostic performance more from the reference than when the comparison was done for the AD dementia patients. In the MCI group, more patients have CSF biomarker values at or around the cutoff values (‘grey zone’ or transition phase) as compared to the AD and control groups. Therefore, in the MCI group as compared to AD and control groups, even a small shift in biomarker levels will lead to a larger number of patients who change from normal to abnormal and vice versa and thus might change from diagnostic category based on the IWG-2 criteria. As such, the impact will be smaller in subjects with a broader difference in values between groups, such as the control subjects and the AD dementia patients. In MCI patients, Aβ1-42 is the most determing factor for clinical diagnostic performance variability. The large effects of induced shifts to CSF Aβ1-42 levels may also be explained by the fact that this biomarker is the most sensitive to the different factors that contribute to the (pre-)analytical variability (Supplementary Figure 1). CSF Aβ1-42 is the most important marker to identify subjects with progressive MCI [5, 36]. Moreover, changes of Aβ1-42 levels can be observed earlier in the time course of the AD continuum than changes of CSF T-tau or P-tau181P levels [37]. One possibility to explore for the future is whether or not the use of the ratios of Aβ isoforms, such as Aβ1-42/Aβ1-40 ratio, might be a more robust biomarker for this type of analysis. By neglecting this ratio the interpretation of the AD CSF biomarkers might lead to false negatives (AD subjects with high Aβ1-42 CSF concentrations) or false positives (non-AD subjects with low Aβ1-42 CSF concentrations). Introducing this ratio will probably overcome this problem by the normalization of Aβ concentrations, and thus improve the diagnostic performance [38, 39]. Another improvement for the neurochemical diagnosis of AD, is the forthcoming automation of the analytical assays [40]. This will further reduce variability when compared with single-parameter ELISA assays described in the Alzheimer’s Association Quality Control (AAQC) program [41].
A potential limitation of this study is the relative young age of the healthy controls, which were not age-matched to the AD subjects. However, the proportion of preclinical AD individuals will be smaller in younger controls than when we would have used an age-matched control group. The CSF samples from the three diagnostic groups have not been analyzed simultaneously, and thus inter-assay variability might be an issue, which is another limitation of this study. A last limitation of this study is that we did not use age-adjusted cutoffs for the three CSF biomarkers.
In conclusion, the clinical diagnostic performance of AD CSF biomarkers remains largely unchanged and clinical diagnostic accuracy deviated less than 8.2% from the reference when shifts ranging between –20% and +20% were added to one of the three CSF biomarkers in MCI and autopsy-confirmed AD patients. Notwithstanding the fact that pre-analytical and analytical parameters can affect the clinical classification, the present exploratory study provides evidence that for a specific context of use, the impact on the clinical accuracy of concentration differences might be lower than originally expected, pointing to the robustness of using CSF biomarkers in a specific clinical context, especially when using a combination of different analytes. Our suggested approach can be used to set boundary conditions for acceptance in shifts of concentrations for biomarkers and reduce ongoing discussions on the difficulty to integrate CSF biomarker analysis in routine clinical practice due to the complexity of CSF collection and/or storage and analytical method (single versus multiple analyte technique).
ACKNOWLEDGMENTS
This research was in part supported by the University Research Fund of the University of Antwerp; the Institute Born-Bunge; the Foundation for Alzheimer Research (SAO-FRA); Neurosearch Antwerp; the Research Foundation - Flanders (FWO); the Agency for Innovation by Science and Technology (IWT); the Interuniversity Attraction Poles (IAP) programme of the Belgian Science Policy Office; the Flemish Government Methusalem excellence program, Belgium; the Flanders Impulse Program on Networks for Dementia Research (VIND). This work is part of the BIOMARKAPD project within the EU Joint Program for Neurodegenerative Disease Research (JPND). This work has received support from the EU/EFPIA Innovative Medicines Initiative Joint Undertaking (EMIF grant ndeg 115372).
Authors’ disclosures available online (http://j-alz.com/manuscript-disclosures/15-0953r1).
Appendices
The supplementary material is available in the electronic version of this article: http://dx.doi.org/10.3233/JAD-150953.
REFERENCES
[1] | Engelborghs S , De Vreese K , Van de Casteele T , Vanderstichele H , Van Everbroeck B , Cras P , Martin JJ , Vanmechelen E , De Deyn PP ((2008) ) Diagnostic performance of a CSF-biomarker panel in autopsy-confirmed dementia. Neurobiol Aging 29: , 1143–1159. |
[2] | Shaw LM , Vanderstichele H , Knapik-Czajka M , Clark CM , Aisen PS , Petersen RC , Blennow K , Soares H , Simon A , Lewczuk P , Dean R , Siemers E , Potter W , Lee VM , Trojanowski JQ , Alzheimer’s Disease Neuroimaging Initiative ((2009) ) Cerebrospinal fluid biomarker signature in Alzheimer’s disease neuroimaging initiative subjects. Ann Neurol 65: , 403–413. |
[3] | Vos SJ , van Rossum IA , Verhey F , Knol DL , Soininen H , Wahlund LO , Hampel H , Tsolaki M , Minthon L , Frisoni GB , Froelich L , Nobili F , van der Flier W , Blennow K , Wolz R , Scheltens P , Visser PJ ((2013) ) Prediction of Alzheimer disease in subjects with amnestic and nonamnestic MCI. Neurology 80: , 1124–1132. |
[4] | Hansson O , Zetterberg H , Buchhave P , Londos E , Blennow K , Minthon L ((2006) ) Association between CSF biomarkers and incipient Alzheimer’s disease in patients with mild cognitive impairment: A follow-up study. Lancet Neurol 5: , 228–234. |
[5] | Blennow K , Dubois B , Fagan AM , Lewczuk P , de Leon MJ , Hampel H ((2015) ) Clinical utility of cerebrospinal fluid biomarkers in the diagnosis of early Alzheimer’s disease. Alzheimers Dement 11: , 58–69. |
[6] | Olsson A , Vanderstichele H , Andreasen N , De Meyer G , Wallin A , Holmberg B , Rosengren L , Vanmechelen E , Blennow K ((2005) ) Simultaneous measurement of beta-amyloid(1-42), total tau, and phosphorylated tau (Thr181) in cerebrospinal fluid by the xMAP technology. Clin Chem 51: , 336–345. |
[7] | Kang JH , Vanderstichele H , Trojanowski JQ , Shaw LM ((2012) ) Simultaneous analysis of cerebrospinal fluid biomarkers using microsphere-based xMAP multiplex technology for early detection of Alzheimer’s disease. Methods 56: , 484–493. |
[8] | Le Bastard N , Coart E , Vanderstichele H , Vanmechelen E , Martin JJ , Engelborghs S ((2013) ) Comparison of two analytical platforms for the clinical qualification of Alzheimer’s disease biomarkers in pathologically-confirmed dementia. J Alzheimers Dis 33: , 117–131. |
[9] | Fagan AM , Shaw LM , Xiong C , Vanderstichele H , Mintun MA , Trojanowski JQ , Coart E , Morris JC , Holtzman DM ((2011) ) Comparison of analytical platforms for cerebrospinal fluid measures of beta-amyloid 1-42, total tau, and p-tau181 for identifying Alzheimer disease amyloid plaque pathology. Arch Neurol 68: , 1137–1144. |
[10] | Jongbloed W , Kester MI , van der Flier WM , Veerhuis R , Scheltens P , Blankenstein MA , Teunissen CE ((2013) ) Discriminatory and predictive capabilities of enzyme-linked immunosorbent assay and multiplex platforms in a longitudinal Alzheimer’s disease study. Alzheimers Dement 9: , 276–283. |
[11] | Reijn TS , Rikkert MO , van Geel WJ , de Jong D , Verbeek MM ((2007) ) Diagnostic accuracy of ELISA and xMAP technology for analysis of amyloid beta(42) and tau proteins. Clin Chem 53: , 859–865. |
[12] | Mattsson N , Andreasson U , Persson S , Carrillo MC , Collins S , Chalbot S , Cutler N , Dufour-Rainfray D , Fagan AM , Heegaard NH , Robin Hsiung GY , Hyman B , Iqbal K , Lachno DR , Lleo A , Lewczuk P , Molinuevo JL , Parchi P , Regeniter A , Rissman R , Rosenmann H , Sancesario G , Schroder J , Shaw LM , Teunissen CE , Trojanowski JQ , Vanderstichele H , Vandijck M , Verbeek MM , Zetterberg H , Blennow K , Kaser SA , Alzheimer’s Association QC Program Work Group ((2013) ) CSF biomarker variability in the Alzheimer’s Association quality controlprogram. Alzheimers Dement 9: , 251–261. |
[13] | Mulder C , Verwey NA , van der Flier WM , Bouwman FH , Kok A , van Elk EJ , Scheltens P , Blankenstein MA ((2010) ) Amyloid-beta(1-42), total tau, and phosphorylated tau as cerebrospinal fluid biomarkers for the diagnosis of Alzheimer disease. Clin Chem 56: , 248–253. |
[14] | Vos SJ , Visser PJ , Verhey F , Aalten P , Knol D , Ramakers I , Scheltens P , Rikkert MG , Verbeek MM , Teunissen CE ((2014) ) Variability of CSF Alzheimer’s disease biomarkers: Implications for clinical practice. PLoS One 9: , e100784. |
[15] | Teunissen CE , Verwey NA , Kester MI , van Uffelen K , Blankenstein MA ((2010) ) Standardization of assay procedures for analysis of the CSF biomarkers amyloid beta((1-42)), tau, and phosphorylated tau in Alzheimer’s disease: Report of an international workshop. Int J Alzheimers Dis, pii: 635053. |
[16] | Shaw LM , Vanderstichele H , Knapik-Czajka M , Figurski M , Coart E , Blennow K , Soares H , Simon AJ , Lewczuk P , Dean RA , Siemers E , Potter W , Lee VM , Trojanowski JQ , Alzheimer’s Disease Neuroimaging Initiative ((2011) ) Qualification of the analytical and clinical performance of CSF biomarker analyses in ADNI. Acta Neuropathol 121: , 597–609. |
[17] | Dumurgier J , Vercruysse O , Paquet C , Bombois S , Chaulet C , Laplanche JL , Peoc’h K , Schraen S , Pasquier F , Touchon J , Hugon J , Lehmann S , Gabelle A ((2013) ) Intersite variability of CSF Alzheimer’s disease biomarkers in clinical setting. Alzheimers Dement 9: , 406–413. |
[18] | Le Bastard N , De Deyn PP , Engelborghs S ((2015) ) Importance and impact of preanalytical variables on Alzheimer disease biomarker concentrations in cerebrospinal fluid. Clin Chem 61: , 734–743. |
[19] | del Campo M , Mollenhauer B , Bertolotto A , Engelborghs S , Hampel H , Simonsen AH , Kapaki E , Kruse N , Le Bastard N , Lehmann S , Molinuevo JL , Parnetti L , Perret-Liaudet A , Saez-Valero J , Saka E , Urbani A , Vanmechelen E , Verbeek M , Visser PJ , Teunissen C ((2012) ) Recommendations to standardize preanalytical confounding factors in Alzheimer’s and Parkinson’s disease cerebrospinal fluid biomarkers: An update. Biomark Med 6: , 419–430. |
[20] | Vanderstichele H , Bibl M , Engelborghs S , Le Bastard N , Lewczuk P , Molinuevo JL , Parnetti L , Perret-Liaudet A , Shaw LM , Teunissen C , Wouters D , Blennow K ((2012) ) Standardization of preanalytical aspects of cerebrospinal fluid biomarker testing for Alzheimer’s disease diagnosis: A consensus paper from the Alzheimer’s Biomarkers Standardization Initiative. Alzheimers Dement 8: , 65–73. |
[21] | Molinuevo JL , Blennow K , Dubois B , Engelborghs S , Lewczuk P , Perret-Liaudet A , Teunissen CE , Parnetti L ((2014) ) The clinical use of cerebrospinal fluid biomarker testing for Alzheimer’s disease diagnosis: A consensus paper from the Alzheimer’s Biomarkers Standardization Initiative. Alzheimers Dement 10: , 808–817. |
[22] | Petersen RC ((2004) ) Mild cognitive impairment as a diagnostic entity. J Intern Med 256: , 183–194. |
[23] | McKhann G , Drachman D , Folstein M , Katzman R , Price D , Stadlan EM ((1984) ) Clinical diagnosis of Alzheimer’s disease: Report of the NINCDS-ADRDA Work Group under the auspices of Department of Health and Human Services Task Force on Alzheimer’s Disease. Neurology 34: , 939–944. |
[24] | Montine TJ , Phelps CH , Beach TG , Bigio EH , Cairns NJ , Dickson DW , Duyckaerts C , Frosch MP , Masliah E , Mirra SS , Nelson PT , Schneider JA , Thal DR , Trojanowski JQ , Vinters HV , Hyman BT , National Institute on Aging, Alzheimer’s Association ((2012) ) National Institute on Aging-Alzheimer’s Association guidelines for the neuropathologic assessment of Alzheimer’s disease: A practical approach. Acta Neuropathol 123: , 1–11. |
[25] | Youden WJ ((1950) ) Index for rating diagnostic tests. Cancer 3: , 32–35. |
[26] | Van der Mussele S , Fransen E , Struyfs H , Luyckx J , Marien P , Saerens J , Somers N , Goeman J , De Deyn PP , Engelborghs S ((2014) ) Depression in mild cognitive impairment is associated with progression to Alzheimer’s disease: A longitudinal study. J Alzheimers Dis 42: , 1239–1250. |
[27] | Dubois B , Feldman HH , Jacova C , Hampel H , Molinuevo JL , Blennow K , DeKosky ST , Gauthier S , Selkoe D , Bateman R , Cappa S , Crutch S , Engelborghs S , Frisoni GB , Fox NC , Galasko D , Habert MO , Jicha GA , Nordberg A , Pasquier F , Rabinovici G , Robert P , Rowe C , Salloway S , Sarazin M , Epelbaum S , de Souza LC , Vellas B , Visser PJ , Schneider L , Stern Y , Scheltens P , Cummings JL ((2014) ) Advancing research diagnostic criteria for Alzheimer’s disease: The IWG-2 criteria. Lancet Neurol 13: , 614–629. |
[28] | http://www.fda.gov/downloads/Drugs/DevelopmentApprovalProcess/UCM439713.pdf. |
[29] | Leitao MJ, Baldeiras I, Herukka SK, Pikkarainen M, Leinonen V, Simonsen AH, Perret-Liaudet A, Fourier A, Quadrio I, Veiga PM, de Oliveira CR ((2015) ) Chasing the effects of pre-analytical confounders – A multicenter study on CSF-AD biomarkers. Front Neurol 6: , 153. |
[30] | Vanderstichele HM , Shaw L , Vandijck M , Jeromin A , Zetterberg H , Blennow K , Teunissen C , Engelborghs S ((2013) ) Alzheimer disease biomarker testing in cerebrospinal fluid: A method to harmonize assay platforms in the absence of an absolute reference standard. Clin Chem 59: , 710–712. |
[31] | Carrillo MC , Blennow K , Soares H , Lewczuk P , Mattsson N , Oberoi P , Umek R , Vandijck M , Salamone S , Bittner T , Shaw LM , Stephenson D , Bain L , Zetterberg H ((2013) ) Global standardization measurement of cerebral spinal fluid for Alzheimer’s disease: An update from the Alzheimer’s Association Global Biomarkers Consortium. Alzheimers Dement 9: , 137–140. |
[32] | Mattsson N , Zegers I , Andreasson U , Bjerke M , Blankenstein MA , Bowser R , Carrillo MC , Gobom J , Heath T , Jenkins R , Jeromin A , Kaplow J , Kidd D , Laterza OF , Lockhart A , Lunn MP , Martone RL , Mills K , Pannee J , Ratcliffe M , Shaw LM , Simon AJ , Soares H , Teunissen CE , Verbeek MM , Umek RM , Vanderstichele H , Zetterberg H , Blennow K , Portelius E ((2012) ) Reference measurement procedures for Alzheimer’s disease cerebrospinal fluid biomarkers: Definitions and approaches with focus on amyloid beta42. Biomark Med 6: , 409–417. |
[33] | Korecka M , Waligorska T , Figurski M , Toledo JB , Arnold SE , Grossman M , Trojanowski JQ , Shaw LM ((2014) ) Qualification of a surrogate matrix-based absolute quantification method for amyloid-beta(4)(2) in human cerebrospinal fluid using 2D UPLC-tandem mass spectrometry. J Alzheimers Dis 41: , 441–451. |
[34] | Leinenbach A , Pannee J , Dulffer T , Huber A , Bittner T , Andreasson U , Gobom J , Zetterberg H , Kobold U , Portelius E , Blennow K , IFCC Scientific Division Working Group on CSF proteins ((2014) ) Mass spectrometry-based candidate reference measurement procedure for quantification of amyloid-beta in cerebrospinal fluid. Clin Chem 60: , 987–994. |
[35] | Struyfs H , Niemantsverdriet E , Goossens J , Fransen E , Martin JJ , De Deyn PP , Engelborghs S ((2015) ) Cerebrospinal fluid P-Tau181P: Biomarker for improved differential dementia diagnosis. Front Neurol 6: , 138. |
[36] | Trojanowski JQ , Hampel H ((2011) ) Neurodegenerative disease biomarkers: Guideposts for disease prevention through early diagnosis and intervention. Prog Neurobiol 95: , 491–495. |
[37] | Sperling RA , Aisen PS , Beckett LA , Bennett DA , Craft S , Fagan AM , Iwatsubo T , Jack CR Jr , Kaye J , Montine TJ , Park DC , Reiman EM , Rowe CC , Siemers E , Stern Y , Yaffe K , Carrillo MC , Thies B , Morrison-Bogorad M , Wagster MV , Phelps CH ((2011) ) Toward defining the preclinical stages of Alzheimer’s disease: Recommendations from the National Institute on Aging-Alzheimer’s Association workgroups on diagnostic guidelines for Alzheimer’s disease. Alzheimers Dement 7: , 280–292. |
[38] | Slaets S , Le Bastard N , Martin JJ , Sleegers K , Van Broeckhoven C , De Deyn PP , Engelborghs S ((2013) ) Cerebrospinal fluid Abeta1-40 improves differential dementia diagnosis in patients with intermediate P-tau181P levels. J Alzheimers Dis 36: , 759–767. |
[39] | Lewczuk P , Lelental N , Spitzer P , Maler JM , Kornhuber J ((2015) ) Amyloid-beta 42/40 cerebrospinal fluid concentration ratio in the diagnostics of Alzheimer’s disease: Validation of two novel assays. J Alzheimers Dis 43: , 183–191. |
[40] | Bittner T , Zetterberg H , Teunissen C , Ostlund R , Militello M , Andersson U , Hubeek I , Gibsone D , Chu D , Eichelauba U , Heiss P , Kobold U , Leinenbach A , Madin K , Manuilova E , Rabe C , Blennow K ((2015) ) Technical performance of a novel, fully automated electrochemiluminescence immunoassay for the quantitation of beta-amyloid (1–42) in human cerebrospinal fluid. Alzheimers Dement. doi: 10.1016/j.jalz.2015.09.009 . |
[41] | Blennow K , Zetterberg H ((2015) ) The Alzheimer’s Association QC program for CSF biomarkers. Round 17 results. Available from: http://neurophys.gu.se/digitalAssets/1525/1525893_2015-17-summary.pdf |
Figures and Tables
Fig.1
Difference in clinical diagnostic accuracy of CSF biomarkers to discriminate autopsy-confirmed AD from healthy control subjects when a shift in concentration was induced to the true (=observed) biomarker analyte values, followed by using the IWG-2 criteria in which the three biomarkers are included.
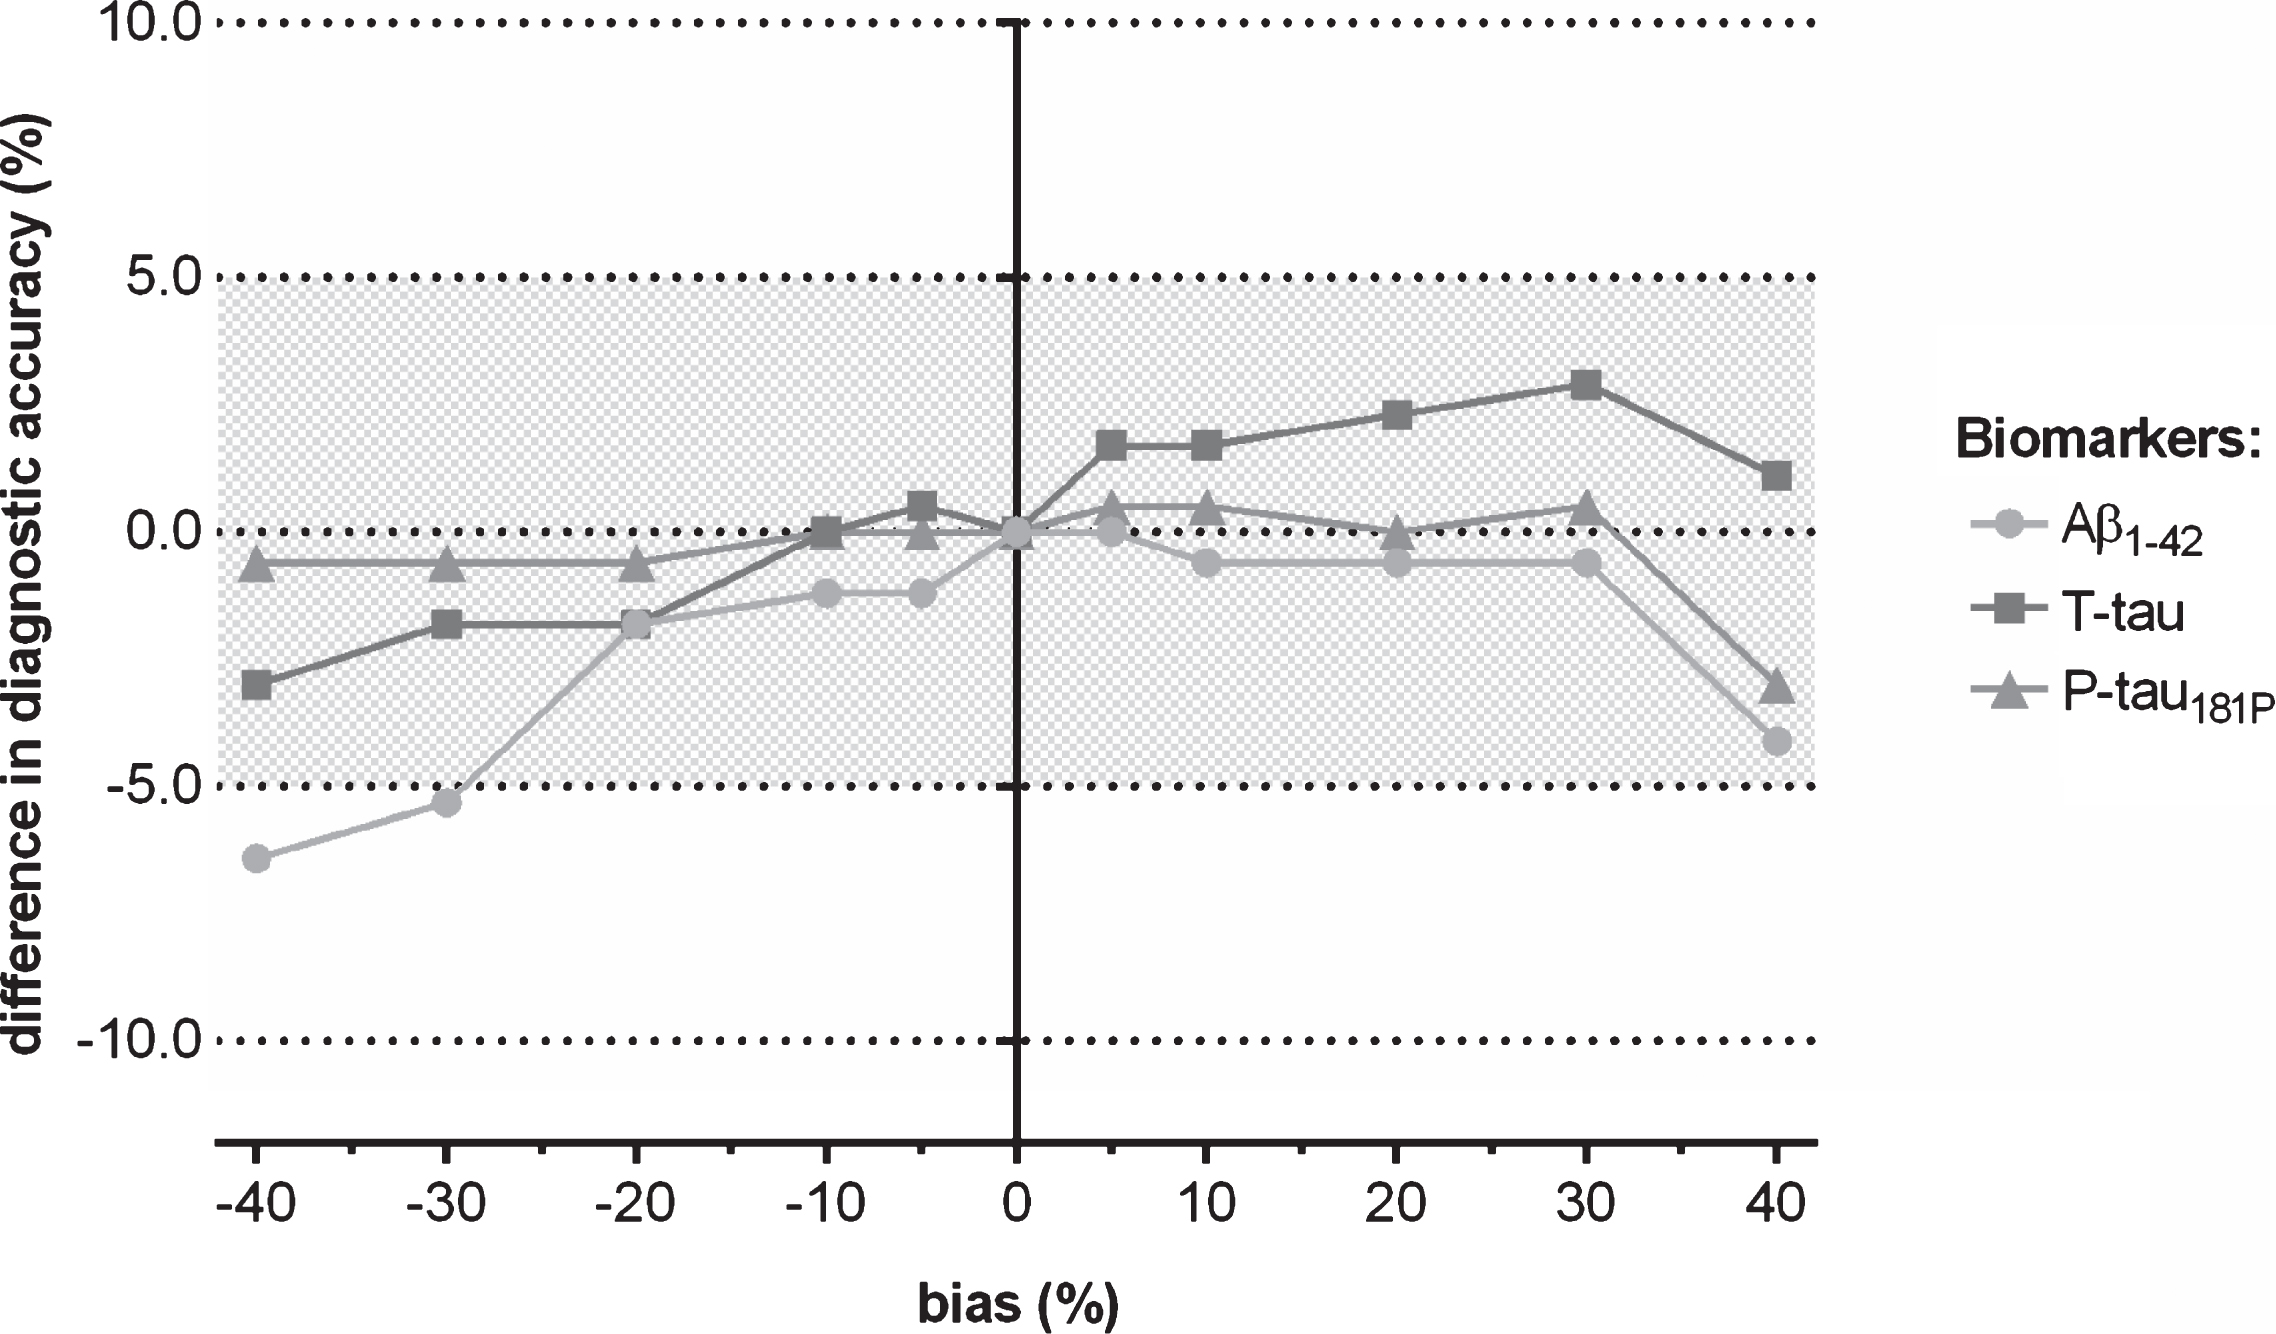
Fig.2
Difference in the diagnostic parameters (sensitivity, specificity, and accuracy) of CSF biomarkers to discriminate autopsy-confirmed AD from healthy control subjects when a shift in concentration was induced to Aβ1-42, followed by using the IWG-2 criteria in which the three biomarkers are included.
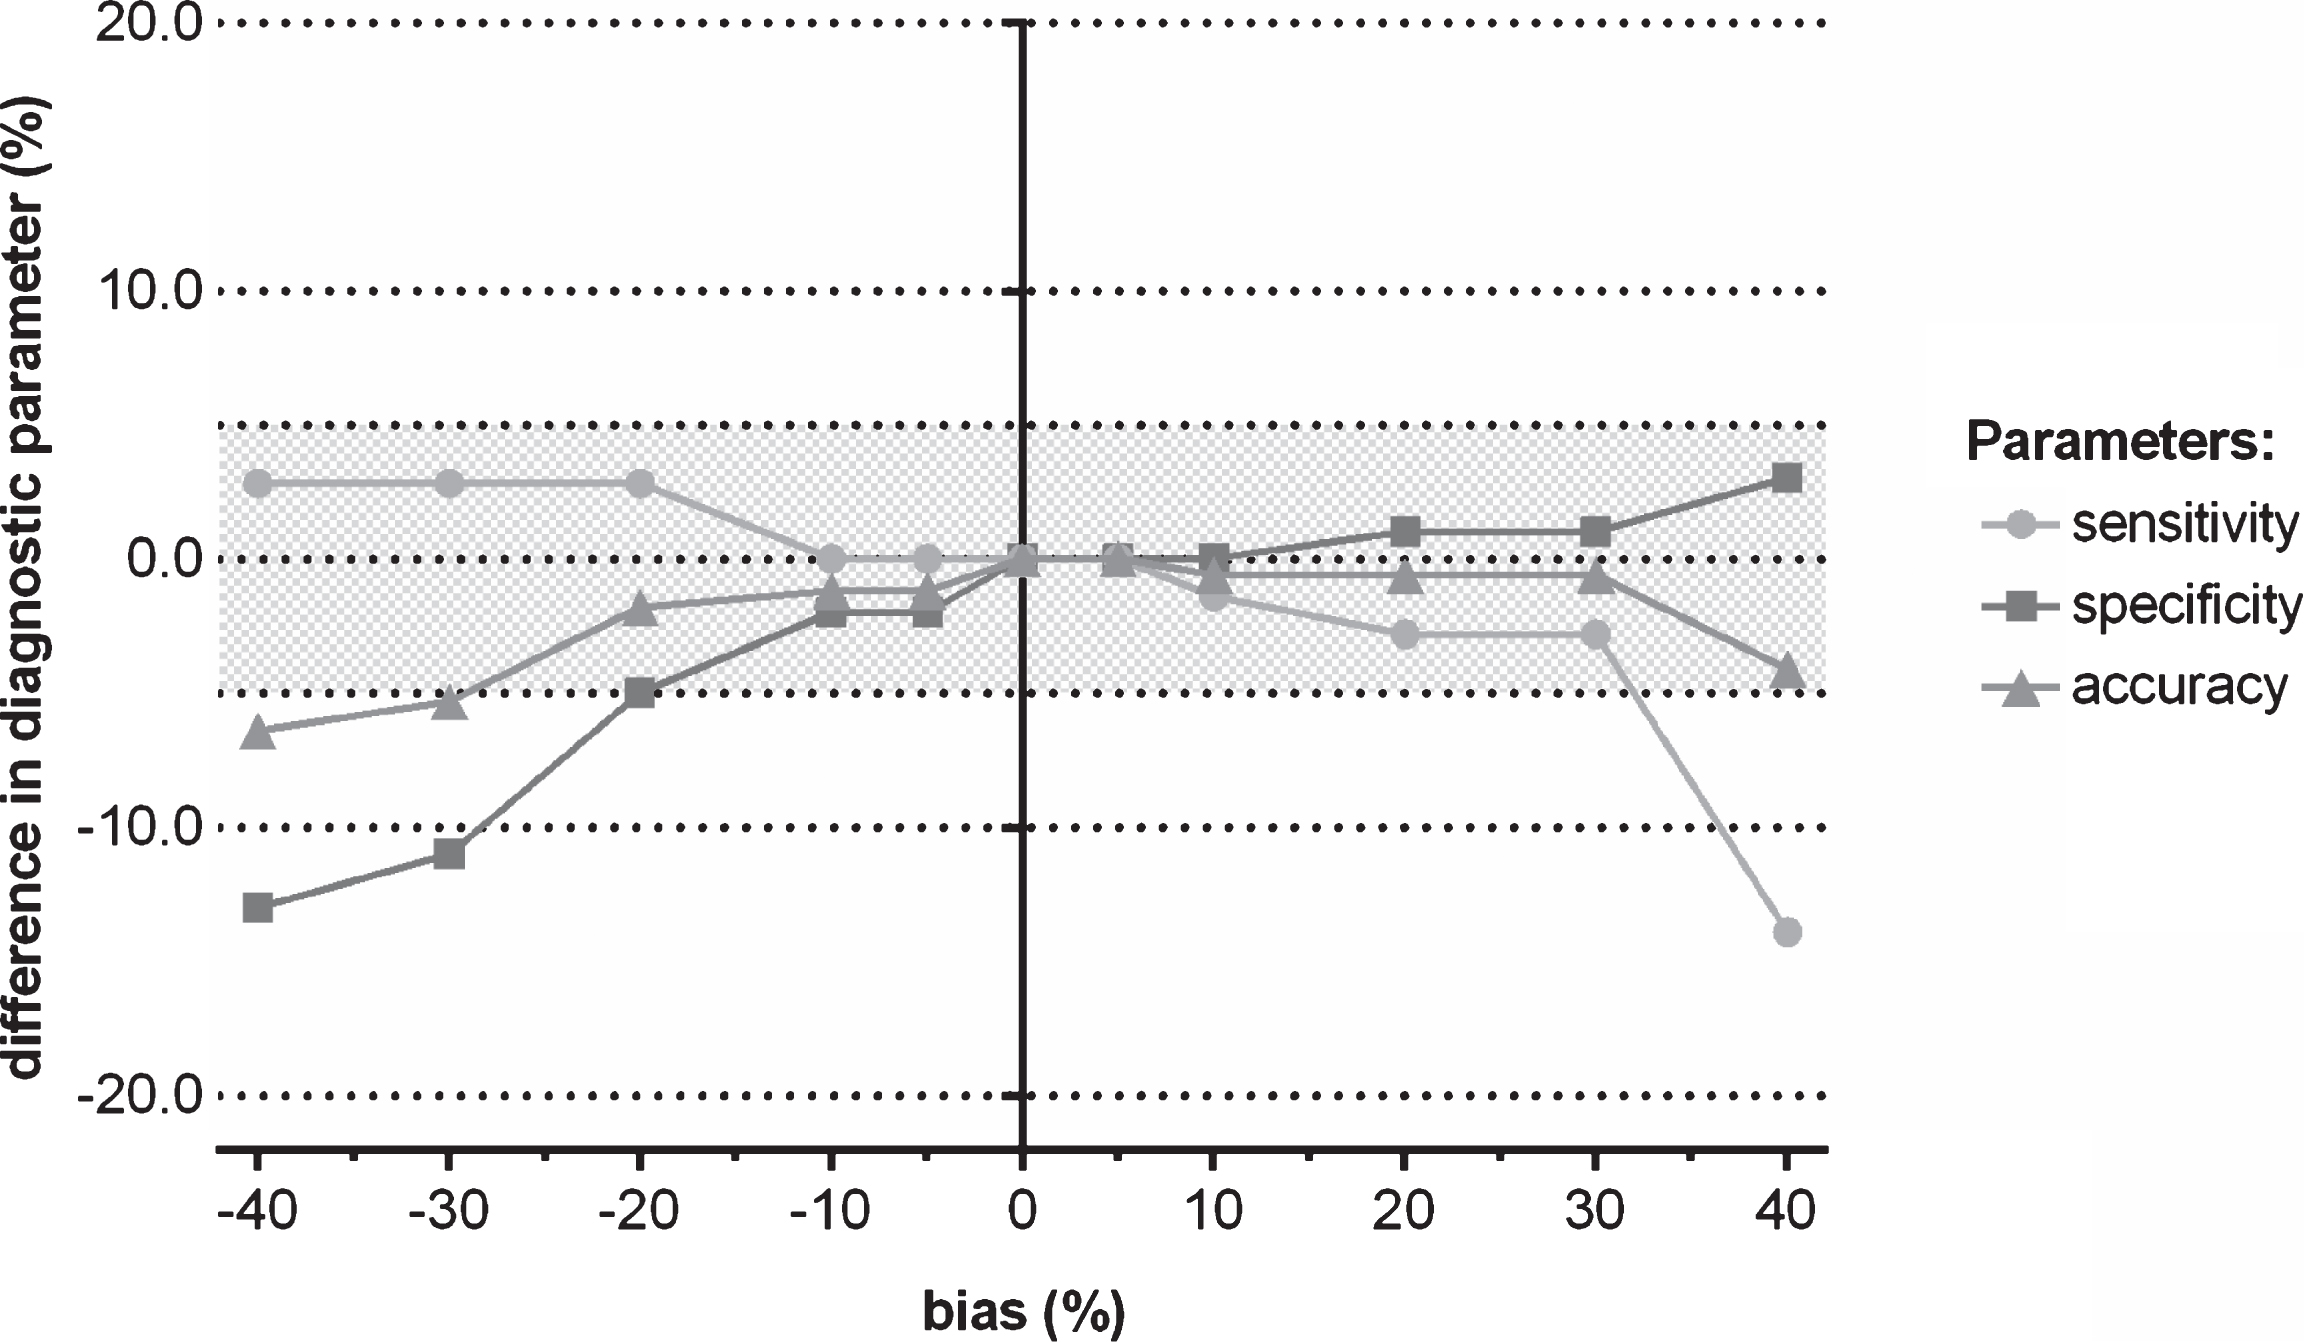
Fig.3
Difference in clinical diagnostic performance of CSF biomarkers for discriminating progressive from stable MCI when a shift in concentration was induced to the true (=observed) biomarker analyte values, followed by using the IWG-2 criteria in which the three biomarkers are included.
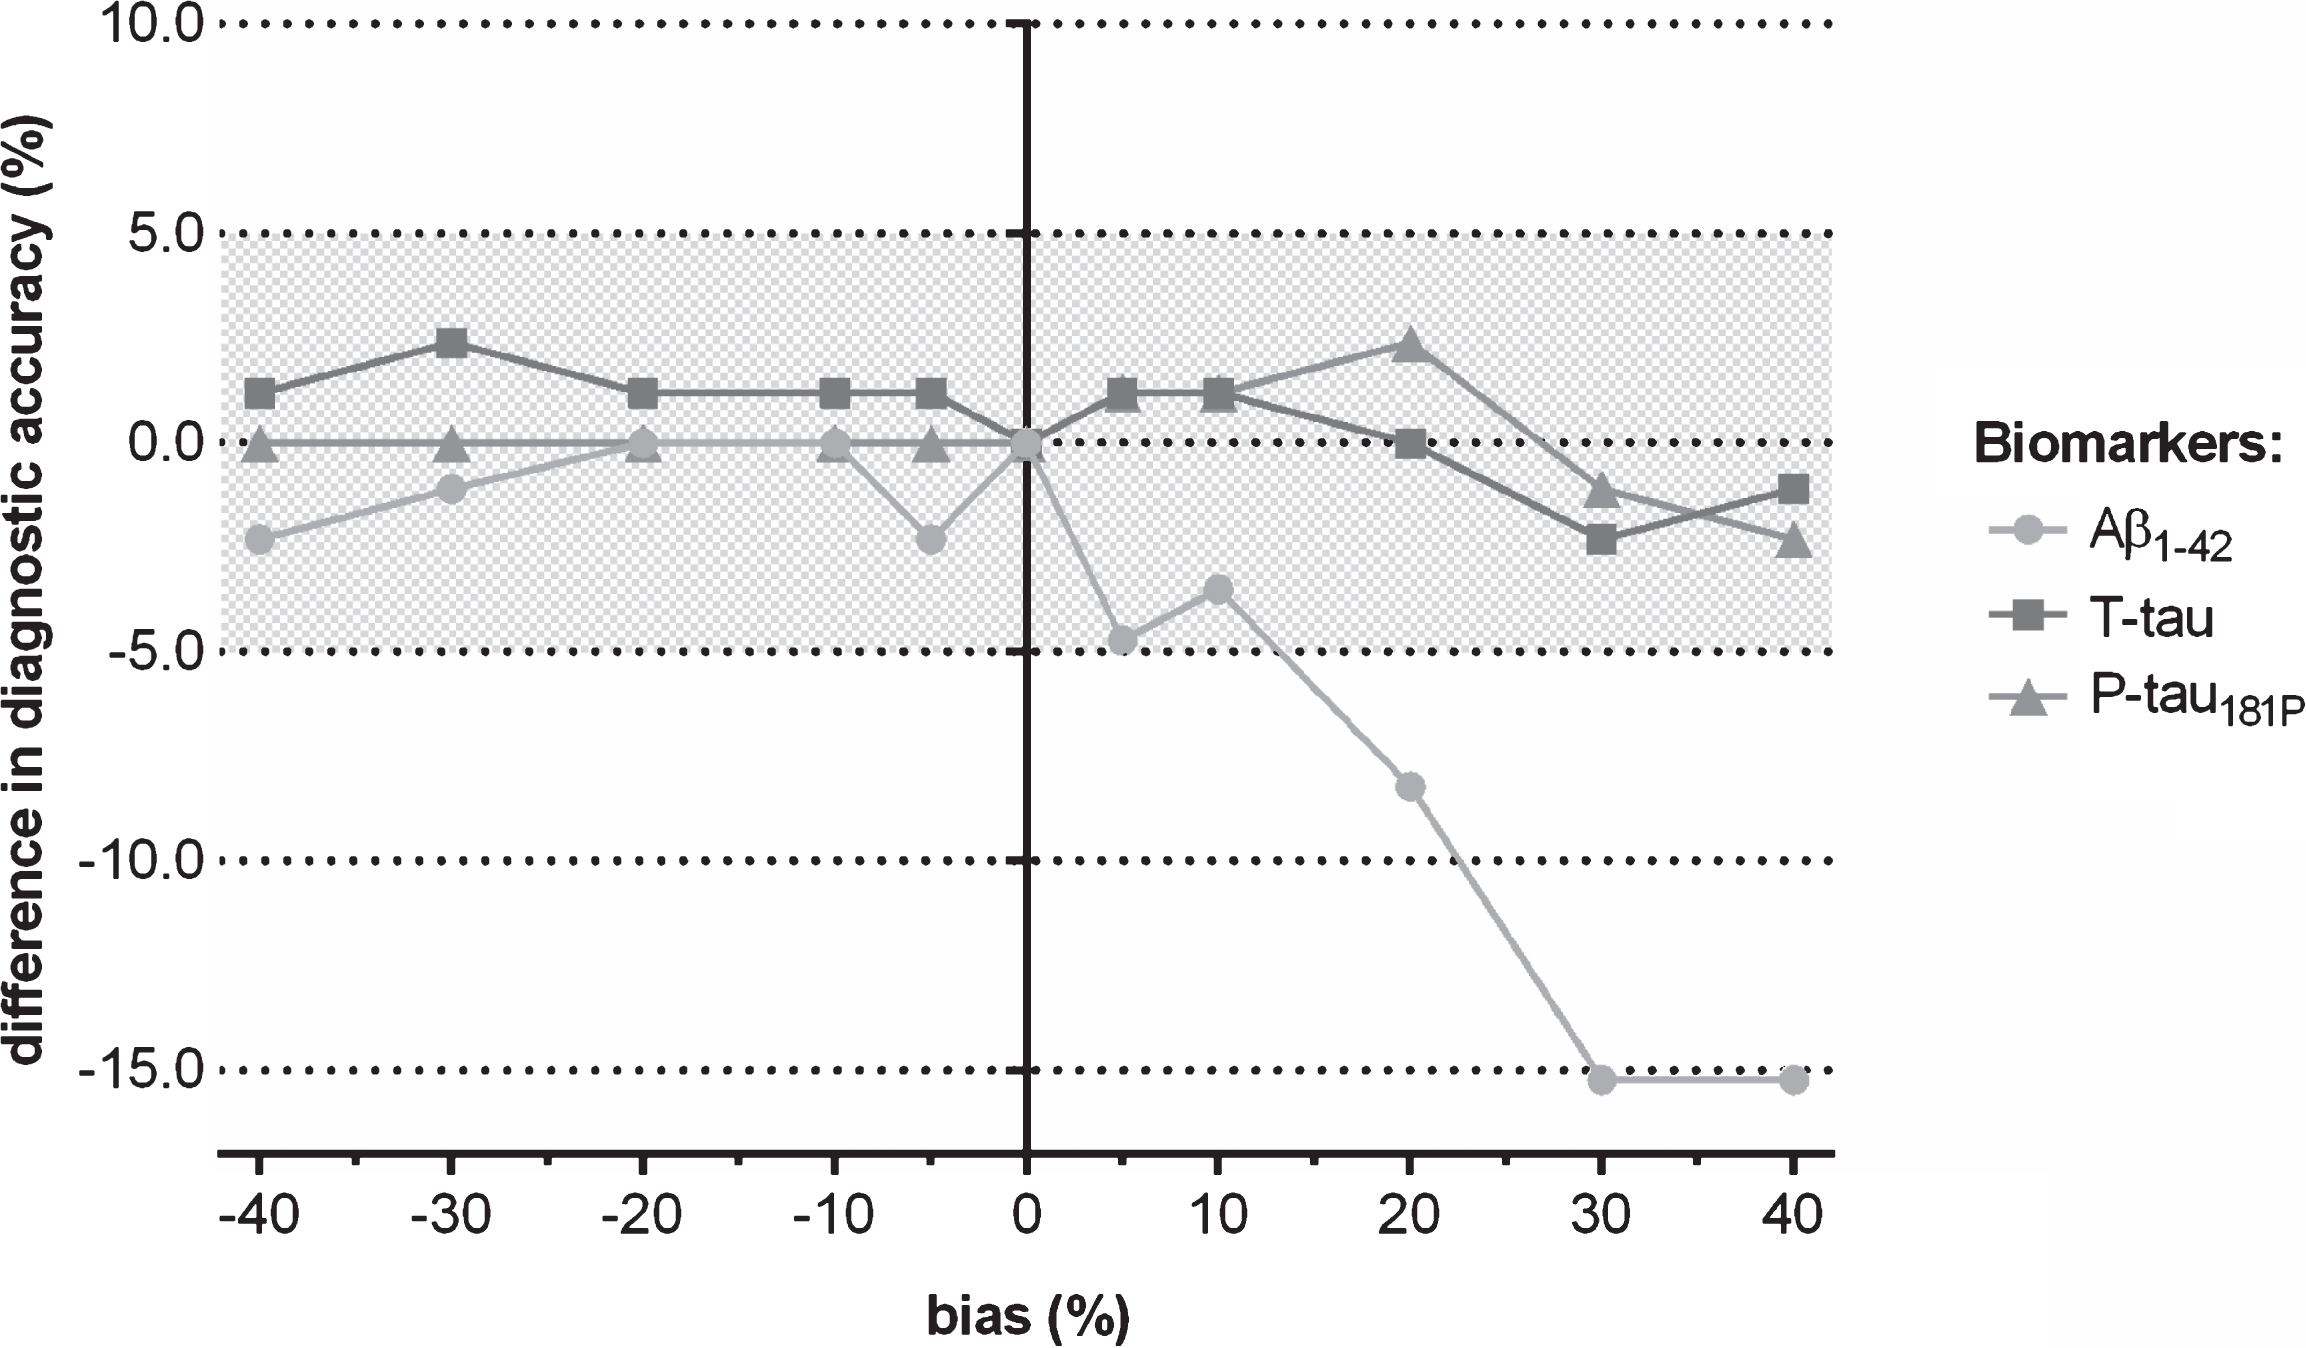
Fig.4
Difference in the diagnostic parameters (sensitivity, specificity, and accuracy) of CSF biomarkers for discriminating progressive from stable MCI when a shift in concentration was induced to Aβ1-42, followed by using the IWG-2 criteria in which the three biomarkers are included.
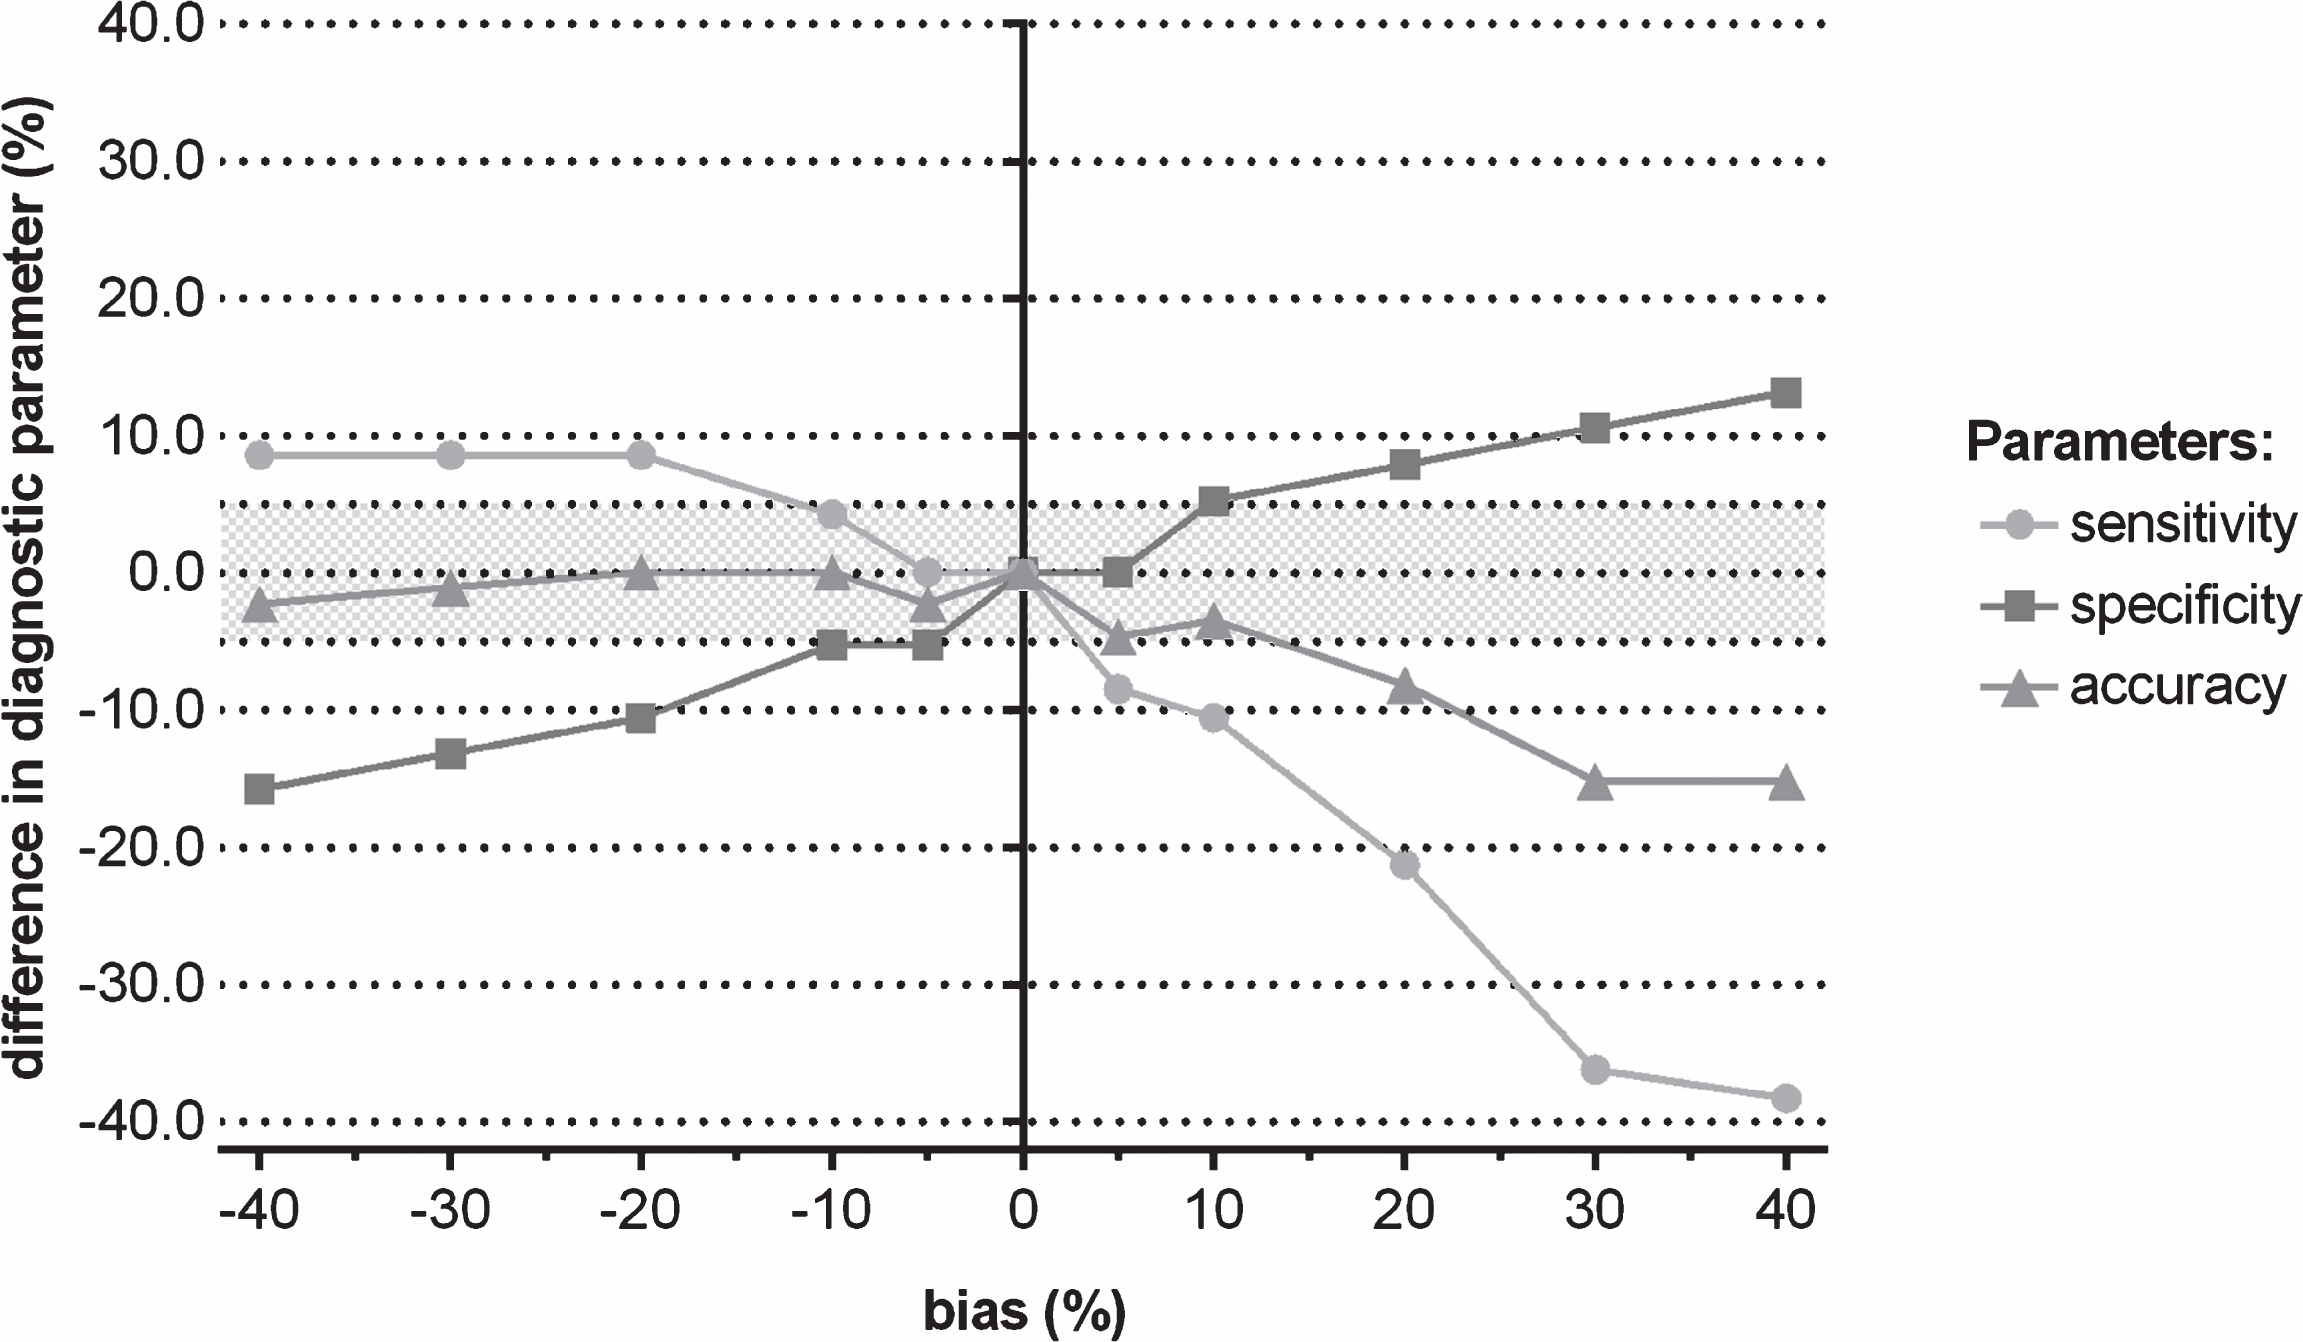
Table 1
Demographic and biomarker data of the population
| AD | MCI Progressive | MCI Stable | Controls | p-value | |
| Gender (% male/female) (n) | 49/51 (72) | 47/53 (47) | 47/53 (38) | 52/48 (100) | 0.924 |
| Age at inclusion (y) (n) | 75.6 [12.4] (71) | 75.9 [7.3] (47) | 74.0 [8.8] (38) | 46.8 [16.6] (100) | <0.001* |
| Age at conversion (y) (n) | – | 77.5 [7.5] (47) | – | – | – |
| Age at death (y) (n) | 76.0 [12.6] (72) | – | – | – | – |
| MMSE (0–30) (n) | 11.0 [6.4] (54) | 25.1 [2.9] (47) | 26.2 [2.3] (37) | – | <0.001‡ |
| Aβ1-42 (pg/mL) | 329.9 [141.6] (72) | 523.1 [172.3] (47) | 716.5 [319.3] (38) | 694.5 [156.3] (100) | <0.05∧ |
| T-tau (pg/mL) | 693.6 [379.0] (72) | 509.2 [254.2] (47) | 343.5 [225.1] (38) | 248.5 [200.8] (100) | <0.05∧ |
| P-tau181P (pg/mL) | 100.1 [90.6] (72) | 77.3 [29.7] (47) | 55.4 [28.0] (38) | 42.5 [21.0] (100) | <0.05∧ |
Abbreviation: Alzheimer’s disease (AD), mild cognitive impairment(MCI), Mini-Mental State Examination(MMSE).
Data are mean [SD], percentage (%) or number (n).
*Significant difference detected between the controls and the other three groups: p < 0.001. All other between groups differences: p = 1.00.
‡MMSE scores between the two MCI groups had not a significant difference (p = 0.894). All other between group differences: p < 0.001.
∧Aβ1-42: Control versus MCI stable p = 1.00. ∧T-tau: Controls versus MCI stable p = 0.423. ∧P-tau181P: AD versus MCI progressive p = 0.129; Controls versus MCI stable p = 1.00; MCI progressive versus MCI stable p = 0.340. For the other between group differences: p < 0.05.

