
A Pathway Based Classification Method for Analyzing Gene Expression for Alzheimer’s Disease Diagnosis
Abstract
Background:
Recent studies indicate that gene expression levels in blood may be able to differentiate subjects with Alzheimer’s disease (AD) from normal elderly controls and mild cognitively impaired (MCI) subjects. However, there is limited replicability at the single marker level. A pathway-based interpretation of gene expression may prove more robust.
Objectives:
This study aimed to investigate whether a case/control classification model built on pathway level data was more robust than a gene level model and may consequently perform better in test data. The study used two batches of gene expression data from the AddNeuroMed (ANM) and Dementia Case Registry (DCR) cohorts.
Methods:
Our study used Illumina Human HT-12 Expression BeadChips to collect gene expression from blood samples. Random forest modeling with recursive feature elimination was used to predict case/control status. Age and APOE ɛ4 status were used as covariates for all analysis.
Results:
Gene and pathway level models performed similarly to each other and to a model based on demographic information only.
Conclusions:
Any potential increase in concordance from the novel pathway level approach used here has not lead to a greater predictive ability in these datasets. However, we have only tested one method for creating pathway level scores. Further, we have been able to benchmark pathways against genes in datasets that had been extensively harmonized. Further work should focus on the use of alternative methods for creating pathway level scores, in particular those that incorporate pathway topology, and the use of an endophenotype based approach.
INTRODUCTION
The most common form of dementia is Alzheimer’s disease (AD). It is predicted that by 2050, 1 in every 85 people will be living with the disease [1]. No disease modifying treatments are available for AD and existing treatments only provide short-term symptomatic relief in a subset of patients [2]. Additionally, in the early stages (between 2 and 15 years prior to the development of clinical symptoms) the disease is difficult to diagnose. Villemagne et al. and Jack et al. hypothesize that characteristic AD pathology (the presence of amyloid-β (Aβ) plaques and hyperphosphorylated tau tangles in the brain) begins to develop up to 20 years prior to clinical diagnosis [3, 4]. This extended prodromal stage is an important window in which to target treatments that may be able to alter the course of the disease; provided people could be sensitively and accurately diagnosed. Aβ, tau, and phosphorylated-tau levels are indicative of AD pathology in this prodromal period and can be measured in cerebrospinal fluid (CSF) and by positron emission tomography (PET) imaging [5]. The procedures involved in attaining these measurements can be invasive or expensive and require specialized administration, equipment. and expertise. The development of a less invasive, potentially cheaper technique, such as a blood test, would offer significant advantages [6].
Recent studies indicate that gene expression levels in blood may be able to differentiate AD subjects from normal elderly controls and mild cognitive impairment (MCI) subjects with prodromal disease [7–10]. Han et al. provide an overview of studies of gene expression associated with AD-related phenotypes [11]. They state that the blood transcriptome is vital in the disease mechanism of AD and should therefore be investigated further in independent studies of a large sample size. A more general summary of gene expression data in neurodegenerative diseases is given by Cooper-Knock et al. [12]. This review emphasizes the dysregulation in neuroinflammation and intracellular signaling pathways including calcium signaling in AD. The commonality between these reviews is that they both highlight limited replicability at the single marker level. Furthermore, Han et al. report a greater concordance between differentially expressed genes at the pathway level. A pathway-based interpretation of gene expression may therefore prove more robust across different sample populations. Such an approach may also reduce noise and dimensionality. It is important to note that differential gene expression, as described in these reviews, does not necessarily identify genes that will be useful in a classification context.
Although previous gene expression studies in AD have retrospectively identified pathways altered in disease [9], this is the first study to use pathway scores for each individual to build predictive models across the population. This study used Pathway Level Analysis of Gene Expression (PLAGE) to estimate pathway variability across samples in the population by calculating sample-wise pathway scores [14]. PLAGE outperformed other single sample enrichment methods such as ZSCORE, Gene Set Variation Analysis (GSVA), and Single Sample Gene Set Enrichment Analysis (SSGSEA) in a comparison of sensitivity, specificity, and prioritization by Tarca et al. [15]. PLAGE scores have been used in univariate t-testing and unsupervised clustering methods to investigate the pathways involved in oral leukoplakia and those leading to cell proliferation and migration in leukemia [16, 17]. We combine, for the first time, PLAGE scoring with a supervised machine learning approach to build an AD classifier.
This study used blood expression data from subjects participating in the AddNeuroMed (ANM) and Dementia Case Registry (DCR) studies to develop models of clinical diagnosis. The performance metrics of gene expression and demographic models is compared with those generated using pathway level measures of expression.
MATERIALS AND METHODS
Cohort
ANM is a European multi-center study aiming to develop biomarkers for AD [18]. Subjects with an AD diagnosis as well as those with MCI and healthy controls were recruited from centers based in Kuopio, Lodz, London, Perugia, Thessaloniki, and Toulouse. Details of study design and enrollment are provided by Lunnon et al. [10]. Subjects for the DCR were recruited from the Maudsley and Kings Healthcare Partners, which incorporates the Alzheimer’s Research UK (ARUK) cohort [19] from whom gene expression data has not previously been reported.
The present study used data from 748 subjects: 614 subjects from ANM and 134 subjects from DCR.
Gene expression
Whole blood samples (2.5 ml) were collected after 2 h of fasting into Paxgene Blood RNA tubes (BD) and extracted as in Lunnon et al. [9]. Illumina Human HT-12 Expression BeadChips were used to analyze the whole transcriptome according to the manufacturers protocol. The gene expression analysis was run in two batches at two different sites. Batch 1 contained samples from 356 ANM subjects run on version 3 of the BeadChip, as previously described [9, 10]. Batch 2 contained samples from 411 subjects: 134 from DCR and 277 from ANM run on version 4 of the BeadChip. Samples from 19 subjects were included in both batches. See Fig. 1 for an overview of sample numbers. The raw gene expression data are available as GEO DataSets (Accession number GSE63060 for batch 1 and GSE63061 for batch 2).
Statistical analysis
Data pre-processing
The data pre-processing performed in this study is different to that used for the original analysis by Lunnon et al. [9, 10]. The data processing pipeline used in this study aims to address the effects of technical data artifacts in gene expression studies [20]. Raw gene expression data was exported from Illumina’s Genome studio and processed in R (version 3.1.1) [21] using the lumi package [22] and custom in-house pre-processing scripts (GitHub, http://bit.ly/1vjyKNo). Briefly, raw expression data was subject to a model based background correction for bead array [23]. This used negative bead expression levels to correct for background noise. The data was then log base 2 transformed and robust spline normalized in lumi [22]. Outlying samples were iteratively identified using fundamental network concepts and removed, following the methods described by Oldham et al. [24]. To reduce any batch effects we adjusted for technical categorical variables using ComBat [25]. Continuous technical artifacts were accounted for by taking the first principal component across housekeeping and undetected probes and regressing this against technical variables. Variables significantly associated with the first principal component were then regressed against expression for each probe, and the mean adjusted residuals taken forward for all further analyses. Finally, the data was reduced to a subset of probes that could be reliably detected in 80% of samples in at least one diagnostic group. Finally, subjects were excluded where there were discrepancies between the recorded sex and sex determined by the XIST (ILMN 1764573), USP9Y (ILMN 2056795) and EIF1AY (ILMN 1755537 and ILMN 2228976) X- and Y-linked genes.
Demographic data for the ANM and DCR subjects was extracted using CohortExplorer [26].
Pathway level analysis of gene expression (PLAGE)
Gene level expression data were condensed to sample wise, pathway level scores using PLAGE [14]. PLAGE groups genes into pathways defined by the Broad Institute Collection of Curated Pathways [27] and outputs a score, per sample, for each of these sets. We restricted PLAGE to only include pathways with between 10 and 500 genes. The generation of PLAGE scores was implemented through R package ‘GSVA’ and is detailed in Supplementary Methods, section 1 [13].
Data analysis
Clinical diagnosis (AD versus non-demented elderly control) classification models were built using batch 1 gene expression data. Variable selection was performed using recursive feature elimination (RFE) and the creation of a tolerance set using the ‘pickSizeTolerance’ function in R. This function finds a smaller set of variables while maintaining model accuracy [28]. Three Random Forest (RF) models were built, the first of which was a model based on demographic data alone (demographic model) [29]. The demographic variables included were those that were significant in the batch 1 population: sample collection site, age, years in full time education, and APOE status (defined as the presence of any number of ɛ4 alleles) (Table 1). Two further models were built based on thesedemographic variables and gene level data (gene model) or PLAGE scores (pathway model). The purpose of the demographic model is to provide a comparator for the gene and pathway models. If models that include blood expression information (as well as demographics) are no more informative than demographic variables alone there is no benefit in including this information. All model building was performed in the statistical software R (Version 3.1.1) using the ‘caret’ package [28].
Each model was used to predict the diagnostic status of subjects in batch 2. Model statistics including accuracy, sensitivity, and specificity were generated and compared between the demographic model, gene model, and pathway model. Receiver Operator Curve (ROC) analysis was also performed in batch 2 data using R packages ROCR and pROC [30, 31].
Full details of model building are provided in Supplementary Methods section 2.
Additionally, variable importance (determined as the change in Gini index) was examined in the pathway model by permutation testing. The idea of permutation testing is to break the association between outcome (in this case diagnosis) and predictor variables. When the model is re-built based on this permuted data any significant association is spurious. Therefore, by comparing the true variable importance of a pathway to the variable importances that arise by chance in the permuted data we can assess how significant our result is. To achieve this here we used 1000 permutations of the demographic variables (including diagnosis) and for each permutation built a RF model. The importance measures of each pathway were then compared to that of the original model to generate an empirical p-value. A p-value of less than 0.05 was considered significant.
The validity of the pathways selected in the pathway model was also investigated in a similar way. A random set of pathways (of the same size as the final pathway model) were selected, and used to build a RF model. The fact that this set is random breaks the association between predictor variables and outcome. This process was repeated 1000 times and the accuracies across all models compared to the accuracy of the true model to create an empirical p-value.
RESULTS
Cohort demographics
Table 1 gives an overview of the demographics of subjects included in the two batches of gene expression data.
Data pre-processing
As a result of pre-processing 12 samples in batch 1 and 49 samples in batch 2 failed quality control (QC) and were removed. The majority of these samples failed QC as they were identified as outliers. Additionally, some samples were removed because the sex of the individual recorded in the clinical database did not match the biological sample (2 samples in batch 1 and 7 in batch 2).
Samples from 19 subjects were present in both batch 1 and batch 2. Samples from 14 of these individuals passed QC in both batches; only data from batch 1 was used and the other was discarded. Correlation between the two batches was at least 0.9 for all individuals (Supplementary Figure 3). Batch 2 gene expression data contains subjects from the DCR whereas batch 1 does not. This study used the same protocols, staff, and facilities as the London sample collection site within ANM. Principal components analysis (PCA) was performed across the batch 2 gene expression data from DCR and ANM subjects from London. The first three principal components (accounting for >40% of variation) were linearly regressed against the study the individual was enrolled in (DCR or London ANM) and found to be non-significant. Therefore, it was deemed appropriate to group DCR subjects with London ANM, allowing the model trained in batch 1 data to be simply applied to batch 2 data.
After data processing only subjects with either an AD diagnosis at all visits or control status at all visits were analyzed further: 207 subjects in batch 1 and 236 in batch 2.
Only gene probes that mapped between the version 3 and version 4 chips used to generate batches 1 and 2, respectively, were used for analysis (5212 probes). The Broad Institute Collection of Curated Pathways matched these probes to 834 pathways [27].
Data analysis
Demographic model
The following demographic variables were associated with case/control status in our cohorts (Table 1): age, sex, APOE status, years in full time education, and sample collection site. These variables were therefore used in multivariate modeling using RFE. The optimal cross-validated accuracy was found when including all variables; calculation of a tolerance set excluded the variable representing the Lodz sample collection site. Variable importance scores showed age as the most important covariate followed by years in full timeeducation and then APOE status and sample collection site. In batch 2 test data the model achieved an accuracy of 0.69, sensitivity of 0.53 and specificity of 0.84.
The area under the ROC curve was 0.77 (see Table 2 and Fig. 2).
Additionally, a model that did not contain the sample collection site was built. The aim was to create a model based on demographics that would be available to clinicians. This model had a slightly decreased accuracy in comparison to the demographic model but outperformed the pathway model and gene model in accuracy, sensitivity and area under the ROC curve at 0.67, 0.68 and 0.76, respectively. Interestingly, the specificity of the model was lower than all others at 0.67 (Table 2).
Gene model
The top 5% of variables from the bootstrapped variable importance calculations (261 variables) were carried forward to the RFE model building. The optimal cross-validated accuracy from RFE in the gene model was found for all of the 261 variables; calculation of a tolerance set reduced this set to only 13, excluding all demographic variables. For a list of genes, see Table 3.
In batch 2 test data, the gene model accuracy was lower than that of the demographic model and equal to the pathway model. The sensitivity, specificity, and area under the ROC curve of the gene model lay between the demographic and pathway models at 0.59, 0.75, and 0.72, respectively. (see Table 2 and Fig. 2). Note that the pathway model showed higher sensitivity while specificity and AUC ROC were higher in the demographic model.
Pathway model
The top 5% of variables from the bootstrapped variable importance calculations (42 variables) were carried forward to the RFE model building. The optimal cross-validated accuracy from RFE in the pathway model was found for 40 of the variables; calculation of a tolerance set reduced this set to only 16 variables (Table 4): 14 pathways, age, and years in full time education.
Permutation tests of variable importance were performed to assess the size of effect relative to that observed under the null hypothesis of no association. Of the 14 pathways, two achieved nominal significance with a p-value <0.05 and are indicated with a * in Table 4 (Supplementary Figure 5).
Additionally, we compared the model accuracy of 1000 models comprising 16 random variables from the pathways, age, sex, APOE status, and years in full time education. This yielded a p-value of 0.082 indicating that, statistically, the final model does not perform significantly better than a model of random pathways (Supplementary Figure 4).
In batch 2 test data, the model accuracy was lower than that of the demographic model at 0.66, however, the sensitivity was higher at 0.61. Both specificity and area under the ROC curve were lower than the demographic model at 0.70 and 0.73, respectively (see Table 2 and Fig. 2).
There is minimal overlap in genes between the different pathways included in the final pathway model. This is illustrated by the sparse percentage overlap map shown in Fig. 3 and supports the idea that each pathway is contributing an independent signal to the model. Of the 13 genes included in the gene model, only four of them (ILMN 1776104, ILMN 1784286, ILMN 1695645, and ILMN 2048326) appear in any of the pathways in the pathway model.
Misclassification
We discovered that 22% of controls used in the training data had reported memory complaints deemed not serious enough to reflect a change in diagnosis. By studying misclassification rates split by AD subjects, control subjects, and control subjects with memory complaints, we see that the most well classified group in the gene model was those subjects with memory complaints whereas in the pathway model it was control subjects (see Supplementary Figure 6). We also demonstrated that time since disease onset is not related to misclassification of AD subjects and control subjects with memory complaints in the test data (Supplementary Figure 7).
DISCUSSION
In this study we investigated whether AD cases could be differentiated from control subjects using gene expression data analyzed at the pathway level. We were particularly interested in confirming whether pathway level information created a more robust predictor of case/control status than expression data at the gene level as recent reviews of AD studies have suggested [11]. Our results, using subjects from the ANM and DCR cohorts, show similar model performance in a pathway model compared to a gene and demographic only model. In this study, we do not find improved prediction of AD diagnosis using pathway level information using the PLAGE method to calculate pathway scores. However, the robustness of pathway based approaches for AD biomarker discovery should be tested in other gene expression data from different populations andplatforms.
The fourteen pathways included in the final pathway model focused around DNA repair, immune response, and regulation of cellular activities. Of particular interest to AD, two pathways containing genes from the calpain gene family were included in the final fourteen pathways. It is thought that amyloid peptides interfere with calpain activity leading to deregulation of the CDK5 gene and in turn hyperphosphorylation of the tau protein. This promotes the death of neurons [27]. It is encouraging that we have seen relevant pathways in our final pathway model. Overall, the pathways are similar to those identified by Lunnon et al. who studied overall pathway differences using an identical raw dataset that was processed differently [9]. As we would expect, 12 out of 13 of the genes in the final gene model were present in the genes used for modeling by Lunnon et al. The data had been processed slightly differently emphasizing that these signals are robust to alterations in processing and modelingmethods.
RF models are commonly used in biomarker studies [9, 32, 33]. However, it has been shown that they exhibit variable selection bias being more likely to select continuous variables or those with many categories [34]. Additionally, the presence of correlated predictors (as is common in gene expression studies) can add further bias [35]. Strobl et al. aimed to address these issues with an ensemble-learning algorithm based on conditional inference trees; Conditional RF (CRF) models [36, 37]. We attempted to use this methodology in the present study. We hypothesized that the creation of an unbiased predictor may highlight different pathways and genes to those previously discovered, potentially allowing greater predictive ability. However, the process of creating a CRF model was computationally expensive even when using high performance computing resources. Model building considering the 834 pathways and 5,212 genes was consequently infeasible. Work to improve the efficiency of this method would be computationally beneficial and would allow the use of alternative variable importance measures. Measures such as mean decrease in accuracy and conditional mean decrease in accuracy would be an improvement over biased variable importance measures such as the Gini index, which was used in this study.
This study used the Broad institute collection of curated pathways to generate the pathway model and excluded less well-curated gene sets. This method was chosen due to its performance in a comparison study [15] and due to ease of application through the GSVA R package. It may be beneficial, although potentially computationally costly, to create pathway level scores that also reflect pathway topology and thus add further detail to the model. Such methods have been created by Pyatnitskiy et al. [38] building on the work of others [15, 39]. The method detailed by Pyatnitskiy et al. does not depend on predefined gene sets as used in this analysis. However, it is also unable to control the number of genes in a pathway; a potential benefit of using PLAGE. A further limitation of existing pathway approaches is that they often ignore information on the direction of change for each gene within a pathway. This would be an interesting area for further method development.
The creation of a demographic model that excluded sample collection site led to a drop in accuracy. Although RNA extraction and analysis were performed at one site the blood collection may vary by location. We aimed to correct for batch effects occurring in extraction and analysis in the pre-processing. This highlights that although sample collection sites within multi-center studies are following the same protocols major technical differences can still arise and remain after QC steps including batch correction. As much as possible, these differences should be quantified during extraction. Standardization for future biomarker development will aid this. It is possible that the sample collection site effect we see is driven by genetic differences between sites for some genes (expression quantitative trait loci). For a biomarker to have clinical utility it should be robust to such differences. However, in early exploratory work we are more likely to find results of interest if technical data artifacts are not creating a barrier.
The models created in this study all achieved an accuracy of approximately 70% with the pathway model having test sensitivity and specificity results of greater than 60% . The pathway model and gene model did not outperform a model of demographics alone. Any potential increase in concordance from the novel pathway level approach used here has not lead to a greater predictive ability in these datasets. However, we have only tested one method for creating pathway level scores. Further, we have been able to benchmark pathways against genes in datasets that had been extensively harmonized. It is reassuring to see that pathways perform similarly to genes and further work is now needed to see if pathway concordance is more easily detected using other methodological approaches and in data generated by independent groups andplatforms.
Furthermore, we found that the heterogeneity of control subjects may be leading to reduced predictive accuracy and suggest that the use of an endophenotype may be beneficial in future work.
Conclusions
We have used subjects from the ANM and DCR studies to investigate case/control classification using gene and pathway level expression data. We hypothesized that a model built on pathway level data may be more robust than a gene level model and consequently perform better in test data. However, a pathway level model built using scores and a gene level model performed similarly to each other and to a model based on demographic information only. Further work should focus on the use of alternative methods for creating pathway level scores, in particular those that incorporate pathway topology, and the use of an endophenotype based approach.
ACKNOWLEDGMENTS
This work was supported by the Alzheimer’s Society, InnoMed (Innovative Medicines in Europe), an integrated project funded by the European Union of the Sixth Framework program priority (FP6-2004- LIFESCIHEALTH-5); Alzheimer’s Research Trust UK; the John and Lucille van Geest Foundation (AH); and the NIHR Biomedical Research Centre for Mental Health and Biomedical Research Unit for Dementia at the South London, Maudsley NHS Foundation Trust and Kings College London, and a joint infrastructure grant from Guy’s and St Thomas’ Charity and the Maudsley Charity. The research leading to these results has received support from the Innovative Medicines Initiative Joint Undertaking under EMIF grant agreement number 115372, resources of which are composed of financial contribution from the European Union’s Seventh Framework Program (FP7/2007-2013) and EFPIA companies’ in kind contribution. Kuopio University Hospital (HS) and funding from UEF- BRAIN (HS). Steven Kiddle is supported by an MRC Career Development Award in Biostatistics (MR/L011859/1).
Authors’ disclosures available online (http://j-alz.com/manuscript-disclosures/15-0440r2).
Appendices
The supplementary material is available in the electronic version of this article: http://dx.doi.org/10.3233/JAD-150440.
References
1 | Brookmeyer R, Johnson E, Ziegler-Graham K, Arrighi HM (2007) Forecasting the global burden of Alzheimer’s disease Alzheimers Dement 3: 186 191 |
2 | Corbett A, Ballard C (2012) New and emerging treatments for Alzheimer’s disease Expert Opin Emerg Drugs 17: 147 156 |
3 | Villemagne V, Pike K, Chételat G, Ellis K, Mulligan R, Bourgeat P, Ackermann U, Jones G, Szoeke C, Salvado O, Martins R, O’Keefe G, Mathis C, Klunk W, Ames D, Masters C, Rowe C (2011) Longitudinal assessment of Aβ and cognition in aging and Alzheimer disease Ann Neurol 69: 181 192 |
4 | Jack C, Knopman D, Jagust W, Petersen R, Weiner M, Aisen P, Shaw L, Vemuri P, Wiste H, Weigand S, Lesnick T, Pankratz V, Donohue M, Trojanowski J (2013) Tracking pathophysiological processes in Alzheimer’s disease: An updated hypothetical model of dynamic biomarkers Lancet Neurol 12: 207 216 |
5 | Cedazo-Minguez A, Winblad B (2010) Biomarkers for Alzheimer’s disease and other forms of dementia: Clinical needs, limitations and future aspects Exp Gerontol 45: 5 14 |
6 | Bazenet C, Lovestone S (2012) Plasma biomarkers for Alzheimer’s disease: Much needed but tough to find Biomark Med 6: 441 454 |
7 | Booij BB, Lindahl T, Wetterberg P, Skaane N, Sæbø S, Feten G, Rye PD, Kristiansen LI, Hagen N, Jensen M, Bårdsen K, Winblad B, Sharma P, Lönneborg A (2011) A gene expression pattern in blood for the early detection of Alzheimer’s disease J Alzheimers Dis 23: 101 119 |
8 | Rye P, Booij B, Grave G, Lindahl T, Kristiansen L, Anderson H, Horndalsveen P, Nygaard H, Naik M, Hoprekstad D, Wetterberg P, Nilsson C, Aarsland D, Sharma P, Lönneborg A (2011) A novel blood test for the early detection of Alzheimer’s disease J Alzheimers Dis 23: 121 129 |
9 | Lunnon K, Ibrahim Z, Proitsi P, Lourdusamy A (2012) Mitochondrial dysfunction and immune activation are detectable in early Alzheimer’s disease blood J Alzheimers Dis 30: 685 710 |
10 | Lunnon K, Sattlecker M, Furney S, Coppola G, Simmons A, Proitsi P, Lupton M, Lourdusamy A, Johnston C, Soininen H, Kloszewska I, Mecocci P, Tsolaki M, Vellas B, Geschwind D, Lovestone S, Dobson R, Hodges Aand the AddNeuroMed Consortium (2013) A blood gene expression marker of early Alzheimer’s disease J Alzheimers Dis 33: 737 753 |
11 | Han G, Wang J, Zeng F, Feng X, Yu J, Cao HY, Yi X, Zhou H, Jin LW, Duan Y, Wang YJ, Lei H (2013) Characteristic transformation of blood transcriptome in Alzheimer’s disease J Alzheimers Dis 35: 373 386 |
12 | Cooper-Knock J, Kirby J, Ferraiuolo L, Heath PR, Rattray M, Shaw PJ (2012) Gene expression profiling in human neurodegenerative disease Nat Rev Neurol 8: 518 530 |
13 | Hänzelmann S, Castelo R, Guinney J (2013) GSVA: Gene set variation analysis for microarray and RNA-Seq data BMC Bioinformatics 14: 1 15 |
14 | Tomfohr J, Lu J, Kepler T (2005) Pathway level analysis of gene expression using singular value decomposition BMC Bioinformatics 6: 225 |
15 | Tarca A, Draghici S, Khatri P, Hassan S, Mittal P, Kim J, Kim C, Kusanovic J, Romero R (2009) A novel signaling pathway impact analysis Bioinformatics 25: 75 82 |
16 | Gümüs Z, Du B, Kacker A, Boyle J, Bocker J, Mukherjee P, Subbaramaiah K, Dannenberg A, Weinstein H (2008) Effects of tobacco smoke on gene expression and cellular pathways in a cellular model of oral leukoplakia Cancer Prev Res (Phila) 1: 100 111 |
17 | Deaglio S, Aydin S, Grand M, Vaisitti T, Bergui L, D’Arena G, Chiorino G, Malavasi F (2010) CD38/CD31 interactions activate genetic pathways leading to proliferation and migration in chronic lymphocytic leukemia cells Mol Med 18: 87 91 |
18 | Lovestone S, Francis P, Kloszewska I, Mecocci P, Simmons A, Soininen H, Spenger C, Tsolaki M, Vellas B, Wahlund LO, Ward Mon behalf of the AddNeuroMed Consortium (2009) AddNeuroMed-The European collaboration for the discovery of novel biomarkers for Alzheimer’s disease Ann N Y Sci 1180: 36 46 |
19 | Hye A, Lynham S, Thambisetty M, Causevic M, Campbell J, Byers H, Hooper C, Rijsdijk F, Tabrizi S, Banner S, Shaw C, Foy C, Poppe M, Archer N, Hamilton G, Powell J, Brown R, Sham P, Ward M, Lovestone S (2006) Proteome-based plasma biomarkers for Alzheimer’s disease Brain 129: 3042 3050 |
20 | Parker H, Leek J (2012) The practical effect of batch on genomic prediction Stat Appl Genet Mol Biol 11: Article 10 |
21 | R Core Team (2014) A Language and Environment for Statistical Computing R Foundation for Statistical Computing Vienna, Austria |
22 | Du P, Kibbe W, Lin S (2008) lumi: A pipeline for processing Illumina microarray Bioinformatics 24: 1547 1548 |
23 | Xie Y (2010) MBCB: MBCB (Model-based Background Correction for Beadarray) R package version 1.18.0 |
24 | Oldham M, Langfelder P, Horvath S (2012) Network methods for describing sample relationships in genomic datasets: Application to Huntingdon’s disease BMC Syst Biol 6: 63 |
25 | Johnson WE, Li C, Rabinovic A (2007) Adjusting batch effects in microarray expression data using empirical Bayes methods Biostatistics 8: 118 127 |
26 | Dixit A, Dobson R (2014) CohortExplorer: A generic application programming interface for entity attribute value database schemas JMIR Med Inform 2: e32 |
27 | Subramanian A, Tamayo P, Mootha V, Mukherjee S, Ebert B, Gillette M, Paulovich A, Pomeroy S, Golub T, Lander E, Mesirov J (2005) Gene set enrichment analysis: A knowledge- based approach for interpreting genome-wide expression profiles Proc Natl Acad Sci U S A 102: 15545 15550 |
28 | Kuhn JM. Contributions fromWing J,Weston S,Williams A, Keefer C, Engelhardt A, Cooper T, Mayer Z, and the R Core Team (2014) Caret: Classification and Regression Training. R package version 6.0-35 |
29 | Liaw A, Wiener M (2002) Classification and Regression by randomForest R News 2: 18 22 |
30 | Sing T, Sander O, Beerenwinkel N, Lengauer T (2005) ROCR: Visualizing classifier performance in R Bioinformatics 21: 3940 3941 |
31 | Robin X, Turck N, Hainard A, Tiberti N, Lisacek F, Sanchez JC, Müller M (2011) pROC: An open-source package for R and S+ to analyze and compare ROC curves BMC Bioinformatics 12: 77 |
32 | Burnham S, Faux N, Wilson W, Laws S, Ames D, Bedo J, Bush A, Doecke J, Ellis K, Head R, Jones G, Kiiveri H, Martins R, Rembach A, Rowe C, Salvado O, Macaulay S, Masters C, Villemagne V (2014) A blood-based predictor for neocortical Aβ burden in Alzheimer’s disease: Results from the AIBL study Mol Psychiatry 19: 519 526 |
33 | Sattlecker M, Kiddle S, Newhouse S, Proitsi P, Nelson S, Williams S, Johnston C, Killick R, Simmons A, Westman E, Hodges A, Soininen H, Kloszewska I, Mecocci P, Tsolaki M, Vellas B, Lovestone S, Dobson Rand the AddNeuroMed Consortium (2014) Alzheimer’s disease biomarker discovery using SOMAscan multiplexed protein technology Alzheimers Dement 10: 724 734 |
34 | Strobl C, Boulesteix A, Zeileis A, Hothorn T (2007) Bias in random forest variable importance measures: Illustrations, sources and a solution BMC Bioinformatics 8: 25 |
35 | Meng Y, Yu Y, Cupples L, Farrer L, Lunetta K (2009) Performance of random forest when SNPs are in linkage disequilibrium BMC Bioinformatics 10: 78 |
36 | Hothorn T, Hornik K, Zeileis A (2006) Unbiased recursive partitioning: A conditional inference framework J Comput Graph Stat 15: 651 674 |
37 | Strobl C, Malley J, Tutz G (2009) An introduction to recursive partitioning: Rationale, application and characteristics ofclassification and regression trees, bagging and random forests Psychol Methods 14: 323 348 |
38 | Pyatnitskiy M, Mazo I, Shkrob M, Schwartz E, Kotelnikova E (2014) Clustering Gene Expression Regulators: New Approach to Disease Subtyping PLoS One 9: e84955 |
39 | Hung J, Whitfield T, Yang T, Hu Z, Weng Z, DeLisi C (2010) Identification of functional modules that correlate with phenotypic difference: The influence of network topology Genome Biol 11: R23 |
Figures and Tables
Fig.1
Overview of sample numbers in batch 1 and 2 gene expression.
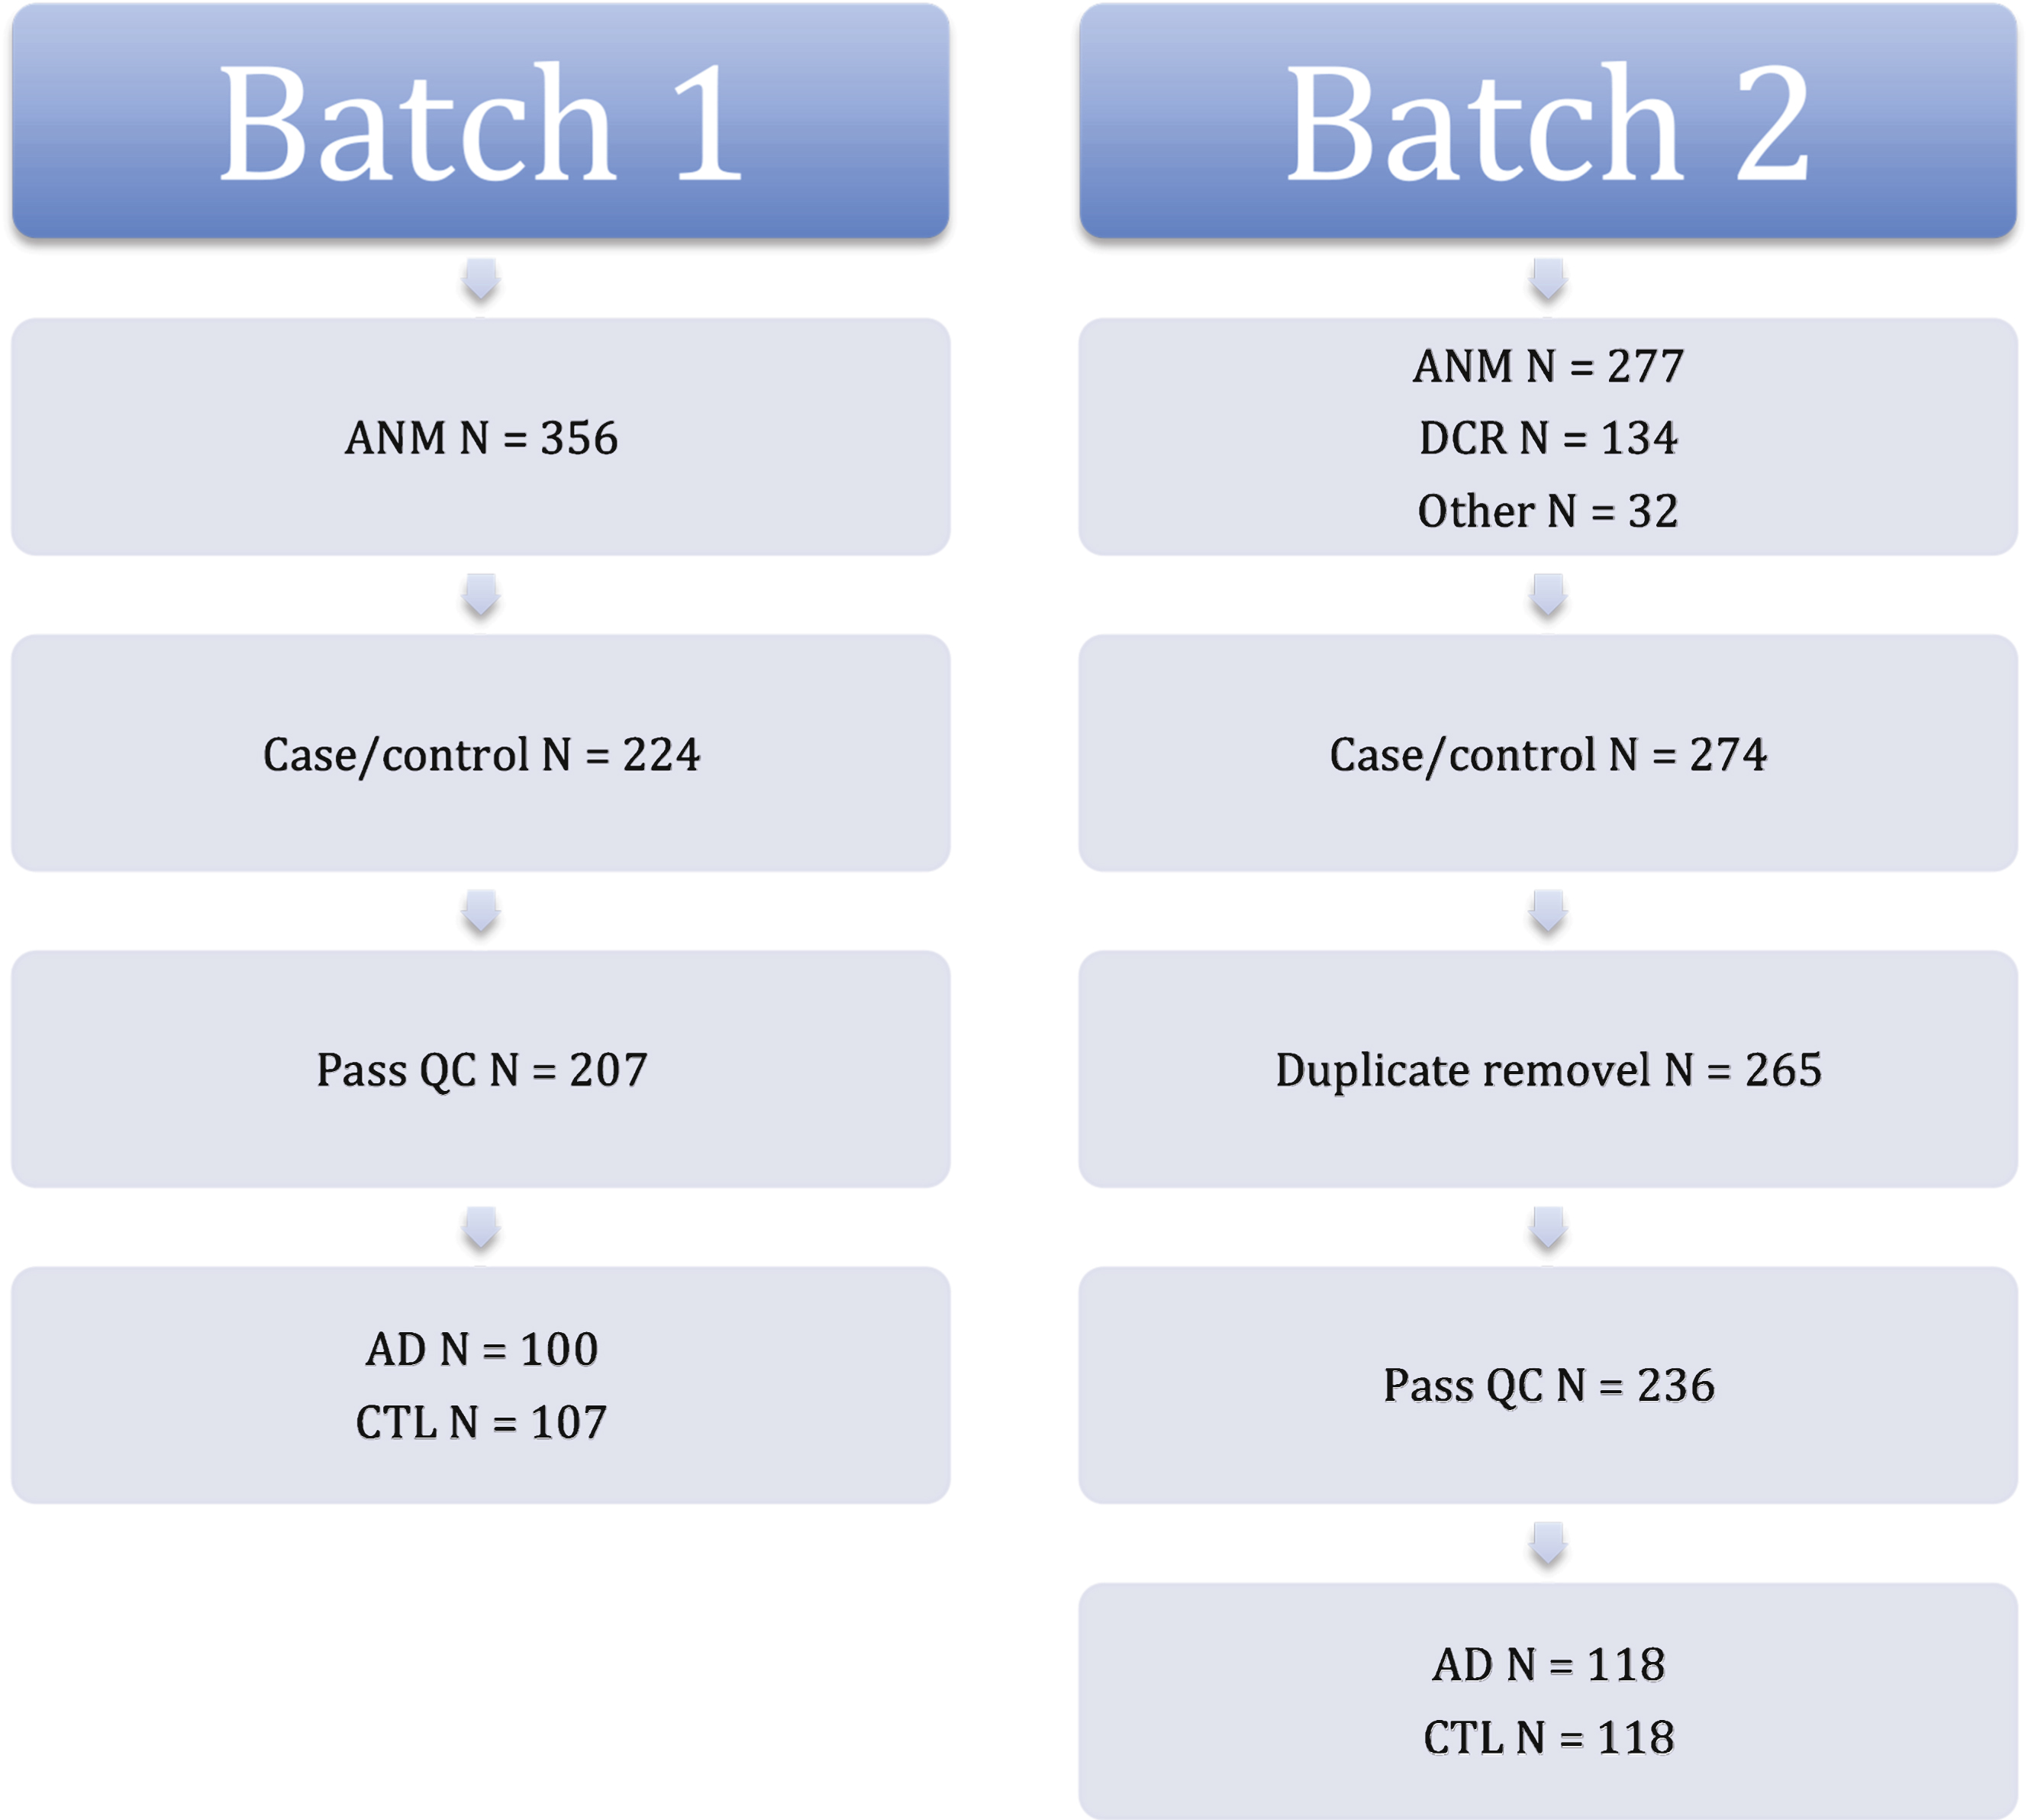
Fig.2
ROC curves for Random Forest models in independent test data. ROC, Receiver Operating Characteristic; AUC, Area under the curve.
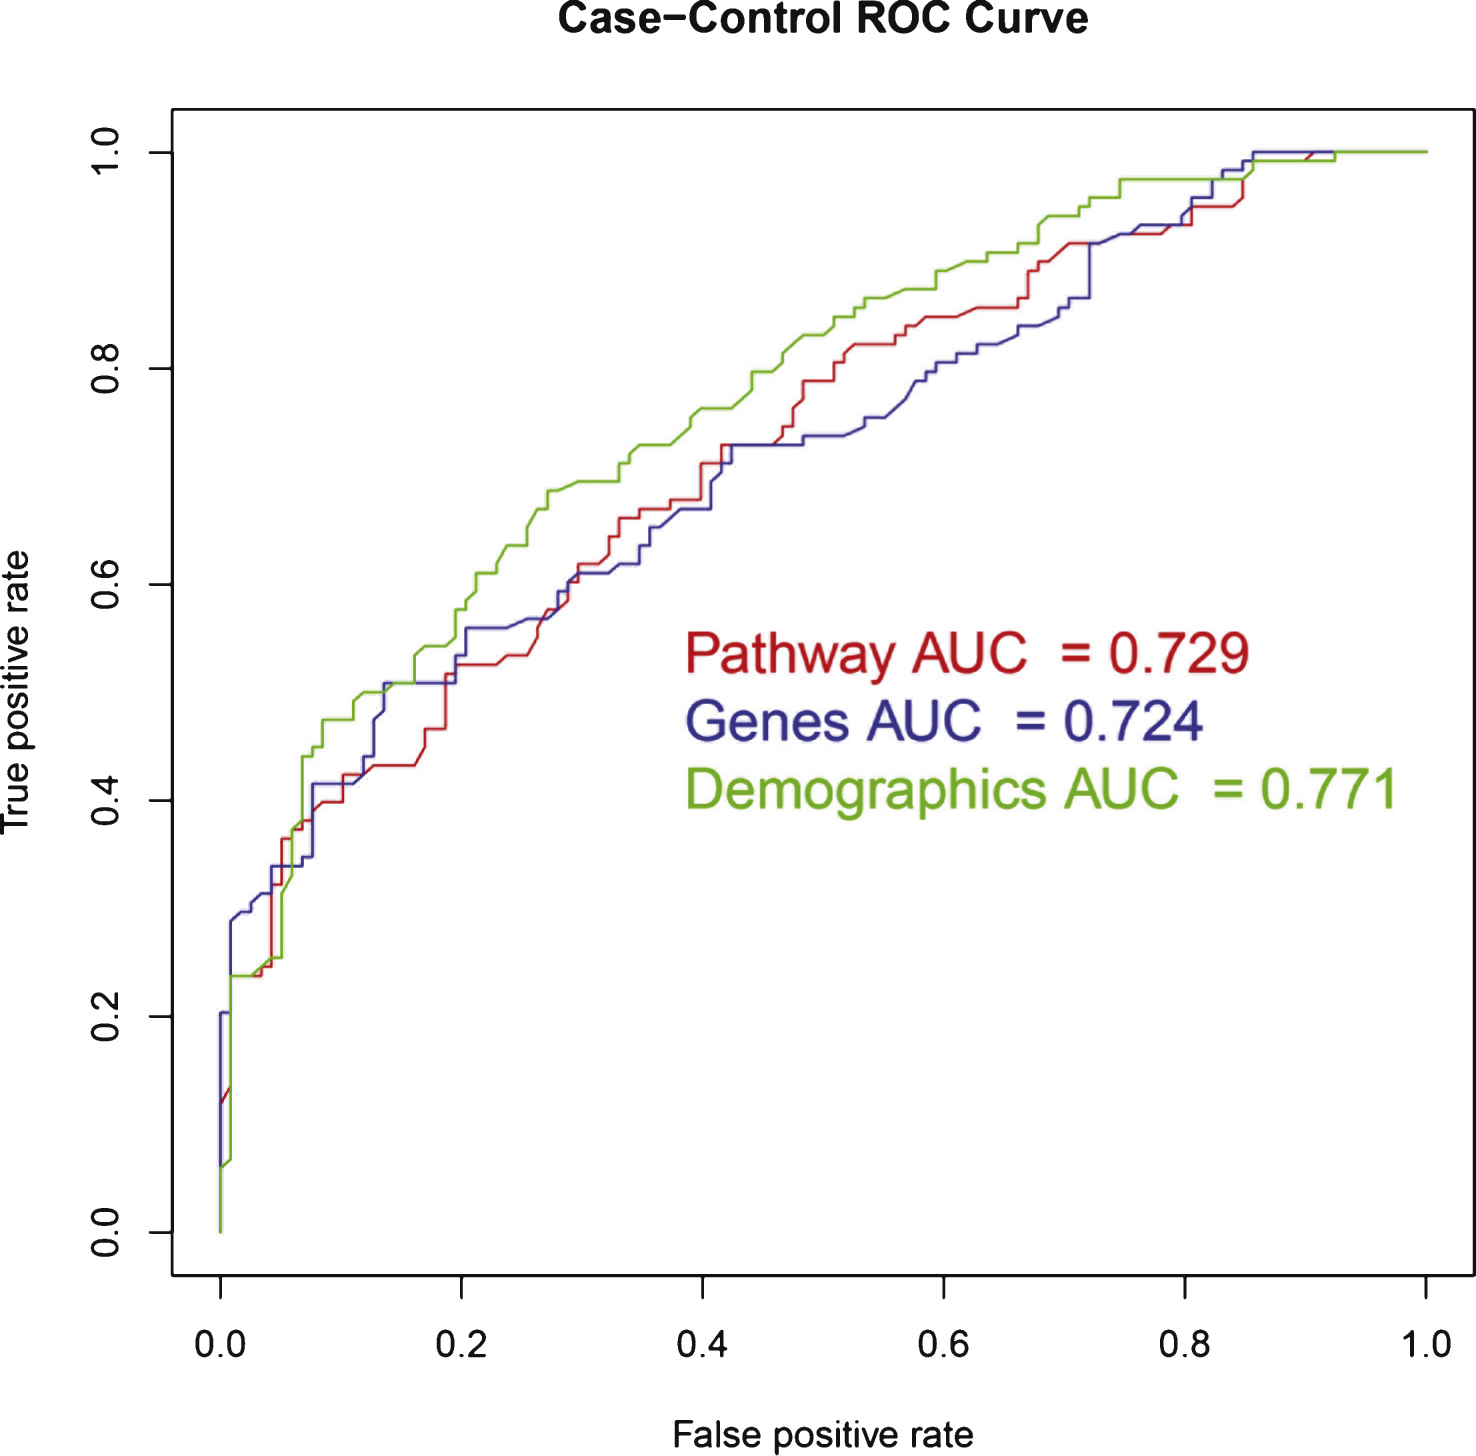
Fig.3
Percentage overlap of genes belonging to pathways selected for the Random Forest pathway model.
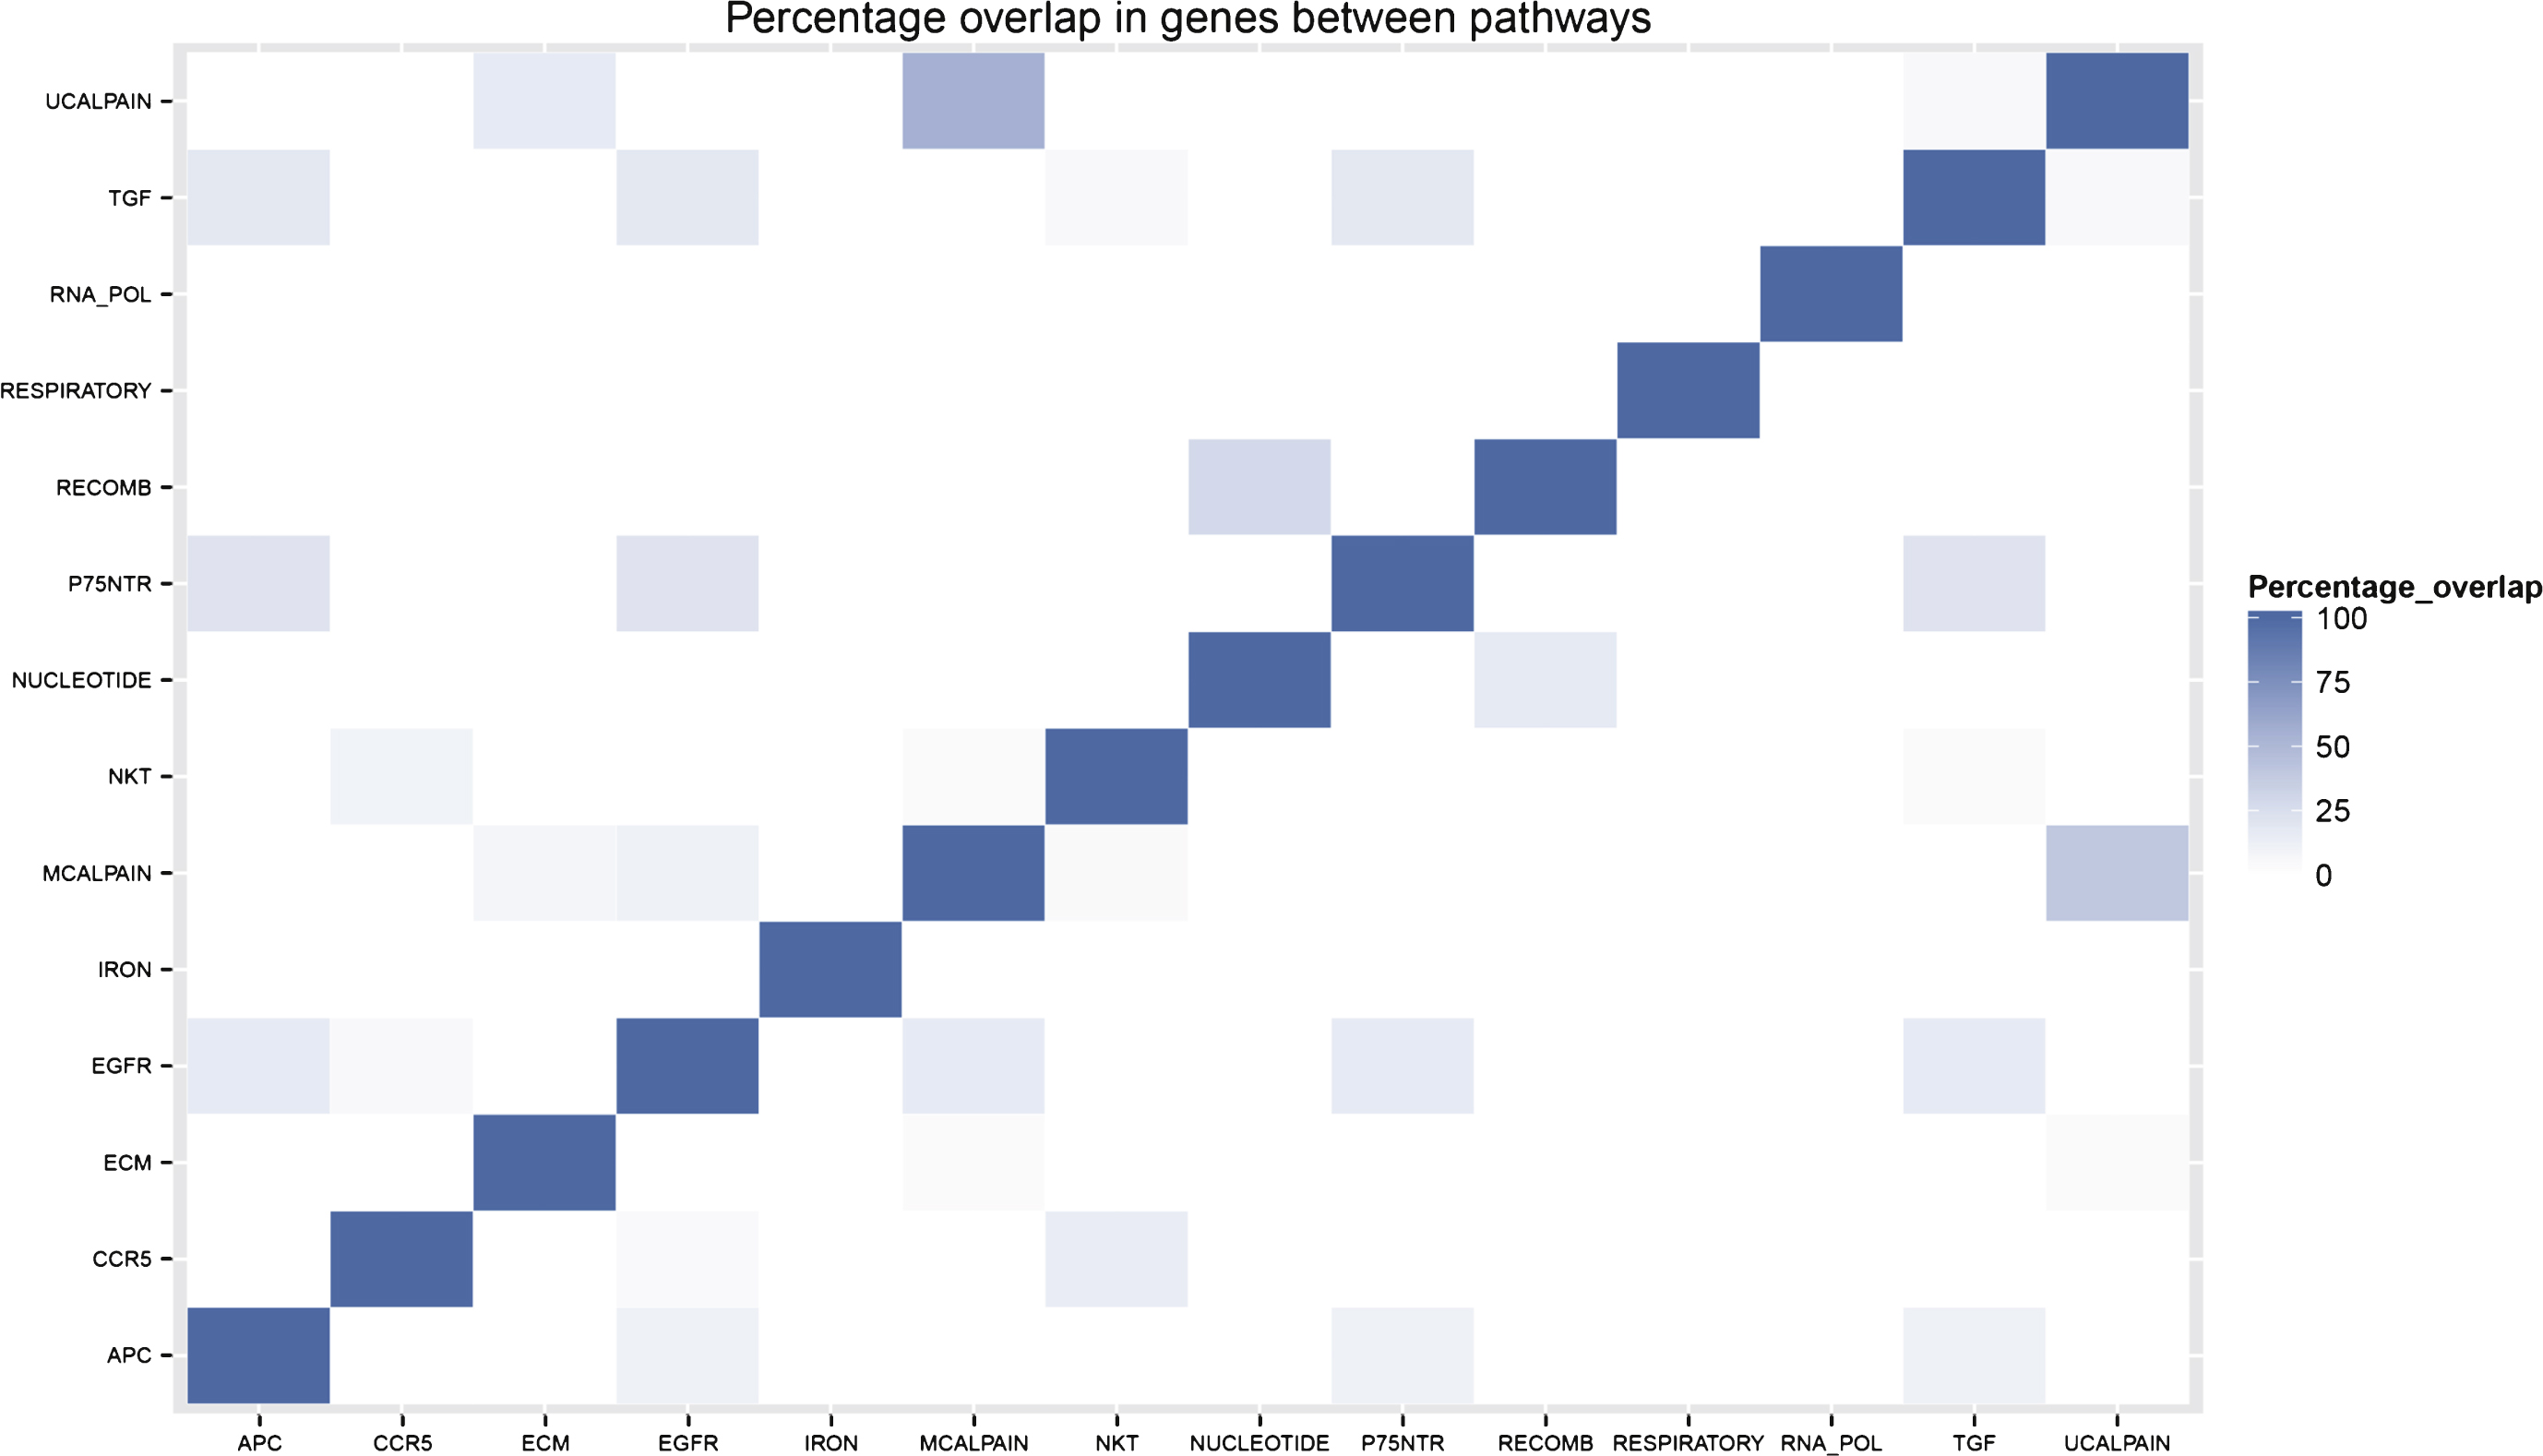
Table 1
Population demographics
| AD | Control | p-value | |
| Batch 1 | |||
| n | 100 | 107 | |
| Sex (% female) | 69 | 58.9 | 0.149 |
| APOE status (% of APOE ɛ4 positive) | 57 | 32.7 | <0.001 |
| APOE ɛ4 load (% with loads 0; 1; 2) | 43; 40; 17 | 67.3; 29; 3.7 | <0.001 |
| Median age [IQR] (years) | 76 [10] | 73 [9] | <0.001 |
| Median MMSE score [IQR] | 22 [7.25] | 29 [1] | <0.001 |
| Median years in fulltime education [IQR] | 7 [5] | 11 [8] | <0.001 |
| Sample collection site | 0.011 | ||
| (% from KPO; LDZ; LND; | 32; 15; 7; | 21.5; 13.1; 21.5; | |
| PRG; THS; TLS) | 26; 12; 8 | 21.5; 6.5; 15.9 |
| Batch 2 | |||
| n | 118 | 118 | |
| Sex (% female) | 63.6 | 61.9 | 0.893 |
| APOE status (% of APOE ɛ4 positive) | 52.5 | 24.6 | <0.001 |
| APOE ɛ4 load (% with loads 0; 1; 2) | 47.5; 39.8; 12.7 | 75.4; 20.3; 4.2 | <0.001 |
| Median age [IQR] (years) | 78 [9] | 74 [8] | 0.001 |
| Median MMSE score [IQR] | 21 [8] | 29 [2] | <0.001 |
| Median years in fulltime education [IQR] | 9 [7] | 11 [5] | 0.001 |
| Sample collection site | 0.002 | ||
| (% from KPO; LDZ; LND; | 10.2; 18.6; 35.6; | 17.8; 7.6; 51.7; | |
| PRG; THS; TLS) | 19.5; 10.2; 5.9 | 17.8; 3.4; 1.7 |
Individuals were positive for APOE ɛ4 if at least one APOE ɛ4 allele was seen in their genotype. APOE ɛ4 load was the number of alleles seen in a subjects genotype. Kruskal Wallis Chi-Squared was used to test between cases and controls for continuous data. Fishers exact was used to test between cases and controls for categorical data. KPO, Kuopio; LDZ, Lodz; LND, London; PRG, Perugia; THS, Thessaloniki; TLS, Toulouse.
Table 2
Random Forest model results in independent test data
| Model | Accuracy [95% CI] | Sensitivity | Specificity | AUC ROC |
| Demographic model | 0.686 [0.623; 0.745] | 0.534 | 0.839 | 0.771 |
| Demographic model (no samples collection site) | 0.674 [0.610; 0.733] | 0.678 | 0.669 | 0.761 |
| Pathway model | 0.657 [0.592; 0.717] | 0.610 | 0.703 | 0.729 |
| Gene model | 0.657 [0.592; 0.717] | 0.568 | 0.746 | 0.724 |
CI, Confidence interval; AUC ROC, Areas under the receiver operating curve.
Table 3
Genes in gene model with variable importance scores
| Gene (Illumina ID) | Variable importance | Gene symbol | Entrez ID | Gene name |
| ILMN_2189936 | 11.9 | RPL36AL | 6166 | Ribosomal protein L36a-like |
| ILMN_2189933 | 10.8 | RPL36AL | 6166 | Ribosomal protein L36a-like |
| ILMN_2097421 | 10.5 | MRPL51 | 51258 | Mitochondrial ribosomal protein L51 |
| ILMN_2237746 | 10.4 | ING3 | 54556 | Inhibitor of growth family, member 3 |
| ILMN_1695645 | 9.2 | CETN2 | 1069 | Centrin, EF-hand protein, 2 |
| ILMN_1784286 | 7.9 | NDUFA1 | 4694 | NADH dehydrogenase (ubiquinone) 1 alpha subcomplex |
| ILMN_1652073 | 7.0 | LOC653658 | 653658 | Ribosomal protein S23 pseudogene 8 |
| ILMN_1716053 | 7.0 | AK2 | 204 | Adenylate kinase 2 |
| ILMN_1732328 | 6.5 | LOC646200 | 646200 | |
| ILMN_1776104 | 5.9 | NDUFS5 | 4725 | NADH dehydrogenase (ubiquinone) Fe-S protein 5 |
| ILMN_1753892 | 5.8 | LOC654121 | 654121 | |
| ILMN_1745343 | 5.4 | ZMAT2 | 153527 | Zinc finger, matrin-type 2 |
| ILMN_2048326 | 4.7 | RPS27A | 6233 | Ribosomal protein S27a |
Table 4
Pathways in pathway model with variable importance scores
| Pathway | Abbreviation | Number of genes in pathway | Variable importance |
| KEGG HOMOLOGOUS RECOMBINATION | RECOMB | 28 | 13.6 * |
| BIOCARTA MCALPAIN PATHWAY | MCALPAIN | 25 | 7.8 * |
| REACTOME APC C CDC20 MEDIATED | APC | 26 | 7.5 |
| DEGRADATION OF CYCLIN B | |||
| REACTOME TGF BETA RECEPTOR SIGNALING IN | TGF | 16 | 7.2 |
| EMT EPITHELIAL TO MESENCHYMAL TRANSITION | |||
| REACTOME P75NTR SIGNALS VIA NFKB | P75NTR | 14 | 6.9 |
| BIOCARTA UCALPAIN PATHWAY | UCALPAIN | 18 | 6.8 |
| REACTOME RNA POL III TRANSCRIPTION | RNA_POL | 33 | 6.4 |
| BIOCARTA NKT PATHWAY | NKT | 29 | 6.0 |
| KEGG NUCLEOTIDE EXCISION REPAIR | NUCLEOTIDE | 44 | 5.9 |
| REACTOME IRON UPTAKE AND TRANSPORT | IRON | 36 | 5.3 |
| BIOCARTA CCR5 PATHWAY | CCR5 | 20 | 5.3 |
| KEGG ECM RECEPTOR INTERACTION | ECM | 84 | 5.0 |
| REACTOME SIGNALING BY CONSTITUTIVELY ACTIVE EGFR | EGFR | 18 | 5.0 |
| REACTOME RESPIRATORY ELECTRON TRANSPORT ATP | RESPIRATORY | 98 | 4.4 |
| SYNTHESIS BY CHEMIOSMOTIC COUPLING AND | |||
| HEAT PRODUCTION BY UNCOUPLING PROTEINS |
*Nominally significant in permutation testing (p < 0.05).

