
α2δ1 may be a potential marker for cancer stem cell in laryngeal squamous cell carcinoma
Abstract
Cancer stem cells (CSCs) have the ability to dictate tumor initiation, recurrence, and metastasis. Here, we examined the expression of a
1.Background
Laryngeal cancer is the second most common head and neck malignancy. Globally, approximately 110,000 to 130,000 new cases are diagnosed each year [1]. In China, the crude incidence rate of laryngeal cancer was 1.86/100,000 between 2008 and 2012 and the crude mortality was 1.01/100,000 [2]. Mainstay treatments for laryngeal cancer include radiotherapy, chemotherapy and surgical resection; however, management of advanced laryngeal cancer is complex and a consensus therapeutic strategy has not yet emerged.
Cancer stem cells (CSCs) are implicated in tumor initiation and differentiation, and are of high self-renewal properties, and can drive the tumorigenic process. The ability of CSCs to drive cancer initiation and progression also make them prime targets for treatments [4]. Evidence suggests that a minor population of CSCs in laryngeal cancer is extremely tumorigenic and possesses the potential to differentiate into cells that are responsible for tumor propagation and relapse [4]. Laryngeal CSCs are characterized by the expression of aldehyde dehydrogenase isoform 1 (ALDH1) [5], CD133 [6], and CD44 [7, 8]. However, laryngeal CSCs appear to differ considerably and may contribute to the heterogeneity of laryngeal cancer [9]. The calcium channel
Currently, no study is available on the role of
2.Materials and methods
2.1General design
The current study included 3 major parts. In the first part that involved clinical samples,
2.2Tissue specimen acquisition
Archived surgically resected laryngeal squamous cell carcinoma (LSCC) tissue specimens were obtained from 16 treatment-naive male patients and snap-frozen in liquid nitrogen. The study protocol was approved by the institute ethics committee of Beijing Friendship Hospital, Capital Medical University (no. 2017-P2-187-01) and written informed consent was obtained from all the study subjects.
2.3Immunofluorescence staining
Frozen tissues were sectioned with acryostat and fixed with methanol for 30 seconds. After blocking with 5% nonfat milk in PBS, slides were incubated with
2.4Cells
Human LSCC cell lines TU212 and TU686 were obtained from Shanghai Huiying Biological Technology (Shanghai, China), and were cultured in RPMI 1640 medium (Invitrogen, Grand Island, NY, USA) supplemented with 10% fetal bovine serum (FBS), 100 U/mL penicillin, and 100 mg/mL streptomycin (Invitrogen) at 37
Table 1
Primer sequences for quantitative PCR in the study
| Gene | Sense | Anti-sense |
|---|---|---|
| BMI1 | 5-AGCAGCAATGACTGTGATGC-3 | 5-CAGTCTCAGGTATCAACCAG-3 |
| SOX2 | 5-ACATGAACGGCTGGAGCAAC-3 | 5-AGGAAGAGGTAACCACAGGG-3 |
| EPCAM | 5-CTGAATTCTCAATGCAGGGTC-3 | 5-CCCATCTCCTTTATCTCAGCC-3 |
| OCT-4 | 5-TGGGCTCGAGAAGGATGTGGTC-3 | 5-AGTTTGAATGCATGGGAGAGC-3 |
| CTNNB | 5-TGATGGAGTTGGACATGGCC-3 | 5-CTCATACAGGACTTGGGAGG-3 |
| KLF4 | 5-AAGCCAAAGAGGGGAAGAC-3 | 5-CATCTGAGCGGGCGAATTTC-3 |
| NANOG | 5-TGCCTCACACGGAGACTGTC-3 | 5-TGCTATTCTTCGGCCAGTTG-3 |
| ABCG2 | 5-GGAGGCCTTGGGATACTTTGAA-3 | 5-GAGCTATAGAGGCCTGGGGATTAC-3 |
| MDR-1 | 5-GCCTGGCAGCTGGAAGACAAATAC-3 | 5-ATGGCCAAAATCACAAGGGTTAGC-3 |
| GAPDH | 5-GACCCCTTCATTGACCTCAAC-3 | 5-CTTCTCCATGGTGGTGAAGA-3 |
2.5Flow cytometry
For isolation of
2.6Quantitative reverse transcription (qRT)-PCR
Total RNA was extracted from
2.7Plasmids
Retroviral-based plasmids containing a short hairpin RNA (shRNA) against human
2.8Sphere formation assays
Sphere-formation assays were carried out as previously published [10]. Briefly,
2.9Cell differentiation assays
Figure 1.
Expression of
2.10Matrigel assays
For detection of migration and invasion of
2.11Tumor xenograft assays
Four to 6 week-old female non-obese diabetic/severe combined immunodeficient (NOD/SCID) female mice were purchased from Huafu Kang Experimental Animal Co., Ltd (Beijing, China), and maintained in a SPF facility. All animal experiments were performed in accordance with the National Institutes of Health Guide for the Care and Use of Laboratory Animals. The protocols were approved by the Animal Care and Use Committee at Peking University Cancer Hospital.
Cells were suspended in 50 mL in a 1:1 mixture of RPMI 1640 and Matrigel (BD Biosciences) and 10
2.12Statistical analysis
Data was analyzed using SPSS 17.0 software (IBM, Armonk, New York, NY, USA). Student’s
Figure 2.
Expression of stem cell and drug efflux and resistance genes in
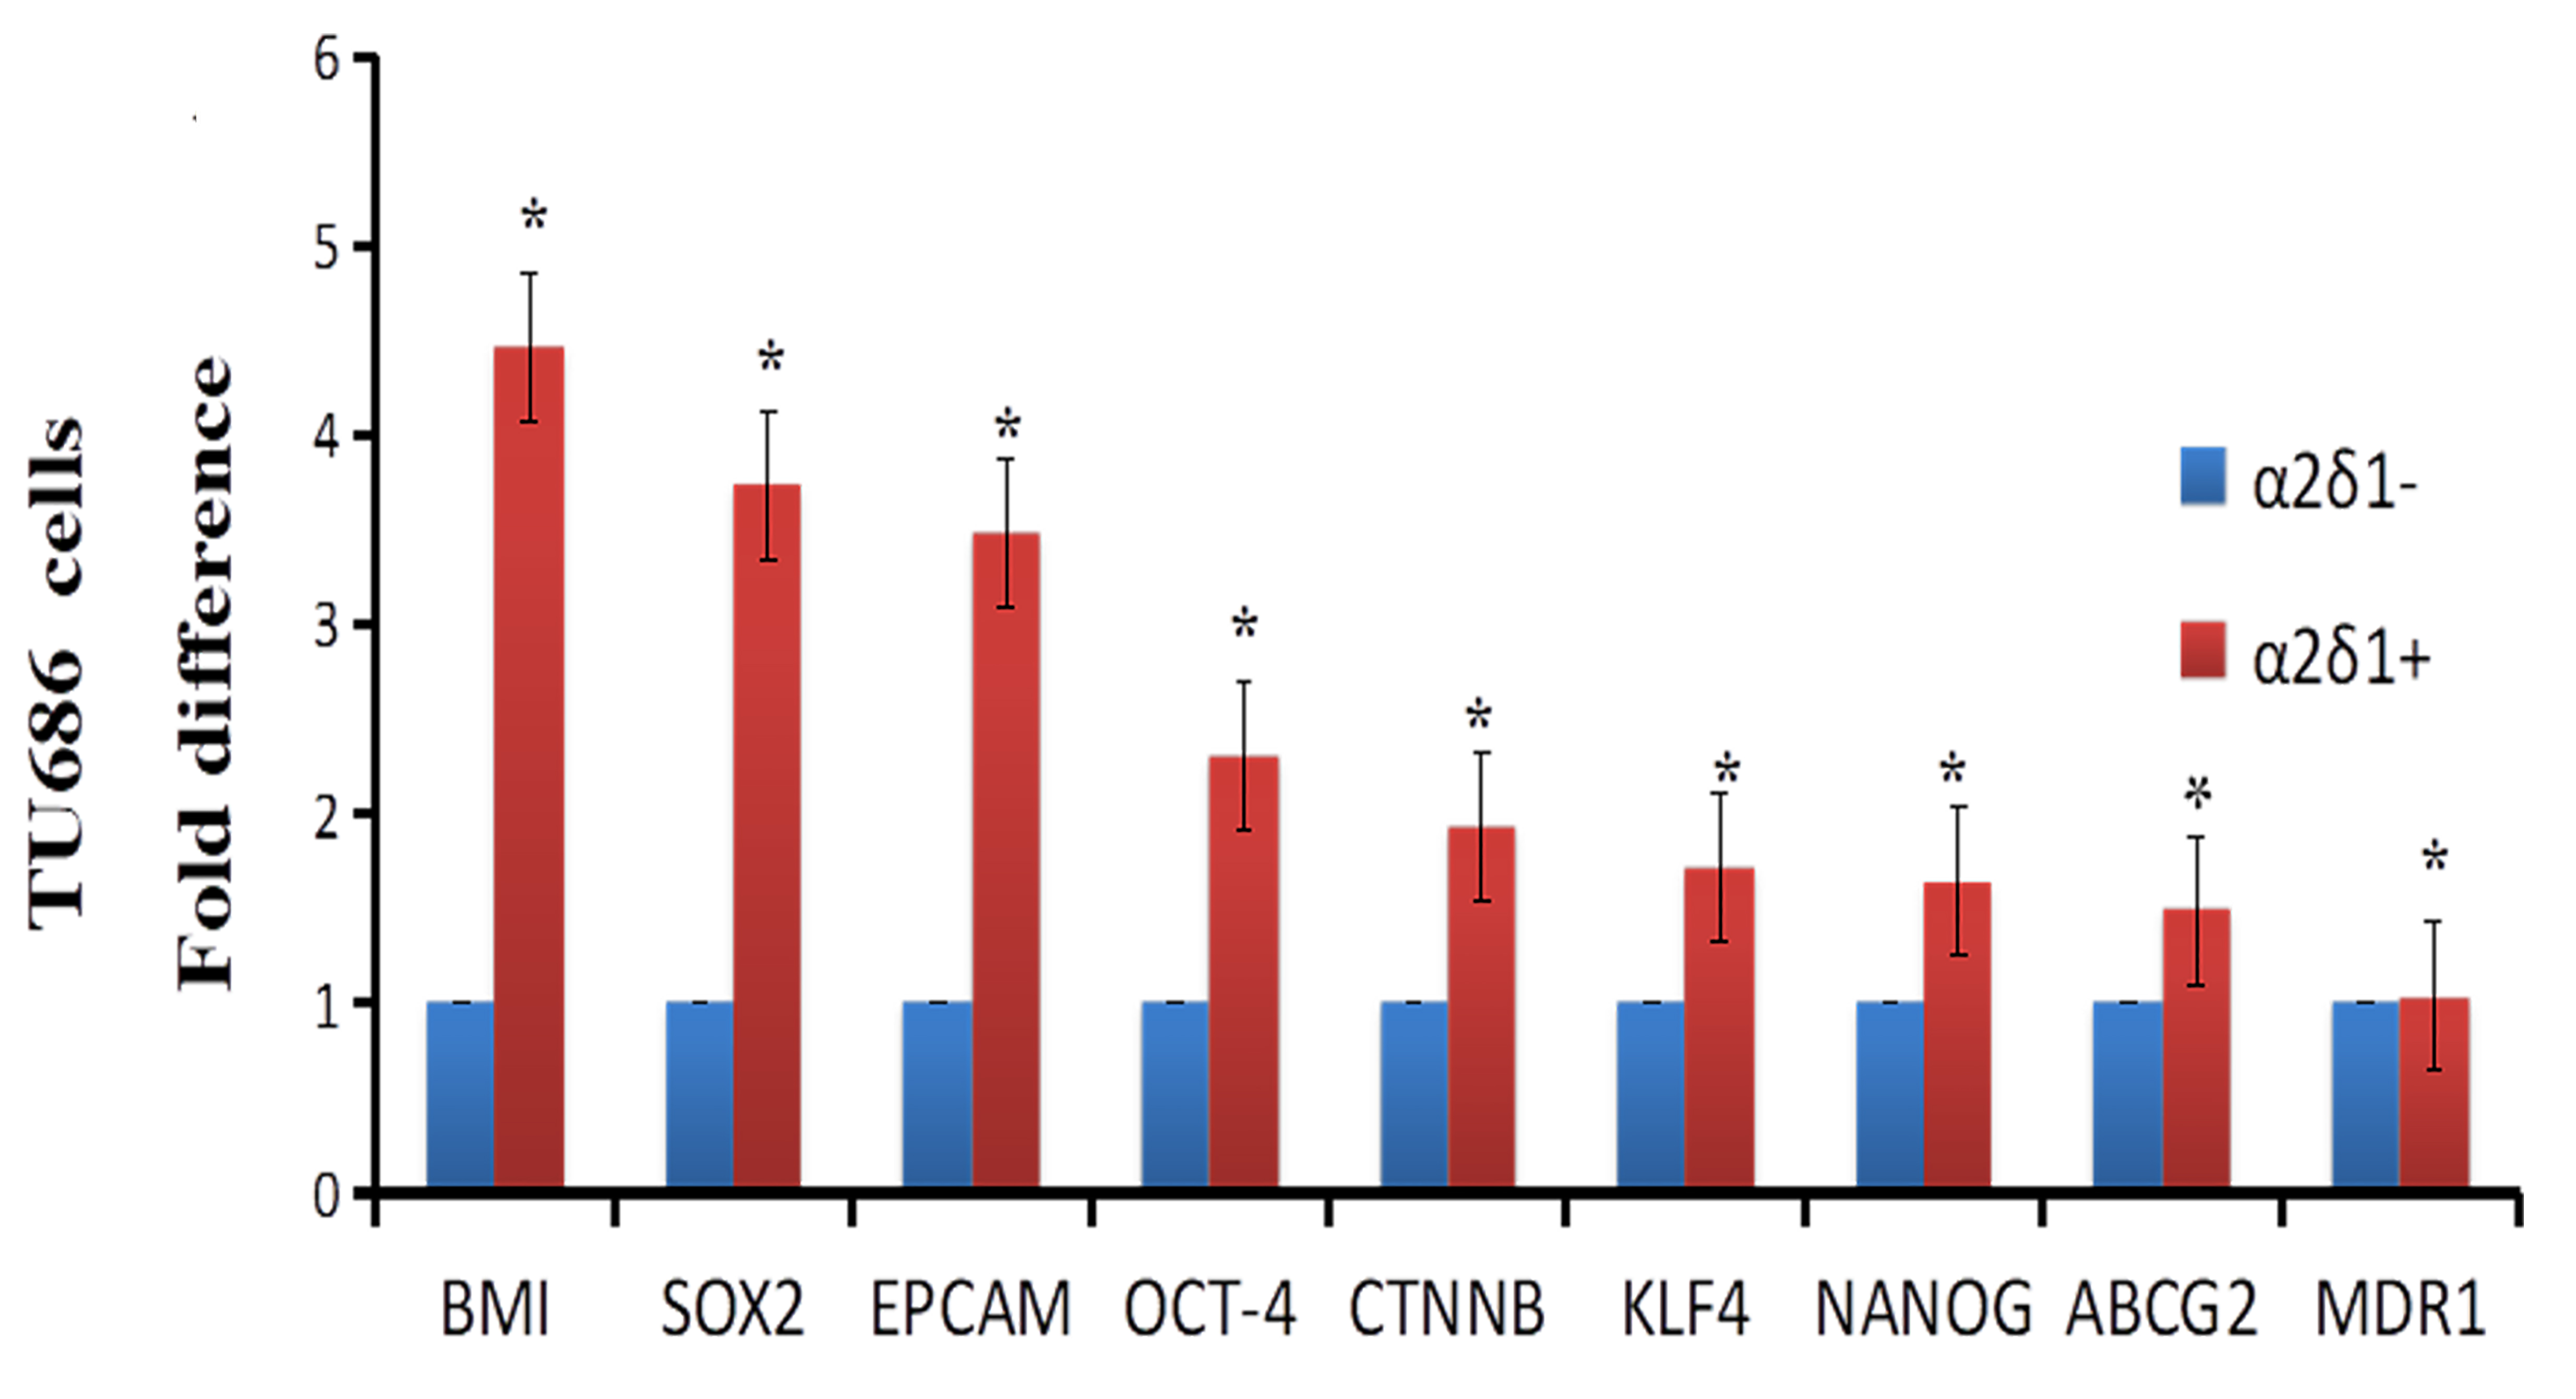
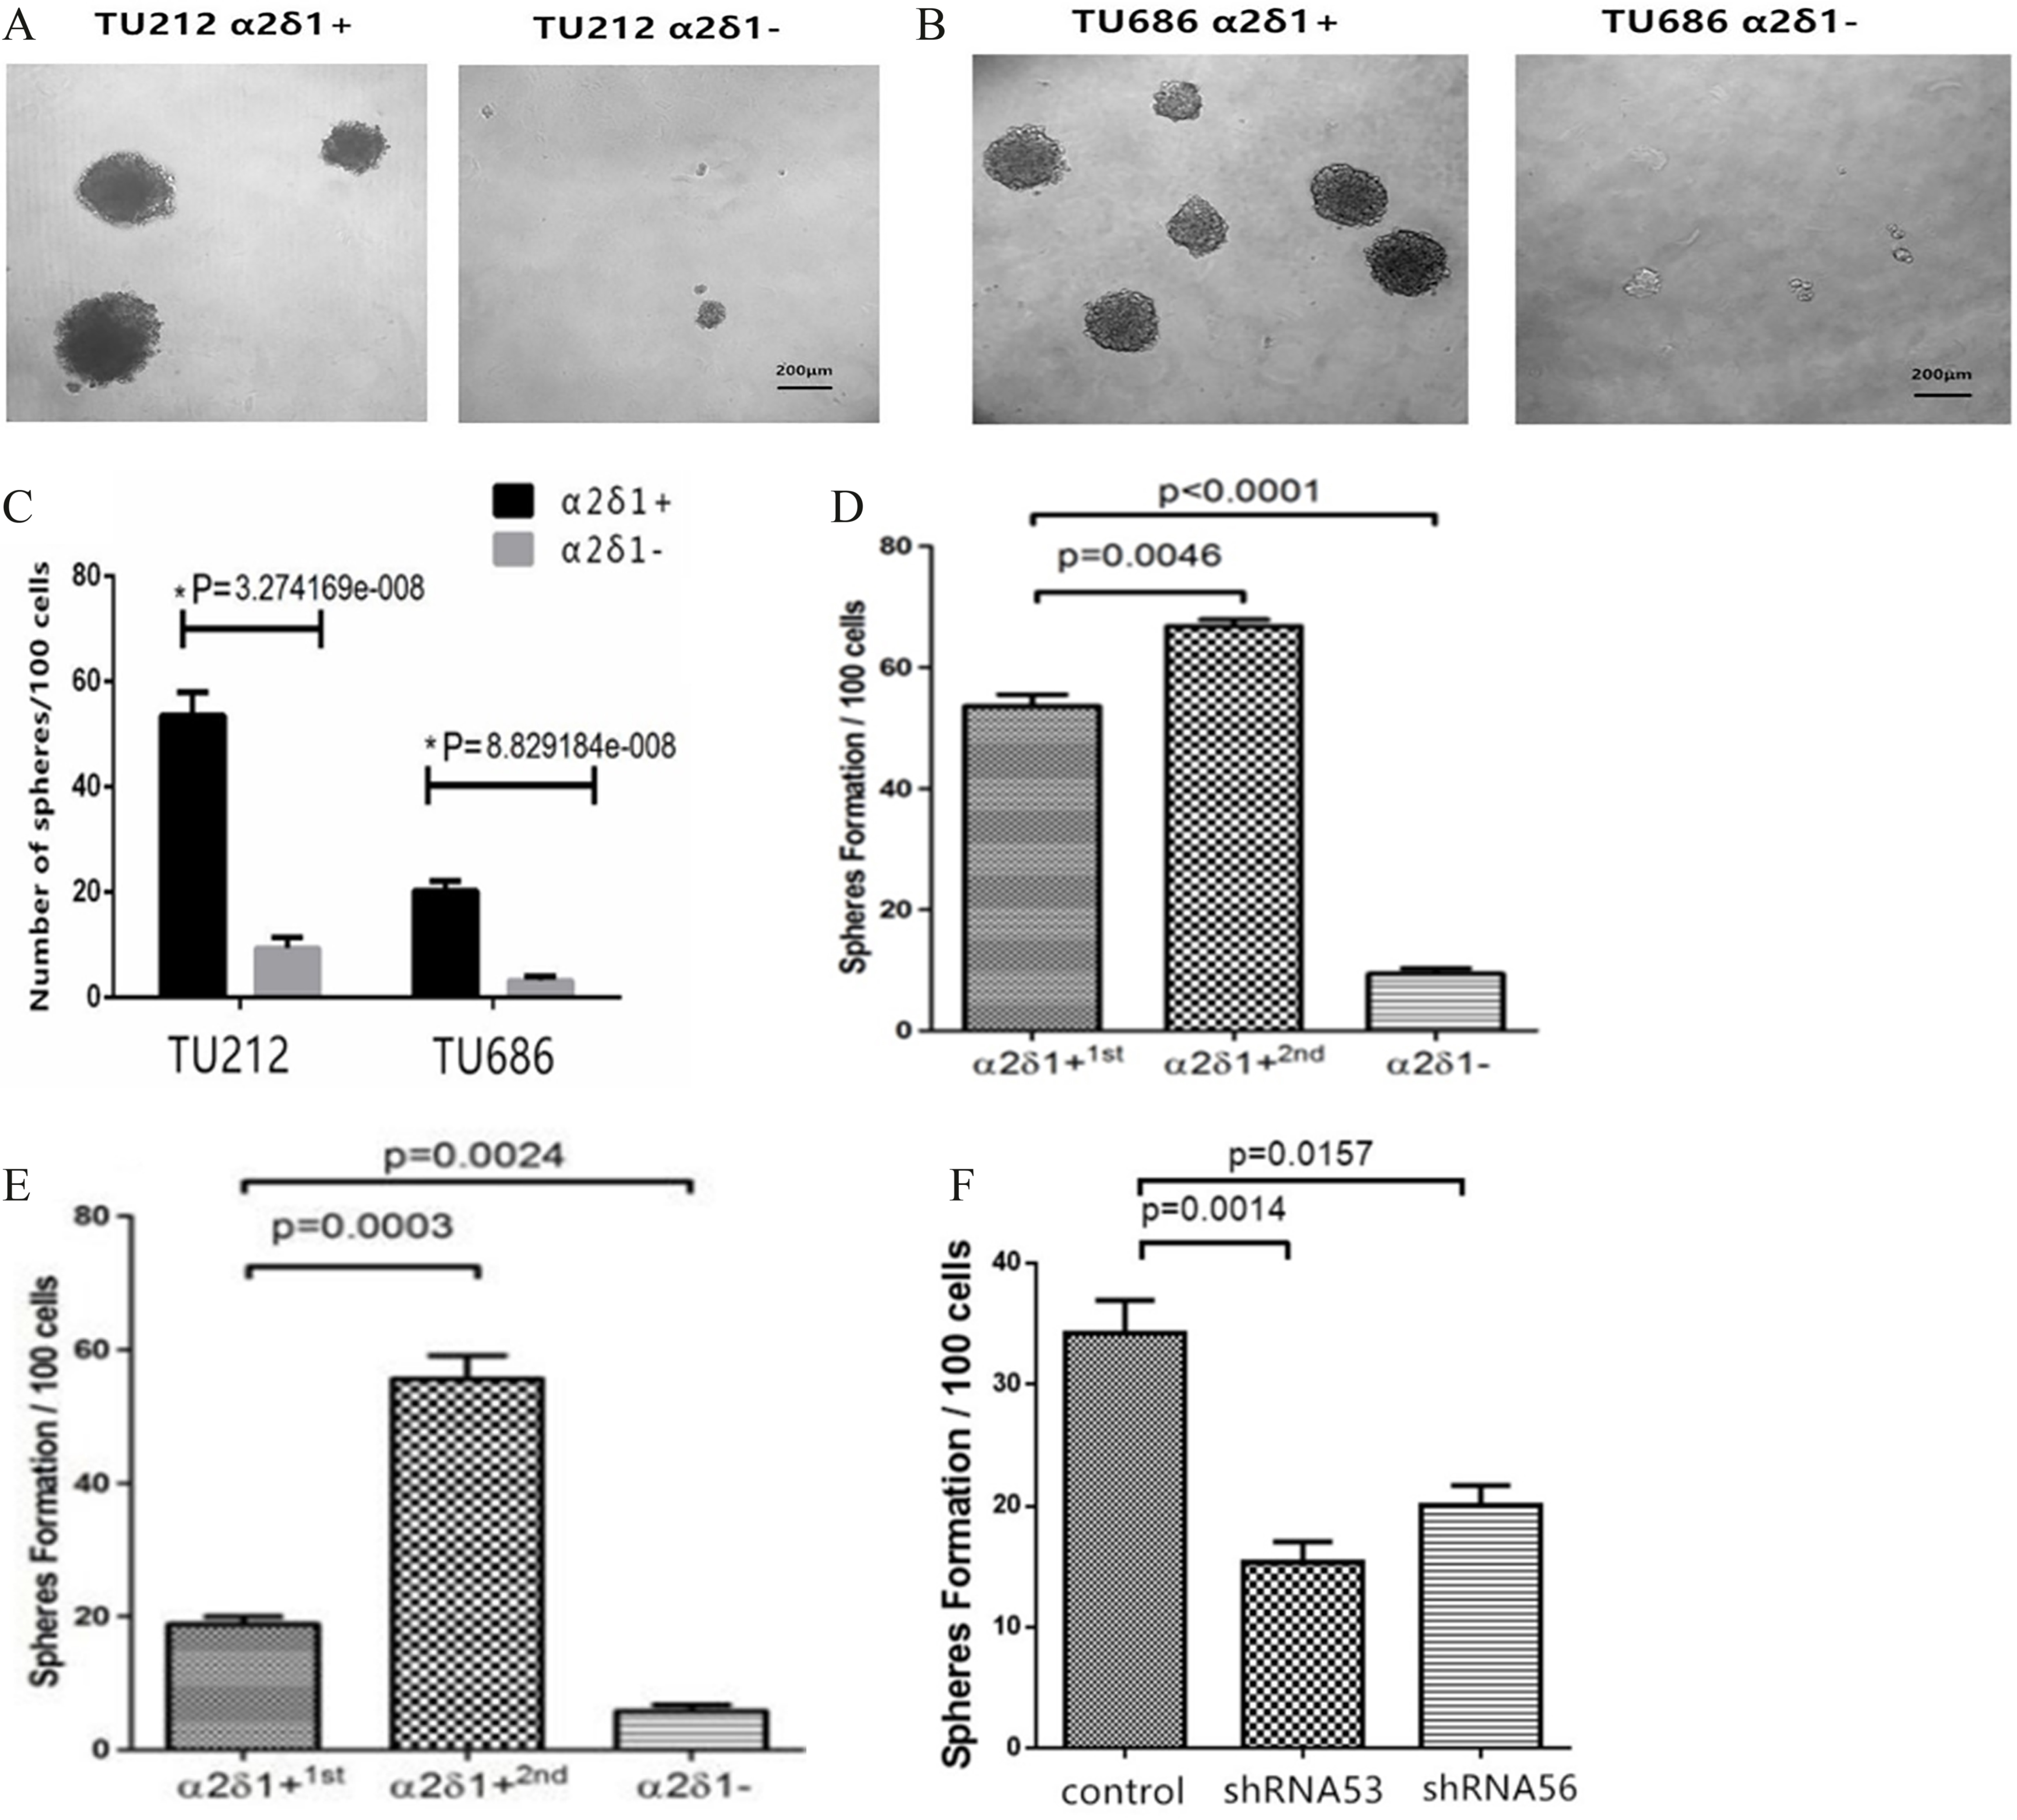
Figure 3.
Sphere-forming efficiency of
3.Results
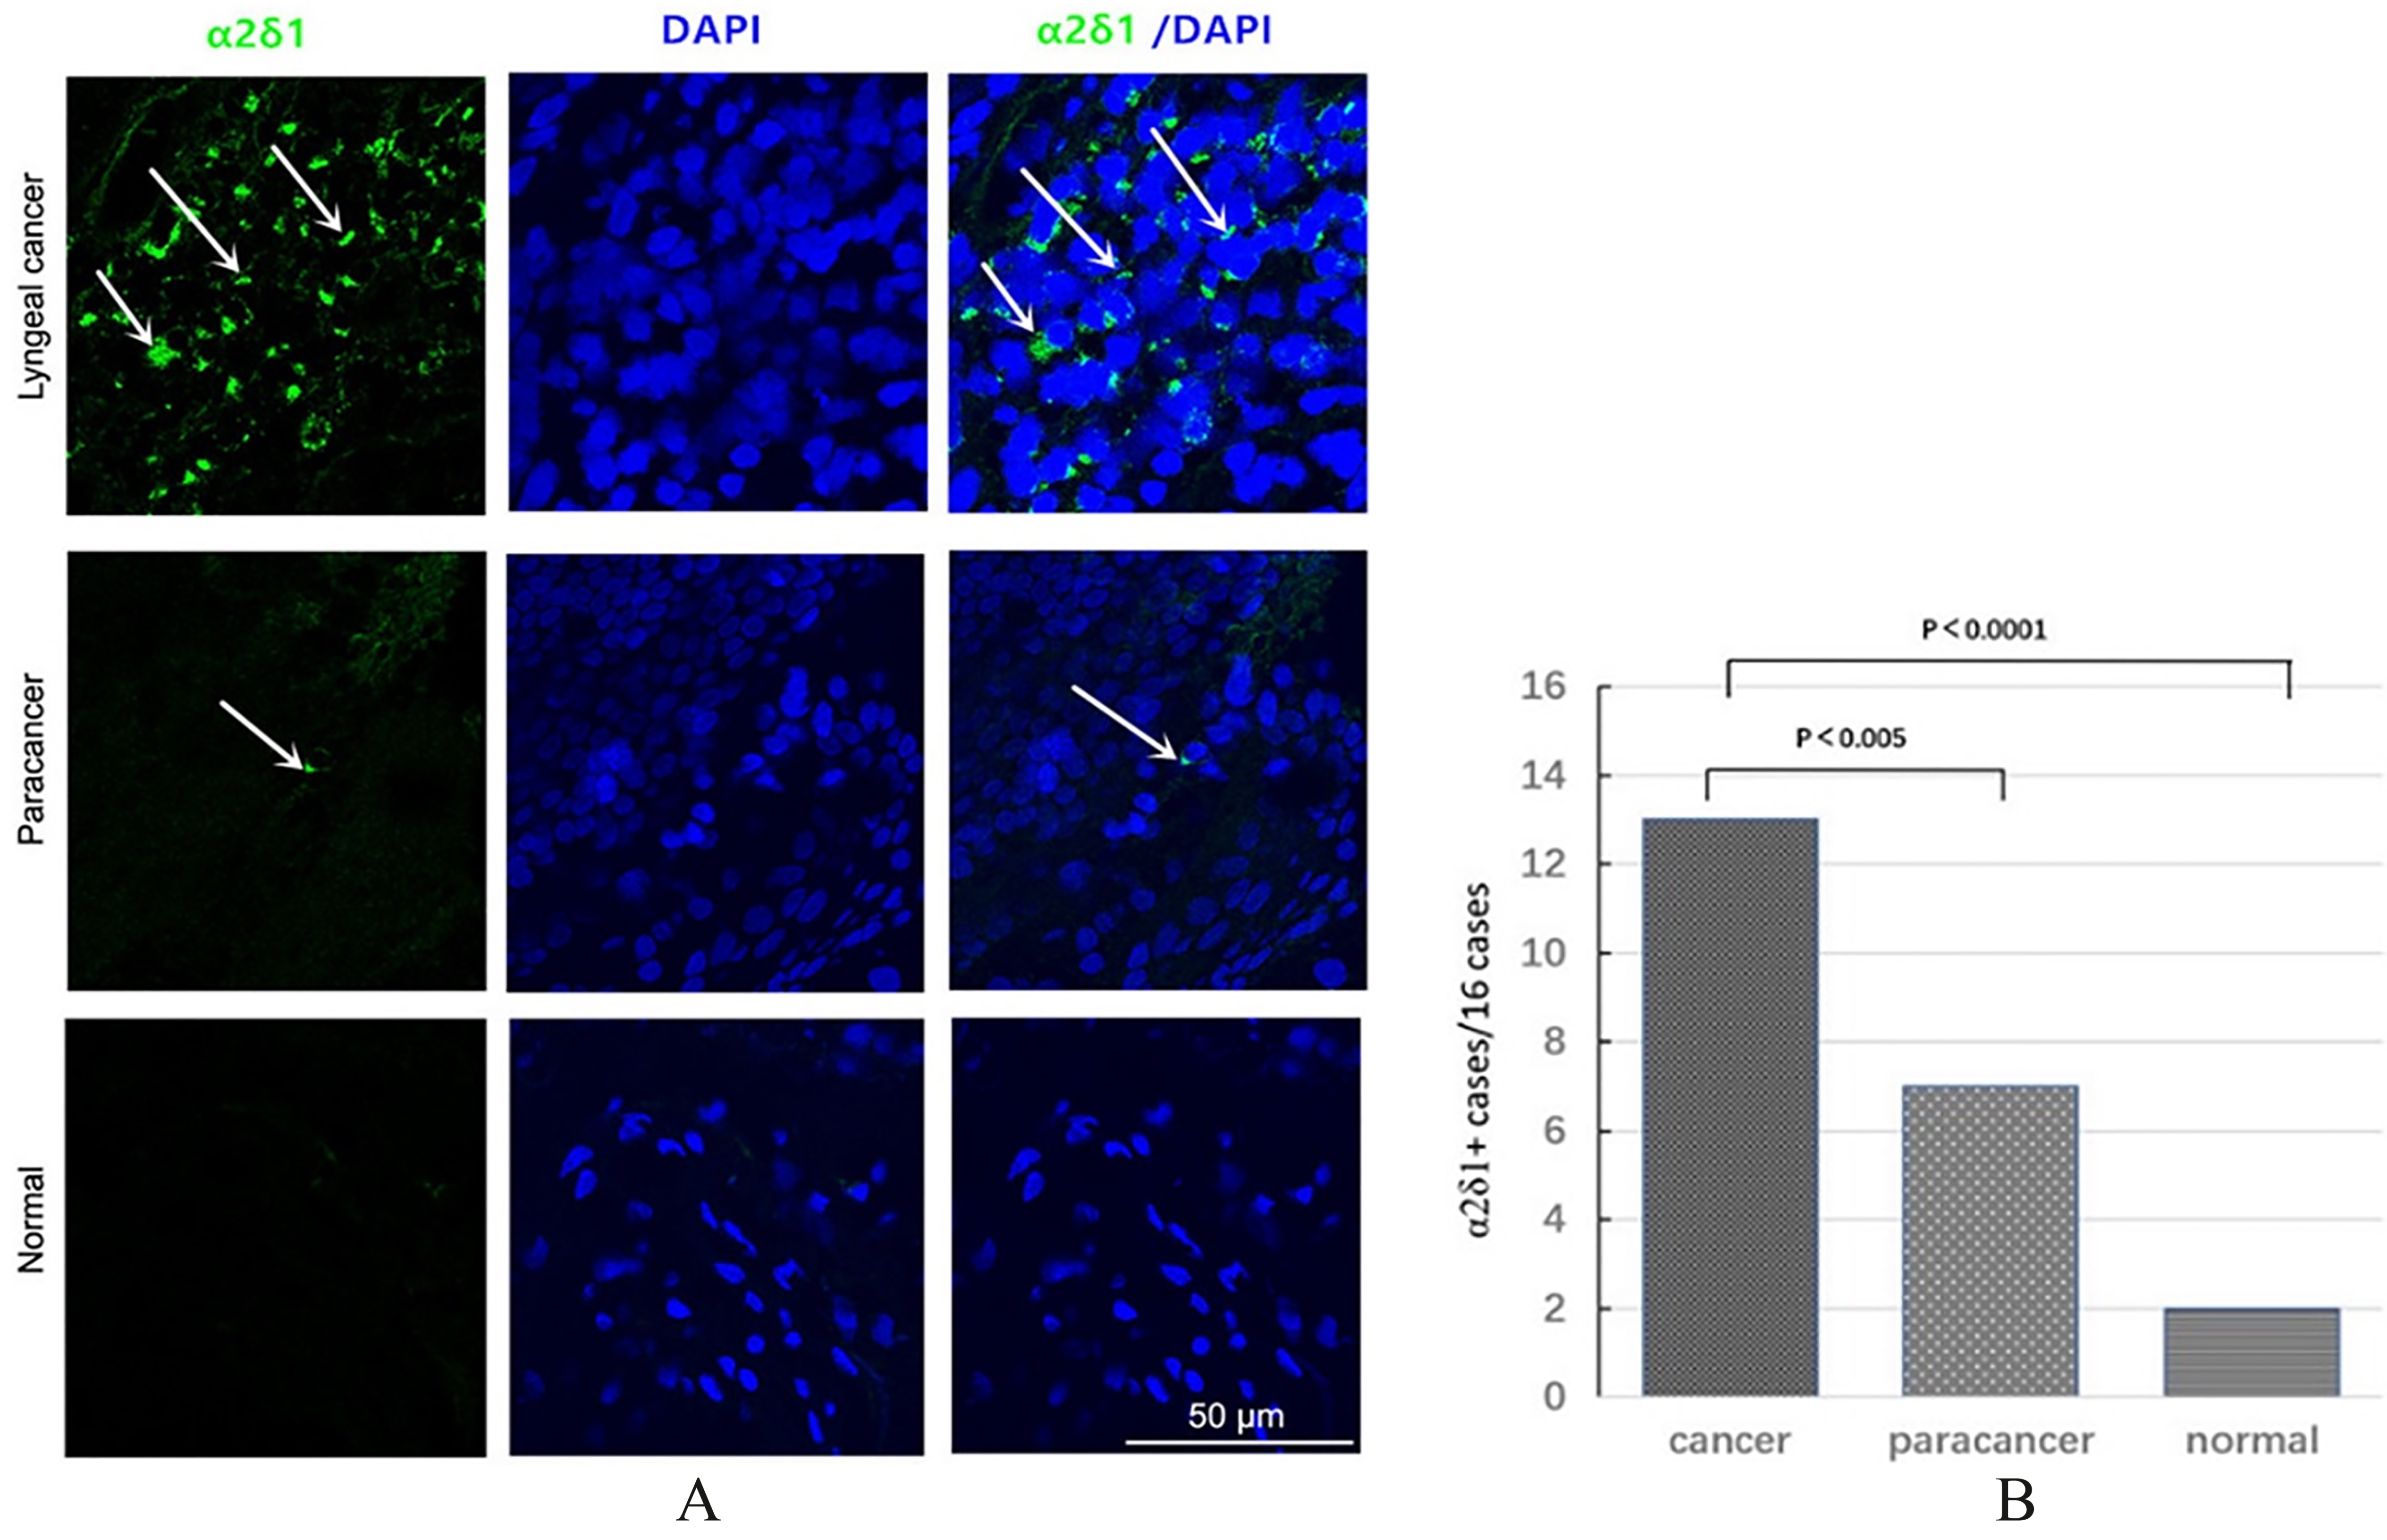
3.1α δ
Immunofluorescence staining revealed abundant
3.2Stem cells-associated genes and drug efflux and resistance genes are significantly upregulated in α δ +
We isolated
3.3Self-renewal property of α δ +
Sphere formation assays further showed that
3.4Differentiation properties of α δ +
After purified TU212
3.5Migratory and invasive potential of α δ +
Our Matrigel assays showed that
3.6Chemoresistance of α δ +
We treated TU686 cells with cisplatin (6
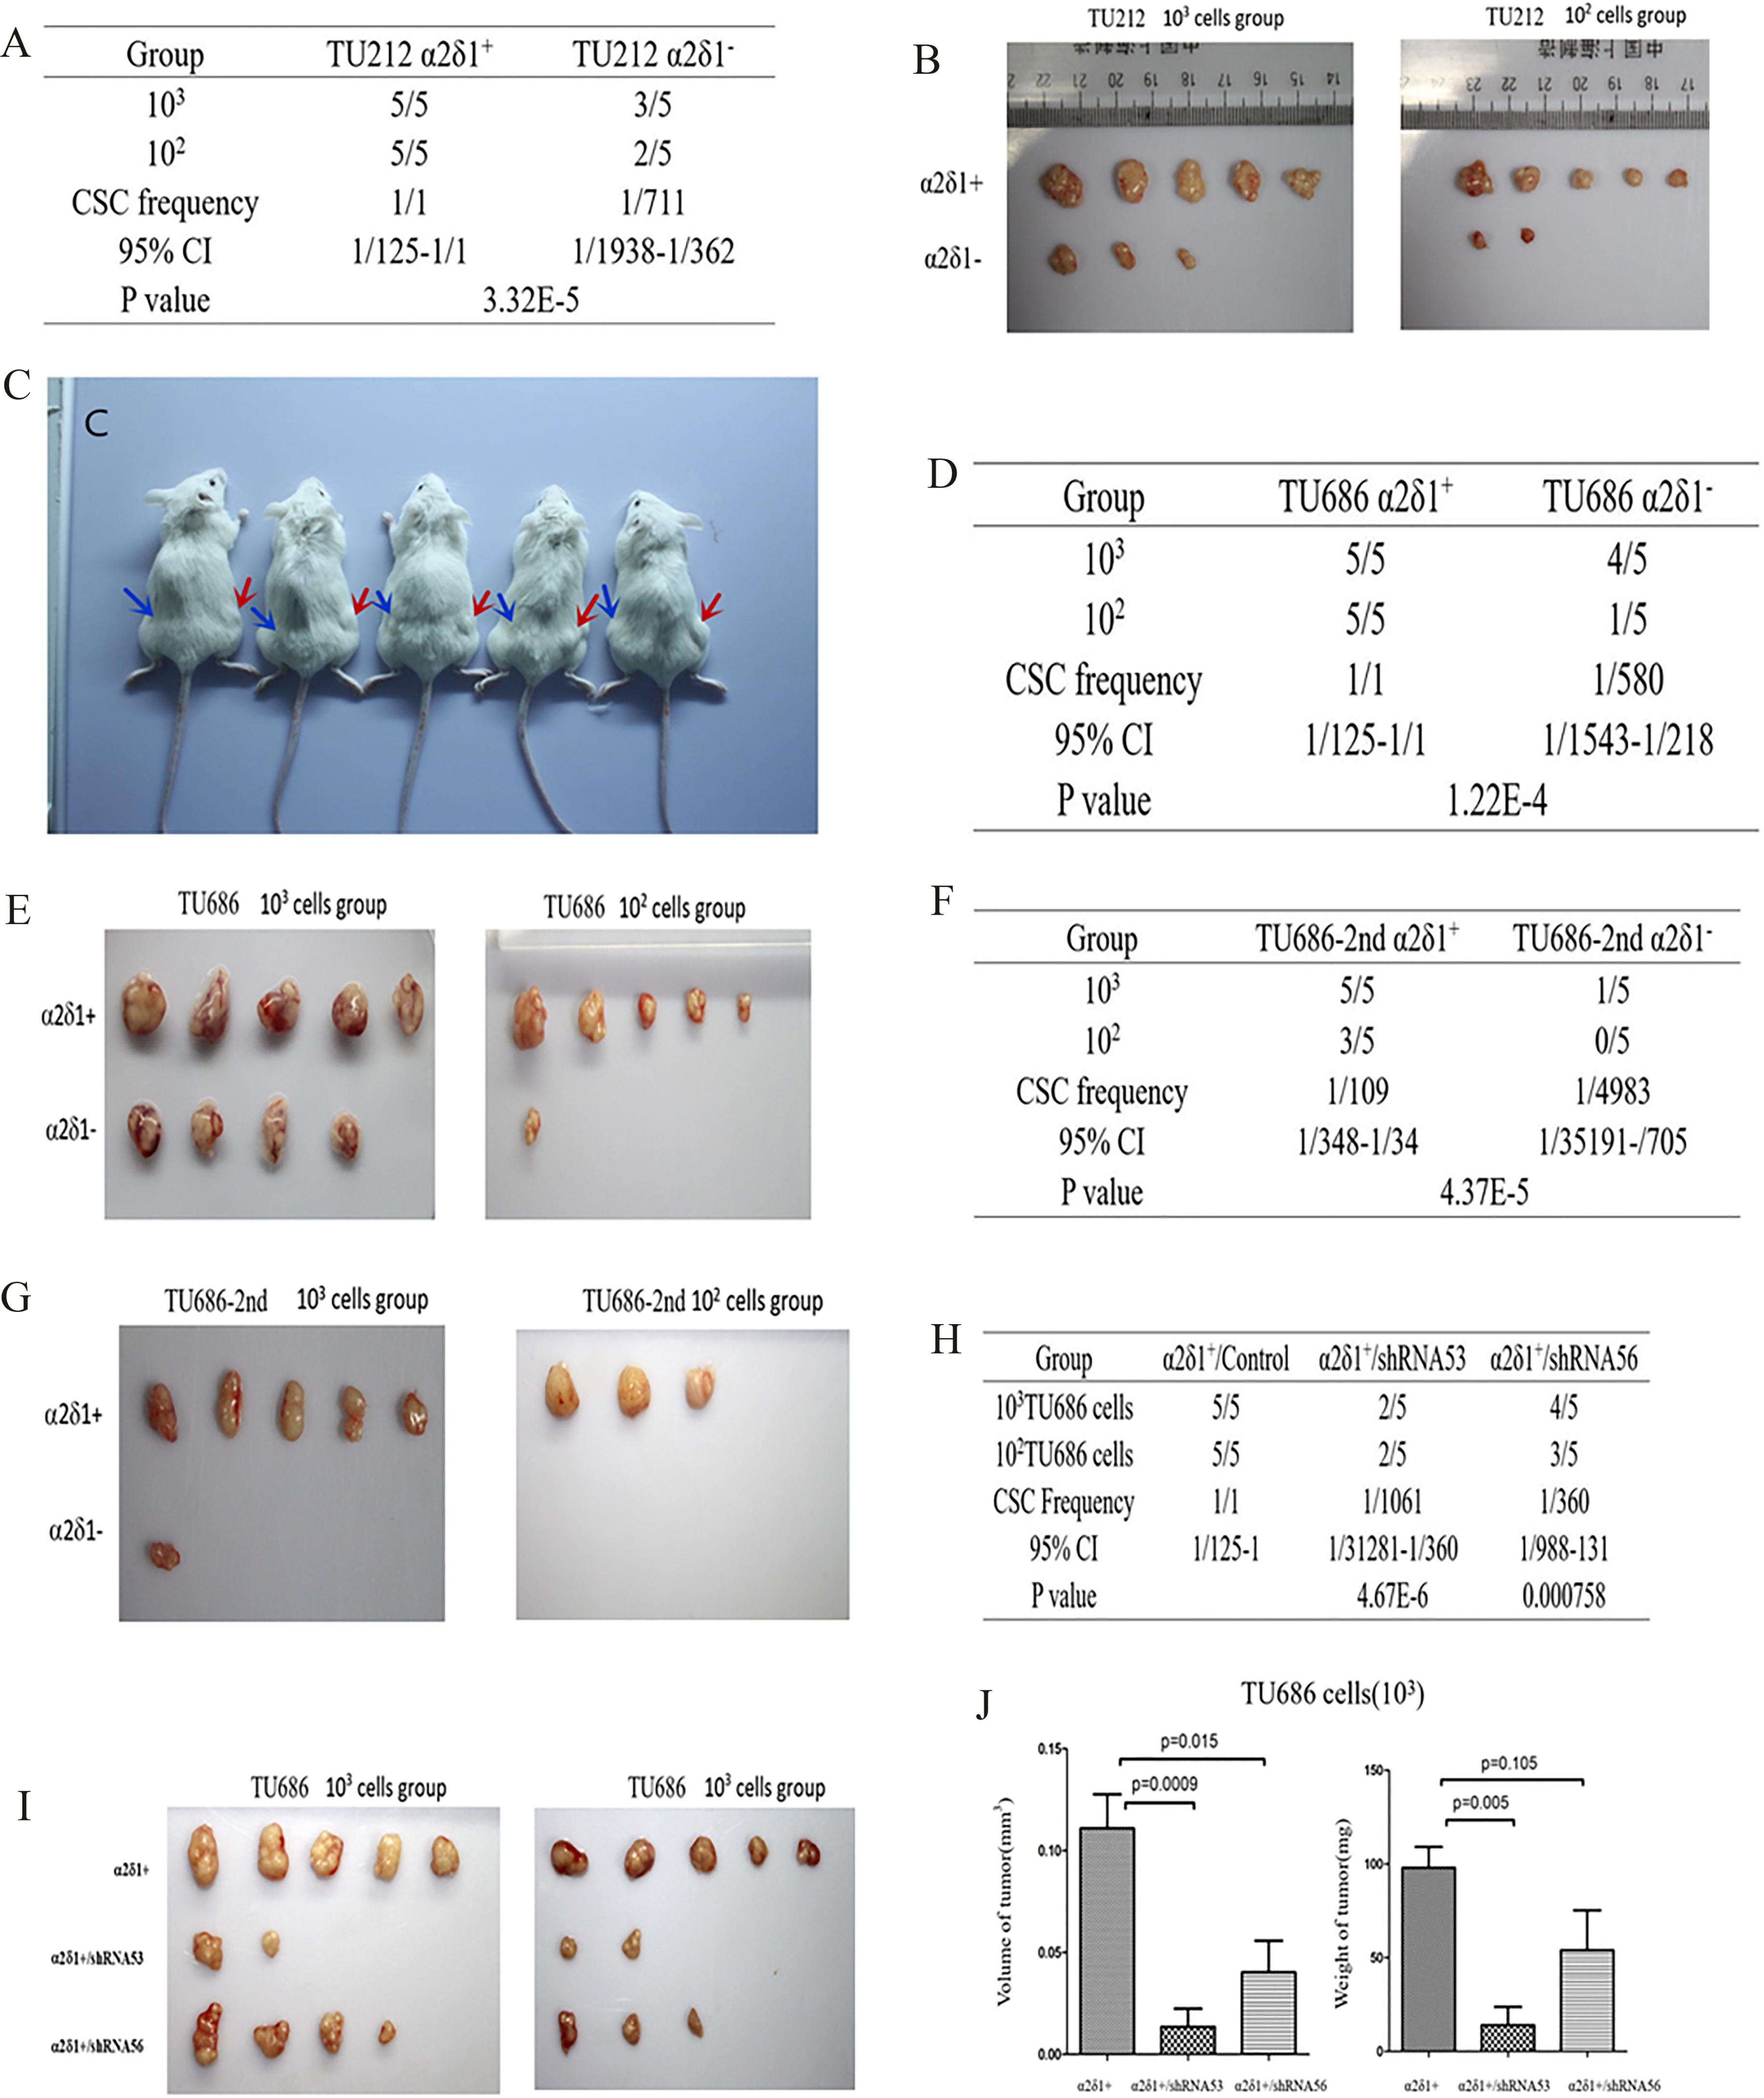
3.7Tumorigenesis of α δ +
As few as 10
Figure 4.
Differentiation properties of
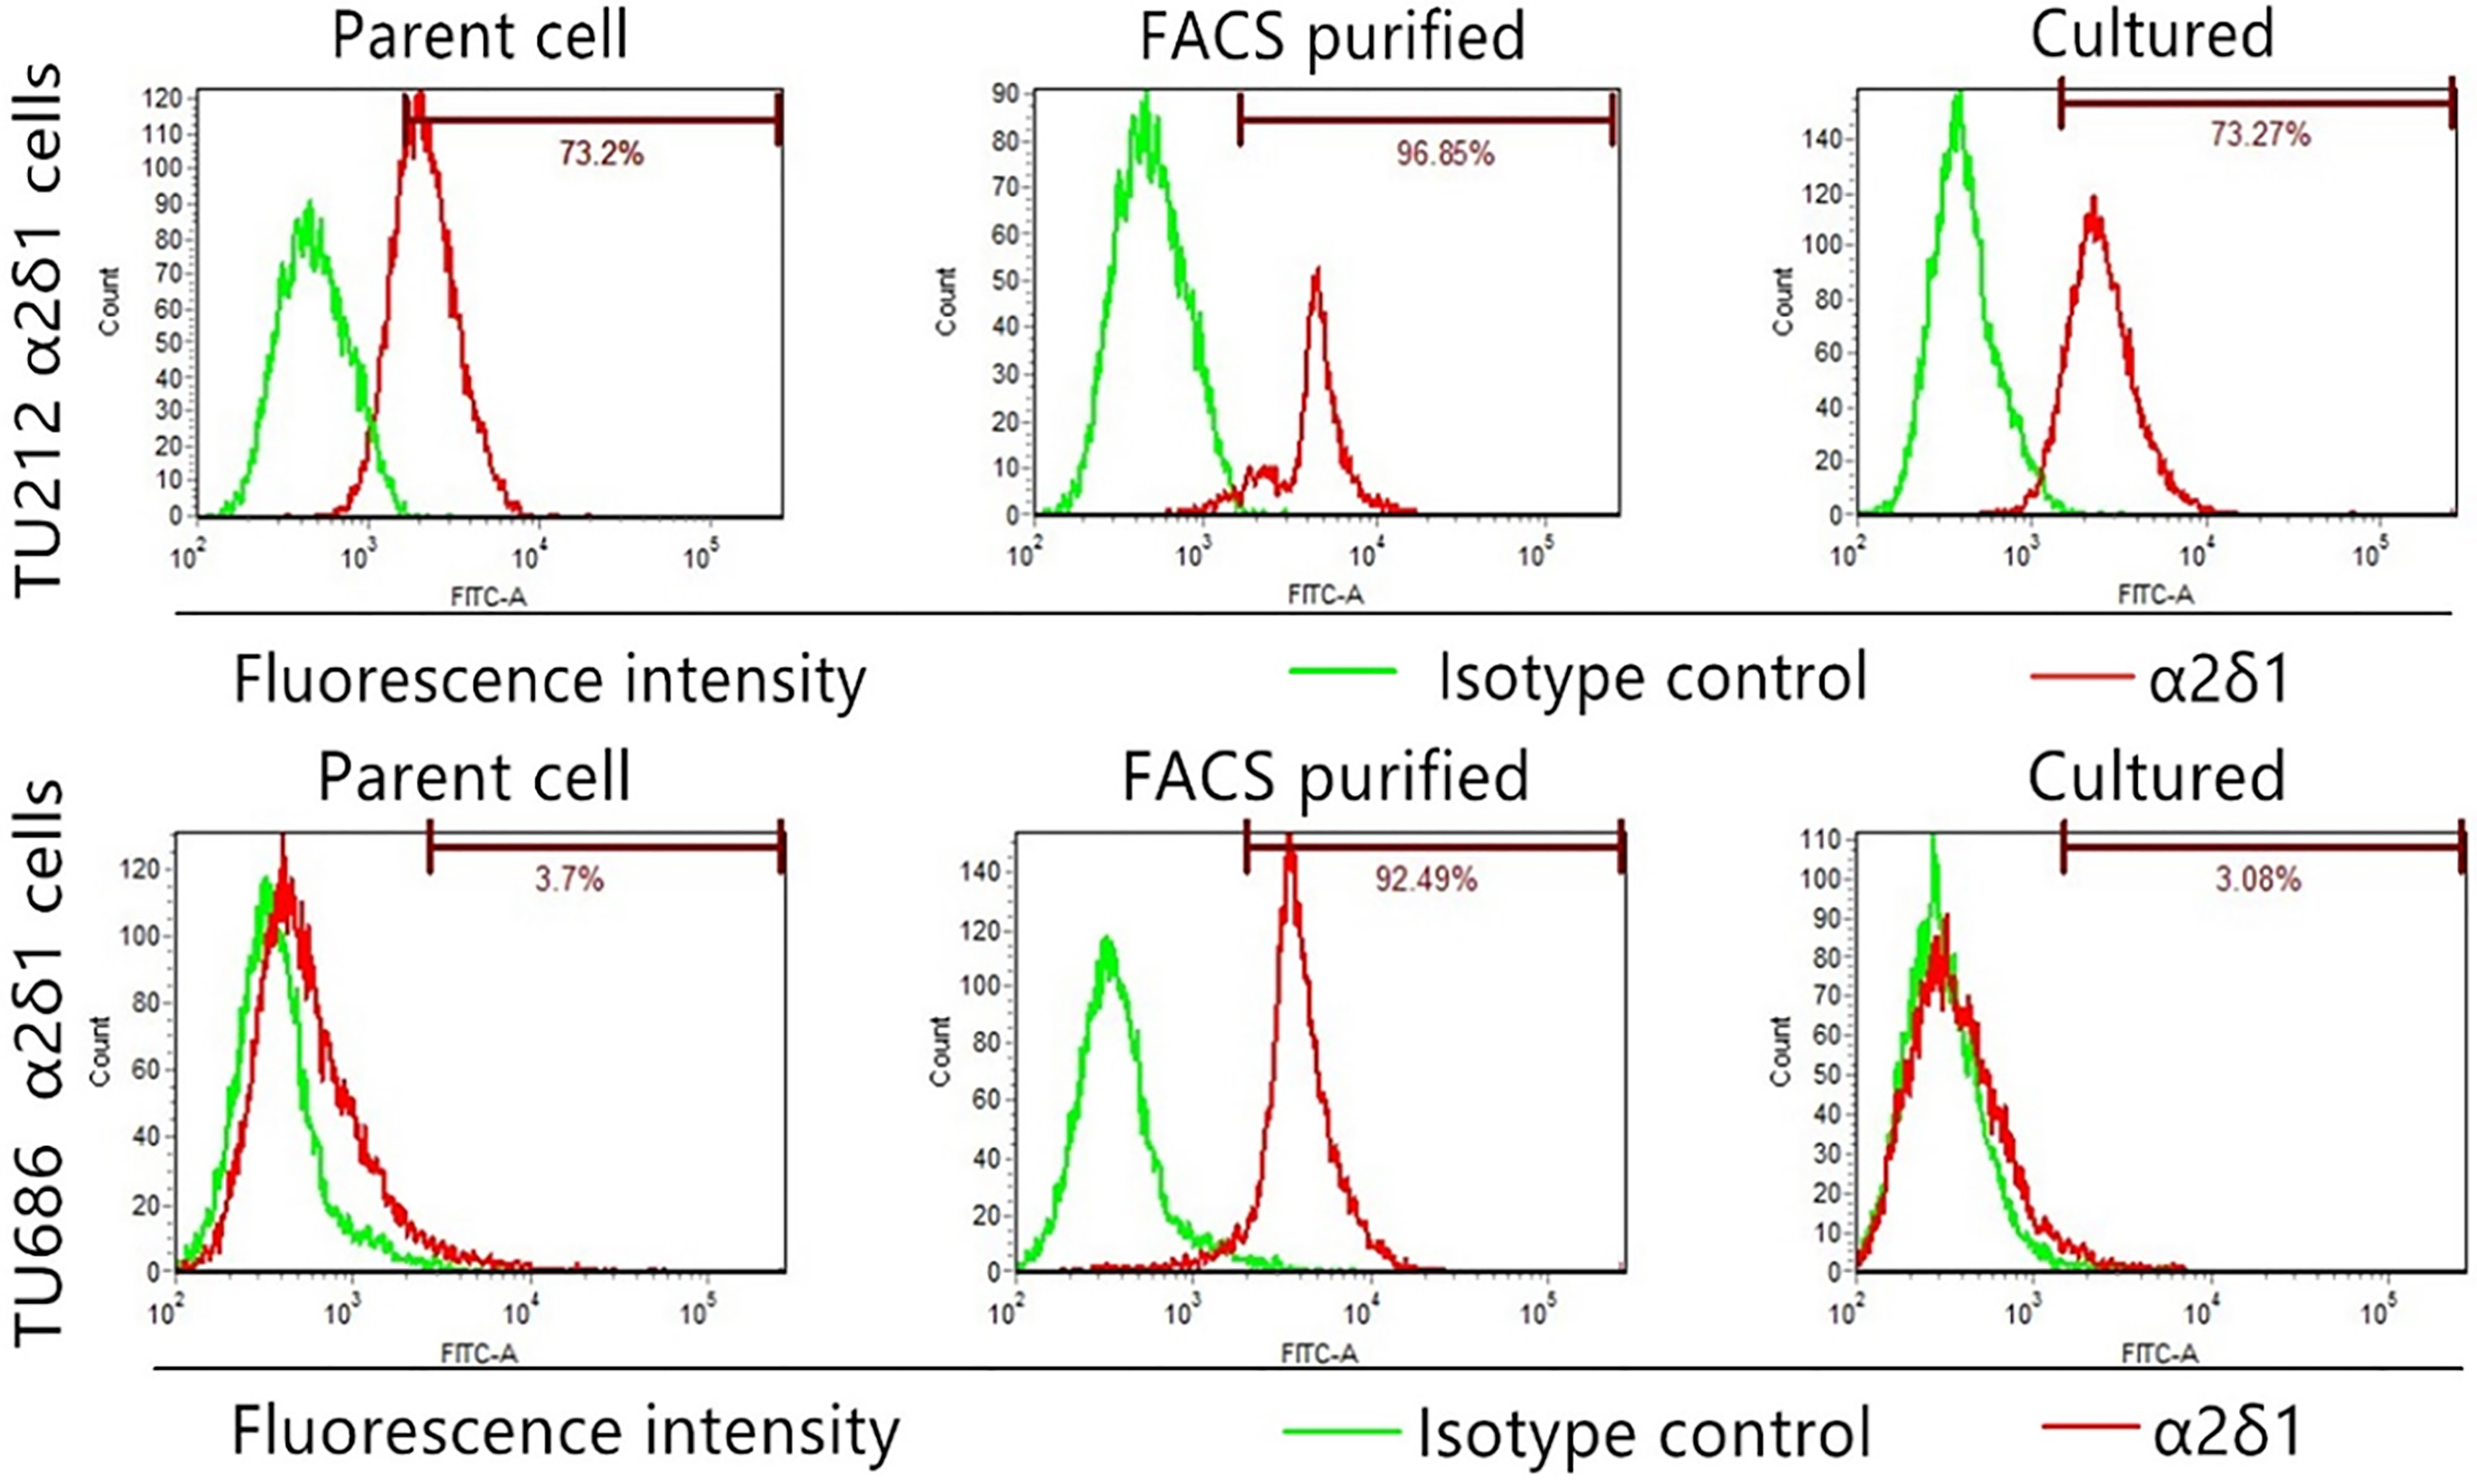
Figure 5.
Migration and invasive potential of
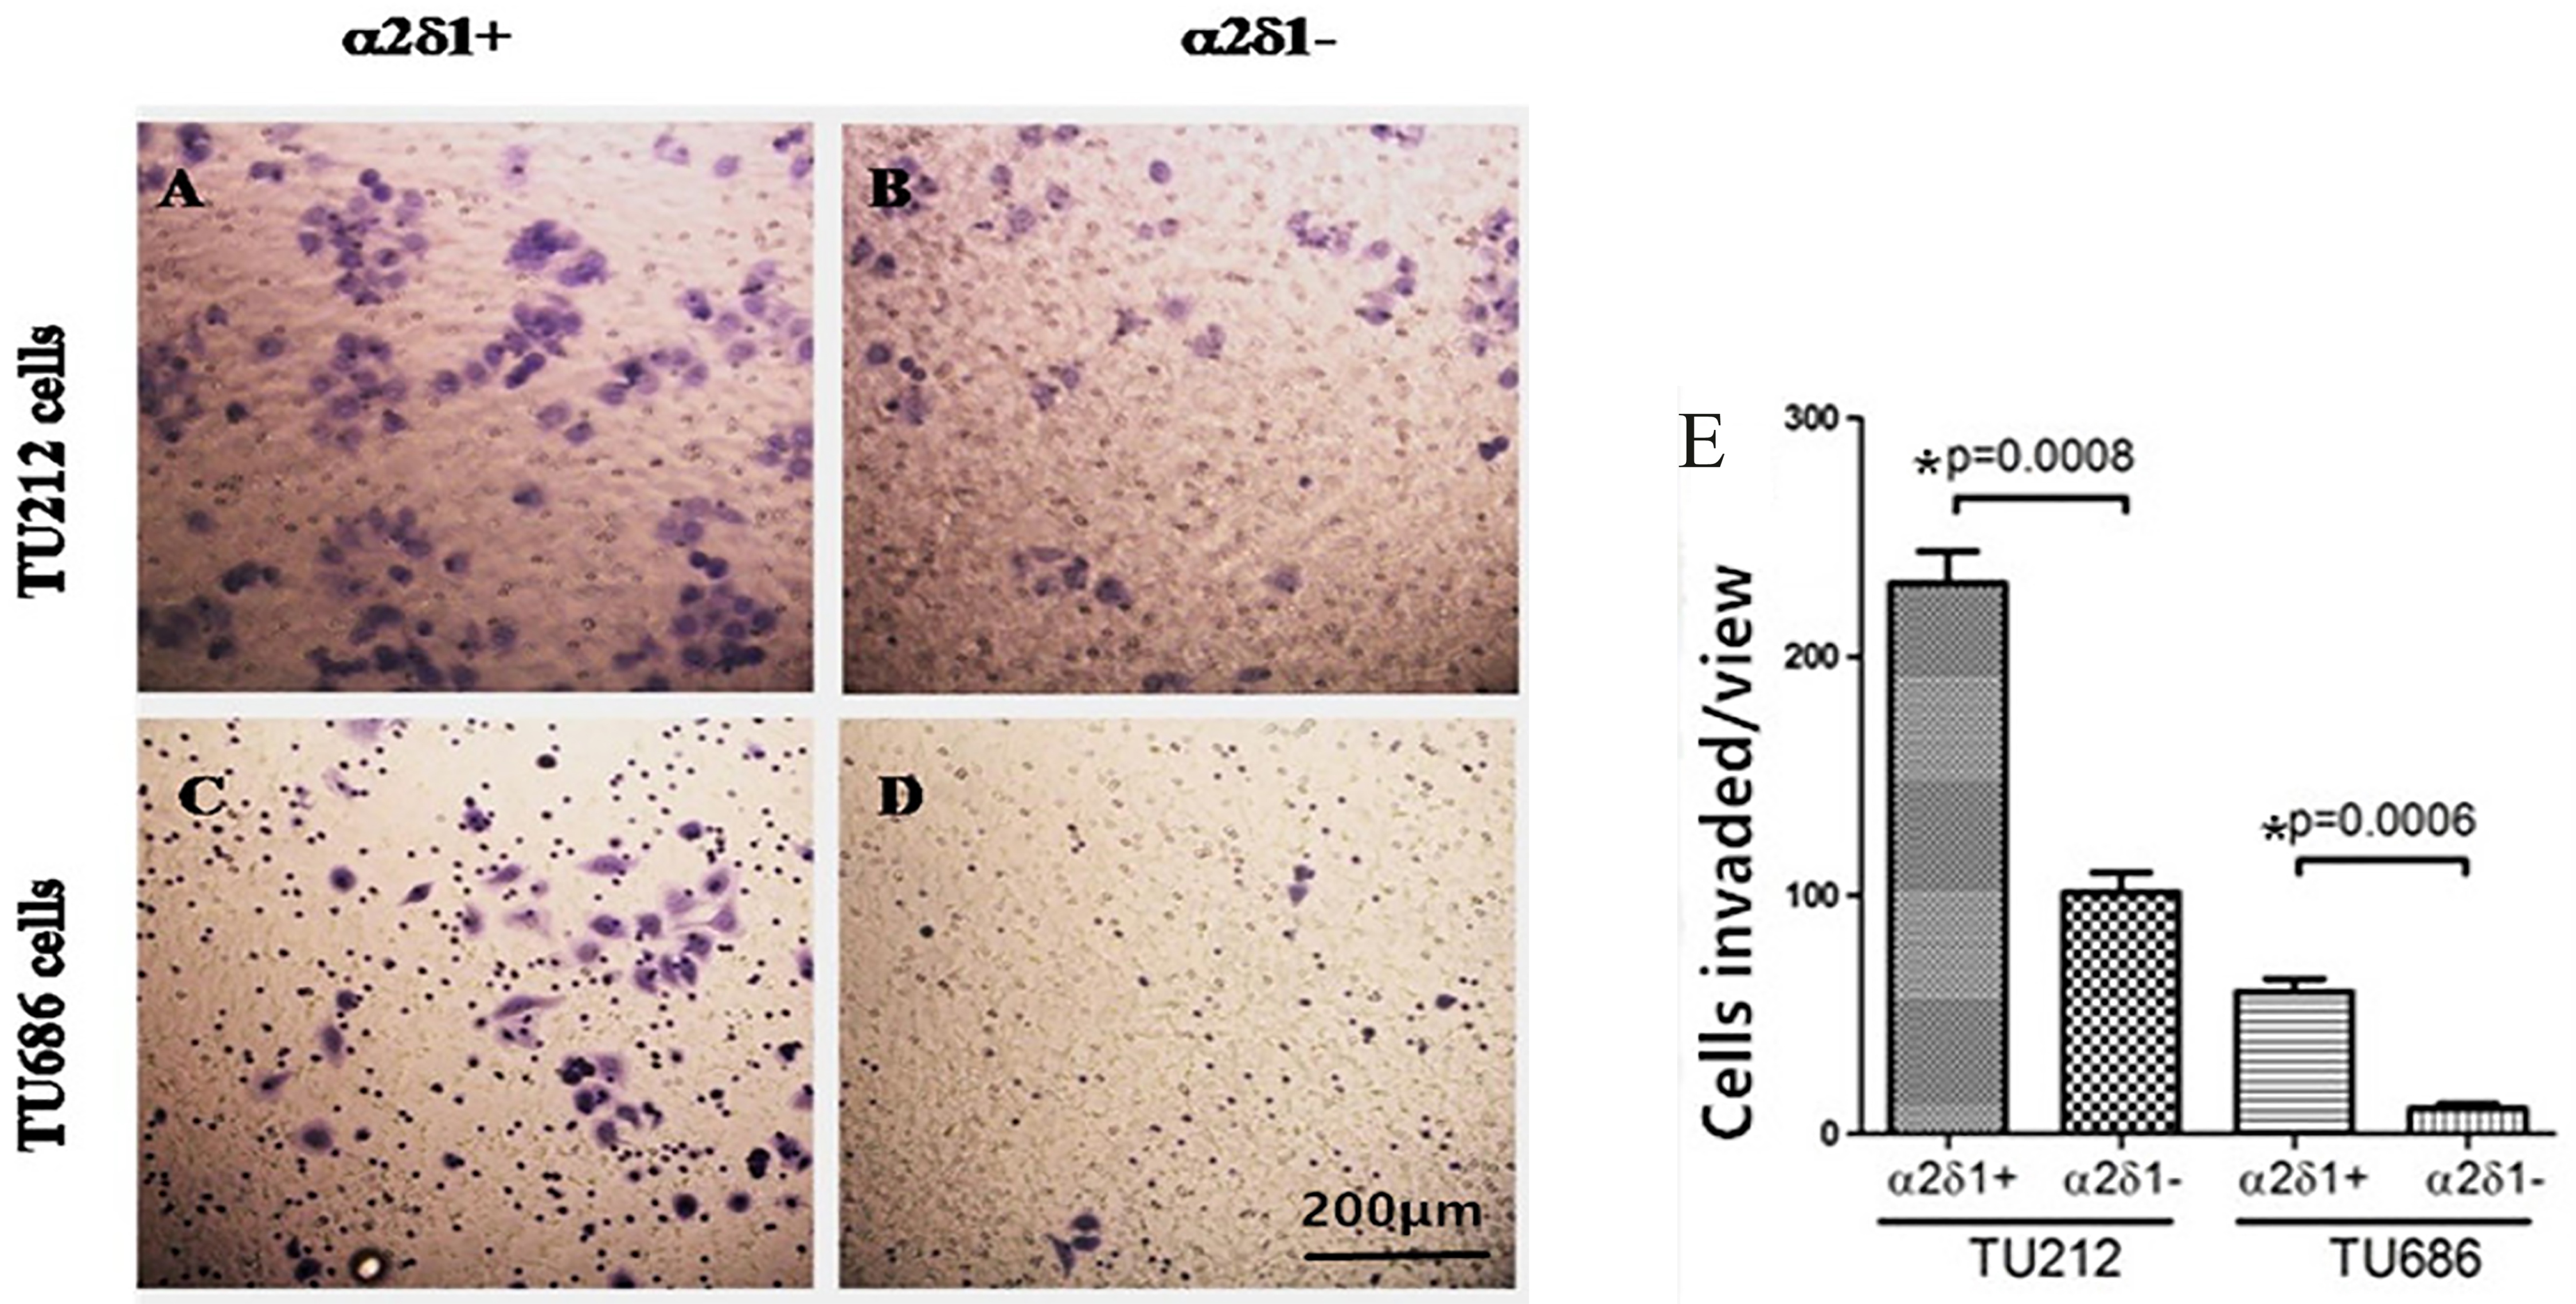
Figure 6.
Chemoresistance ofTU686 cells. The percentage of sorted
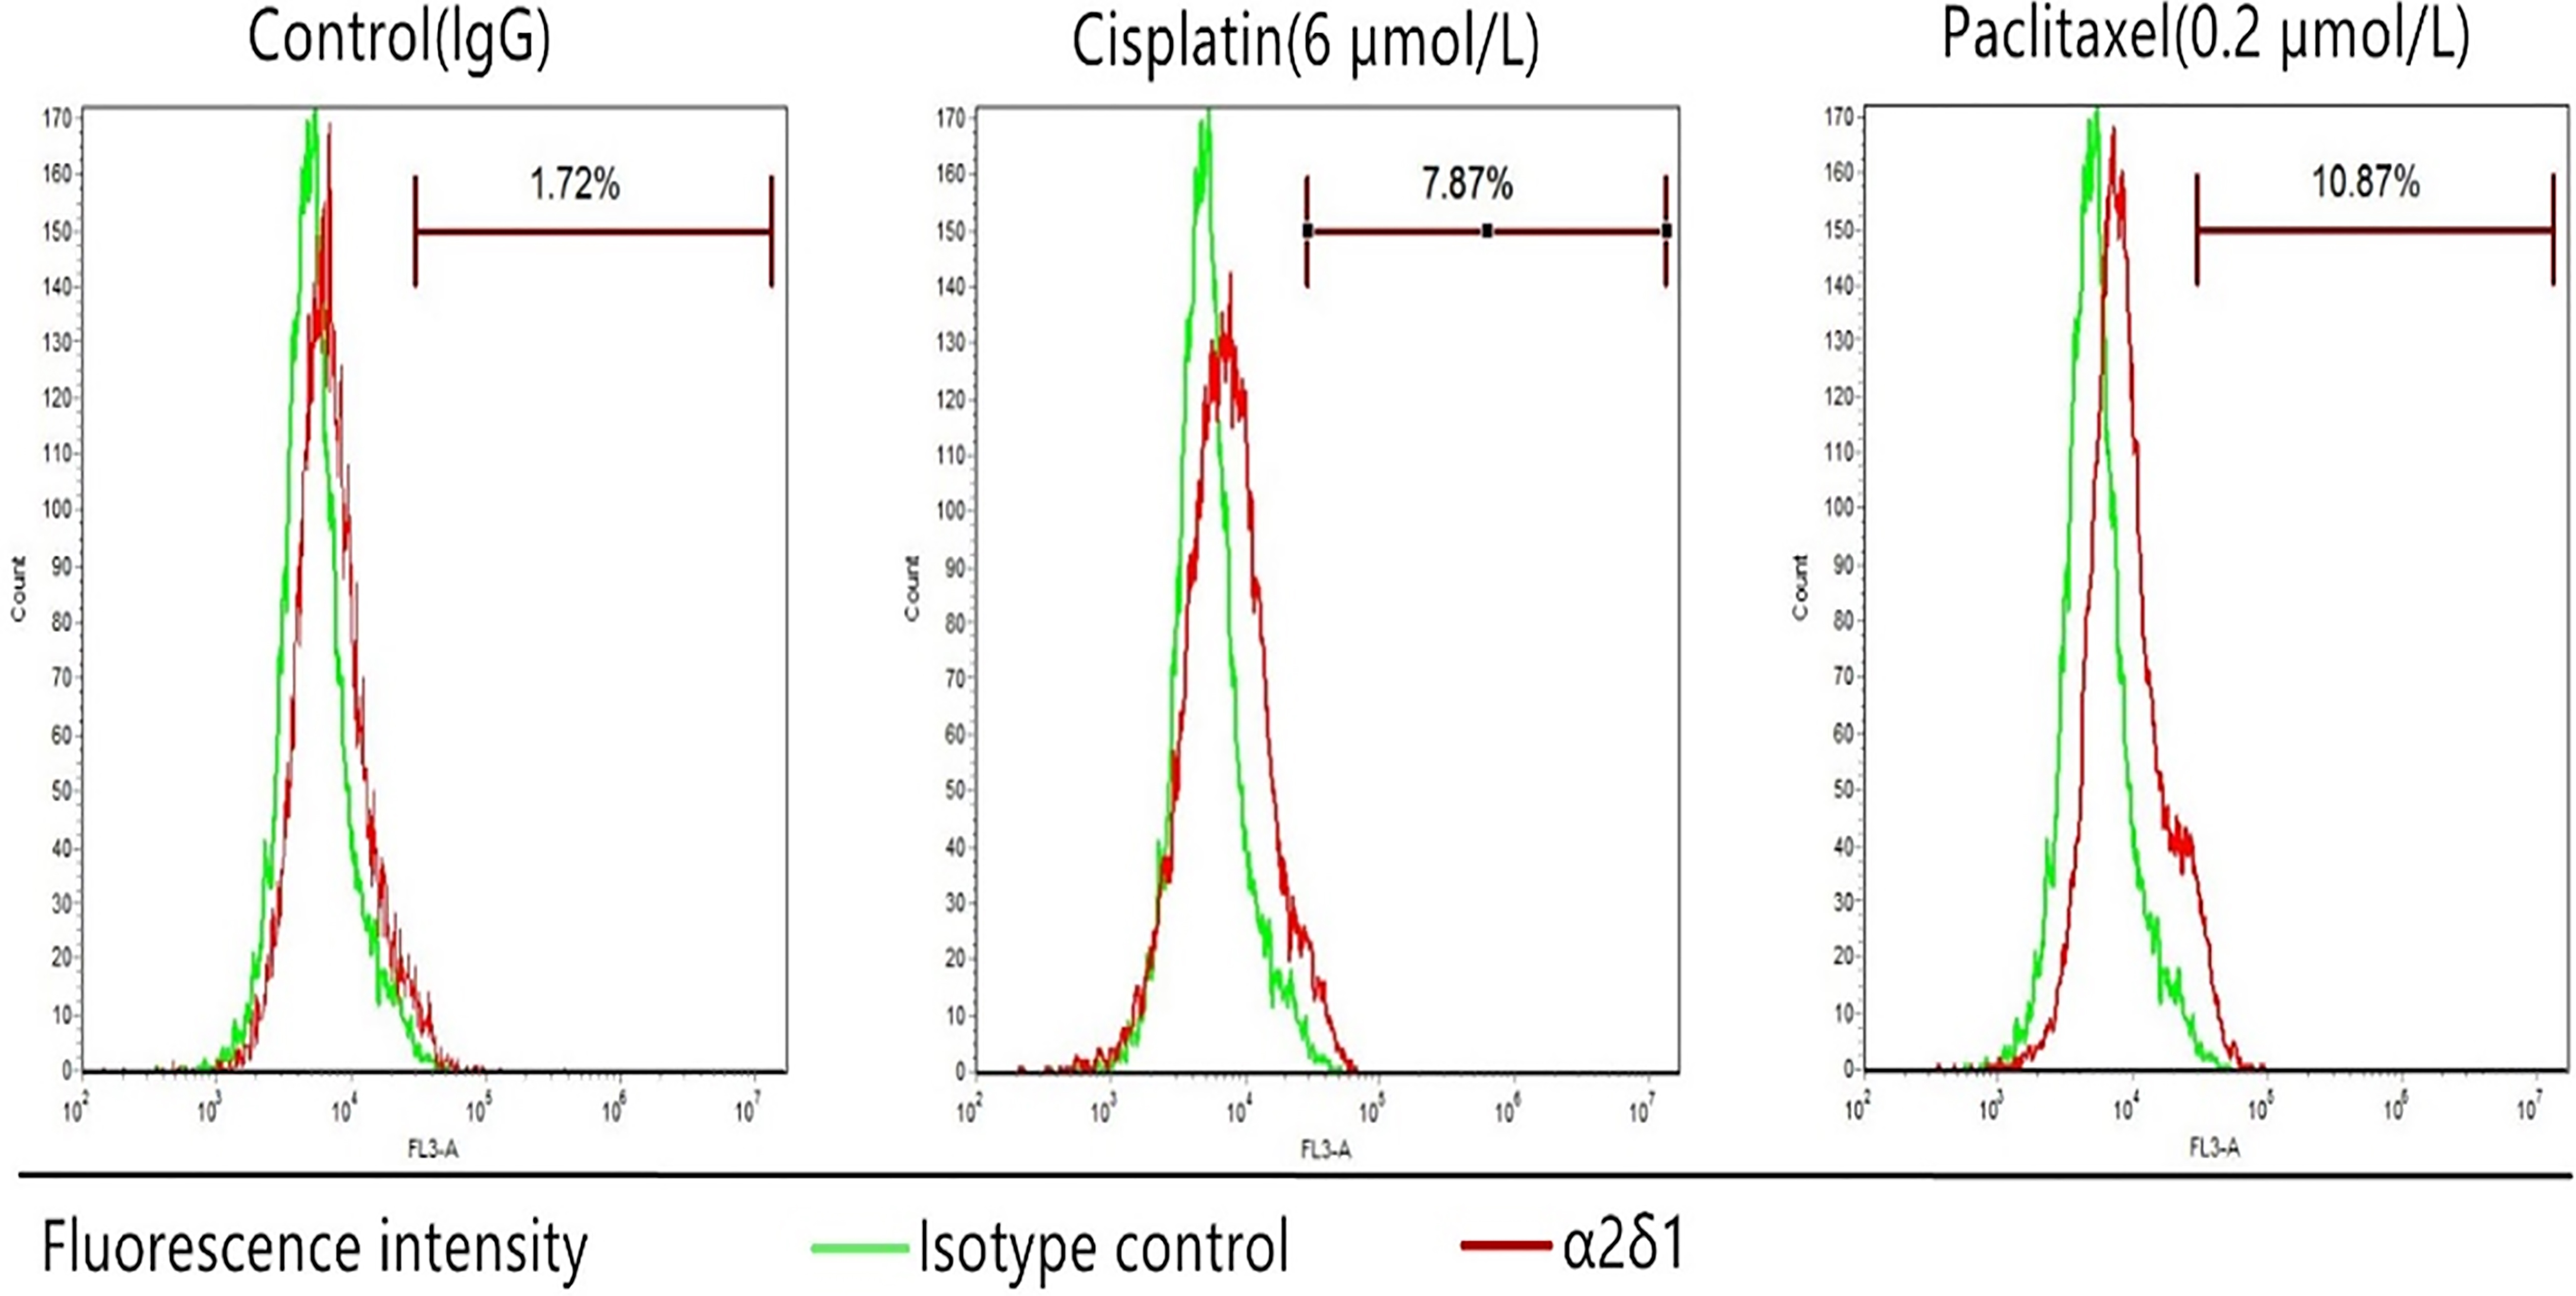
Figure 7.
Tumorigenesis of
4.Discussion
Immunofluorescence staining of 16 LSCC specimens showed that
Next, we showed that TU212 and TU686 cells also contain a
We next evaluated the differentiation and migration/invasion potential of the
Consistent with a previous study on
Previous studies have confirmed that
Upon in vivo tumor xenograft assays, 100 purified
5.Conclusion
In summary, the results from the current study indicated the presence of a
Acknowledgments
This research was supported by the Scientific Research Common Program of Beijing Municipal Commission of Education (#KM201510025028) and Research Foundation of Beijing Friendship Hospital, Capital Medical University (#yydszx2015-02, #yyqdkt 2014-23).
Conflict of interest
The authors declare that they do not have any potential conflict of interests in relation to the contents of this manuscript.
References
[1] | R. Siegel, E. Ward, O. Brawley and A. Jemal, Cancer statistics, 2011: The impact of eliminating socioeconomic and racial disparities on premature cancer deaths, CA: A Cancer Journal for Clinicians 61: ((2011) ), 212–236. |
[2] | Y. Liu, Q. Zhao, G. Ding, Y. Zhu, W. Li, W. Chen and J. Chin, Incidence and mortality of laryngeal cancer in China, 2008–2012, Cancer Res 30: ((2018) ), 299–306. |
[3] | L. Du, H. Li, C. Zhu, R. Zheng, S. Zhang and W. Chen, Incidence and mortality of laryngeal cancer in China, 2011, Chinese J Cancer Res 27: ((2015) ), 52–58. |
[4] | D. Yu, Y. Liu, J. Yang, C. Jin, X. Zhao, J. Cheng, X. Liu and X. Qi, Clinical implications of BMI-1 in cancer stem cells of laryngeal carcinoma, Cell Biochem Biophys 71: ((2015) ), 262–269. |
[5] | M. Martín, A. Hinojar, L. Cerezo, J. García, M. Lopez, J. Prada, A. Marín and C. Gamallo, Aldehyde dehydrogenase isoform 1 (ALDH1) expression as a predictor of radiosensitivity in laryngeal cancer, Clinical and Translational Oncology 18: ((2016) ), 825–830. |
[6] | J. Wang, Y. Wu, W. Gao, F. Li, Y. Bo, M. Zhu, R. Fu, Q. Liu, S. Wen and B. Wang, Identification and characterization of CD133+ CD44+ cancer stem cells from human laryngeal squamous cell carcinoma cell lines, J Cancer 8: ((2017) ), 497–506. |
[7] | M.C. de Jong, J. Pramana, J.E. van der Wal, M. Lacko, C.J. Peutz-Kootstra, J.M. de Jong, R.P. Takes, J.H. Kaanders, B.F. van der Laan, J. Wachters, J.C. Jansen, C.R. Rasch, M.L. van Velthuysen, R. Grénman, F.J. Hoebers, E. Schuuring, M.W. van den Brekel and A.C. Begg, CD44 expression predicts local recurrence after radiotherapy in larynx cancer, Clin Cancer Res 16: ((2010) ), 5329–5338. |
[8] | M. Baumann and M. Krause, CD44: A cancer stem cell-related biomarker with predictive potential for radiotherapy, Clin Cancer Res 16: ((2010) ), 5091–5093. |
[9] | I. Suer, O.F. Karatas, B. Yuceturk, M. Yilmaz, G. Guven, O. Buge, H. Cansiz and M. Ozen, Characterization of stem-like cells directly isolated from freshly resected laryngeal squamous cell carcinoma specimens, Curr Stem Cell Res Ther 9: ((2014) ), 347–353. |
[10] | W. Zhao, L. Wang, H. Han, K. Jin, N. Lin, T. Guo, Y. Chen, H. Cheng, F. Lu, W. Fang, Y. Wang, B. Xing and Z. Zhang, 1B50-1, a mAb raised against recurrent tumor cells, targets liver tumor-initiating cells by binding to the calcium channel α2δ1 subunit, Cancer Cell 23: ((2013) ), 541–556. |
[11] | B. Sainz and C. Heeschen, Standing out from the crowd: Cancer stem cells in hepatocellular carcinoma, Cancer Cell 23: ((2013) ), 431–433. |
[12] | Y. Zhang, W. Zhao, H. Han, S. Li, D. Chen and Z. Zhang, MicroRNA-31 suppresses the self-renewal capability of α2δ1+ liver tumor-initiating cells by targeting ISL1, Oncotarget 8: ((2017) ), 87647–87657. |
[13] | J. Yu, S. Wang, W. Zhao, J. Duan, Z. Wang, H. Chen, Y. Tian, D. Wang, J. Zhao, T. An, H. Bai, M. Wu and J. Wang, Mechanistic exploration of cancer stem cell marker voltage-dependent calcium channel α2δ1 subunit-mediated chemotherapy resistance in small-cell lung cancer, Clin Cancer Res 24: ((2018) ), 2148–2158. |
[14] | S. Zarei, A.A. Bayat, R. Hadavi, A.R. Mahmoudi, B. Tavangar, Y. Vojgani, M. Jeddi-Tehrani and Z. Amirghofran, Production and characterization of a peptide-based monoclonal antibody against CD44 variant 6, Monoclonal Antibodies in Immunodiagnosis and Immunotherapy 34: ((2015) ), 36–43. |
[15] | C. Zhao, Z.G. Ma, S.L. Mou, Y.X. Yang, Y.H. Zhang and W.C. Yao, Targeting effect of microRNA on CD133 and its impact analysis on proliferation and invasion of glioma cells, Genetics and Molecular Research 16: ((2017) ), 1–9. |
[16] | S.K.M. Li, D.K. Smith, W.Y. Leung, A.M.S. Cheung, E.W.F. Lam, G.P. Dimri and K.M. Yao, FoxM1c counteracts oxidative stress-induced senescence and stimulates bmi-1 expression, J Biol Chem 283: ((2008) ), 16545–16553. |
[17] | S. Klein, J.L. Dvornik, A.R. Yarrabothula and C. Schaniel, A Marfan syndrome human induced pluripotent stem cell line with a heterozygous FBN1 c.4082G > A mutation, ISMMSi002-B, for disease modeling, Stem Cell Res 23: ((2017) ), 73–76. |
[18] | D.J. Eastburn, A. Sciambi and A.R. Abate, Picoinjection enables digital detection of RNA with droplet rt-PCR, Plos One 8: ((2013) ), e62961. |
[19] | R. Kim and J. Nam, OCT4 expression enhances features of cancer stem cells in a mouse model of breast cancer, Lab Anim Res 27: ((2011) ), 147. |
[20] | J. Durand, A. Lampron, T.L. Mazzuco, A. Chapman and I. Bourdeau, Characterization of differential gene expression in adrenocortical tumors harboring β-catenin (CTNNB1) mutations, J Clin Endocrinol Metab 96: ((2011) ), E1206–E1211. |
[21] | D.A. Evseenko, J.W. Paxton and J.A. Keelan, The xenobiotic transporter ABCG2 plays a novel role in differentiation of trophoblast-like BeWo cells, Placenta 28: ((2007) ), S116–S120. |
[22] | F. Marchesi, P. Monti, B.E. Leone, A. Zerbi, A. Vecchi, L. Piemonti, A. Mantovani and P. Allavena, Increased survival, proliferation, and migration in metastatic human pancreatic tumor cells expressing functional CXCR4, Cancer Res 64: ((2004) ), 8420–8427. |
[23] | M.W. Pfaffl, A new mathematical model for relative quantification in real-time RT-PCR, Nucleic Acids Res 29: ((2001) ), e45. |
[24] | L. Lan, H. Han, H. Zuo, Z. Chen, Y. Du, W. Zhao, J. Gu and Z. Zhang, Upregulation of myosin Va by Snail is involved in cancer cell migration and metastasis, Int J Cancer 126: ((2010) ), 53–64. |
[25] | J. Wu, Z. Yan, Z. Li, X. Qian, S. Lu, M. Dong, Q. Zhou and N. Yan, Structure of the voltage-gated calcium channel Cav1.1 at 3.6 Å resolution, Nature 537: ((2016) ), 191–196. |
[26] | F. Van Petegem, K.A. Clark, F.C. Chatelain and D.L. Minor, Structure of a complex between a voltage-gated calcium channel β-subunit and an α-subunit domain, Nature 429: ((2004) ), 671–675. |
[27] | L. Hui, J. Zhang, X. Ding, X. Guo and X. Jiang, Matrix stiffness regulates the proliferation, stemness and chemoresistance of laryngeal squamous cancer cells, Int J Oncol 50: ((2017) ), 1439–1447. |
[28] | N. Murakami, T. Mori, S. Yoshimoto, Y. Ito, K. Kobayashi, H. Ken, M. Kitaguchi, S. Sekii, K. Takahashi, K. Yoshio, K. Inaba, M. Morota, M. Sumi and J. Itami, Expression of EpCAM and prognosis in early-stage glottic cancer treated by radiotherapy, Laryngoscope 124: ((2014) ), e431–436. |
[29] | N.M.F. El Deeb and E. Abdelzaher, Stem cell markers OCT4 and nestin in laryngeal squamous cell carcinoma and their relation to survivin expression, Pathol Res Pract 210: ((2014) ), 751–758. |
[30] | P. Machin, L. Catasus, C. Pons, J. Muñoz, X. Matias-Guiu and J. Prat, CTNNB1 mutations and β-catenin expression in endometrial carcinomas, Hum Pathol 33: ((2002) ), 206–212. |
[31] | B. Shen, D. Li, P. Dong and S. Gao, Expression of ABC transporters is an unfavorable prognostic factor in laryngeal squamous cell carcinoma, Ann Otol Rhinol Laryngol 120: ((2011) ), 820–827. |
[32] | X. Qi, D. Yu, B. Jia, C. Jin, X. Liu, X. Zhao and G. Zhang, Targeting CD133+ laryngeal carcinoma cells with chemotherapeutic drugs and siRNA against ABCG2 mediated by thermo/pH-sensitive mesoporous silica nanoparticles, Tumor Biol 37: ((2016) ), 2209–2217. |
[33] | Y.J. Pu, L. Yan, Z. Wei, Y. Dan, W. Lian-Ji, J.C. Shun, Chemoresistance of CD133+ cancer stem cells in laryngeal caronoma, Chin Med J (Engl) 124: ((2011) ), 1055–1060. |

