
Electrophysiological and Imaging Calcium Biomarkers of Aging in Male and Female 5×FAD Mice
Abstract
Background:
In animal models and tissue preparations, calcium dyshomeostasis is a biomarker of aging and Alzheimer’s disease that is associated with synaptic dysfunction, neuritic pruning, and dysregulated cellular processes. It is unclear, however, whether the onset of calcium dysregulation precedes, is concurrent with, or is the product of pathological cellular events (e.g., oxidation, amyloid-β production, and neuroinflammation). Further, neuronal calcium dysregulation is not always present in animal models of amyloidogenesis, questioning its reliability as a disease biomarker.
Objective:
Here, we directly tested for the presence of calcium dysregulation in dorsal hippocampal neurons in male and female 5×FAD mice on a C57BL/6 genetic background using sharp electrodes coupled with Oregon-green Bapta-1 imaging. We focused on three ages that coincide with the course of amyloid deposition: 1.5, 4, and 10 months old.
Methods:
Outcome variables included measures of the afterhyperpolarization, short-term synaptic plasticity, and calcium kinetics during synaptic activation. Quantitative analyses of spatial learning and memory were also conducted using the Morris water maze. Main effects of sex, age, and genotype were identified on measures of electrophysiology and calcium imaging.
Results:
Measures of resting Oregon-green Bapta-1 fluorescence showed significant reductions in the 5×FAD group compared to controls. Deficits in spatial memory, along with increases in Aβ load, were detectable at older ages, allowing us to test for temporal associations with the onset of calcium dysregulation.
Conclusion:
Our results provide evidence that reduced, rather than elevated, neuronal calcium is identified in this 5×FAD model and suggests that this surprising result may be a novel biomarker of AD.
INTRODUCTION
The rise in Alzheimer’s disease (AD) cases is predicted to reach exponential numbers by the year 2050, yet few, if any, new effective therapeutic drugs are currently available. Further, the cost of care is burdensome for families and healthcare providers [1], resulting in an urgent need for the development of new treatment strategies. While several cellular alterations have been identified as key contributors to the onset and progression of AD, including amyloid-β (Aβ) deposits, apolipoprotein E status, tau tangles, oxida-tive stress, neuroinflammation, and synaptic loss [2–8], it is imperative to look beyond these for new biomarkers. One target that has received considerable interest is neuronal calcium dysregulation.
The hypothesis of brain aging and AD has provided evidence that neuronal calcium is dysregulated and can negatively impact neuronal health, network communication, and synaptic plasticity [9–16]. In the hippocampus, a structure necessary for spatial mapping and short-term memory, an altered network fraught with reduced synaptic plasticity [17–19], increased pruning [20–23], and recent evidence of hyperactivity [24, 25] is likely to mediate cognitive and memory impairments [26–36]. The role that neuronal calcium assumes with respect to these processes is unclear, as calcium dysregulation may occur when calcium is elevated or decreased, during states of rest or during synaptic activation, or as the consequence of alterations in synaptic communication. Given the variability in calcium homeostasis measures in normal aging, it is important to measure calcium in models of AD as well.
Critical mechanistic insights regarding calcium dysregulation have been gained in AD animal models [8, 37–44]; however, few studies have investigated this AD-associated calcium dysregulation alongside aging. Initial studies of the associations between Aβ and calcium homeostasis, including the impact of calcium on Aβ production, were mostly conducted in vitro (i.e., human cell lines or animal cell culture) (reviewed in [45]). With the exception of a few cul-ture studies conducted in adult tissues [46–49], most of this early work used primary neuronal cultures derived from neonatal pups, which prevented the in-clusion of the aging component. When investigating calcium dysregulation and its physiological impact either directly (using calcium imaging techniques) or indirectly (using electrophysiological techniques), nearly all measures were obtained from AD animals at single timepoints between the ages of 4 weeks and 12 months [23, 50–62]. Although these studies high-lighted increases in resting or stimulated calcium levels, triggered either synaptically or via the activation of inositol 1,4,5-trisphosphate or ryanodine receptors, few have specifically investigated the impact of AD-associated calcium dysregulation during the progress of aging [63, 64].
Stutzmann and colleagues examined calcium changes across age (1.5, 6, and 18 months) in three transgenic mouse models (PS1KI, 3×Tg, and APPS weTauP301L). While enhanced endoplasmic reticulum (ER) calcium signaling was observed in the PS1KI and 3×Tg models, presumably due to the PS1 mutation, this effect was not found to be age-de-pendent [63]. However, similar to early aging studies [12, 65, 66], the calcium-mediated afterhyperpolarization (AHP) was larger with aging, but remained unaltered across genotype. In another study, L-type voltage-gated calcium channel (L-VGCC) density was measured across age (1, 6–9, and 12–16 months) in wild-type (WT) and 3×Tg mice [64]. L-VGCC density was significantly increased at 12–16 months in the transgenic mice compared to WT littermates. Surprisingly, however, no significant increase in these measures were found across age in WT animals at 12–16 months. This contradicts previous findings in the F344 rat model of aging, which showed elevations at 23–26 months of age [67].
The paucity of direct calcium measures in aged AD animal models is partly due to the identification of human amyloid-β protein precursor and presenilin (PS) mutations, which increase production of amyloidogenic proteins from birth, resulting in the development of a very aggressive phenotype, pre-cluding studies in older animals. Further, besides humans and dogs, other animal models do not develop AD phenotypes (e.g., Aβ deposition, tau tangles). Additionally, it has been difficult to draw comparisons between pathological aging and AD, as the former lacks clear biomarkers (i.e., Aβ plaques, tau tangles, “leaky channels” of the ER, and enhanced neuronal death) that differentiate the disease from normal brain aging. Furthermore, recapitulating these phenotypes in transgenic animals does not necessarily clarify whether calcium dysregulation impacts AD pathology or vice versa.
These difficulties, together with recent evidence that calcium signals appear to decrease in two animal models of AD [68, 69], highlight the possibility that methodological differences may mediate these discrepancies. Interestingly, previous work by our group has shown a significant reduction in L-VGCC density in 14-month-old 2×Tg mice compared to WT using the dissociated “zipper” hippocampal slice technique [68]. Using the same methods, however, a two-fold increase in L-VGCC density was found in aged F344 rats compared to young animals [67]. In a more re-cent study, we identified a significant decrease in the AHP of 2-month-old 5×FAD mice on a C57BL/6 genetic background compared to WT [69]. Further, in a 2008 comprehensive review of calcium dysregulation in AD across 32 studies performed in both cell lines and mouse models with PS mutations [40], over 100 measures of calcium were identified. Of these, 24 showed enhanced calcium release from the ER while 21 exhibited decreased release. Moreover, 17 measures of plasma membrane calcium influx were downregulated, two were upregulated, and five showed no change across genotypes. Thus, while the field has argued that calcium dysregulation may be a unifying mechanism that impacts aging and AD in similar ways, this over-simplification may have hindered, rather than helped, the advancements made on this topic.
To better characterize these processes in AD animal models in the context of aging, we tested for the presence of calcium dysregulation in the 5×FAD mice on a C57BL/6 genetic background at three distinct ages using two techniques that have reliably identified key biomarkers of aging across laboratories [12, 70, 71]. This approach allowed us to address the onset of the calcium dysregulation using both direct (calcium imaging) and indirect (electrophysiology) measures. Given that aging is the number one risk factor for AD, we chose to utilize this 5×FAD mouse model on a congenic C57BL/6 genetic background, as these animals display a slo-wer development of the AD phenotype [72, 73], allowing the aging processes to participate in disease progression. Sharp electrode electrophysiology and Oregon-green Bapta-1 (OGB-1) calcium imaging were used to measure neuronal physiology and corresponding calcium changes. Behavioral characterization using the Morris water maze (MWM) and Aβ deposition (BTA-1) was quantified to characterize phenotypic progression. Based on our prior results, we hypothesized that contrary to what is seen in normal aging, somatic calcium would be reduced over time in this 5×FAD transgenic model of amyloidogenesis.
METHODS
Animals
Young-adult (1.5 months), adult (4 months), and mid-age (10 months) male and female 5×FAD mice and their WT littermates were derived at the University of Michigan (Ann Arbor, MI) and shipped to the University of Kentucky (Lexington, KY) in several cohorts of 10–20 animals. The 5×FAD mice [74] were originally obtained from the Mutant Mouse Regional Resource Facility (MMRC) on a C57BL/6J background (stock # 034848-JAX). Hemizygous 5×FAD mice were crossed with WT C57BL/6Tac mice and maintained at the University of Michigan on this background since late 2012 (20+ generations). A recent report suggests that 5×FAD mice on a C57BL/6 background exhibit AD-related pathology and cognitive impairments approximately 2–4 months later than the mice originally described by Oakley and colleagues, which utilized mice on a hy-brid B6/SJL genetic background [72, 74]. Typically, a cohort represented animals at a particular age (e.g., 4.5 weeks, 3.5 months, and 9.5 months). Because only one animal could be electrophysiologically recorded per day, data acquisition for each cohort was staggered across 3–5 weeks; thus, the average age of each cohort was 1.5, 4, and 10 months.
Housing
While at the University of Michigan, the mice were same-sex housed in groups of three to five, with a 14 h on/10 h off light/dark cycle, an ambient temperature of 20–22°C, and ad libitum access to food and water. Upon transfer to the University of Kentucky, mice were housed in a quarantined facility for a minimum of one week prior to experimentation. Male mice were housed individually while females were paired. All animals were maintained on a 12 h on/12 h off light/dark cycle and fed a Teklad Global 18% protein rodent diet ad libitum. Routine assessment of animal health was performed by a veterinarian at both institutions and animals exhibiting signs of morbidity were excluded from the study. Treatment and handling of all animals were performed in accordance with each university’s Institutional Animal Care and Use Committee guidelines.
Slice preparation
Mice were anesthetized using aerosolized isoflurane (5%) followed by rapid decapitation. Brains were quickly removed and incubated in ice cold low calcium, high magnesium artificial cerebrospinal fluid (ACSF) [in mM]: 114 NaCl, 3 KCl, 10 Glucose, 1.25 KH2PO4, 26 NaHCO3, 0.096 CaCl2 anhydrous, and 7.98 MgCl2 anhydrous. Three-hundred and fifty μm thick slices from the dorsal hippocampus were obtained using a Vibratome® 3000 (TPI; St. Louis, MO) and incubated for at least 2 h at 32°C in a hum-idified (95% O2–5% CO2) interface-type chamber in normal calcium ACSF [in mM]: 114 NaCl, 3 KCl, 10 Glucose, 1.25 KH2PO4, 26 NaHCO3, 2 CaCl2 anhydrous, and 2 MgCl2 anhydrous. Slices were then placed in a recording chamber (RC-22C; Warner In-struments, Co., Hamden, CT) heated to 32°C with a TC2Bip/HPRE2 in-line heating system (Cell Micro Controls; Norfolk, VA) and perfused with a continuous flow of oxygenated, normal ACSF at a rate of 1.5 mL/min. Slices were then visualized under a Nikon Eclipse E600FN microscope.
Electrophysiology
Sharp electrodes (∼80–120 MΩ) were pulled from 1.0 mm diameter borosilicate glass capillaries (World Precision Instruments, Inc.; Sarasota, FL) on a Sutter Instruments P80 pipette puller (Novato, CA). Electrode tips were first backfilled with a bolus of 1.25 mM OGB-1, pH 7.4 (ThermoFisher Scientific, Catalog number: O6806; Waltham, MA), while the rest of the electrode was filled with a 1 M potassium methyl sulfate (KMeSO4) in 10 mM HEPES. A bipolar stimulating electrode was placed on the Shaffer collaterals and the recording electrode was slowly guided through stratum pyramidale of area CA1. An SD9K stimulator (Astro Med Inc., Grass Instruments; Warwick, RI) was used to synaptically stimulate the tissue slice. Responses were obtained through an AxoClamp-2B amplifier (Molecular Devices LLC.; San Jose, CA) and digitized at ∼5–10 KHz using a Digidata® 1550B (Molecular Devices LLC.; San Jose, CA). Data was processed using pClamp 10.7 software (Molecular Devices LLC.; San Jose, CA).
Afterhyperpolarization
For measures of post-synaptic activation, cells were held at –65 mV. Action potential (AP) threshold was set to –55 mV, and 4 AP bursts were evoked (depolarizing 150 ms current injection) to generate the calcium-dependent AHP every 30 s for five min. Three measures of the AHP were quantified inclu-ding the medium AHP (mAHP), slow AHP (sAHP), and AHP duration. The mAHP was defined as the peak hyperpolarization observed immediately after the end of the current injection. The sAHP was mea-sured as the change in amplitude (compared to baseline) 800 ms post-current injection. Quantification of the AHP duration was defined as the time between peak amplitude of the AHP and the return to baseline. Here, we report data from 11 neurons (♂ = 6, ♀ = 5)/7 mice (♂ = 4, ♀ = 3) (1.5 months), 14 neurons (♂ = 6, ♀ = 8)/10 mice (♂ = 5, ♀ = 5) (4 months), and 13 neurons (♂ = 9, ♀ = 4)/9 mice (♂ = 7, ♀ = 2) (10 months) in the WT dataset, and 21 neurons (♂ = 14, ♀ = 7)/11 mice (♂ = 6, ♀ = 5) (1.5 months), 19 neurons (♂ = 12, ♀ = 7)/13 mice (♂ = 8, ♀ = 5) (4 months), and 15 neurons (♂ = 8, ♀ = 7)/10 mice (♂ = 5, ♀ = 5) (10 months) in the 5×FAD dataset.
Input/output
For measures obtained during synaptic activation, cells were held at –70 mV and stimulated every 10 s. Data reported were derived from 11 neurons (♂ = 6, ♀ = 5)/7 mice (♂ = 4, ♀ = 3) (1.5 months), 13 neurons (♂ = 5, ♀ = 8)/10 mice (♂ = 5, ♀ = 5) (4 months), and 10 neurons (♂ = 7, ♀ = 3)/7 mice (♂ = 5, ♀ = 2) (10 months) for the WT dataset, and 19 neurons (♂ = 13, ♀ = 6)/11 mice (♂ = 6, ♀ = 5) (1.5 months), 16 neurons (♂ = 10, ♀ = 6)/12 mice (♂ = 8, ♀ = 4) (4 months), and 12 neurons (♂ = 8, ♀ = 4)/9 mice (♂ = 5, ♀ = 4) (10 months) in the 5×FAD dataset. Excitatory post-synaptic potential (EPSP) amplitudes determined from an increasing series of activation voltages were plotted to generate I/O curves and used to determine the threshold for an AP.
Repeated synaptic stimulation
Stimulation intensity during repeated synaptic stimulation (RSS; 10 s, 7 Hz) was set at the threshold for an AP. Outcome measures included synaptic hyperpolarization and potentiation of EPSPs in relation to measures of the first EPSP (baseline) in the train. Synaptic hyperpolarization was tabulated as the mean peak hyperpolarization amplitudes following the 6th through 9th EPSPs. The growth of the EPSP during the train was measured early (EPSPs 6 through 9) and late (last 4 EPSPs).
Calcium imaging
All cells were imaged after measures of input re-sistance, AHP, and I/O slopes were taken. Data repo-rted were taken from 8 neurons (♂ = 5, ♀ = 3)/5 mice (♂ = 3, ♀ = 2) (1.5 months), 7 neurons (♂ = 3, ♀ = 4)/6 mice (♂ = 3, ♀ = 3) (4 months), and 7 neurons (♂ = 5, ♀ = 2)/5 mice (♂ = 4, ♀ = 1) (10 months) for the WT dataset, and 13 neurons (♂ = 8, ♀ = 5)/10 mice (♂ = 6, ♀ = 4) (1.5 months), 9 neurons (♂ = 6, ♀ = 3)/8 mice (♂ = 5, ♀ = 3) (4 months), and 8 neurons (♂ = 5, ♀ =3)/6 mice (♂ = 3, ♀ = 3) (10 months) were included for the 5×FAD dataset. Cells were visualized under a 40× objective using a filter cube (Ex: 470/40 nm; Em: 525/50; Dichroic 495 nm; Chroma Technology Corp.; Bellows Falls, VT). Imaging Workbench (INDEC BioSystems; Los Altos, CA) was used to quantify outcome measures. A Lambda DG-4 (Sutter Instruments; Novato, CA) was used as a source to activate the fluorophore with exposures in the range of 250–800 ms depending on the depth of the cell imaged. A photometrics camera (Teledyne Photometrics; Tucson, AZ) was used to image calcium flu-orescence and kinetics. Two regions of interest (ROI) were created: one around the cell body and another of similar size in tissue adjacent to the imaged cell. Background subtraction and normalization to baseline were used to quantify changes in fluorescence (% ΔF/F). For quantification of resting fluorescence, values were averaged before RSS and normalized to the depth of the recorded cell. Outcome measures also included rise time, peak amplitude, decay time, and area-under-the-curve (AUC) during RSS, and were derived using Clampfit (Molecular Devices LLC.; San Jose, CA) and SigmaPlot software (Systat Software, Inc.; San Jose, CA).
Morris water maze
Water maze experiments were performed at the University of Michigan as previously described [75–77] utilizing male and female 5×FAD mice and non-carrier littermates (WT) as controls. Three age groups were examined; 1.5 month (5×FAD: ♂ = 5, ♀ = 2; WT: ♂ = 2, ♀ = 5), 4 month (5×FAD: ♂ = 4, ♀ =4; WT: ♂ = 4, ♀ = 3), and 10 month (5×FAD: ♂ = 17, ♀ = 19; WT: ♂ = 28, ♀ = 11). A larger cohort of 10-month animals was used to provide sufficient power to detect differences that we anticipated would be modest between genotypes at this time point. The MWM was composed of a round white acrylic pool that was 1.2 m in diameter. The pool was filled with water that was made opaque using nontoxic, white tempera paint and heated to 28°C. A round platform made of clear acrylic (10 cm in diameter) was submerged just below the surface of the water, ∼20 cm from the edge of the pool in the northeast quadrant. Mice were tracked using a digital camera mounted above the pool in combination with Actimetrics Water Maze (V4) software. Mice were trained to find the hidden platform during 4 trials a day. Before each trial, mice were individually placed on the platform for 10 s. At the start of the trial, mice were released into the maze, facing the wall at predefined pseudo-random locations, and the time taken to reach the platform was recorded. For all trials, mice were given 60 s to find the platform, and, if unsuccessful, were then guided to the platform. Previous experience indicated that older mice (regardless of genotype) require additional training to perform above chance. Therefore, young mice (1.5-month and 4-month) re-ceived 9 days of training and the older mice (10-month) received a total of 12 days of training. Mice were tested for their long-term memory for platform location during several probe tests throughout training. All mice received probe trials on days 4, 7, and 10 (24 h after the last training trial). Aged mice (10-month) received an additional probe trial on day 13 (24 h after the last training trial). For the probe trials, the platform was removed from the pool, and each mouse was allowed to swim for 60 s, starting at a point directly opposite to the trained platform location. To control for motivation, swimming ability, and sensory perception (elements required for spatial re-cognition), mice were run in the visible-platform version of the water maze on the day following the final probe trial. In this version, a distinct local cue (a flag) was fixed to the center of the hidden platform. Mice were given four visible-platform trials with a maximum of 60 s per trial.
Tissue section for amyloid-β and BTA-1 Staining
Male and female 5×FAD mouse brains were harvested for Aβ plaque staining at 3 time points; 1.5- month (n = 15 sections from 3 mice; ♂ = 5, ♀ = 10), 4-month (n = 16 sections from 3 mice; ♂ = 16, ♀ = 0), and 10-month (n = 11 sections from 2 mice; ♂ = 5, ♀ =-6). Mice were anesthetized using aerosolized isoflurane, then cardiac-perfused with 1× PBS followed by 4% paraformaldehyde. Brains were removed, further fixed in 4% paraformaldehyde overnight at 4°C, and then placed in a 30% sucrose solution at 4°C until they sank (2–3 days). Brains were then embedded in optimal cutting temperature (OCT) compound (Fisher; Maltham, MA) and frozen at –80°C. Once frozen, the embedded brains were sliced coronally at 40μm on a cryostat (Leica; Buffalo Grove, IL) and immediately mounted on Superfrost Plus slides (Fisher). Once mounted, sections were washed three times with 1× PBS to remove any residual OCT followed by incubation in 10μM BTA-1 (Sigma-Aldrich; St. Louis, MO) for 30 min. Sections were then washed for an additional three times with 1× PBS before being cover-slipped using VectaMount® Aqueous Mounting Media (Vector Laboratories; Burlingame, CA).
Amyloid-β imaging
Images were collected from two subregions of the hippocampus: the CA1 and dentate gyrus (DG) subfields. Images were obtained using an upright laser scanning confocal microscope (Olympus; Center Valley, PA) equipped with 4× and 20× air objectives. For each region, single images (1024×1024 pixels) were captured every 5μm for a total of 15μm total depth. BTA-1 staining was visualized using a 405 nm laser. Imaging acquisition settings (voltage (HV), gain, and offset) in the Olympus FluoView software were consistent across samples to allow for comparison. Aβ images were processed using ImageJ software (FIJI) and quantified using maximum projections of images at a depth of 15μm. The images were then background subtracted with a 50-pixel rolling-ball radius, manually thresholded, and converted into binary masks of BTA-1 positive ROIs. ROIs were then used to count individual Aβ plaques in the raw image. This value was then divided by the volume of the image to give a result of plaque density in number/μm3. Images are presented in grayscale.
Cell health and exclusion criteria
Only neurons that fit the following criteria were included in the electrophysiological and calcium im-aging analyses: input resistance ≥30 MΩ, holding current ≤–350 pA, and AP peak ≥–2 mV. These values are reported in Table 1. Additionally, if the number of APs during RSS were >2 SD from the mean, the cell was considered an outlier and removed from the analysis.
Table 1
Measures of Neuronal Health and Cellular Activation
| Genotype | Age (months) | Holding Current (pA) | Input Resistance (MΩ) | AP Amplitude (mV) | # of APs During Imaging |
| WT Male | 1.5 | –125±65.1 | 91.3±15.2 | 4.5±2.3 | 70.2±3.0 |
| 4 | –241.7±16.6 | 48.7±2.6 | 7.7±1.5 | 70±0.6 | |
| 10 | –143.3±31.6 | 63.3±3.9 | 8.7±1.8 | 66.8±4.5 | |
| 5×FAD Male | 1.5 | –76.4±27.5 | 71.4±4.8 | 9.2±1.6 | 68.1±2.2 |
| 4 | –208.3±22.8 | 43.3±2.1 | 8.8±1.3 | 70±0.7 | |
| 10 | –156.3±36.1 | 61.0±4.7 | 7.8±1.9 | 73.8±1.2 | |
| WT Female | 1.5 | –120±48.1 | 76.5±10.7 | 10±2.1 | 68.7±0.3 |
| 4 | –120±27.6 | 54.6±4.6 | 9.1±1.8 | 66.8±4.3 | |
| 10 | –105±33.8 | 85.1±12.2 | 8.8±1.9 | 70.0±0 | |
| 5×FAD Female | 1.5 | –201.4±28.1 | 61.5±7.7 | 5.6±2.5 | 68.2±3.2 |
| 4 | –185.7±17.6 | 58.7±6.0 | 2.9±2.2 | 70.3±0.3 | |
| 10 | –84.3±40.1 | 80.0±4.9 | 6.5±1.6 | 70.7±0.3 | |
| Significance | – | p < 0.02 | p < 0.001 | n.s. | n.s. |
Neuronal health was compared across genotype, sex, and age. The amplitude of action potentials (AP) during AHP data acquisition and the number of APs during RSS while imaging were recorded. Holding current and input resistance reflect cell membrane “leakiness” and integrity. Holding current and input resistance at 4 months were both significantly elevated (p < 0.05). No changes were detected between groups on measures of AP amplitude or number of APs during imaging (p > 0.05).
Data quantification and statistics
The statistical significance of electrophysiological and imaging measures was calculated using Sig-maPlot. Using three-way ANOVA, we report on main effects of age, sex, or genotype, as well as interaction terms using the Holm-Sidak multiple comparisons test. For behavioral analysis, significance was tested using a 2-factor repeated measures ANOVA, unpaired t-tests, and single factor t-tests. Sex differences were not investigated for behavior. All Aβ imaging data was analyzed and displayed using GraphPad Prism 8 and Aβ deposition between 4-month and 10-month mice was compared using a 2-tailed unpaired t-test. The 1.5-month mice were excluded from analysis due to the absence of any observable plaques. Significance for all data was set at p < 0.05. Data are represented as means±standard error of the mean (SEM).
RESULTS
The following results were derived from 93 cells recorded in 61 animals and from 52 imaged cells. We compared several measures of neuronal health and numbers of APs triggered during imaging protocols to confirm that the results reported here were all derived from healthy dorsal CA1 pyramidal neurons (Table 1). For behavioral analysis, 55 WT and 51 5×FAD mice were used. Tissue sections from eight 5×FAD mice were stained and analyzed for Aβ deposits. Table 2 illustrates the impact of training as compared to genotype on MWM outcome measures.
Table 2
Results and Statistical Analyses of Behavioral Data
| Measure | Age (months) | F-value | p | Significance | |
| Latency to Platform | Effect of Training | 1.5 | F (8,88) = 11.26 | p < 0.0001 | Yes |
| 4 | F (8,96) = 4.896 | p < 0.0001 | Yes | ||
| 10 | F (12,876) = 68.14 | p < 0.0001 | Yes | ||
| Effect of Genotype | 1.5 | F (1,11) = 2.395 | p = 0.15 | No | |
| 4 | F (1,12) = 0.008 | p = 0.929 | No | ||
| 10 | F (1,73) = 10.53 | p = 0.0018 | Yes | ||
| Time spent in target quadrant | Effect of Training | 1.5 | F (2,22) = 12.21 | p = 0.0003 | Yes |
| 4 | F (2,24) = 0.666 | p = 0.523 | No | ||
| 10 | F (3,228) = 24.33 | p < 0.0001 | Yes | ||
| Effect of Genotype | 1.5 | F (1,11) = 0.006 | p = 0.938 | No | |
| 4 | F (1,12) = 0.198 | p = 0.663 | No | ||
| 10 | F (1,76) = 12.03 | p = 0.0009 | Yes | ||
| Swim Speed | Effect of Genotype | 1.5 | F (5,6) = 1.179 | p = 0.022 | Yes |
| 4 | F (6,7) = 4.374 | p = 0.404 | No | ||
| 10 | F (36,36) = 2.266 | p = 0.8725 | No |
Latency to platform, time spent in the target quadrant, and swim speed were compared across genotype and age. Training significantly reduced the latency to platform across age (p < 0.0001); however, on measures of time spent in target quadrant, this was only seen in 1.5- and 10-month-old animals (p < 0.001). Compared to WT littermates, 5×FAD mice showed significant behavioral deficits by 10 months of age (p < 0.0018) and spent significantly less time in the target quadrant (p = 0.0009). Genotype significantly influenced swim speed at 1.5 months (p = 0.022), but not at 4 or 10 months.
Afterhyperpolarization
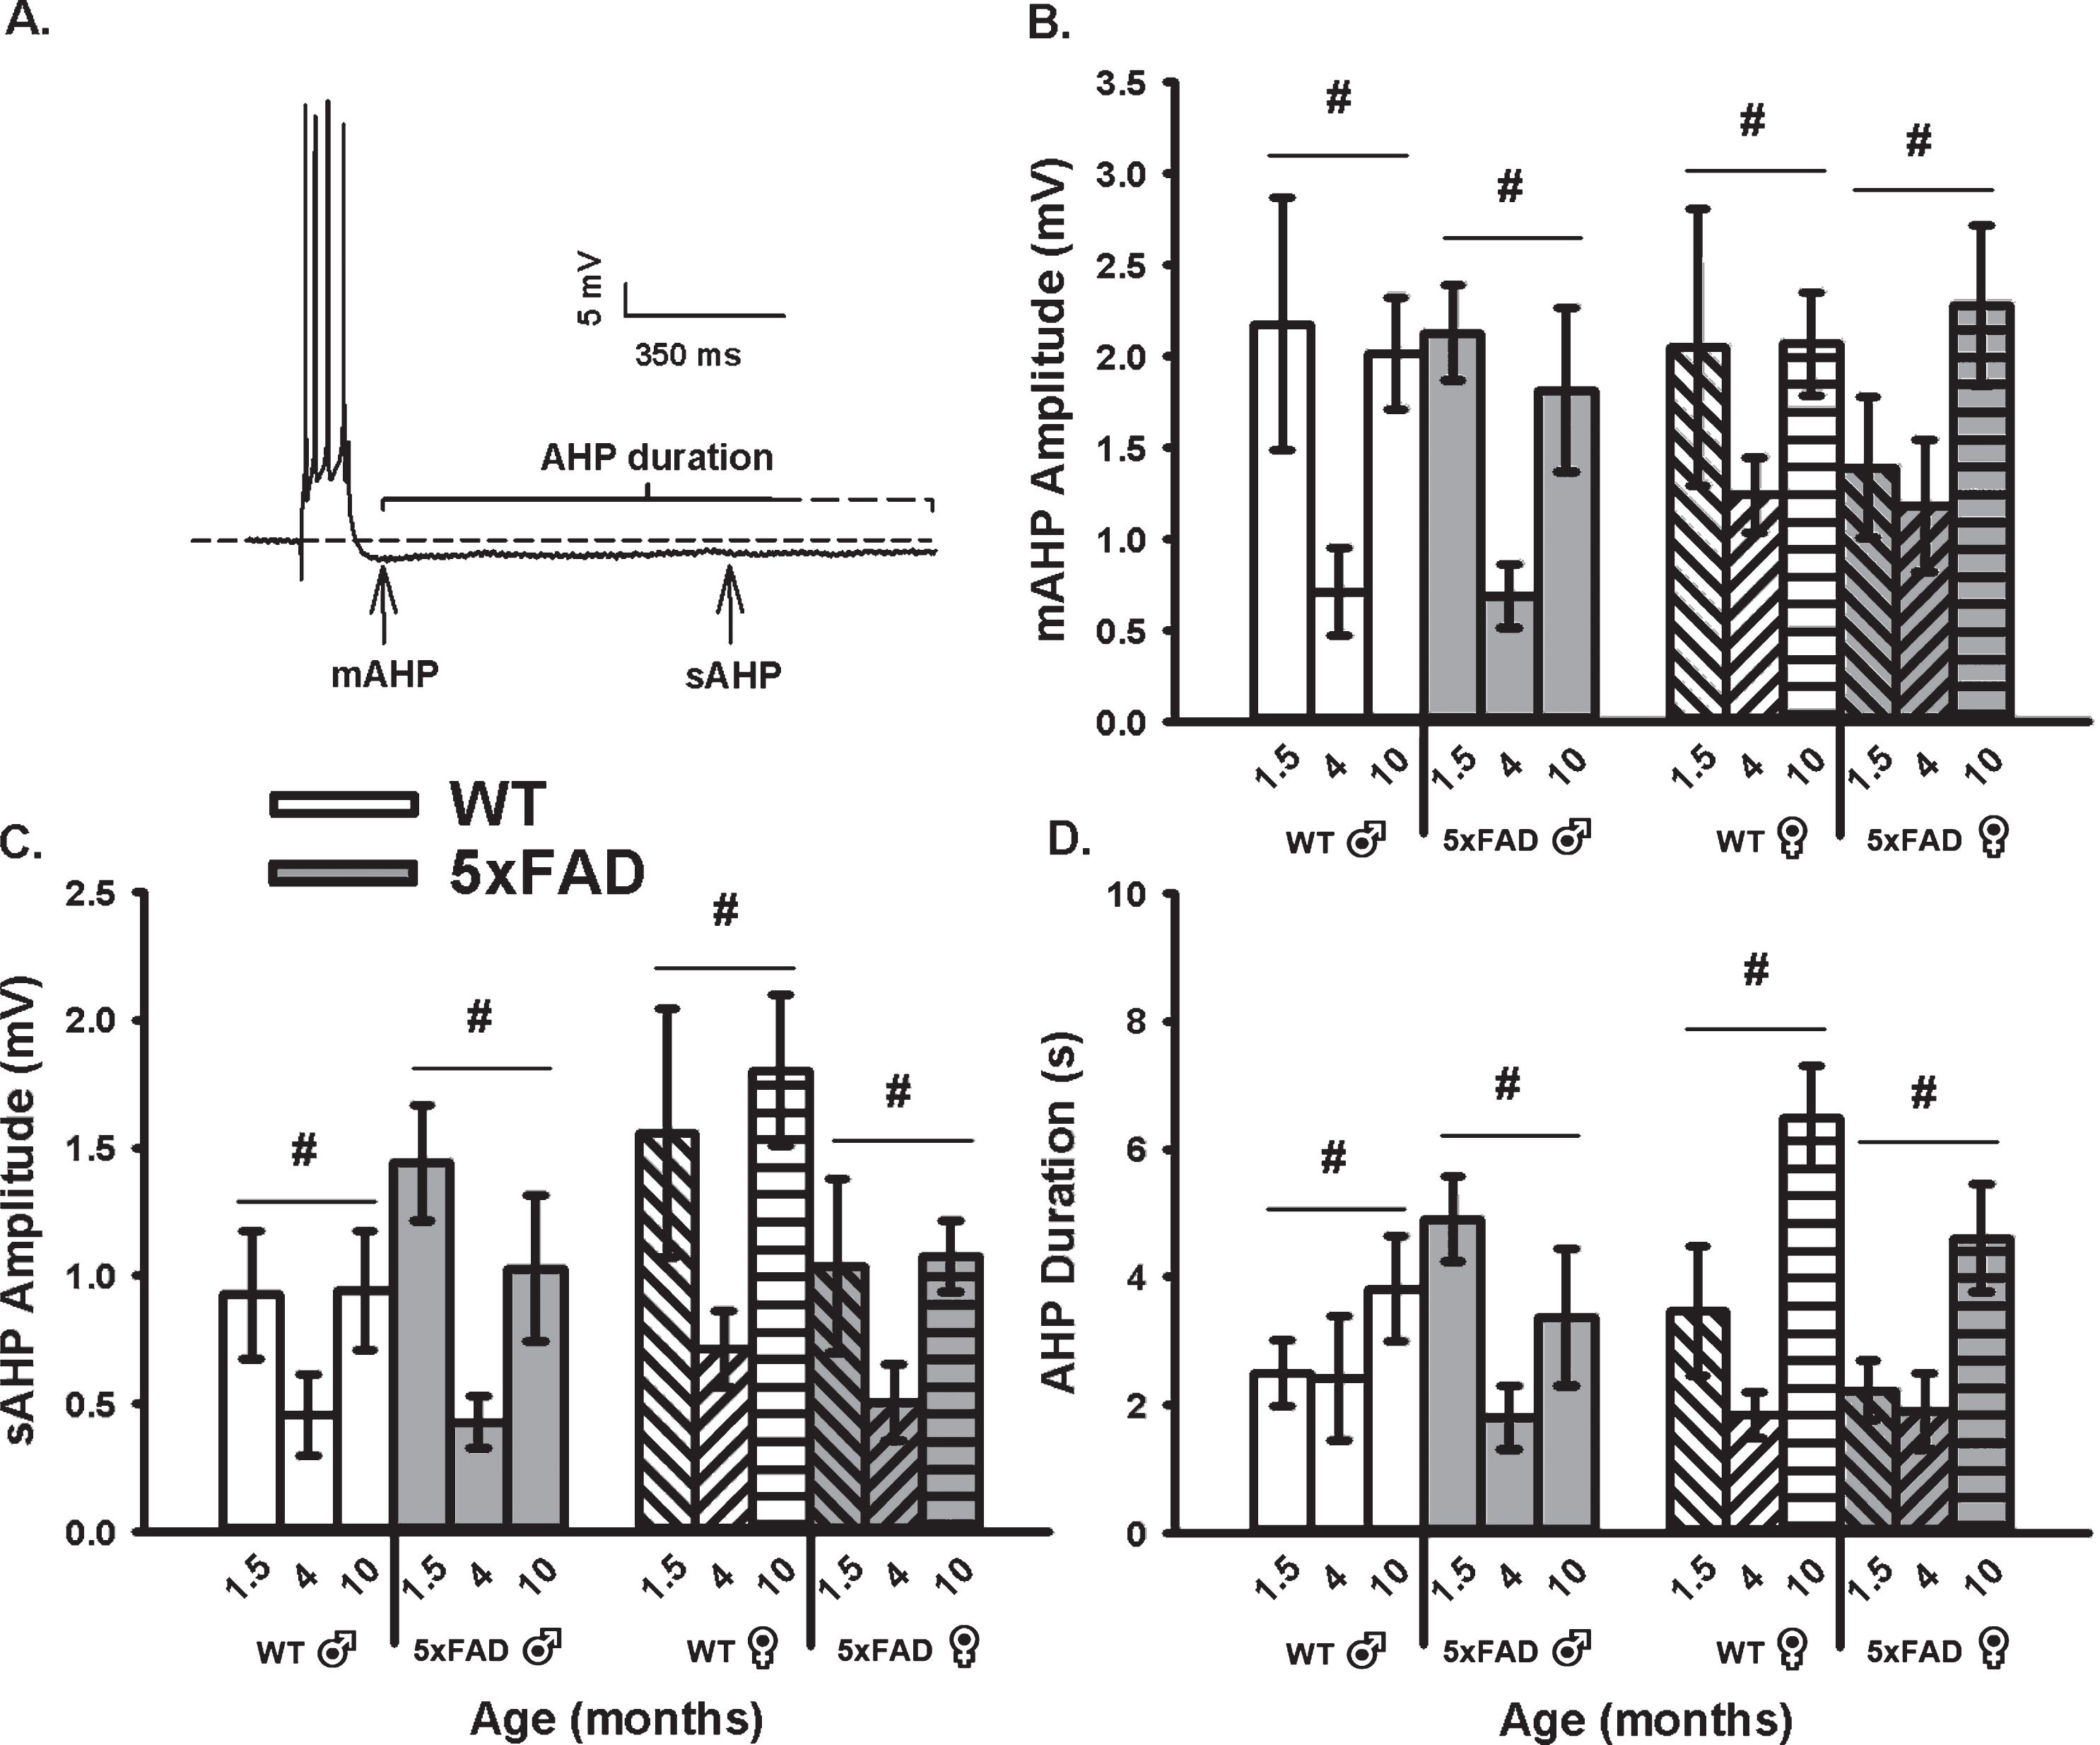
To determine if an age, sex, or genotype effect on the calcium-dependent AHP was present, we mea-sured the mAHP and the sAHP amplitude, as well as the AHP duration (Fig. 1). These measures revealed that the amplitude of the mAHP (F2,92 = 9.99, p <0.001; three-way ANOVA; Fig. 1B) was significantly reduced in both WT and 5×FAD mice from 6 weeks to 4 months of age. Interestingly, from 4 to 10 months, the mAHP significantly increased to levels indist-inguishable from those seen at 6 weeks. Similar re-sults were seen on measures of the sAHP amplitude (F2,92 = 11.00, p < 0.001; three-way ANOVA) and the AHP duration (F2,92 = 10.70, p < 0.001; three-way ANOVA; Fig. 1C). The “U” shaped aging effect seen in Fig. 1 is intriguing, and may reflect on the inclusion of the 1.5-month age group. In fact, most studies of aging use 3–4 months old animals as the “young” age group. Still, one prior study using patch electrodes describes a significant increase between 1.5 months and 1.5 years in similar WT and transgenic animals, but no significant genotype effect was reported at any ages [63]. Of interest, analysis of the sAHP amplitude here revealed a significant sex by genotype interaction term (F1,92 = 5.47, p = 0.02), where a reduction was noted in female 5×FAD compared to WT (p <0.05), but not in males. Further, when analyzing the AHP duration (Fig. 1D), an age by sex interaction term was noted (F2,92 = 3.30, p = 0.04); again, this aging effect was only significant in females (p < 0.05). These results highlight the importance of investigating sex differences in animal models of AD.
Fig. 1
AHP Measures in WT and 5×FAD Mice Across Age and Sex. A) Example of an AHP following post-synaptic depolarization with 4 APs. B) A main effect of aging (p < 0.05) on the mAHP was observed within each genotype and across sex. C, D) Similar findings were observed on the sAHP (800 ms) amplitude measures, as well as on the AHP duration. Hashes (#) represent significance in aging at p < 0.05.
Synaptic activation
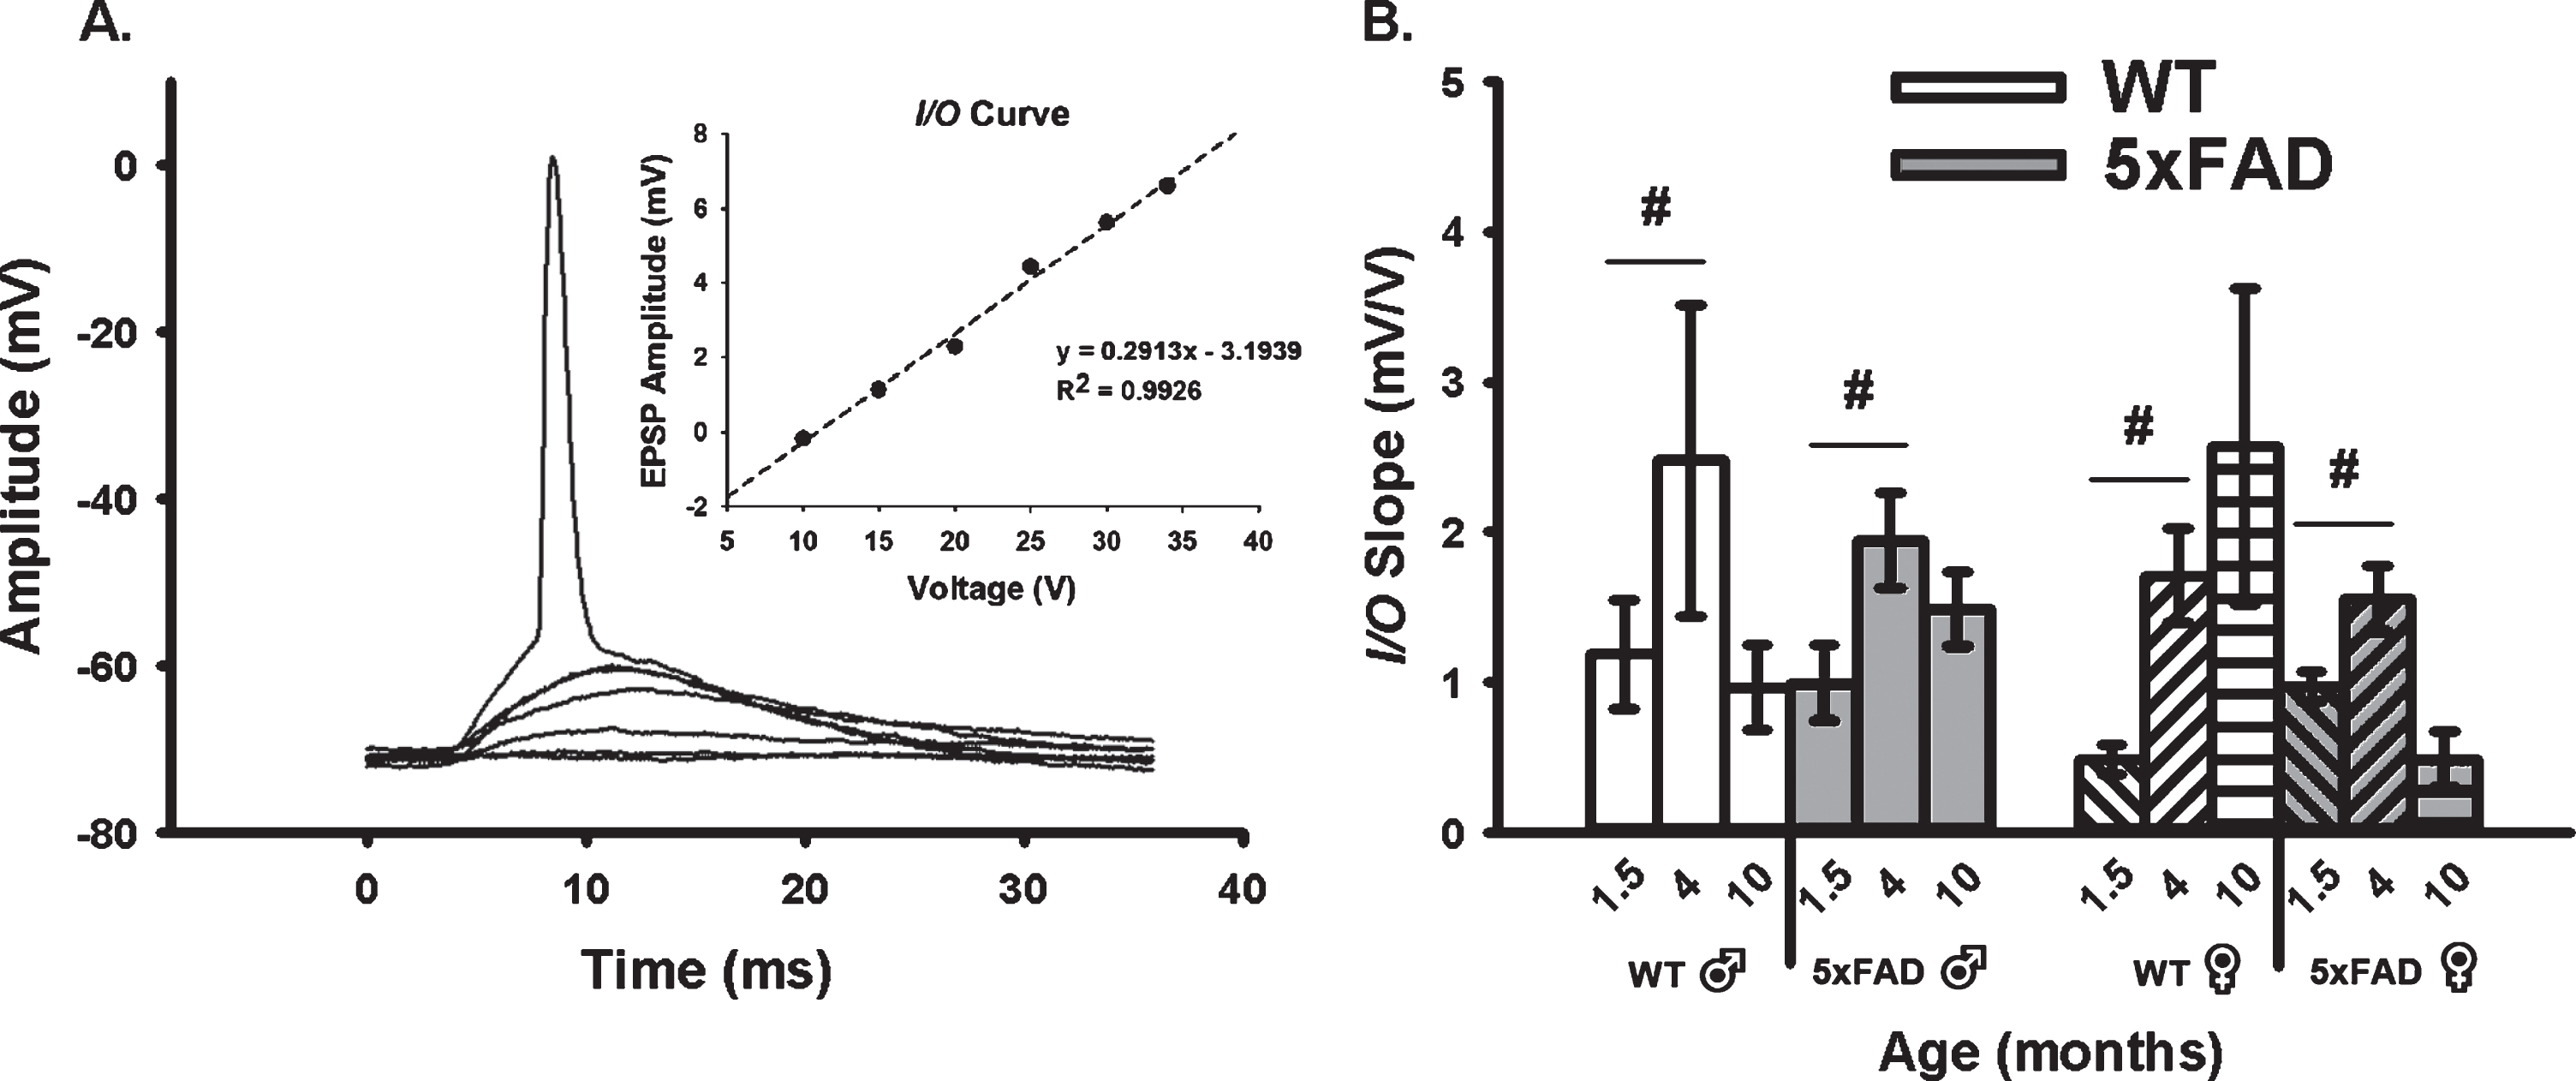
We quantified neuronal excitability during synaptic activation using measures of EPSP amplitudes and I/O slopes (Fig. 2A, B). In alignment with the age-dependent changes in the AHP presented in Fig. 1 where a “U” shaped curve was noted, analysis of the excitability data (I/O slopes) reveals inverse relationships with age, as highlighted by greater excitability at 4 months. Indeed, a main effect of age was detected (F2,80 = 8.02, p < 0.001; three-way ANOVA). Further, an age by sex by genotype interaction was also identified (F2,80 = 5.13, p < 0.008), albeit only at 1.5 and 4 months of age (p < 0.05 for both). Once again, this effect was more pronounced in female 5×FAD mice than in males.
Fig. 2
Extracellular Synaptic Activation. A) Example of EPSPs recorded below and at threshold of an AP. Inset shows input/output (I/O) plot fit from EPSP amplitudes with increasing stimulation intensity. B) Synaptic excitability derived from I/O measures (slopes) reveal a significant main effect of aging across genotypes and sex. Hashes (#) represent significance in aging at p < 0.05.
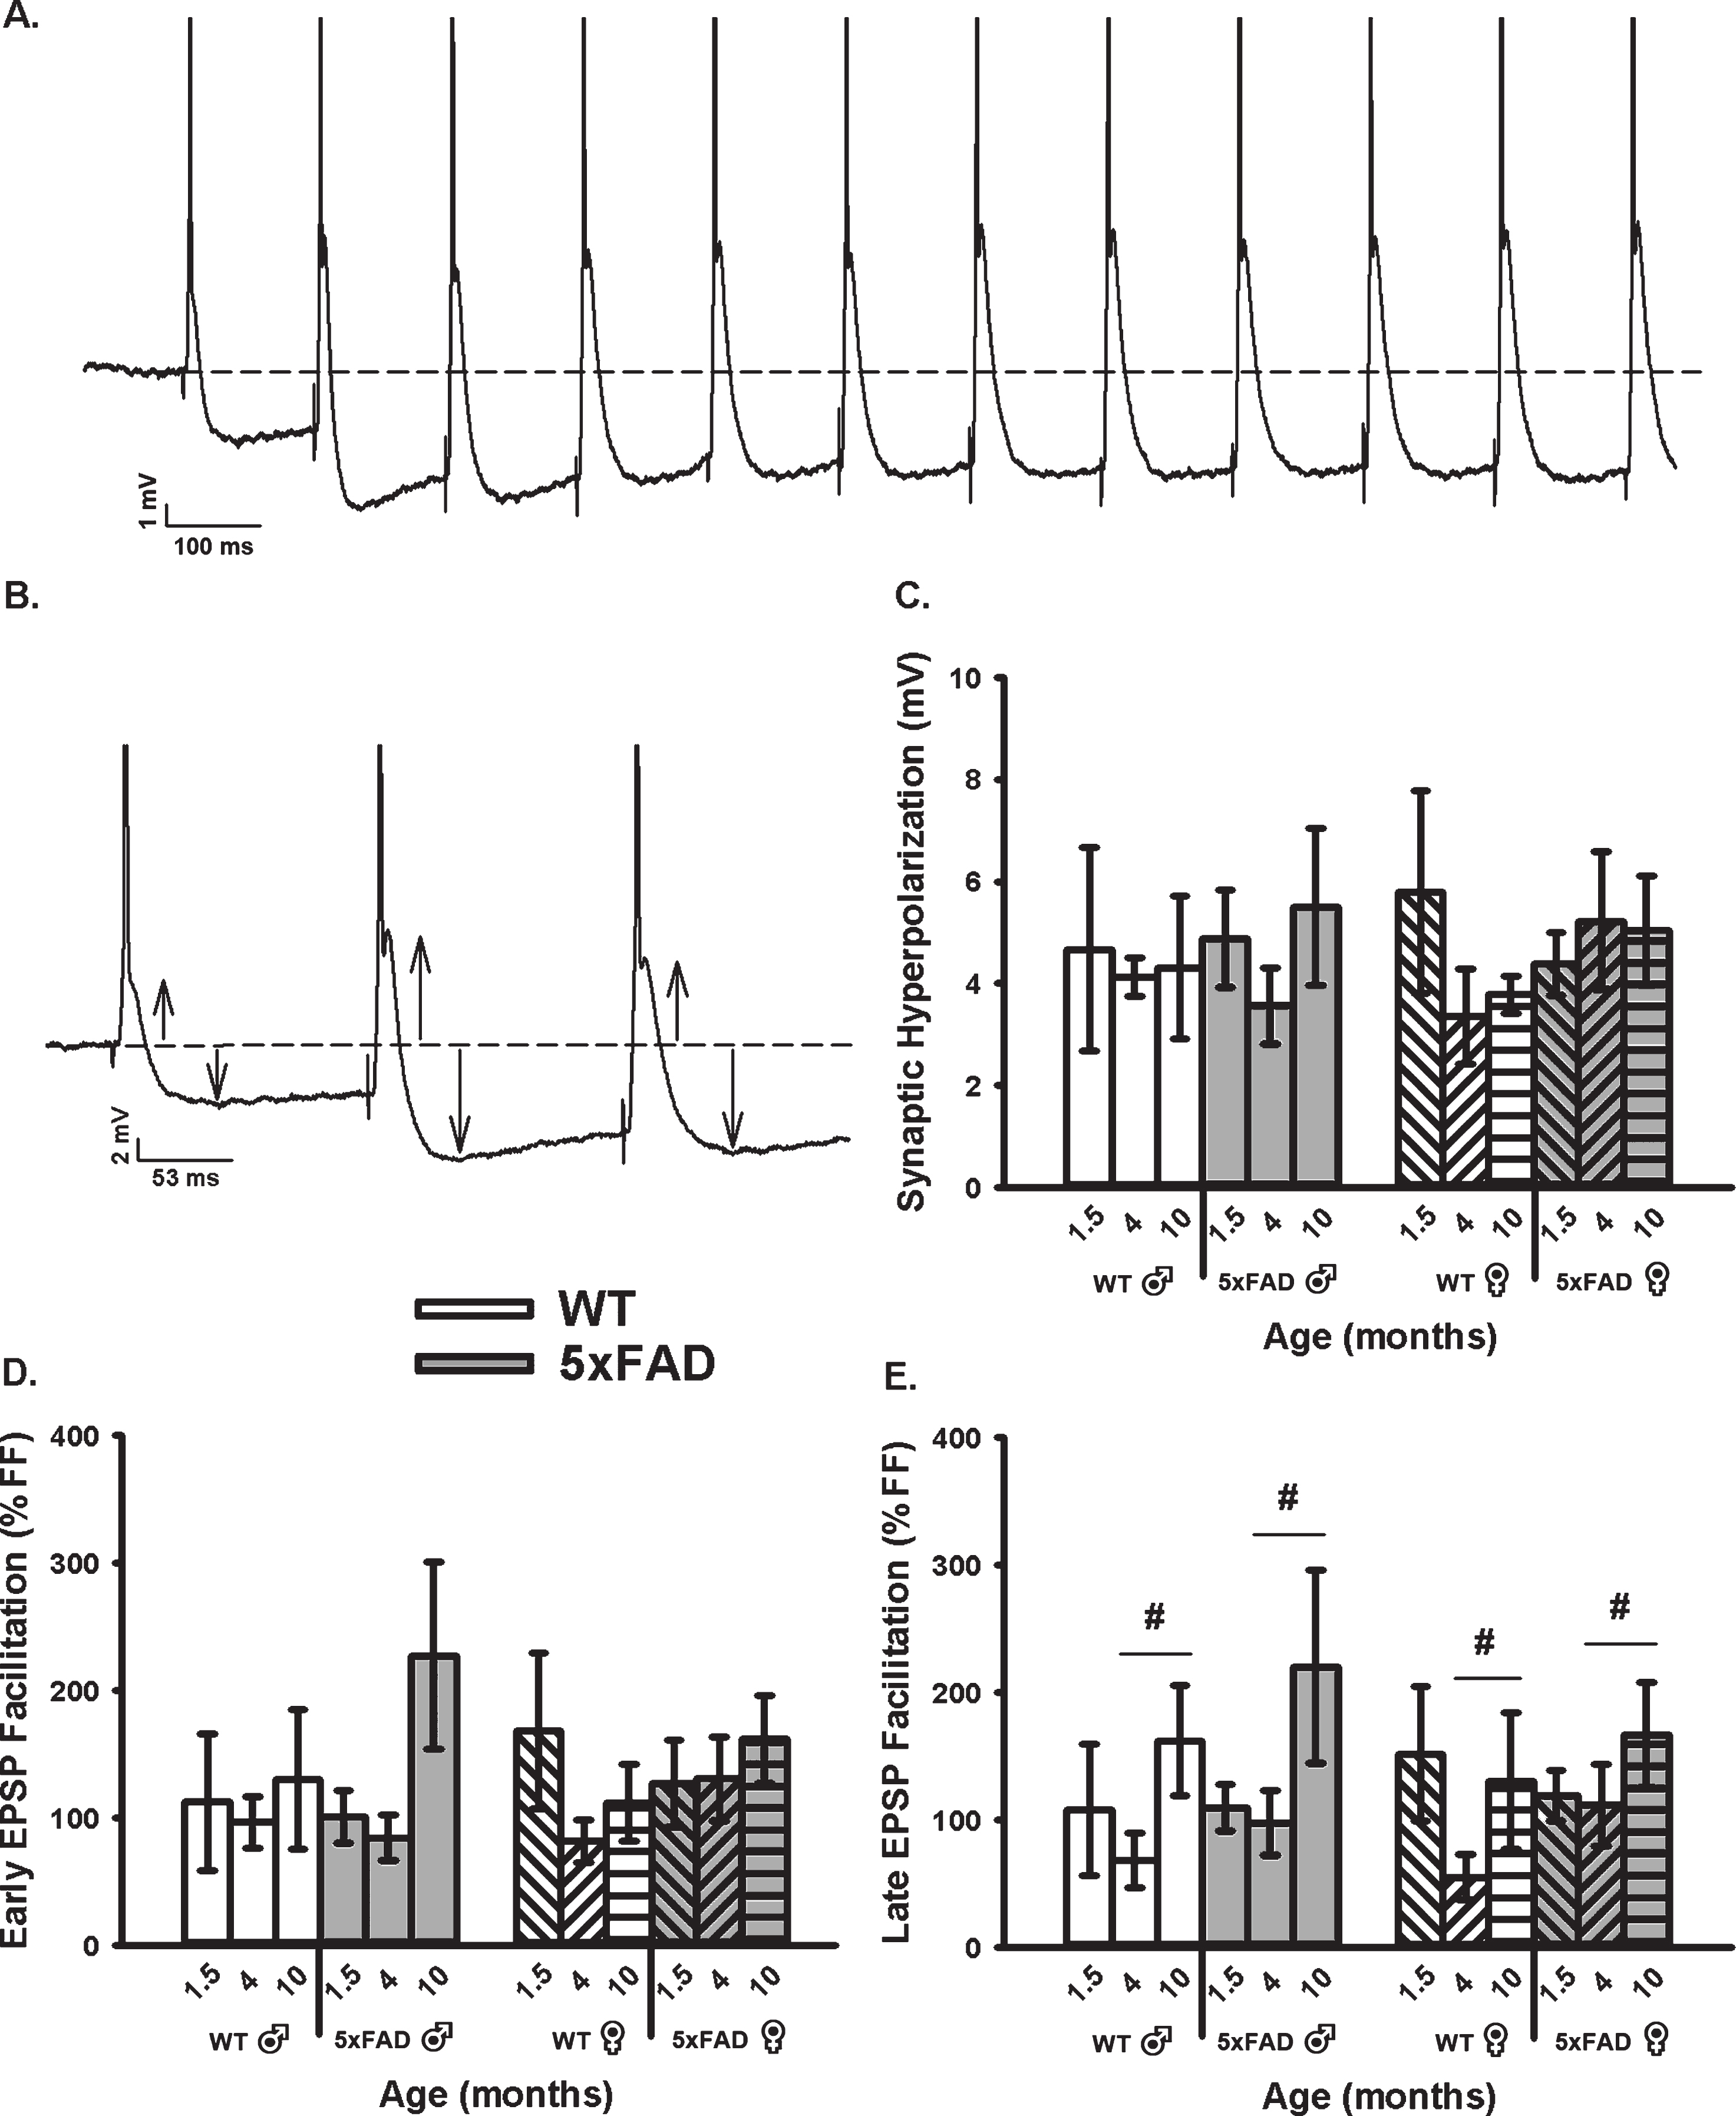
We then obtained measures of RSS at 7 Hz, including synaptic hyperpolarization (Fig. 3A–C) as well as short-term EPSP facilitation (Fig. 3A, B, D, E). While synaptic hyperpolarization has been shown to decrease with age in the F344 rats model of aging [71], no age or genotype effect was identified in the 5×FAD mice and at the ages tested here (Fig. 3C). However, while investigating changes in EPSP facilitation during RSS (both early and late, Fig. 3D, E), we noticed a significant increase in the late phases of EPSP facilitation as a function of age in the 5×FAD model (F2,76 = 4.11, p = 0.02; three-way ANOVA). This result is surprising, given prior literature reporting on depressed EPSP facilitation with aging [78–81].
Fig. 3
Repeated Synaptic Stimulation (RSS). A) Example of RSS showing EPSP potentiation and synaptic hyperpolarization. Cells were repeatedly stimulated at 7 Hz for 10 s. B) Upward arrows illustrate growth in EPSP amplitude during RSS and downward arrows show increased amplitude in the synaptic hyperpolarization. APs are truncated for illustration in A and B. C) Synaptic hyperpolarization measured during RSS was not altered across aging or genotypes. D, E) EPSP facilitation taken during the first (early) and last (late) periods of RSS. A main effect of age was noted on measures of late EPSP facilitation displaying an increase in the older group, independent of sex. Hashes (#) represent significance in aging at p < 0.05.
Calcium imaging
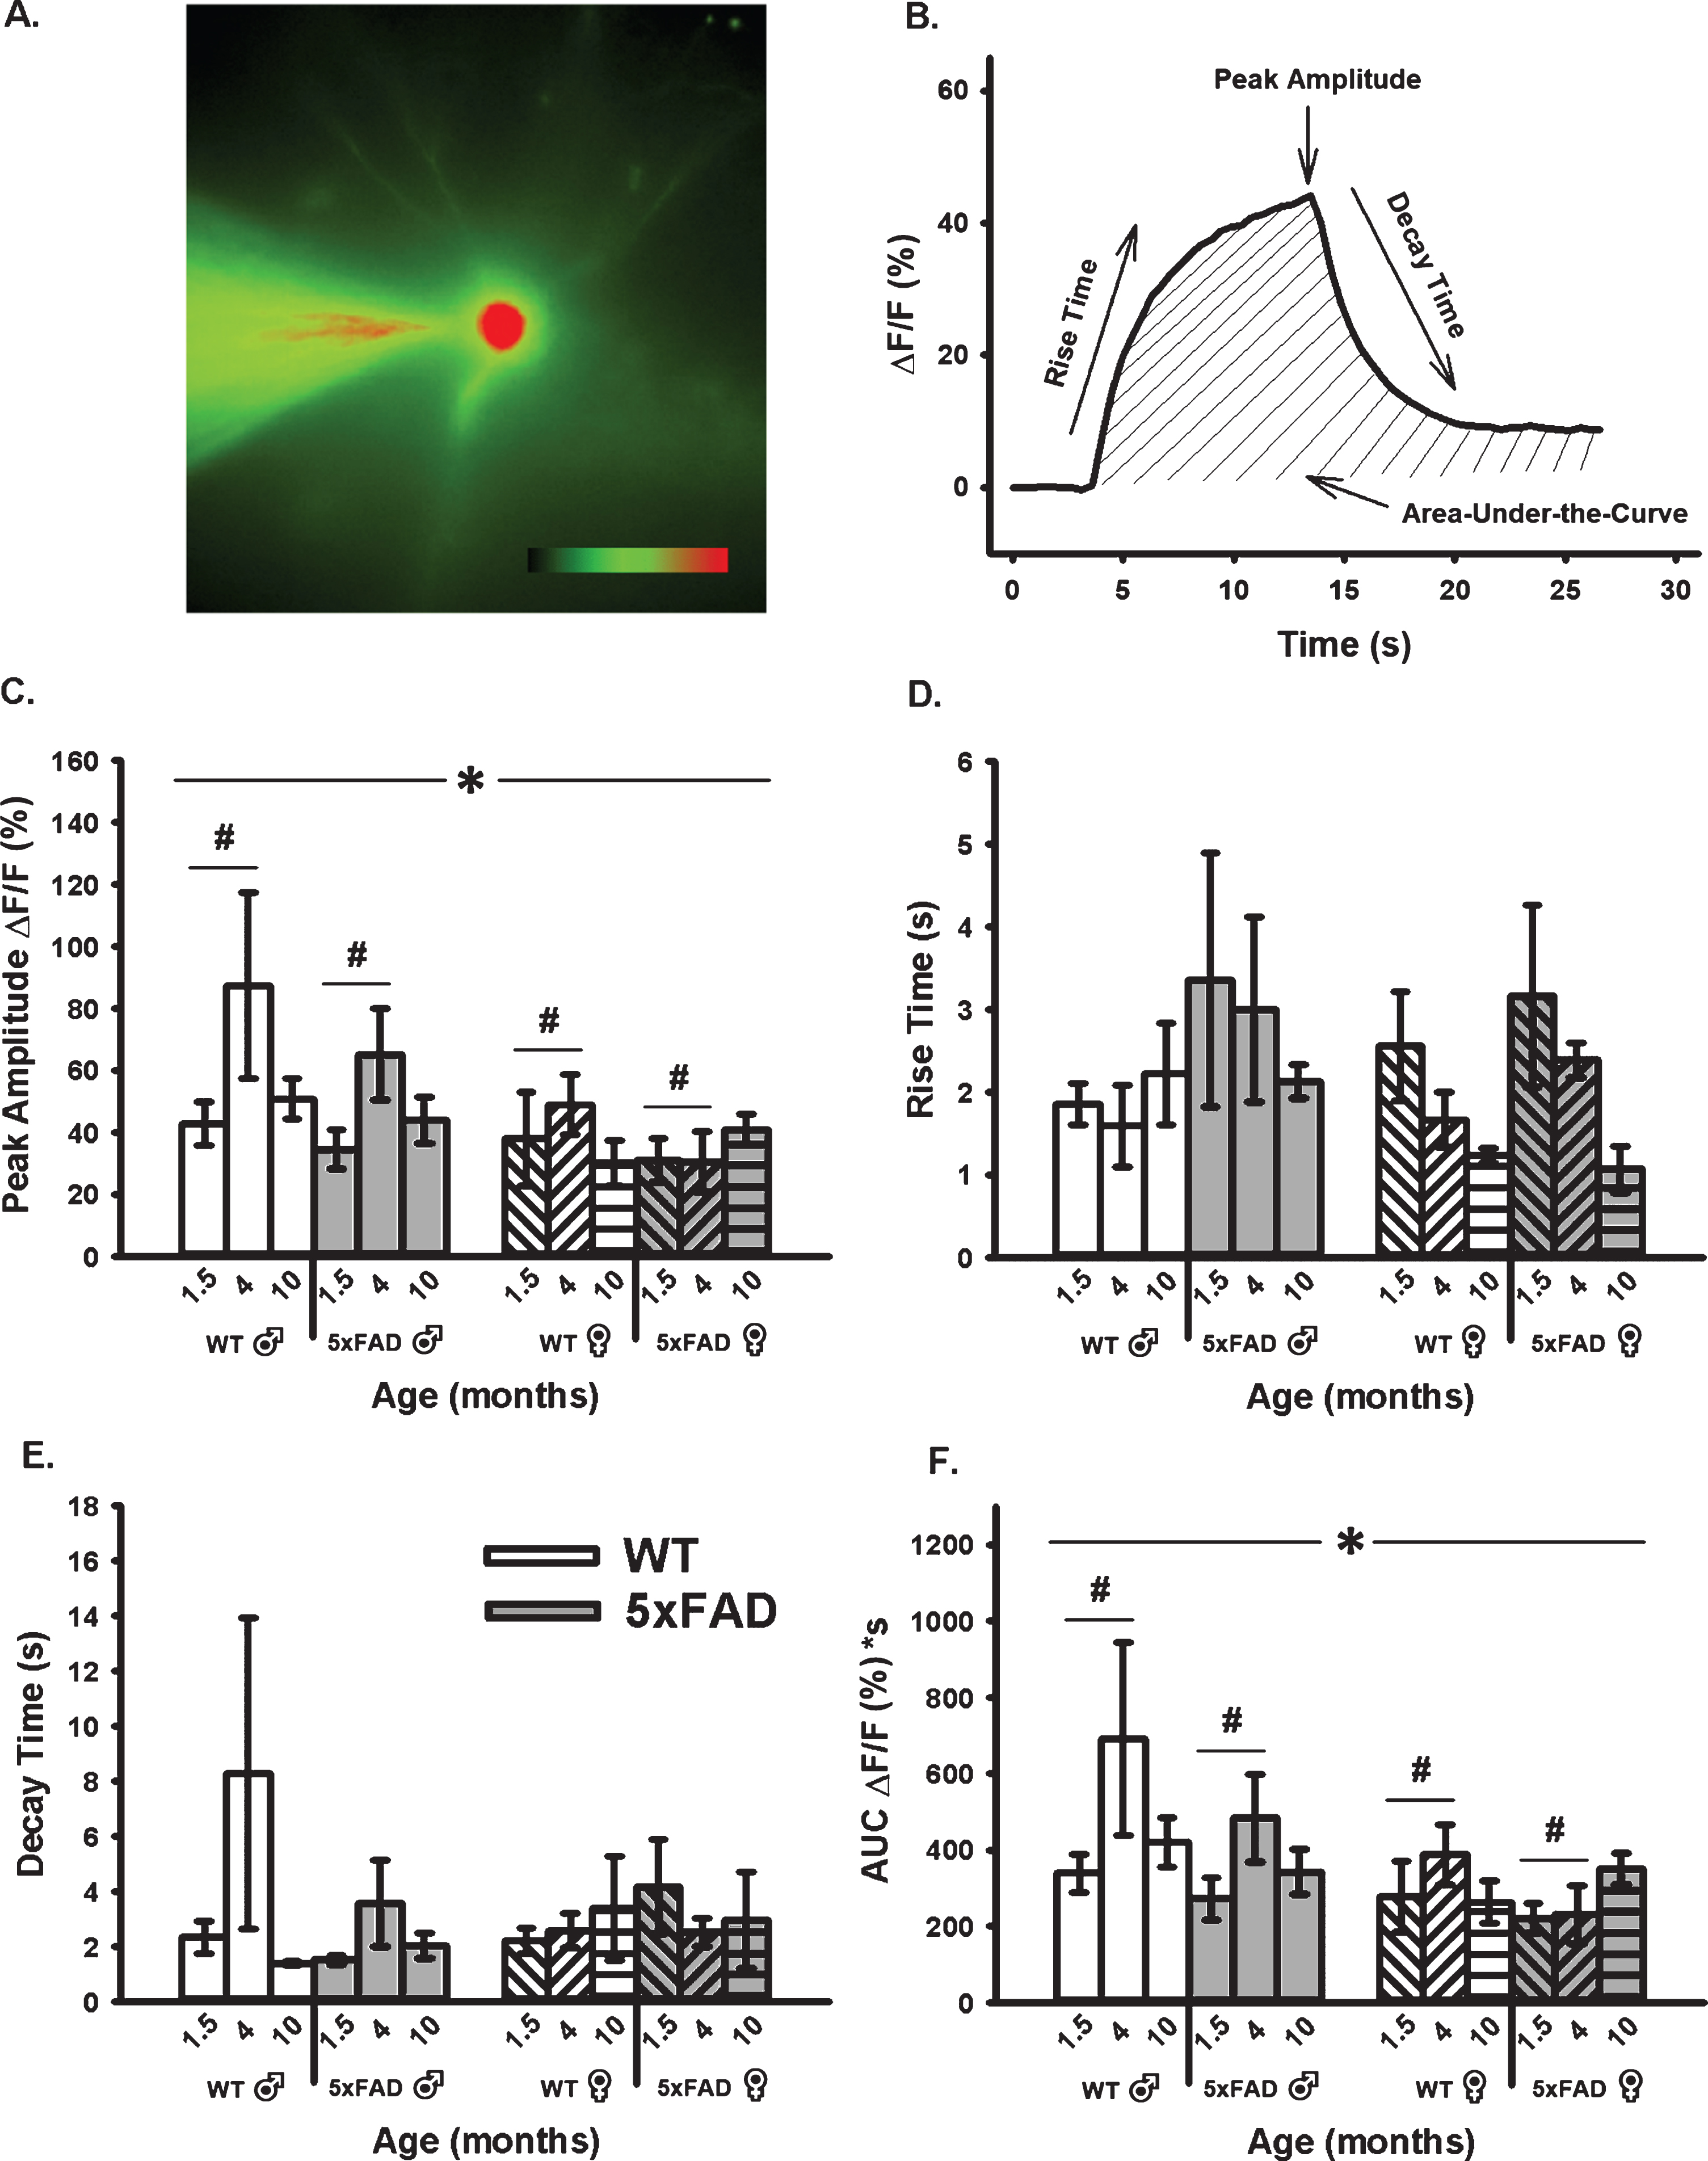
Age-, sex-, and genotype-sensitive changes in calcium kinetics and overall somatic levels were derived from OGB-1 fluorescence before, during, and after RSS (Fig. 4). Cells were synaptically-stimulated at 7 Hz for 10 s and changes in fluorescence were normalized to resting fluorescence (% ΔF/F) just prior to stimulation. Results show that neither age, sex, nor genotype altered measures of calcium kinetics based on rise time or decay time constants (Fig. 4D, E). However, measures of peak amplitude and AUC (Fig. 4C, F) highlighted a significant main effect of age and sex. Measures of peak amplitude and AUC revealed a main effect of age highlighted mostly by differences between the 1.5- and 4-month-old groups (F1,51 = 3.71, p = 0.03; F1,51 = 3.54, p = 0.04, respectively; three-way ANOVA). The same measures also showed an overall main effect of sex, as highlighted by reductions in fluorescence intensity during RSS in females compared to males (peak: F1,51 = 6.52, p = 0.02; AUC: F1,51 = 6.14, p = 0.02).
Fig. 4
Changes in OGB-1 Fluorescence During 10 s RSS. A) Example of an imaged OGB-1 loaded neuron. B). Normalized fluorescence change across time (% ΔF/F) before, during, and after RSS. C) Peak amplitude measures show both a significant effect of age and sex. D, E) No significant differences were found in measures of rise or decay time constants. F) AUC shows significant effects of both age and sex. Hashes (#) represent significance in aging and asterisks (*) represent sex differences at p < 0.05.
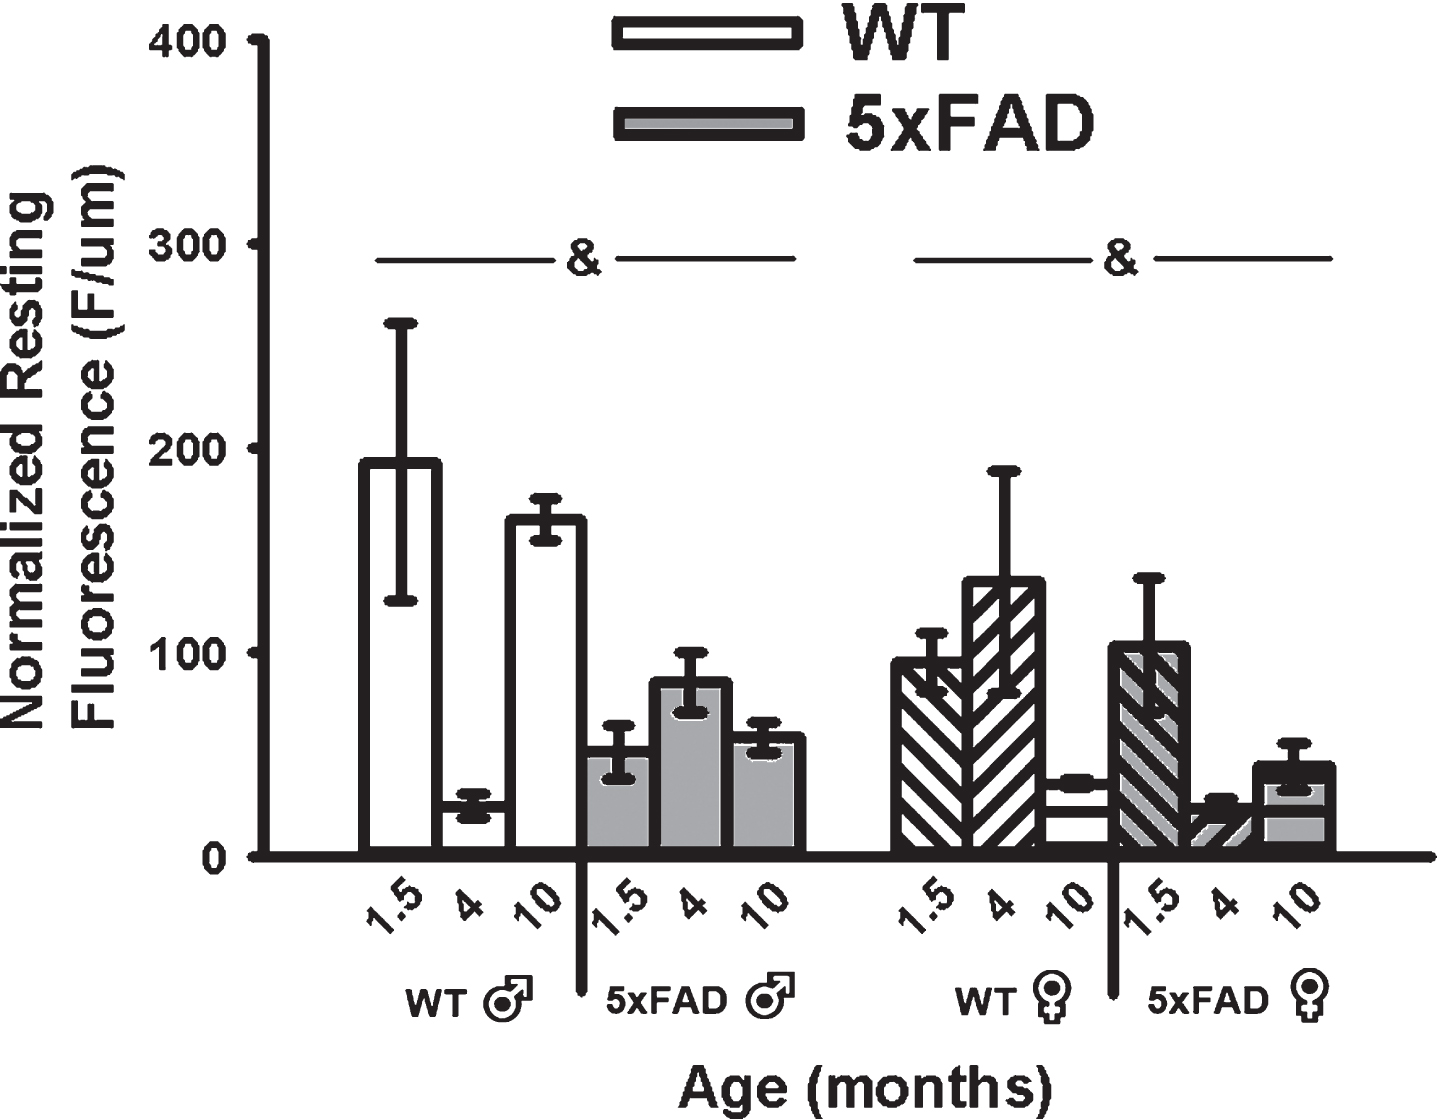
A main effect of genotype on mean resting fluorescence (F1,49 = 8.62, p < 0.01; three-way ANOVA) was seen with reductions in calcium-dependent fluorescence in the 5×FAD compared to WT in both sexes (Fig. 5). Because OGB-1 fluorescence values depend on calcium levels, duration of exposure to the indicator, and the depth of the cell recorded, we normalized mean resting fluorescence to the depth of each cell. While a significant main effect of age on measures of recorded depth (F2,49 = 3.80, p = 0.03; three-way ANOVA) was noted, this was mostly mediated by an increase in depth in 4-month-old animals and was independent of genotype, and therefore unlikely to have contributed to the overall genotype effect (Fig. 5).
Fig. 5
Resting Fluorescence Before RSS. Mean resting fluorescence was normalized to the depth of each recorded cell. Significant genotype effect was detected, highlighting reduced fluorescence in the 5×FAD animals compared to WT. Ampersands (&) indicate significance for genotype at p < 0.05.
Behavior
We explored the impact of age on hippocampal-dependent learning and memory using the MWM task [82]. Analysis of latency to find the hidden platform during training revealed a significant reduction across training days at 1.5 months (F8,88 = 11.26, p < 0.0001; two-way repeated measures ANOVA), 4 months (F8,96 = 4.896, p < 0.0001; two-way repeated measures ANOVA), and 10 months (F12,876 = 68.14, p < 0.0001; two-way repeated measures ANOVA). As expected, there were no differences between 5×FAD and WT mice in latency to platform in either the 1.5-month or 4-month groups (Fig. 6A1–B1). However, there was a significant reduction in latency observed in the 10-month group (F1,73 = 10.53, p = 0.0018; two-way repeated measures ANOVA) (Fig. 6C1), indicating that the 5×FAD mice have a deficit in their ability to learn the platform location across training days.
Fig. 6
Morris Water Maze Data. Mice were trained using 4 trials per day for 9 days (1.5- and 4-month-old animals; A1-B1.) or 12 days (10-month-old animals; C1.) days on the hidden platform task. Memory performance was assessed using probe trials on days 4, 7, 10 [∧] (all age groups; A2-C2.) and 13 (10-month; C2.). By the final probe, all groups spent significantly more time (>25%) in the target quadrant. 1.5- and 4-month mice exhibited a significant decline in the latency to find the hidden platform across training days, but no differences were seen between genotypes (A1-B1.). There were no significant differences between genotypes during probe trials (A2-B2.). 10-month-old 5× FAD and WT mice exhibited a significant decline in latency to find the hidden platform across training days; however, 5× FAD mice had a longer latency to reach the platform compared to the WT mice (C1.). During probe trials, 5×FAD mice spent significantly less time in the target quadrant than WT littermates (C2.), indicating a memory deficit. Asterisks (*), daggers (†), and double daggers (‡) represent significant values at p < 0.05.
![Morris Water Maze Data. Mice were trained using 4 trials per day for 9 days (1.5- and 4-month-old animals; A1-B1.) or 12 days (10-month-old animals; C1.) days on the hidden platform task. Memory performance was assessed using probe trials on days 4, 7, 10 [∧] (all age groups; A2-C2.) and 13 (10-month; C2.). By the final probe, all groups spent significantly more time (>25%) in the target quadrant. 1.5- and 4-month mice exhibited a significant decline in the latency to find the hidden platform across training days, but no differences were seen between genotypes (A1-B1.). There were no significant differences between genotypes during probe trials (A2-B2.). 10-month-old 5× FAD and WT mice exhibited a significant decline in latency to find the hidden platform across training days; however, 5× FAD mice had a longer latency to reach the platform compared to the WT mice (C1.). During probe trials, 5×FAD mice spent significantly less time in the target quadrant than WT littermates (C2.), indicating a memory deficit. Asterisks (*), daggers (†), and double daggers (‡) represent significant values at p < 0.05.](https://content.iospress.com:443/media/jad/2020/78-4/jad-78-4-jad200109/jad-78-jad200109-g006.jpg)
By the final probe trial, 5×FAD mice and their WT littermates in all groups had spent a significant percentage of time in the target quadrant compared to chance (p < 0.05, single factor t-test). As expected, there was no effect of genotype in either the 1.5- or 4-month groups across probe trials (p = 0.605, p = 0.938, respectively; two-way repeated measures ANOVA) (Fig. 6A2-B2). However, the 10-month 5×FAD mice spent significantly less time across probe trials searching in the quadrant where the platform was previously located in comparison to their WT littermates (F1,76 = 12.03, p = 0.0009; two-way repeated measures ANOVA) (Fig. 6C2), indicating a memory deficit for platform location. No significant difference in swim speed between 5×FAD and WT mice (p = 0.217; unpaired t-test) was noted, establishing that this deficit was not due to alterations in either motor function or motivation. Additionally, a non-spatial version of the water maze was performed in which the escape platform was clearly marked. The 5×FAD and WT mice exhibited similar escape latencies (p = 0.7114; unpaired t-test), suggesting that the memory deficit we observed in the 10-month 5×FAD mice was not due to a nonspecific performance issue. Similarly, no significant differences were observed in performance during the visible platform in the 1.5-month and 4-month mice (p = 0.33 and p = 0.054, respectively). With respect to potential sex differences across groups, we did not observe a statistically significant effect of sex on any of the behavioral performance variables analyzed. Finally, we did not observe a correlation between MWM performance, calcium dynamics, and sex. Taken together, these data indicate that learning and memory deficits are present in 5×FAD mice by 10 months of age.
Amyloid-β deposition
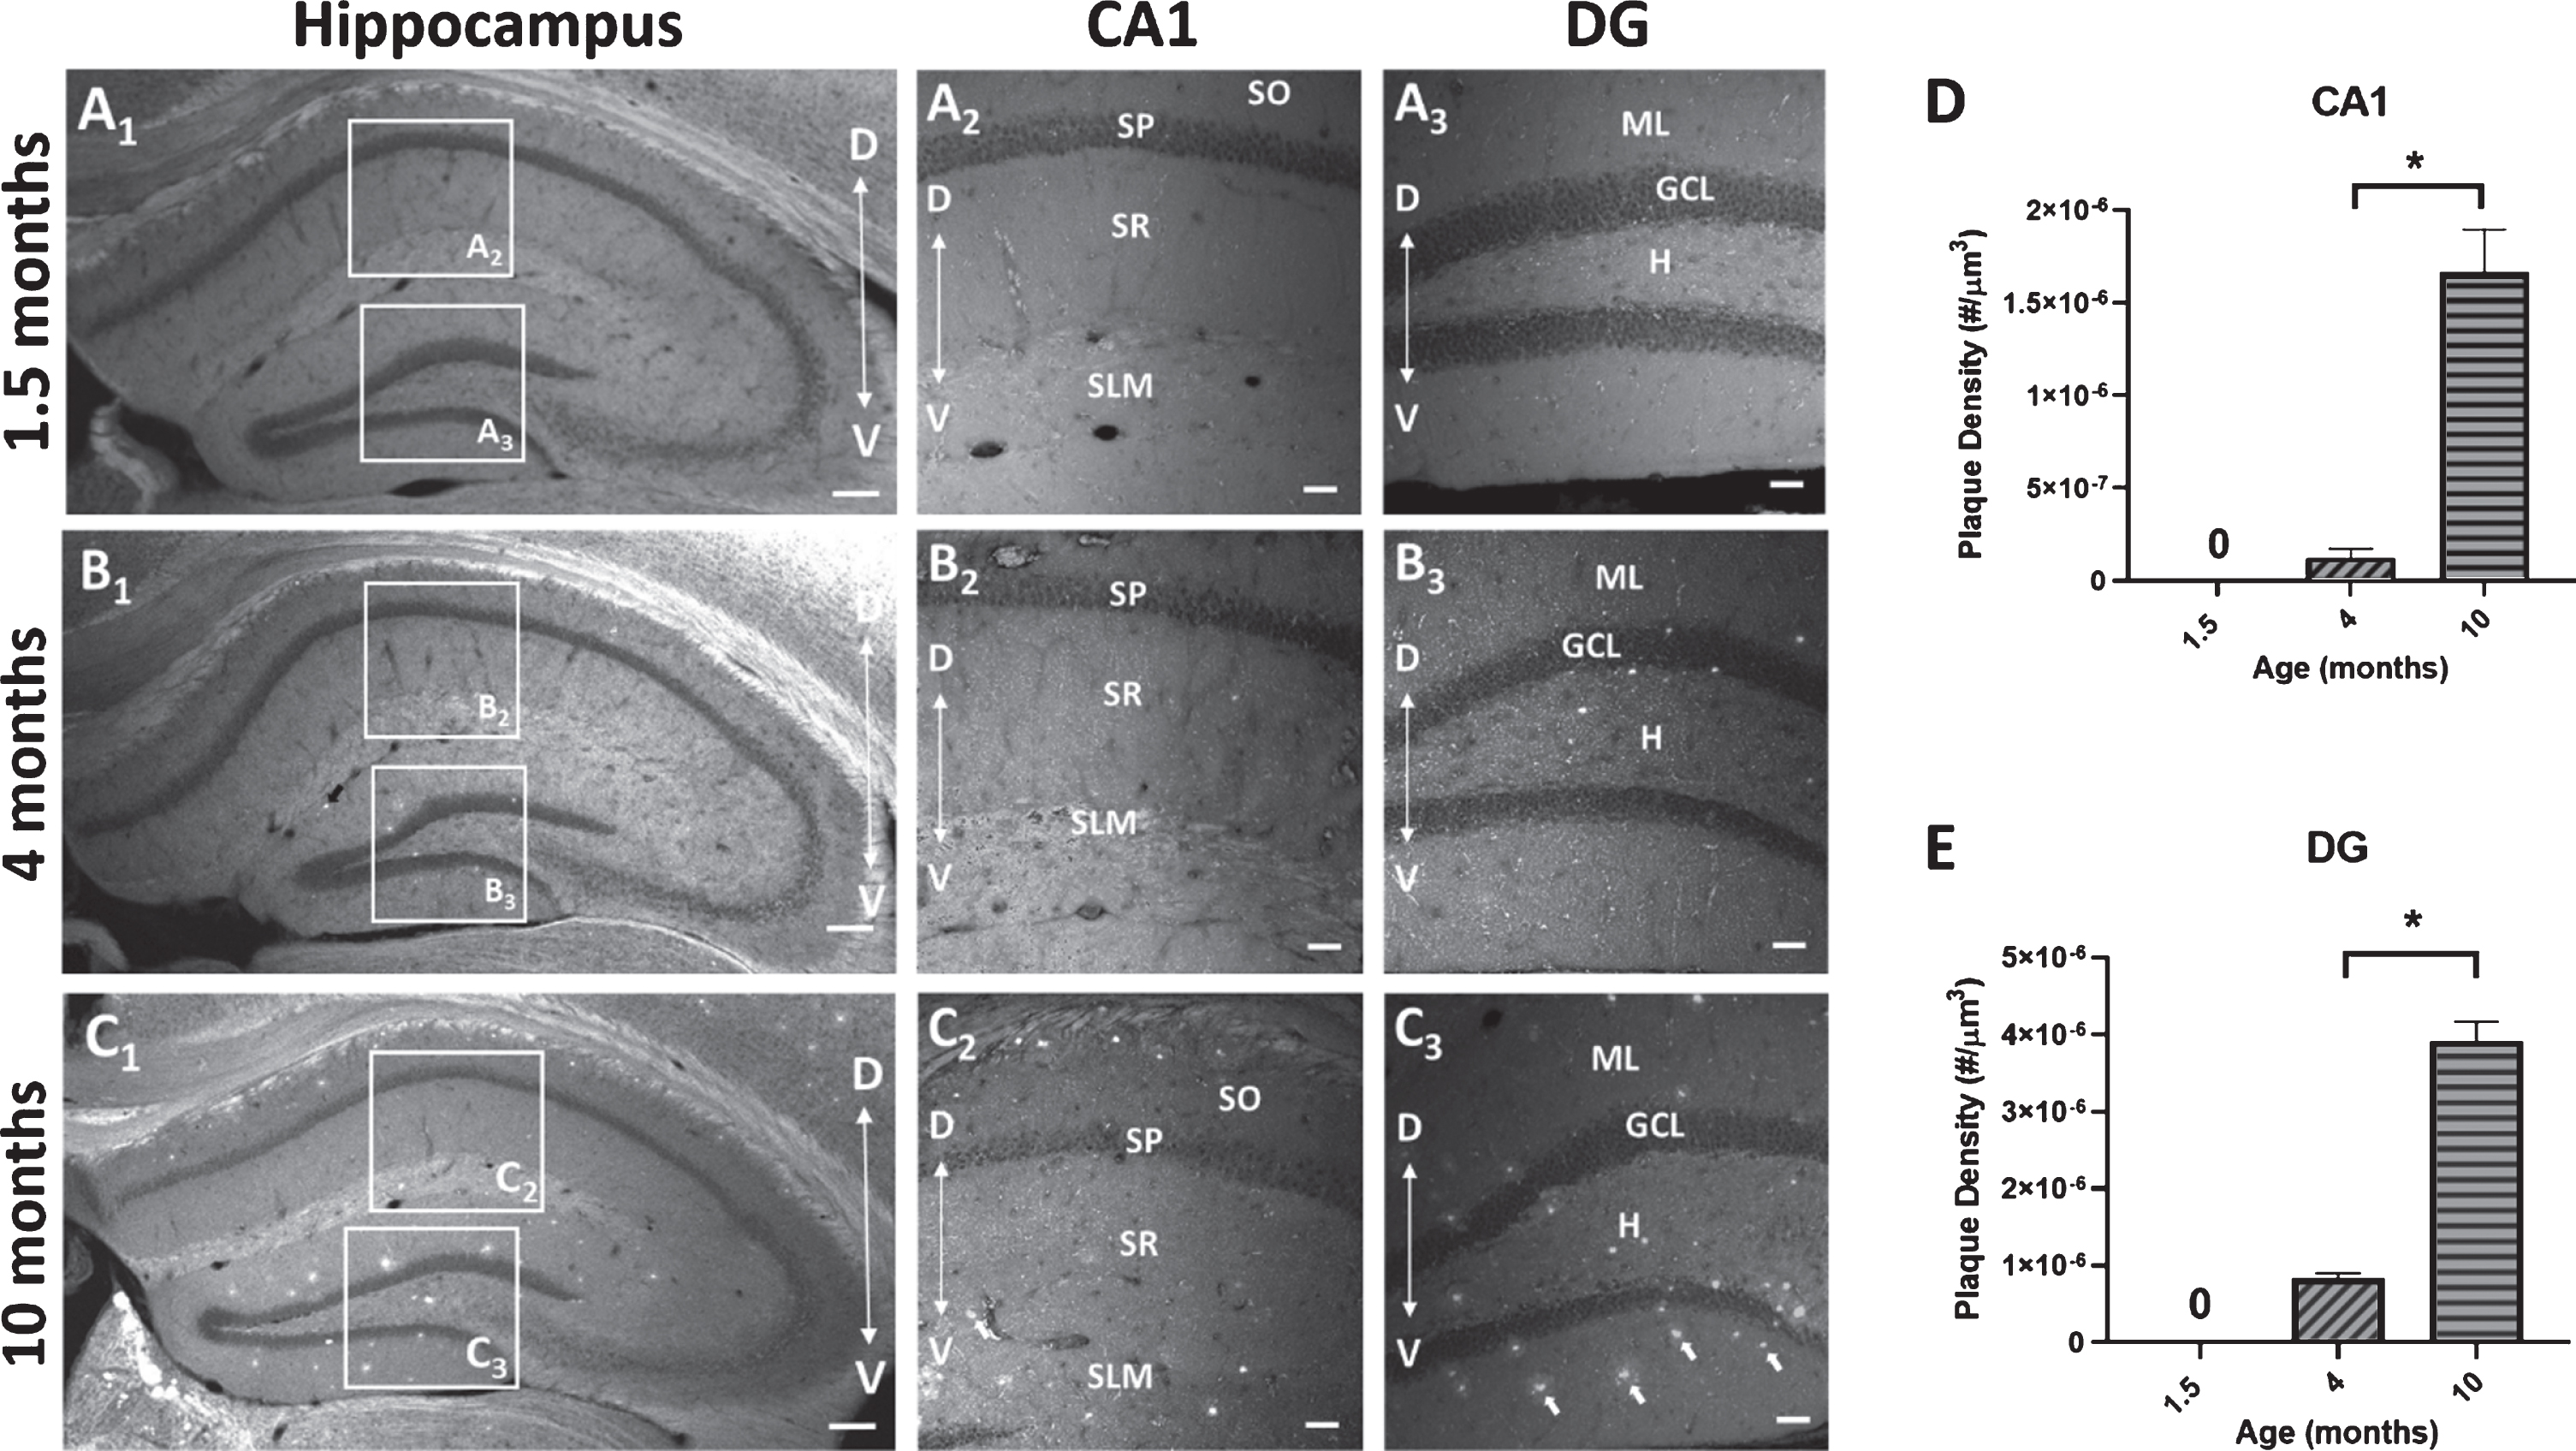
To measure the deposition of Aβ plaques with age, sections from 5×FAD mice at 3 time points (1.5, 4, and 10 months) were stained with BTA-1 and imaged using confocal microscopy. The plaques density (# of plaques/μm3) within two hippocampal regions (CA1 and DG) was quantified (Fig. 7). The results show a significant increase in plaque density in the 10-month mice compared to the 4-month mice in both the CA1 region (p < 0.0001; unpaired t-test) and DG (p < 0.0001; unpaired t-test). These data show an age-dependent progressive increase in Aβ plaque deposition in both the CA1 region and DG.
Fig. 7
Amyloid-β (Aβ) plaque deposits in the hippocampus of 5×FAD mice. Coronal sections (40μm) of the dorsal hippocampus (AP, -2.0 bregma) from 1.5, 4, and 10-month-old 5×FAD mice were stained with the amyloid imaging agent BTA-1. A1-C1) Representative images of the hippocampus of 5×FAD mice demonstrating the observed age-dependent increase in Aβ plaque accumulation and the regions of interest (ROI) in CA1 and dentate gyrus (DG) that were used to quantify Aβ plaque density. A2,3-C2,3) Representative maximum intensity projection images (20× air; 635μm×635μm×15μm, Δz = 5μm) of Aβ plaque deposits in CA1 and DG from 1.5, 4, and 10-month-old 5×FAD mice. Arrows in panel C3 point to BTA-1 stained Aβ plaques. D, E) Aβ plaque density (plaque #/μm3) was quantified in the CA1 region and DG from 20× images using the Analyze Particles plug-in in FIJI. Significant differences in Aβ plaque density were found between 4-month-old and 10-month-old 5×FAD mice. Analysis of the 1.5-month-old mice were not included because no plaques were observed. Hippocampal layers; CA1: stratum oriens (SO), stratum pyramidale (SP), stratum radiatum (SR), stratum lacunosum-moleculare (SLM) and DG: molecular layer (ML), granule cell layer (GCL) and the hilus (H). Scale bar: 4× images = 200μm, 20× images = 50μm. Asterisks (*) represent significance determined by a 2-tailed unpaired t-test with p < 0.05. Dorsal (D) ← →Ventral (V).
DISCUSSION
This study examined the relationship between neuronal calcium-mediated variables and aging in 5×FAD mice on a C57BL/6 genetic background. We conducted this series of experiments using electrophysiological and imaging techniques to report on changes in calcium measures in brain aging. These experiments were conducted to test the hypothesis that, contrary to what is seen in normal aging, measures of calcium-mediated processes are reduced in the 5×FAD transgenic model of amyloidogenesis. We based this on prior reports showing that L-VGCC density and the AHP are reduced in two different models of AD [68, 69]. In the current study, we show that changes in calcium-mediated potentials and levels were identified across early age, sex, and genotype. Briefly, reductions in calcium-mediated processes appear to be more robust in females compared to males in this animal model of AD (Fig. 4). While surprising, these results underscore a significant lack of alignment between normal aging processes and those initiated in pathological aging, suggesting that not only is AD not an accelerated form of aging, but that when considering calcium dysregulation, these processes may actually diverge. Here, several discrepancies from the canonical calcium hypothesis of brain aging and dementia were noted, including 1) the presence of a reduced AHP at 4 months compared to 1.5 and 10 months, 2) the presence of significant reductions in OGB-1 fluorescence (peak amplitude and AUC) in females irrespective of genotype, and 3) reduced resting fluorescence in 5×FAD mice compared to WT.
Onset of calcium dysregulation
The amyloidogenic 5×FAD model mimics human AD at an accelerated pace and presents with amyloid deposition by 1.5 to 2 months, cognitive deficits and synaptic impairment by 4 months, and neuronal loss by 6 months of age [74]. While this transgenic design is extremely well-suited for studies of specific phenotypes (e.g., Aβ deposition, behavior, calcium dysregulation, oxidative stress), the aging component is seldom considered in the experimental design, likely due to the reduced lifespan of these animals. Using 5×FAD mice on a C57BL/6 genetic background, we sought to incorporate components of aging within the context of AD. Compared to the original report [74], 5×FAD mice on a C57BL/6 genetic background presents with behavioral deficits starting at 10 months versus 3 months of age (Fig. 6). With respect to the aging effect identified, our results are surprising, as a significant reduction in the AHP at 4 months of age (Fig. 1) was combined with an increase in excitability (Fig. 2) and a lack of change in short-term synaptic plasticity (Fig. 3) or OGB-1 fluorescence (Fig. 4). It should be noted, however, that relatively similar results in response to age were previously reported in the F344 rat model of aging, where calcium dysregulation (measured through either the AHP or calcium levels) did not manifest until 12 months of age [83]. One limitation of our study may be that we did not investigate animals at later time points. Also, very few prior studies have investigated the calcium-dependent AHP at 1.5 months of age ex vivo (i.e., slices), suggesting more analyses around this age are warranted [63]. The “U” shape curve (a reduction at 4 months) presented in Fig. 1 is reminiscent of prior work in the retina measuring L-VGCC calcium flux in vivo using manganese-en-hanced MRI [84–86]. In disease models with progression of the neurodegenerative events ranging from days to weeks and months (ischemic reperfusion, retinitis pigmentosa, or even diabetes, respectively), Berkowitz and colleagues find significant prodromal reductions in calcium influx in response to initial stressors; over time, manganese uptake/ L-type calcium channel function appears to return to seemingly normal levels. Whether our “U” shape curve reflects on a combination of developmental/maturation processes or aging changes, or on initially competent calcium handling processes that ultimately fail at latter stages, requires further investigations.
Based on the increase in the Aβ load (Fig. 7) and the time course of progression, it seems clear that calcium dysregulation does not parallel Aβ in-creases. Our current results cannot confirm that amyloid deposits in the dorsal hippocampus alter either neuronal physiology or calcium kinetics; however, independent of age, a reduction in resting calcium fluorescence was seen in the 5×FAD compared to the WT (Fig. 5). Therefore, in this model, no evidence of enhanced calcium dysregulation was seen using sharp electrode recording techniques, and instead, possible reductions in calcium processes were noted.
Differences in techniques
Two prior studies have investigated differences between sharp electrode recording techniques and whole-cell recordings using patch electrodes [87, 88]. Aside from clear differences in recording stability and duration (AHPs can be recorded for hours in the same cell under sharp electrode conditions), input resistance and leak conductance, and the use of supplemented nucleotides, calcium buffers, and potassium salts, it is clear that under whole-cell re-cording conditions, a large amount of APs are needed to elicit a significant AHP [55, 63, 66, 88, 89]. Here, as previously reported in numerous studies of aging, we quantified the AHP following a series of 4 APs and observed that the calcium-dependent potentials were smaller than those recorded from rat neurons [12, 90]. Typically, the mAHP amplitude in young mice is approximately ∼1.4 mV [68, 69], while the AHP (recorded with the same number of APs) from rat neurons is ∼2.8 mV [68, 71, 83, 91]. This difference in technique is important when comparing measures of calcium biomarkers across animal models of aging and AD and may underlie the current novel results while using sharp electrode physiology. Nevertheless, this does not necessarily negate previous work using calcium imaging techniques in combination with patch-clamp electrophysiology, where several underlying mechanisms have been identified in the context of aging and AD [23, 51, 53–55, 58, 59, 61, 63, 64, 92, 93]. In fact, recent studies have presented compelling evidence that calcium-dependent neuronal measures of hyperactivity are present in the amyloidogenic brain.
Alternative calcium-dependent biomarkers in AD: hyperactivity
Several recent studies show that a new calcium-dependent biomarker of AD, previously unseen in in vitro studies, may be neuronal hyperactivity. Using in vivo multiphoton imaging, these studies have shown that, depending on the proximity to Aβ plaques, a significant increase in hyperactivity in several neuronal fields in the amyloidogenic brain is seen [24, 94–99]. Moreover, hyperactivity in astrocytes adjacent to Aβ plaques has also been reported [100, 101], in some cases with concomitant increases in spontaneous vasoconstriction [102]. One suggested mechanism for increased neuronal hyperactivity in AD may be the reduction in glutamate reuptake via a reduction of glutamate transporters in the microenvironments surrounding Aβ plaques [96, 99]. Alternatively, this hyperexcitability could develop in response to failing Ca2 + buffering mechanisms, similar to those seen in basal forebrain neurons in aged animals [103–105]. Together, these alterations highlight the presence of increased hyperactivity in neuronal circuits of AD which would likely translate into altered network communication during encoding.
As one may suspect, this increase in hyperexcitability could reflect on the presence of an epi-leptic-like phenotype in some models of AD [106–111]. Age-dependent susceptibility to epilepsy has been well documented in the literature, with marked increases of epilepsy development reported in the elderly [112–116]. Epilepsy has long been characterized as a disease of neuronal hyperexcitability and abnormal firing with dysregulated calcium as a key contributor [117–123]. It is becoming evident that there is clear overlap between the profiles of these two diseases. A recent study performed in a rat model of epileptogenesis used bioinformatics to identify regulatory proteins in the hippocampal and parahippocampal brain regions that overlap in AD and epilepsy [25]. Among the shared dysregulated proteins of these diseases, 63 were identified to be involved with both mitochondrial function and calcium homeostasis. At the least, these alterations certainly highlight AD as a disease of synaptic dysfunction that propagates intracellular dysregulation. Thus, it is clear that further characterization of this novel calcium-dependent biomarker of AD is needed.
While previous work in the field of neuronal ex-citability in aging has mostly remarked on reduced synaptic excitability, especially with respect to the larger AHP, but also reduced synaptic connectivity [12, 55, 66, 124–128], our results showing an age-dependent reduction in the AHP (at 4 months), eleva-tions in I/O slope, and reductions in resting calcium align relatively well with a potential phenotype of hyperexcitability. As expected, reductions in calcium and calcium-mediated cellular events (i.e., AHP) seem likely to engage hyperactivity processes, increase network communication, and, perhaps, reduce the threshold for epileptogenesis in this animal model of AD.
Conclusions
While our study does not identify increases in calcium dysregulation in the 5×FAD animals compared to WT littermates across age, it does highlight the possibility that calcium-related processes in aging may be significantly different than those seen in AD. Further, studies investigating older animals (i.e., >12 months of age) are needed to test whether Aβ accumulation induces calcium dysregulation. It appears that neuronal hyperactivity may be a reliable reporter of calcium dysregulation in AD; as such, further in vivo investigations are needed to identify new therapeutic strategies targeting anti-epileptic processes. In fact, both basic research studies and clinical trials have already been initiated to explore the efficacy of anti-epileptic drugs in the context of AD, with potentially promising results having been reported [129–135]. Additional investigations will be needed as we further elucidate the precipitating factors involved with these two disease states.
ACKNOWLEDGMENTS
This work was supported by NIH grants R01AG058171 and T32AG057461.
Authors’ disclosures available online (https://www.j-alz.com/manuscript-disclosures/20-0109r1).
REFERENCES
[1] | Alzheimer’s Association ((2016) ) 2016 Alzheimer’s disease facts and figures. Alzheimers Dement 12: , 459–509. |
[2] | Mandelkow EM , Mandelkow E ((1993) ) Tau as a marker for Alzheimer’s disease. Trends Biochem Sci 18: , 480–483. |
[3] | Lassmann H , Fischer P , Jellinger K ((1993) ) Synaptic pathology of Alzheimer’s disease. Ann N Y Acad Sci 695: , 59–64. |
[4] | De-Paula VJ , Radanovic M , Diniz BS , Forlenza OV ((2012) ) Alzheimer’s disease. Subcell Biochem 65: , 329–352. |
[5] | Takeda S ((2019) ) Progression of Alzheimer’s disease, tau propagation, and its modifiable risk factors. Neurosci Res 141: , 36–42. |
[6] | Arranz AM , De Strooper B ((2019) ) The role of astroglia in Alzheimer’s disease: Pathophysiology and clinical implications. Lancet Neurol 18: , 406–414. |
[7] | Long JM , Holtzman DM ((2019) ) Alzheimer disease: An update on pathobiology and treatment strategies. Cell 179: , 312–339. |
[8] | Mattson MP , Arumugam TV ((2018) ) Hallmarks of brain aging: Adaptive and pathological modification by met-abolic states. Cell Metab 27: , 1176–1199. |
[9] | Landfield PW , Thibault O , Mazzanti ML , Porter NM , Kerr DS ((1992) ) Mechanisms of neuronal death in brain aging and Alzheimer’s disease: Role of endocrine-mediated calcium dyshomeostasis. J Neurobiol 23: , 1247–1260. |
[10] | Kerr DS , Campbell LW , Thibault O , Landfield PW ((1992) ) Hippocampal glucocorticoid receptor activation enhances voltage-dependent Ca2+conductances: Relevance to brain aging. Proc Natl Acad Sci U S A 89: , 8527–8531. |
[11] | Landfield PW ((1987) ) ‘Increased calcium-current’ hypothesis of brain aging. Neurobiol Aging 8: , 346–347. |
[12] | Landfield PW , Pitler TA ((1984) ) Prolonged Ca2+-dependent afterhyperpolarizations in hippocampal neurons of aged rats. Science 226: , 1089–1092. |
[13] | Khachaturian ZS ((1994) ) Calcium hypothesis of Alzhei-mer’s disease and brain aging. Ann N Y Acad Sci 747: , 1–11. |
[14] | Khachaturian ZS ((1989) ) Calcium, membranes, aging, and Alzheimer’s disease. Introduction and overview. Ann N Y Acad Sci 568: , 1–4. |
[15] | Khachaturian ZS ((1987) ) Hypothesis on the regulation of cytosol calcium concentration and the aging brain. Neurobiol Aging 8: , 345–346. |
[16] | Murchison D , McDermott AN , Lasarge CL , Peebles KA , Bizon JL , Griffith WH ((2009) ) Enhanced calcium buffering in F344 rat cholinergic basal forebrain neurons is associated with age-related cognitive impairment. J Neurophysiol 102: , 2194–2207. |
[17] | Bertoni-Freddari C , Meier-Ruge W , Ulrich J ((1988) ) Quantitative morphology of synaptic plasticity in the aging brain. Scanning Microsc 2: , 1027–1034. |
[18] | Barnes CA , Rao G , Foster TC , McNaughton BL ((1992) ) Region-specific age effects on AMPA sensitivity: Electrophysiological evidence for loss of synaptic contacts in hippocampal field CA1. Hippocampus 2: , 457–468. |
[19] | Foster TC , Norris CM ((1997) ) Age-associated changes in Ca(2+)-dependent processes: Relation to hippocampal synaptic plasticity. Hippocampus 7: , 602–612. |
[20] | McEwen BS , Woolley CS ((1994) ) Estradiol and pro-gesterone regulate neuronal structure and synaptic connectivity in adult as well as developing brain. Exp Gerontol 29: , 431–436. |
[21] | Koffie RM , Hyman BT , Spires-Jones TL ((2011) ) Al-zheimer’s disease: Synapses gone cold. Mol Neurodegener 6: , 63. |
[22] | Spires TL , Meyer-Luehmann M , Stern EA , McLean PJ , Skoch J , Nguyen PT , Bacskai BJ , Hyman BT ((2005) ) Dendritic spine abnormalities in amyloid precursor protein transgenic mice demonstrated by gene transfer and intravital multiphoton microscopy. J Neurosci 25: , 7278–7287. |
[23] | Popugaeva E , Chernyuk D , Zhang H , Postnikova TY , Pats K , Fedorova E , Poroikov V , Zaitsev AV , Bezprozvanny I ((2019) ) Derivatives of piperazines as potential therapeutic agents for Alzheimer’s disease. Mol Pharmacol 95: , 337–348. |
[24] | Busche MA , Chen X , Henning HA , Reichwald J , Staufenbiel M , Sakmann B , Konnerth A ((2012) ) Critical role of soluble amyloid-beta for early hippocampal hyperactivity in a mouse model of Alzheimer’s disease. Proc Natl Acad Sci U S A 109: , 8740–8745. |
[25] | von Ruden EL , Zellinger C , Gedon J , Walker A , Bierling V , Deeg CA , Hauck SM , Potschka H ((2020) ) Regulation of Alzheimer’s disease-associated proteins during the course of epileptogenesis: Differential proteomic analysis in a rat model. Neuroscience 424: , 102–120. |
[26] | Busche MA , Konnerth A ((2015) ) Neuronal hyperactivity–A key defect in Alzheimer’s disease?. Bioessays 37: , 624–632. |
[27] | Rodriguez JJ , Verkhratsky A ((2011) ) Neurogenesis in Alzheimer’s disease. J Anat 219: , 78–89. |
[28] | Santos SF , Pierrot N , Octave JN ((2010) ) Network excitability dysfunction in Alzheimer’s disease: Insights from in vitro and in vivo models. Rev Neurosci 21: , 153–171. |
[29] | Crews L , Masliah E ((2010) ) Molecular mechanisms of neurodegeneration in Alzheimer’s disease. Hum Mol Genet 19: , R12–20. |
[30] | Ondrejcak T , Klyubin I , Hu NW , Barry AE , Cullen WK , Rowan MJ ((2010) ) Alzheimer’s disease amyloid beta-protein and synaptic function. Neuromolecular Med 12: , 13–26. |
[31] | Lamour Y , Bassant MH , Potier B , Billard JM , Dutar P ((1994) ) [Aging of memory mechanisms]. C R Seances Soc Biol Fil 188: , 469–486. |
[32] | Rowan MJ , Klyubin I , Cullen WK , Anwyl R ((2003) ) Synaptic plasticity in animal models of early Alzheimer’s disease. Philos Trans R Soc Lond B Biol Sci 358: , 821–828. |
[33] | Honer WG ((2003) ) Pathology of presynaptic proteins in Alzheimer’s disease: More than simple loss of terminals. Neurobiol Aging 24: , 1047–1062. |
[34] | Sun S , Zhang H , Liu J , Popugaeva E , Xu NJ , Feske S , White CL 3rd , Bezprozvanny I ((2014) ) Reduced synaptic STIM2 expression and impaired store-operated calcium entry cause destabilization of mature spines in mutant presenilin mice. Neuron 82: , 79–93. |
[35] | Selkoe DJ ((2008) ) Soluble oligomers of the amyloid beta-protein impair synaptic plasticity and behavior. Behav Brain Res 192: , 106–113. |
[36] | Selkoe DJ ((2002) ) Alzheimer’s disease is a synaptic failure. Science 298: , 789–791. |
[37] | Magi S , Castaldo P , Macri ML , Maiolino M , Matteucci A , Bastioli G , Gratteri S , Amoroso S , Lariccia V ((2016) ) Intracellular calcium dysregulation: Implications for Alzheimer’s disease. Biomed Res Int 2016: , 6701324. |
[38] | Supnet C , Bezprozvanny I ((2010) ) The dysregulation of intracellular calcium in Alzheimer disease. Cell Calcium 47: , 183–189. |
[39] | Hermes M , Eichhoff G , Garaschuk O ((2010) ) Intracellular calcium signalling in Alzheimer’s disease. J Cell Mol Med 14: , 30–41. |
[40] | Bojarski L , Herms J , Kuznicki J ((2008) ) Calcium dysregulation in Alzheimer’s disease. Neurochem Int 52: , 621–633. |
[41] | Thibault O , Gant JC , Landfield PW ((2007) ) Expansion of the calcium hypothesis of brain aging and Alzheimer’s disease: Minding the store. Aging Cell 6: , 307–317. |
[42] | LaFerla FM ((2002) ) Calcium dyshomeostasis and intracellular signalling in Alzheimer’s disease. Nat Rev Neurosci 3: , 862–872. |
[43] | Chakroborty S , Stutzmann GE ((2011) ) Early calcium dysregulation in Alzheimer’s disease: Setting the stage for synaptic dysfunction. Sci China Life Sci 54: , 752–762. |
[44] | Popugaeva E , Pchitskaya E , Bezprozvanny I ((2017) ) Dy-sregulation of neuronal calcium homeostasis in Alzhe-imer’s disease - A therapeutic opportunity?. Biochem Biophys Res Commun 483: , 998–1004. |
[45] | Mattson MP , Chan SL ((2003) ) Neuronal and glial cal-cium signaling in Alzheimer’s disease. Cell Calcium 34: , 385–397. |
[46] | Lopez JR , Lyckman A , Oddo S , Laferla FM , Querfurth HW , Shtifman A ((2008) ) Increased intraneuronal resting [Ca2+] in adult Alzheimer’s disease mice. J Neurochem 105: , 262–271. |
[47] | Peterson C , Gibson GE , Blass JP ((1985) ) Altered calcium uptake in cultured skin fibroblasts from patients with Alzheimer’s disease. N Engl J Med 312: , 1063–1065. |
[48] | Saito K , Elce JS , Hamos JE , Nixon RA ((1993) ) Widespread activation of calcium-activated neutral proteinase (calpain) in the brain in Alzheimer disease: A potential molecular basis for neuronal degeneration. Proc Natl Acad Sci U S A 90: , 2628–2632. |
[49] | Etcheberrigaray R , Hirashima N , Nee L , Prince J , Govoni S , Racchi M , Tanzi RE , Alkon DL ((1998) ) Calcium responses in fibroblasts from asymptomatic members of Alzheimer’s disease families. Neurobiol Dis 5: , 37–45. |
[50] | Bruno AM , Huang JY , Bennett DA , Marr RA , Hastings ML , Stutzmann GE ((2012) ) Altered ryanodine receptor expression in mild cognitive impairment and Alzheimer’s disease. Neurobiol Aging 33: , 1001 e1001–1006. |
[51] | Chakroborty S , Hill ES , Christian DT , Helfrich R , Riley S , Schneider C , Kapecki N , Mustaly-Kalimi S , Seiler FA , Peterson DA , West AR , Vertel BM , Frost WN , Stutzmann GE ((2019) ) Reduced presynaptic vesicle stores mediate cellular and network plasticity defects in an early-stage mouse model of Alzheimer’s disease. Mol Neurodegener 14: , 7. |
[52] | Chakroborty S , Kim J , Schneider C , West AR , Stutzmann GE ((2015) ) Nitric oxide signaling is recruited as a compensatory mechanism for sustaining synaptic plasticity in Alzheimer’s disease mice. J Neurosci 35: , 6893–6902. |
[53] | Goussakov I , Chakroborty S , Stutzmann GE ((2011) ) Generation of dendritic Ca2+oscillations as a consequence of altered ryanodine receptor function in AD neurons. Channels (Austin) 5: , 9–13. |
[54] | Goussakov I , Miller MB , Stutzmann GE ((2010) ) NMDA-mediated Ca(2+) influx drives aberrant ryanodine receptor activation in dendrites of young Alzheimer’s disease mice. J Neurosci 30: , 12128–12137. |
[55] | Kaczorowski CC , Sametsky E , Shah S , Vassar R , Disterhoft JF ((2011) ) Mechanisms underlying basal and learning-related intrinsic excitability in a mouse model of Alzheimer’s disease. Neurobiol Aging 32: , 1452–1465. |
[56] | Liu J , Supnet C , Sun S , Zhang H , Good L , Popugaeva E , Bezprozvanny I ((2014) ) The role of ryanodine receptor type 3 in a mouse model of Alzheimer disease. Channels (Austin) 8: , 230–242. |
[57] | Overk CR , Rockenstein E , Florio J , Cheng Q , Masliah E ((2015) ) Differential calcium alterations in animal models of neurodegenerative disease: Reversal by FK506. Neuroscience 310: , 549–560. |
[58] | Shilling D , Muller M , Takano H , Mak DO , Abel T , Coulter DA , Foskett JK ((2014) ) Suppression of InsP3 receptor-mediated Ca2+signaling alleviates mutant pre-senilin-linked familial Alzheimer’s disease pathogenesis. J Neurosci 34: , 6910–6923. |
[59] | Stutzmann GE , Caccamo A , LaFerla FM , Parker I ((2004) ) Dysregulated IP3 signaling in cortical neurons of knock-in mice expressing an Alzheimer’s-linked mutation in presenilin1 results in exaggerated Ca2+signals and altered membrane excitability. J Neurosci 24: , 508–513. |
[60] | Tsigelny IF , Crews L , Desplats P , Shaked GM , Sharikov Y , Mizuno H , Spencer B , Rockenstein E , Trejo M , Platoshyn O , Yuan JX , Masliah E ((2008) ) Mechanisms of hybrid oligomer formation in the pathogenesis of combined Alzheimer’s and Parkinson’s diseases. PLoS One 3: , e3135. |
[61] | Zhang H , Liu J , Sun S , Pchitskaya E , Popugaeva E , Bezprozvanny I ((2015) ) Calcium signaling, excitability, and synaptic plasticity defects in a mouse model of Alzheimer’s disease. J Alzheimers Dis 45: , 561–580. |
[62] | Zhang H , Sun S , Herreman A , De Strooper B , Bezprozvanny I ((2010) ) Role of presenilins in neuronal calcium homeostasis. J Neurosci 30: , 8566–8580. |
[63] | Stutzmann GE , Smith I , Caccamo A , Oddo S , Laferla FM , Parker I ((2006) ) Enhanced ryanodine receptor recruitment contributes to Ca2+disruptions in young, adult, and aged Alzheimer’s disease mice. J Neurosci 26: , 5180–5189. |
[64] | Wang Y , Mattson MP ((2014) ) L-type Ca2+currents at CA1 synapses, but not CA3 or dentate granule neuron synapses, are increased in 3×TgAD mice in an age-dependent manner. Neurobiol Aging 35: , 88–95. |
[65] | Thibault O , Mazzanti ML , Blalock EM , Porter NM , Landfield PW ((1995) ) Single-channel and whole-cell studies of calcium currents in young and aged rat hippocampal slice neurons. J Neurosci Methods 59: , 77–83. |
[66] | Disterhoft JF , Thompson LT , Moyer JR Jr. , Mogul DJ ((1996) ) Calcium-dependent afterhyperpolarization and learning in young and aging hippocampus. Life Sci 59: , 413–420. |
[67] | Thibault O , Landfield PW ((1996) ) Increase in single L-type calcium channels in hippocampal neurons during aging. Science 272: , 1017–1020. |
[68] | Thibault O , Pancani T , Landfield PW , Norris CM ((2012) ) Reduction in neuronal L-type calcium channel activity in a double knock-in mouse model of Alzheimer’s disease. Biochim Biophys Acta 1822: , 546–549. |
[69] | Berkowitz BA , Lenning J , Khetarpal N , Tran C , Wu JY , Berri AM , Dernay K , Haacke EM , Shafie-Khorassani F , Podolsky RH , Gant JC , Maimaiti S , Thibault O , Murphy GG , Bennett BM , Roberts R ((2017) ) In vivo imaging of prodromal hippocampus CA1 subfield oxidative stress in models of Alzheimer disease and Angelman syndrome. FASEB J 31: , 4179–4186. |
[70] | Disterhoft JF , Coulter DA , Alkon DL ((1986) ) Condi-tioning-specific membrane changes of rabbit hippocampal neurons measured in vitro. Proc Natl Acad Sci U S A 83: , 2733–2737. |
[71] | Gant JC , Thibault O ((2009) ) Action potential throughput in aged rat hippocampal neurons: Regulation by selective forms of hyperpolarization. Neurobiol Aging 30: , 2053–2064. |
[72] | Neuner SM , Heuer SE , Huentelman MJ , O’Connell KMS , Kaczorowski CC ((2019) ) Harnessing genetic complexity to enhance translatability of Alzheimer’s disease mouse models: A path toward precision medicine. Neuron 101: , 399–411 e395. |
[73] | Richard BC , Kurdakova A , Baches S , Bayer TA , Weggen S , Wirths O ((2015) ) Gene dosage dependent aggravation of the neurological phenotype in the 5XFAD mouse model of Alzheimer’s disease. J Alzheimers Dis 45: , 1223–1236. |
[74] | Oakley H , Cole SL , Logan S , Maus E , Shao P , Craft J , Guillozet-Bongaarts A , Ohno M , Disterhoft J , Van Eldik L , Berry R , Vassar R ((2006) ) Intraneuronal beta-amyloid aggregates, neurodegeneration, and neuron loss in transgenic mice with five familial Alzheimer’s disease mutations: Potential factors in amyloid plaque formation. J Neurosci 26: , 10129–10140. |
[75] | McKinney BC , Murphy GG ((2006) ) The L-Type voltage-gated calcium channel Cav1.3 mediates consolidation, but not extinction, of contextually conditioned fear in mice. Learn Mem 13: , 584–589. |
[76] | Temme SJ , Bell RZ , Fisher GL , Murphy GG ((2016) ) Deletion of the mouse homolog of CACNA1C disrupts discrete forms of hippocampal-dependent memory and neurogenesis within the dentate gyrus. eNeuro 3: , ENEURO.0118-16.2016. |
[77] | White JA , McKinney BC , John MC , Powers PA , Kamp TJ , Murphy GG ((2008) ) Conditional forebrain deletion of the L-type calcium channel Ca V 1.2 disrupts remote spatial memories in mice. Learn Mem 15: , 1–5. |
[78] | Froc DJ , Eadie B , Li AM , Wodtke K , Tse M , Christie BR ((2003) ) Reduced synaptic plasticity in the lateral perforant path input to the dentate gyrus of aged C57BL/6 mice. J Neurophysiol 90: , 32–38. |
[79] | Landfield PW , Lynch G ((1977) ) Impaired monosynaptic potentiation in in vitro hippocampal slices from aged, memory-deficient rats. J Gerontol 32: , 523–533. |
[80] | Landfield PW , McGaugh JL , Lynch G ((1978) ) Impaired synaptic potentiation processes in the hippocampus of aged, memory-deficient rats. Brain Res 150: , 85–101. |
[81] | Landfield PW , Pitler TA , Applegate MD ((1986) ) The effects of high Mg2+-to-Ca2+ratios on frequency potentiation in hippocampal slices of young and aged rats. J Neurophysiol 56: , 797–811. |
[82] | Morris R ((1984) ) Developments of a water-maze procedure for studying spatial learning in the rat. J Neurosci Methods 11: , 47–60. |
[83] | Gant JC , Sama MM , Landfield PW , Thibault O ((2006) ) Early and simultaneous emergence of multiple hippocampal biomarkers of aging is mediated by Ca2+-induced Ca2+release. J Neurosci 26: , 3482–3490. |
[84] | Berkowitz BA , Gradianu M , Bissig D , Kern TS , Roberts R ((2009) ) Retinal ion regulation in a mouse model of diabetic retinopathy: Natural history and the effect of Cu/Zn superoxide dismutase overexpression. Invest Ophthalmol Vis Sci 50: , 2351–2358. |
[85] | Berkowitz BA , Gradianu M , Schafer S , Jin Y , Porchia A , Iezzi R , Roberts R ((2008) ) Ionic dysregulatory phenotyping of pathologic retinal thinning with manganese-enhanced MRI. Invest Ophthalmol Vis Sci 49: , 3178–3184. |
[86] | Berkowitz BA , Bissig D , Dutczak O , Corbett S , North R , Roberts R ((2013) ) MRI biomarkers for evaluation of treatment efficacy in preclinical diabetic retinopathy. Expert Opin Med Diagn 7: , 393–403. |
[87] | Staley KJ , Otis TS , Mody I ((1992) ) Membrane properties of dentate gyrus granule cells: Comparison of sharp microelectrode and whole-cell recordings. J Neurophysiol 67: , 1346–1358. |
[88] | Zhang L , Weiner JL , Valiante TA , Velumian AA , Watson PL , Jahromi SS , Schertzer S , Pennefather P , Carlen PL ((1994) ) Whole-cell recording of the Ca(2+)-dependent slow afterhyperpolarization in hippocampal neurones: Effects of internally applied anions. Pflugers Arch 426: , 247–253. |
[89] | Oh MM , McKay BM , Power JM , Disterhoft JF ((2009) ) Learning-related postburst afterhyperpolarization reduction in CA1 pyramidal neurons is mediated by protein kinase A. Proc Natl Acad Sci U S A 106: , 1620–1625. |
[90] | Kerr DS , Campbell LW , Hao SY , Landfield PW ((1989) ) Corticosteroid modulation of hippocampal potentials: Increased effect with aging. Science 245: , 1505–1509. |
[91] | Blalock EM , Phelps JT , Pancani T , Searcy JL , Anderson KL , Gant JC , Popovic J , Avdiushko MG , Cohen DA , Chen KC , Porter NM , Thibault O ((2010) ) Effects of long-term pioglitazone treatment on peripheral and central markers of aging. PLoS One 5: , e10405. |
[92] | Han SH , Murchison D , Griffith WH ((2005) ) Low voltage-activated calcium and fast tetrodotoxin-resistant sodium currents define subtypes of cholinergic and noncholinergic neurons in rat basal forebrain. Brain Res Mol Brain Res 134: , 226–238. |
[93] | Murchison D , Griffith WH ((1996) ) High-voltage-activated calcium currents in basal forebrain neurons during aging. J Neurophysiol 76: , 158–174. |
[94] | Busche MA , Eichhoff G , Adelsberger H , Abramowski D , Wiederhold KH , Haass C , Staufenbiel M , Konnerth A , Garaschuk O ((2008) ) Clusters of hyperactive neurons near amyloid plaques in a mouse model of Alzheimer’s disease. Science 321: , 1686–1689. |
[95] | Busche MA ((2018) ) In vivo two-photon calcium imaging of hippocampal neurons in Alzheimer mouse models. Methods Mol Biol 1750: , 341–351. |
[96] | Hefendehl JK , LeDue J , Ko RW , Mahler J , Murphy TH , MacVicar BA ((2016) ) Mapping synaptic glutamate transporter dysfunction in vivo to regions surrounding Abeta plaques by iGluSnFR two-photon imaging. Nat Commun 7: , 13441. |
[97] | Liebscher S , Keller GB , Goltstein PM , Bonhoeffer T , Hubener M ((2016) ) Selective Persistence of sensorimotor mismatch signals in visual cortex of behaving Alzheimer’s disease mice. Curr Biol 26: , 956–964. |
[98] | Lerdkrai C , Asavapanumas N , Brawek B , Kovalchuk Y , Mojtahedi N , Olmedillas Del Moral M , Garaschuk O ((2018) ) Intracellular Ca(2+) stores control in vivo neuronal hyperactivity in a mouse model of Alzheimer’s disease. Proc Natl Acad Sci U S A 115: , E1279–E1288. |
[99] | Zott B , Simon MM , Hong W , Unger F , Chen-Engerer HJ , Frosch MP , Sakmann B , Walsh DM , Konnerth A ((2019) ) A vicious cycle of beta amyloid-dependent neuronal hyperactivation. Science 365: , 559–565. |
[100] | Reichenbach N , Delekate A , Breithausen B , Keppler K , Poll S , Schulte T , Peter J , Plescher M , Hansen JN , Blank N , Keller A , Fuhrmann M , Henneberger C , Halle A , Petzold GC ((2018) ) P2Y1 receptor blockade normalizes network dysfunction and cognition in an Alzheimer’s disease model. J Exp Med 215: , 1649–1663. |
[101] | Kuchibhotla KV , Lattarulo CR , Hyman BT , Bacskai BJ ((2009) ) Synchronous hyperactivity and intercellular calcium waves in astrocytes in Alzheimer mice. Science 323: , 1211–1215. |
[102] | Delekate A , Fuchtemeier M , Schumacher T , Ulbrich C , Foddis M , Petzold GC ((2014) ) Metabotropic P2Y1 re-ceptor signalling mediates astrocytic hyperactivity in vivo in an Alzheimer’s disease mouse model. Nat Commun 5: , 5422. |
[103] | Murchison D , Griffith WH ((1998) ) Increased calcium buffering in basal forebrain neurons during aging. J Neurophysiol 80: , 350–364. |
[104] | Murchison D , Griffith WH ((1999) ) Age-related alterations in caffeine-sensitive calcium stores and mitochondrial buffering in rat basal forebrain. Cell Calcium 25: , 439–452. |
[105] | Murchison D , Zawieja DC , Griffith WH ((2004) ) Reduced mitochondrial buffering of voltage-gated calcium influx in aged rat basal forebrain neurons. Cell Calcium 36: , 61–75. |
[106] | Ziyatdinova S , Gurevicius K , Kutchiashvili N , Bolkvadze T , Nissinen J , Tanila H , Pitkanen A ((2011) ) Spontaneous epileptiform discharges in a mouse model of Alzheimer’s disease are suppressed by antiepileptic drugs that block sodium channels. Epilepsy Res 94: , 75–85. |
[107] | Romanelli MF , Morris JC , Ashkin K , Coben LA ((1990) ) Advanced Alzheimer’s disease is a risk factor for late-onset seizures. Arch Neurol 47: , 847–850. |
[108] | Risse SC , Lampe TH , Bird TD , Nochlin D , Sumi SM , Keenan T , Cubberley L , Peskind E , Raskind MA ((1990) ) Myoclonus, seizures, and paratonia in Alzheimer disease. Alzheimer Dis Assoc Disord 4: , 217–225. |
[109] | Mendez MF , Catanzaro P , Doss RC , R AR , Frey WH 2nd ((1994) ) Seizures in Alzheimer’s disease: Clinicopathologic study. J Geriatr Psychiatry Neurol 7: , 230–233. |
[110] | Amatniek JC , Hauser WA , DelCastillo-Castaneda C , Jacobs DM , Marder K , Bell K , Albert M , Brandt J , Stern Y ((2006) ) Incidence and predictors of seizures in patients with Alzheimer’s disease. Epilepsia 47: , 867–872. |
[111] | Scarmeas N , Honig LS , Choi H , Cantero J , Brandt J , Blacker D , Albert M , Amatniek JC , Marder K , Bell K , Hauser WA , Stern Y ((2009) ) Seizures in Alzheimer disease: Who, when, and how common?. Arch Neurol 66: , 992–997. |
[112] | Cockerell OC , Eckle I , Goodridge DM , Sander JW , Shorvon SD ((1995) ) Epilepsy in a population of 6000 re-examined: Secular trends in first attendance rates, prevalence, and prognosis. J Neurol Neurosurg Psychiatry 58: , 570–576. |
[113] | Scheuer ML , Cohen J ((1993) ) Seizures and epilepsy in the elderly. Neurol Clin 11: , 787–804. |
[114] | Hauser WA , Annegers JF , Kurland LT ((1993) ) Incidence of epilepsy and unprovoked seizures in Rochester, Minnesota: 1935-1984. Epilepsia 34: , 453–468. |
[115] | Kelly KM , Kharlamov A , Hentosz TM , Kharlamova EA , Williamson JM , Bertram EH 3rd , Kapur J , Armstrong DM ((2001) ) Photothrombotic brain infarction results in seizure activity in aging Fischer 344 and Sprague Dawley rats. Epilepsy Res 47: , 189–203. |
[116] | Hauser WA , Morris ML , Heston LL , Anderson VE ((1986) ) Seizures and myoclonus in patients with Alzheimer’s disease. Neurology 36: , 1226–1230. |
[117] | Cain SM , Snutch TP ((2010) ) Contributions of T-type calcium channel isoforms to neuronal firing. Channels (Austin) 4: , 475–482. |
[118] | Carmignoto G , Haydon PG ((2012) ) Astrocyte calcium signaling and epilepsy. Glia 60: , 1227–1233. |
[119] | Sun DA , Sombati S , Blair RE , DeLorenzo RJ ((2002) ) Calcium-dependent epileptogenesis in an in vitro model of stroke-induced “epilepsy”. Epilepsia 43: , 1296–1305. |
[120] | Strowbridge BW , Masukawa LM , Spencer DD , Shepherd GM ((1992) ) Hyperexcitability associated with localizable lesions in epileptic patients. Brain Res 587: , 158–163. |
[121] | Meyer FB ((1989) ) Calcium, neuronal hyperexcitability and ischemic injury. Brain Res Brain Res Rev 14: , 227–243. |
[122] | Schwartzkroin PA ((1986) ) Hippocampal slices in experimental and human epilepsy. Adv Neurol 44: , 991–1010. |
[123] | Babb TL , Brown WJ ((1986) ) Neuronal, dendritic, and vascular profiles of human temporal lobe epilepsy correlated with cellular physiology in vivo. Adv Neurol 44: , 949–966. |
[124] | Moyer JR Jr. , Thompson LT , Black JP , Disterhoft JF ((1992) ) Nimodipine increases excitability of rabbit CA1 pyramidal neurons in an age- and concentration-dependent manner. J Neurophysiol 68: , 2100–2109. |
[125] | Barnes CA , Rao G , Orr G ((2000) ) Age-related decrease in the Schaffer collateral-evoked EPSP in awake, freely behaving rats. Neural Plast 7: , 167–178. |
[126] | Barnes CA , McNaughton BL ((1985) ) An age comparison of the rates of acquisition and forgetting of spatial information in relation to long-term enhancement of hippocampal synapses. Behav Neurosci 99: , 1040–1048. |
[127] | Rosenzweig ES , Rao G , McNaughton BL , Barnes CA ((1997) ) Role of temporal summation in age-related long-term potentiation-induction deficits. Hippocampus 7: , 549–558. |
[128] | Foster TC , Kumar A ((2007) ) Susceptibility to induction of long-term depression is associated with impaired memory in aged Fischer 344 rats. Neurobiol Learn Mem 87: , 522–535. |
[129] | Baker J , Libretto T , Henley W , Zeman A ((2019) ) A longitudinal study of epileptic seizures in Alzheimer’s disease. Front Neurol 10: , 1266. |
[130] | Hommet C , Mondon K , Camus V , De Toffol B , Constans T ((2008) ) Epilepsy and dementia in the elderly. Dement Geriatr Cogn Disord 25: , 293–300. |
[131] | Bell JS , Lonnroos E , Koivisto AM , Lavikainen P , Laitinen ML , Soininen H , Hartikainen S ((2011) ) Use of antiepileptic drugs among community-dwelling persons with Alzheimer’s disease in Finland. J Alzheimers Dis 26: , 231–237. |
[132] | Taipale H , Gomm W , Broich K , Maier W , Tolppanen AM , Tanskanen A , Tiihonen J , Hartikainen S , Haenisch B ((2018) ) Use of antiepileptic drugs and dementia risk-an analysis of Finnish health register and German health insurance data. J Am Geriatr Soc 66: , 1123–1129. |
[133] | Cretin B ((2018) ) Pharmacotherapeutic strategies for treating epilepsy in patients with Alzheimer’s disease. Expert Opin Pharmacother 19: , 1201–1209. |
[134] | Zhang MY , Zheng CY , Zou MM , Zhu JW , Zhang Y , Wang J , Liu CF , Li QF , Xiao ZC , Li S , Ma QH , Xu RX ((2014) ) Lamotrigine attenuates deficits in synaptic plasticity and accumulation of amyloid plaques in APP/PS1 transgenic mice. Neurobiol Aging 35: , 2713–2725. |
[135] | Rao SC , Dove G , Cascino GD , Petersen RC ((2009) ) Recurrent seizures in patients with dementia: Frequency, seizure types, and treatment outcome. Epilepsy Behav 14: , 118–120. |

