
Predictive biomarkers for response to trametinib in non-small cell lung cancer
Abstract
BACKGROUND:
Non-small cell lung cancer (NSCLC) is a leading cause of cancer deaths. Current companion diagnostics use driver mutation sequencing to select patients for molecularly targeted agents (MTA), even though most patients lack actionable mutations. These diagnostics utilize static biomarkers, ignoring real-time tumor cell biology.
OBJECTIVE:
Trametinib is FDA-approved in combination with dabrafenib for BRAF V600E-positive NSCLC, however, it has plausible utility beyond these patients. We sought to identify novel biomarkers for maximizing trametinib application.
METHODS:
Trametinib responses were evaluated in 12 EGFR/BRAF wild-type (WT) NSCLC cell lines with diverse RAS mutational status. We identified three response categories by colony assay. Trametinib-induced molecular dynamics were studied using immunoassays and apoptosis/necrosis assays, to identify predictive response biomarkers.
RESULTS:
p27 accumulation and cyclin D1 downregulation suggested universal cell cycle arrest with trametinib. However, 4 cell lines showed PARP cleavage and 8 showed increased phospho-4E-BP1, suggesting varied cellular outcomes from apoptosis, necrosis, senescence to autophagy. Cleaved PARP, phospho-4E-BP1 and phospho-AKT expression can predict these outcomes.
CONCLUSIONS:
Trametinib monotherapy outcome may depend upon cellular context more than oncogenic mutation status. In BRAF WT NSCLC, trametinib may be best suited for combination therapy and dynamic biomarkers could select combinations and predict responses.
1Introduction
Lung cancer is the second most prevalent and deadliest form of cancer accounting for 23% of cancer deaths in the United States (US) in 2020 [1, 2]. There were over 2.21 million cases and 1.80 million lung cancer-related deaths worldwide in 2020 [3, 4]. These figures underscore an urgent need to develop more effective diagnostics and therapeutics. Non-small cell lung cancer (NSCLC) is the most common subtype, accounting for 80-85% of cases [5]. NSCLC is among the most molecularly characterized cancers with a broad range of identified oncogenic drivers including activating mutations, rearrangements and/or amplifications in epidermal growth factor receptor (EGFR), Kirsten rat sarcoma virus (KRAS), neuroblastoma RAS viral oncogene homolog (NRAS), B-Raf proto-oncogene, serine/threonine kinase (BRAF), ALK receptor tyrosine kinase (ALK), ROS proto-oncogene 1, receptor tyrosine kinase (ROS1), MET proto-oncogene, receptor tyrosine kinase (MET), phosphatidylinositol-4,5-bisphosphate 3-kinase catalytic subunit alpha (PI3KCA), and others. Various molecularly targeted agents (MTAs) have been developed and approved to combat genetic alterations in NSCLC, but most have limited long-term success due to the emergence of intrinsic or adaptive resistance mechanisms. Importantly, nearly 75% of lung cancer patients present without any clinically actionable mutations at diagnosis. To improve therapy selection and patient outcomes, we are identifying novel predictive biomarkers by monitoring MTA-induced molecular changes.
Trametinib (MEKINIST) is a mitogen-activated protein kinase (MAPK) kinase (MEK) inhibitor that has demonstrated strong anti-cancer activity. Currently, trametinib is approved by the US Food and Drug Administration (FDA) for NSCLC in combination with the BRAF inhibitor dabrafenib (TAFINLAR) in BRAF V600E mutation patients identified by the Oncomine Dx Target Test [6]. Other tests, such as real-time PCR and next generation sequencing that can detect the BRAF V600E mutation are used clinically in the US and Europe. Unfortunately, only 1-2% of NSCLC patients are BRAF V600E positive [7, 8]. Located downstream of EGFR and KRAS driven signaling, MEK has plausible wider-spread utility as a therapeutic target. Reports suggest trametinib activity in KRAS/NRAS mutant NSCLC cell lines [9, 10]. Thus, it is imperative to identify trametinib-sensitive patients which may be overlooked using the current sequence-based companion diagnostics.
Current tests utilize static biomarkers, such as specific mutational status of RAS/RAF/MEK pathway members, for assessing potential therapeutic efficacies. These static biomarkers ignore the complex real-time tumor cell biology occurring and may limit the adoption of potentially life-saving therapies. There is an unmet need to identify dynamic biomarkers to better stratify responsive NSCLC patients and potentially expand the utility of therapeutics beyond driver mutational status. Here, we describe the identification of dynamic biomarkers as a first step in the development of a more precise predictive test for trametinib response. We utilized a panel of NSCLC cell lines with various molecular alterations. We elucidated the effects of trametinib by studying sensitivity using a colony formation assay (CFA) [11] and examining molecular pathways (immunoassays and cellular assays) leading to final cellular outcomes. We identified signaling pathway mechanisms leading to varied cellular phenomenon based on cellular context that could predict trametinib responses. Our functionally dynamic preliminary biomarkers poly-(ADP-ribose) polymerase (PARP), phospho-eukaryotic translation initiation factor 4E binding protein 1 (p-4E-BP1) and phospho-AKT serine/threonine kinase 1 (p-Akt) were predictive of trametinib responses independent of mutation status. Our data indicate an improved patient selection modality based on actual signaling events triggered by trametinib leading to final outcomes with respect to cellular context. We hypothesize these biomarkers can be utilized to predict trametinib responses in NSCLC patients without targetable driver mutations. Furthermore, we hypothesize these biomarkers can be extrapolated to other MEK inhibitors including cobimetinib, pimasertib, binimetinib, and selumetinib.
2Materials and methods
2.1Cell lines and cell culture
The NSCLC cell lines A427 (HTB-53), CALU-3 (HTB-55), CALU-6 (HTB-56), NCI-H1299 (CRL-5803), NCI-H1693 (CRL-5887), NCI-H1838 (CRL-5899), NCI-H2087 (CRL-5922), NCI-H2170 (CRL-5928), NCI-H292 (CRL-1848), NCI-H358 (CRL-5807) and NCI-H460 (HTB-177) were purchased from American Type Culture Collection (ATCC; Manassas, VA, USA). COR-L105 (Cat # 92031918) was purchased from MilliporeSigma (St. Louis, MO, USA). All these cell lines were authenticated. All cell lines were cultured in RPMI-1640 (ATCC Cat # 30-2001) with the exception of A427 and CALU-3 which were cultured in EMEM (ATCC Cat # 30-2003). All cells were cultured at 37°C in a humid atmosphere of 5% CO2 in medium supplemented with 10% fetal bovine serum (FBS; Thomas Scientific Cat # FB5001, Swedesboro, NJ, USA) and a penicillin-streptomycin solution of 100 units/mL penicillin and 100 μg/mL streptomycin (Thermo Fisher Cat # 15140163, Waltham, MA, USA).
2.2Reagents and antibodies
Trametinib (Mekinist; GSK1120212) was obtained from Selleck Chemicals (Cat # S2673; Houston, TX, USA) and prepared per their instructions. Antibodies for ERK (p44/p42 MAPK; ERK1/2; Cat # 4695), Phospho-ERK (Thr202/Tyr204; Cat # 4376), Cyclin D1 (Cat # 2922 & 55506), p27KIP1 (Cat # 3688), GAPDH (HRP Conjugate; Cat # 3683), Phospho-AKT (Ser473; Cat # 4060), AKT (pan; Cat # 4685), Phospho-4E-BP1 (Thr70; Cat # 9455), 4E-BP1 (Cat # 9644), LC3-A/B (Cat # 4108), SQSTM1/p62 (Cat # 5114), Beclin-1 (Cat # 3495), PARP (Cat # 9532), Vimentin (Cat # 5741), E-Cadherin (Cat # 14472), Bcl-2 (Cat # 4223), Phospho-p-Rb (Ser807/811; Cat # 8516), Rb (Cat # 9309), Caspase-3 (Cat # 9662), Caspase-7 (Cat # 9494), and α-Tubulin (Cat # 2125) were from Cell Signaling Technologies (CST; Danvers, MA, USA). Antibody for Ki-67 (SP6; Cat # 275 R) used for immunocytochemistry and western blot was from Cell Marque (Rocklin, CA, USA). Goat Anti-Rabbit IgG (H + L)-HRP Conjugate (Bio-Rad, Cat # 1706515) and Goat Anti-Mouse IgG (H + L)-HRP Conjugate (Bio-Rad, Cat # 1706516) were from Bio-Rad Laboratories (Hercules, CA, USA). All antibodies were used according to the manufacturers’ instructions.
2.3Colony formation assay
The assay was performed as previously shown by Franken et al. [11]. Cells were seeded as single cell suspensions of 150, 200 or 300 cells per well according to the plating efficiency of the cell lines in 6 well plates with media containing 10% FBS and incubated overnight. Cells were then treated with trametinib (0, 0.15, 0.46, 1.4, 4.1, 12.3, 37, 111, 333 and 1000 nM) in media containing 10% FBS and incubated for 72 h. Following trametinib treatment, drug media was removed and replaced with media containing 10% FBS. Cells were incubated over several days to allow colony maturation. Once colonies in the untreated control samples proliferated to at least 50 cells per colony, media were removed and cells were fixed overnight at room temperature with 2 mL of fixative solution (1-part glacial acetic acid to 7-parts methanol). The next day, fixative was removed, and wells were gently rinsed with 2 mL tap water. Cells were then stained for 1 h at room temperature using 2 mL of staining solution (methanol containing 0.5% Coomassie blue). Excess stain was decanted, wells were rinsed with 2 mL of tap water and allowed to dry overnight. Stained colonies were visually marked and counted using a bright field microscope.
2.4Preparation of whole cell extracts for western blotting
One million cells per well were seeded into 6-well plates and incubated overnight in media supplemented with 10% FBS. The next day, media were replaced with media containing 0.5% FBS and incubated an additional 24 h (“FBS starvation” condition). Cells were then treated with trametinib (0, 0.016, 0.4, 10 and 250 nM) in media containing 0.5% FBS and incubated for 24 or 48 h. For total protein extraction, media were collected from each condition to retrieve floating cells. Then, adherent cells were washed with Hanks buffered saline solution (HBSS). Wash solutions were collected to retrieve detached cells and combined with the previously collected media. Attached cells were harvested with Accutase (Life Tech., Cat # A1110501) and combined with the previously collected media and wash solutions. Each pool was then centrifuged (200 g, 5 min) at room temperature to pellet cells. Cells were washed with ice-cold PBS and centrifuged again. Cell pellets were resuspended for lysing using 250 μL of 1X lysis buffer (Bio-Rad; Cat # 10024042) containing additional protease (CST; Cat # 5871 S) and phosphatase (CST; Cat # 5870 S) inhibitor cocktails and incubated for 10 min at 4°C on ice. Cell lysates were clarified with centrifugation (10,000 g) at 4°C for 10 min. Cell lysate concentrations were quantified using the Bio-Rad DC Protein Assay (Bio-Rad, Cat # 5000116).
2.5Western blotting
For western blots, an equal amount of protein (6 μg) was loaded into sodium dodecyl sulfate-polyacrylamide gels (SDS-PAGE; Mini-Protean TGX Precast Gel; Bio-Rad) with 7.5% (Cat # 4561024), 10% (Cat # 4561035), 12% (Cat # 4561045), or 4-15% (Cat # 4561085). Proteins were separated at 200 V for 30 minutes in 1X Tris/Glycine/SDS buffer (Bio-Rad, Cat # 1610772) and transferred with transfer buffer (Trans-Blot Turbo Transfer Kit; Bio-Rad, Cat # 1704273) to polyvinylidene fluoride (PVDF) membranes using a Trans-Blot Turbo (Bio-Rad, Cat # 1704155). Membranes were blocked for 1 h at room temperature with 5% non-fat dry milk in tris-buffered saline with Tween 20 (TBST; 15 mM Tris-HCl, pH 7.5, 200 mM NaCl and 0.1% Tween 20). Membranes were incubated with primary antibodies overnight at 4°C and the next day with rocking agitation for 1 h at room temperature; all primary antibodies were diluted in TBST following manufacturers’ specifications. Membranes were washed three times for 5 min each in TBST and incubated with goat anti-rabbit or -mouse IgG horseradish peroxidase (HRP)-conjugated secondary antibodies diluted 1 : 5,000 in TBST with 5% non-fat dry milk for 1 h at room temperature. Membranes were washed three times for 10 min each in TBST and target proteins were identified using Clarity Western ECL Substrate (Bio-Rad, Cat # 1705061) and autoradiography film (GenHunter, Cat # B581, Nashville, TN, USA).
2.6Immunocytochemistry
Immunocytochemistry was performed using the BioGenex kit. For the assay, 10,000 cells per chamber were seeded with 10% FBS-containing media in an 8-chambered slide (Thermo Fisher Scientific, Cat # 154941). After overnight incubation, chamber media were replaced with 0.5% FBS-containing media. Cells were incubated an additional 24 h for growth and then treated with trametinib (0, 0.4, 10 and 250 nM) for 24 and 48 h. Cells were then fixed with 10% neutral buffered formalin solution for 10 min, washed twice with PBS and stored in 70% solution. For antigen retrieval, chambers slides were rinsed in PBS for 10 min, placed in PBS-Tween 20 (0.05%) for 10 min, incubated in 10 mM sodium citrate pH 6.0 containing 0.05% Tween 20 for 25 min at 90°C, cooled at room temperature for 20 min, washed in PBS-Tween 20 (0.05%) for 10 min, blocked with 3% hydrogen peroxide (Cat # HK111) and washed with Super Sensitivetrademark wash buffer (Cat # HK583-5K). Next, chamber slides were blocked with Power Blocktrademark solution (Cat # HK0830189) for 10 min and cells were incubated with Ki-67 antibody at a 1 : 200 dilution in enhanced antibody diluent at 4°C overnight. The following day, chambers were washed three times with Super Sensitivetrademark wash buffer, cells were incubated with Super Enhancertrademark (Cat # HK518-50K) signal detection for 20 min and again washed three times with wash buffer. Cells were then incubated with pre-diluted poly-HRP reagent (Cat # HK519) (mix of anti-rabbit/-mouse HRP provided in kit) for 30 min in the dark. Chambers were washed again three times with wash buffer and incubated with diaminobenzidine (DAB) chromogen substrate (Cat # HK128) for 7 min in the dark. Chamber slides were rinsed gently under running water for 1 min and dipped in counterstain Mayer’s Hematoxylin (Cat # HK100) for 1 min. Cells were imaged using a bright field microscope (Carl Zeiss, Jena, Germany) with a 6D Canon camera. Ki-67 expression was quantified with ImageJ software, counting 100 cells per treatment, per cell line. Data are represented as the average intensity obtained from two independently repeated experiments.
2.7Apoptosis, necrosis and healthy cells assessment
Apoptosis and necrosis events were detected using the PromoKine l Kit (Cat # PK-CA707-30018, PromoCell GmBH, Heidelberg, Germany). For the assay, after 48 h of trametinib treatment in adherent culture, cells were harvested similarly as described above in “Preparation of Whole Cell Extracts”, except PBS was supplemented with 2.5 mM CaCl2. Each sample (containing 200,000 cells) was resuspended in 26.5 μL of 1X staining solution and incubated at room temperature for 15 min in the dark. Cells were then washed in 1X binding buffer and centrifuged to pellet. Cell pellets were resuspended in 50 μL of 1X binding buffer. And 10 μL of each sample was loaded into a microfluidic chamber slide and observed under 20X magnification using a confocal microscope (Leica Microsystems, IL, USA). Three images were taken and a total of 100 cells per treatment, per cell line were analyzed using ImageJ software. Ethidium homodimer III-positive cells were scored as ‘necrotic cells’ while annexin V-stained cells were scored as ‘apoptotic cells,’ and cells stained by both were scored as ‘late-apoptotic cells.’
3Results
3.1NSCLC cell lines have varied sensitivity to trametinib
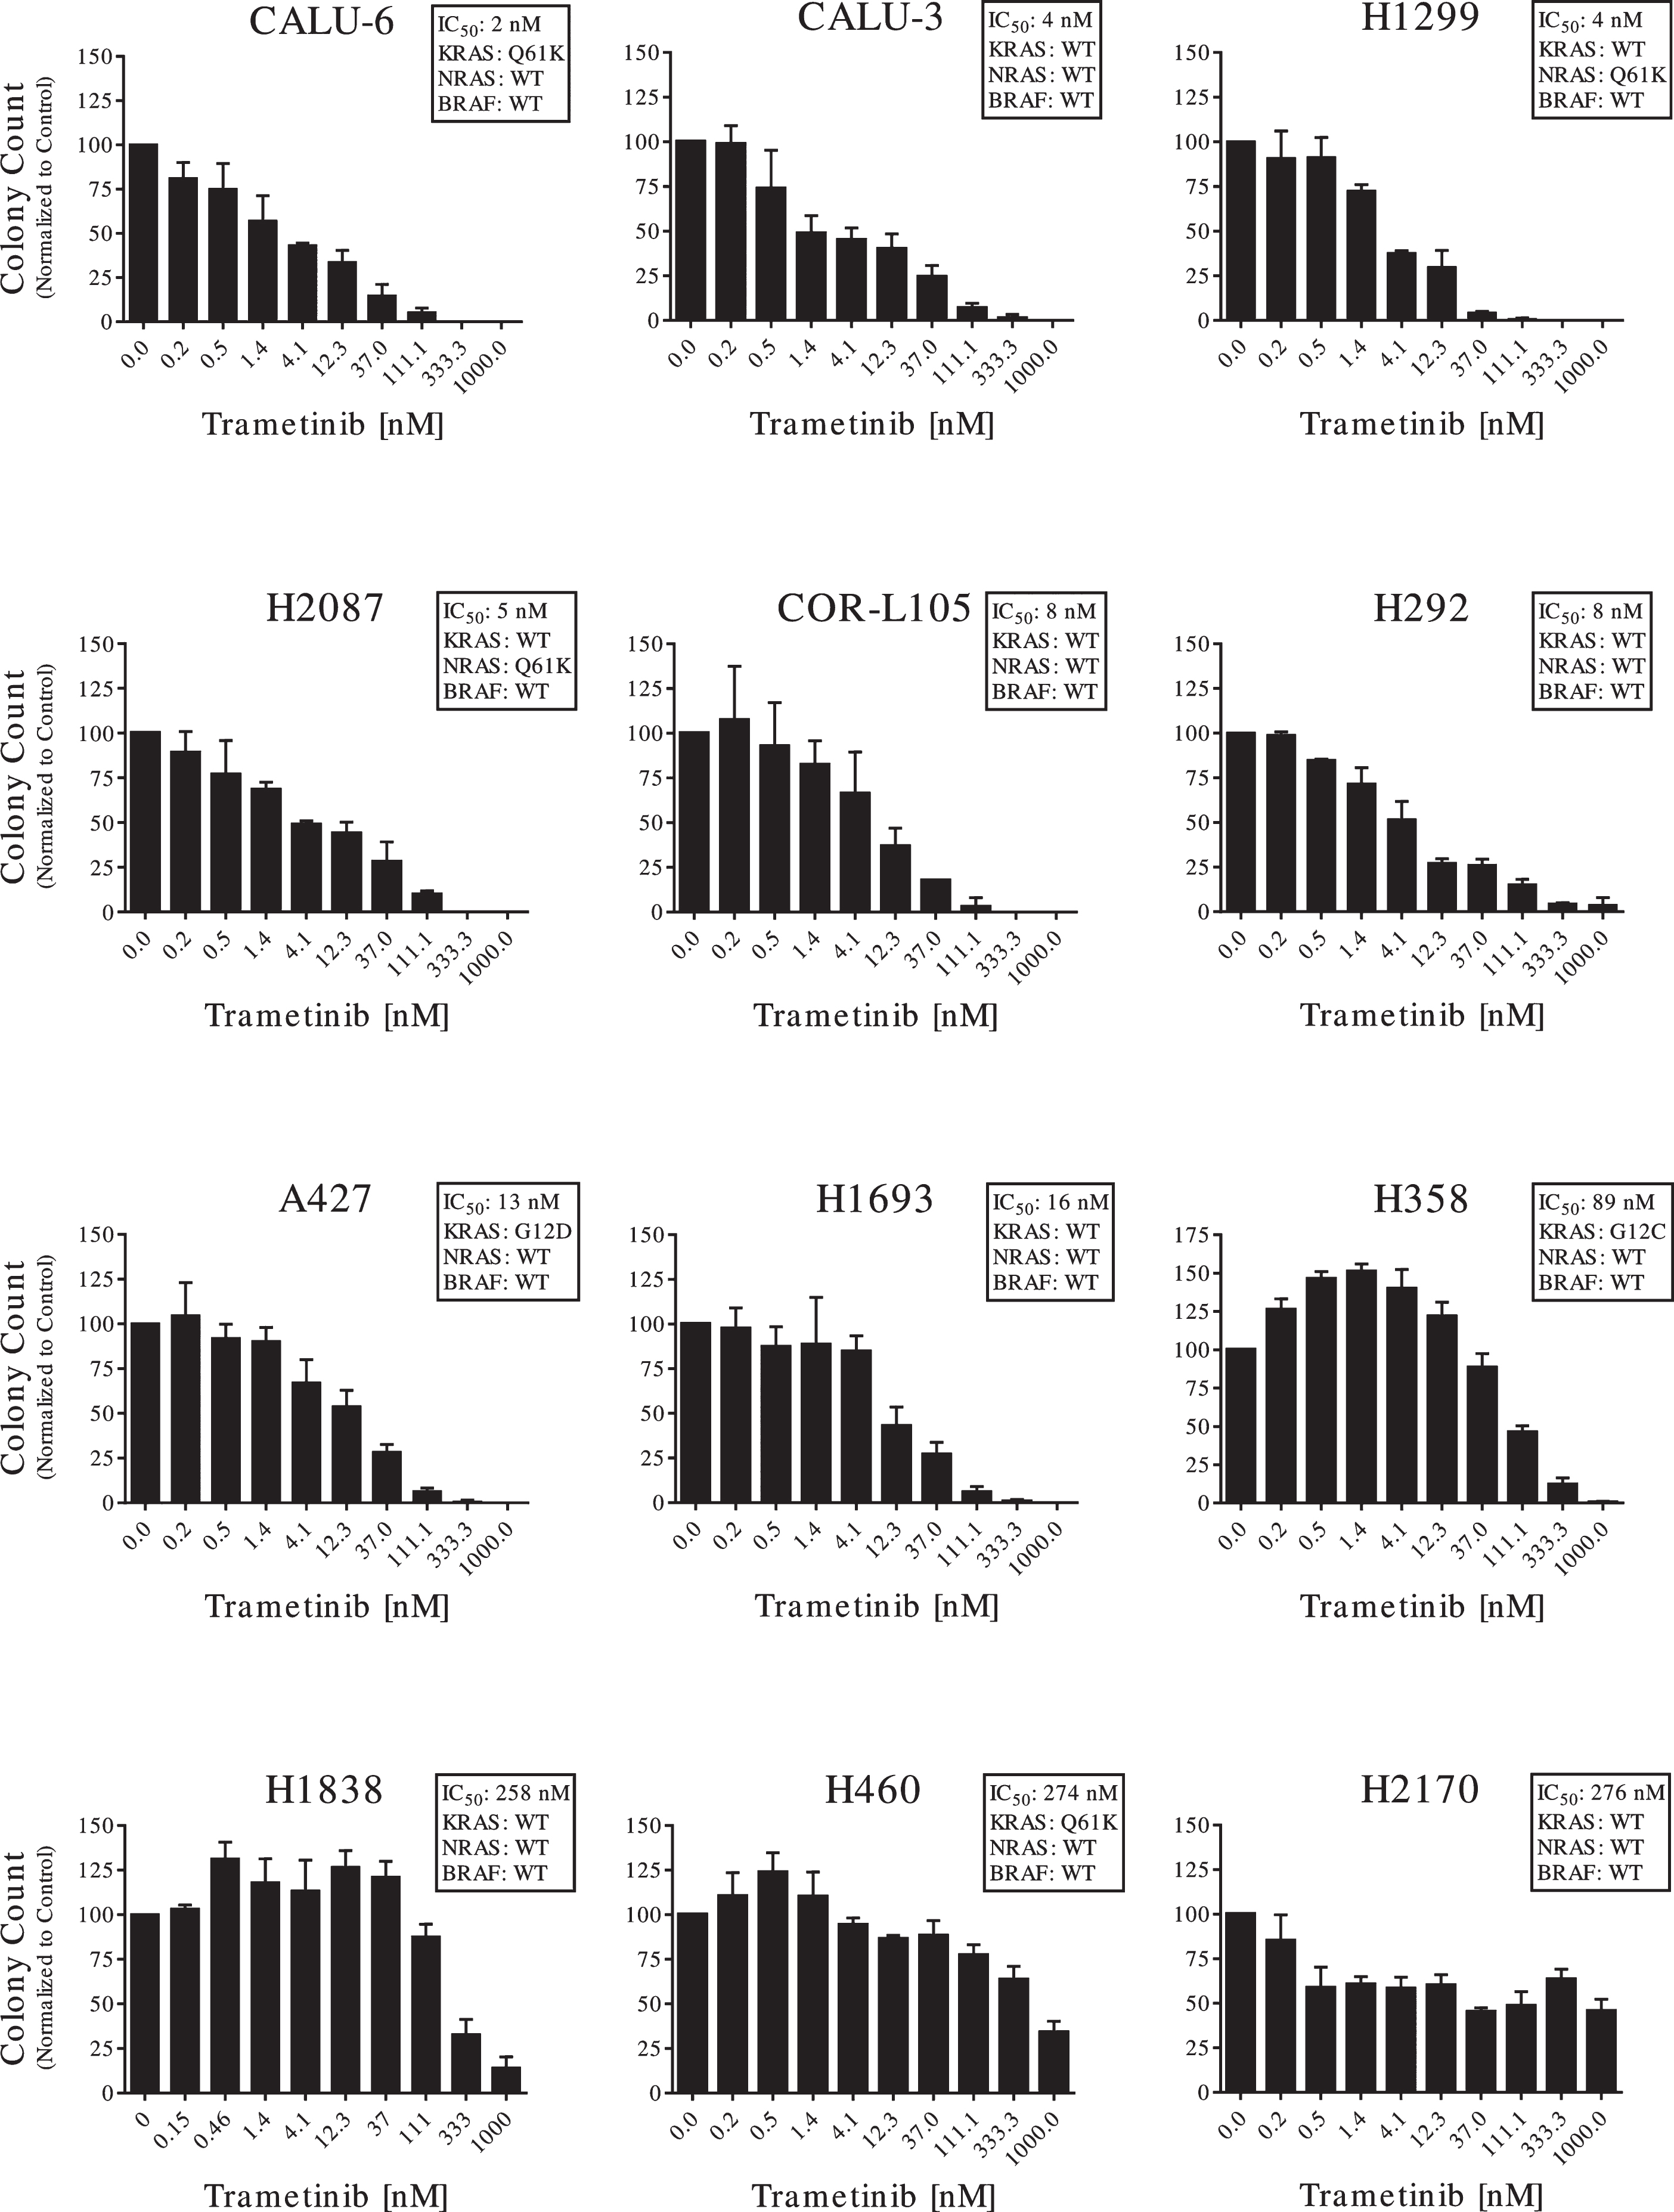
Anti-cancer activity of trametinib was assessed using a CFA [11] in a panel of twelve EGFR WT and BRAF WT NSCLC cell lines with varied RAS gene alterations (Table 1). As they are BRAF WT, these NSCLC patient models would not be approved for trametinib therapy per the FDA-approved sequence-based companion diagnostic test [6]. We stratified cell lines into three categories: highly, moderately and minimally sensitive to trametinib. We used trametinib IC50 values of < 10 nM for highly sensitive (CALU-6, CALU-3, H1299, H2087, COR-L105 and H292), 10-100 nM for moderately sensitive (A427, H1693 and H358) and > 100 nM for minimally sensitive cell lines (H1838, H460 and H2170; Fig. 1; Table 1).
Table 1
Mutation status of oncogenic driver and trametinib IC50 values in a panel of 12 NSCLC cell lines. The mutation status of EGFR, NRAS and KRAS for each cell line is indicated. All cell lines were wild type for BRAF. IC50 values for trametinib indicated were determined by colony formation assays
| Cell Line | IC50 value (nM) | KRAS status | NRAS status | EGFR status | BRAF status |
| CALU-6 | 2 | Q61K | WT | WT | WT |
| CALU-3 | 4 | WT | WT | WT | WT |
| H1299 | 4 | WT | Q61K | WT | WT |
| H2087 | 5 | WT | Q61K | WT | WT |
| COR-L105 | 8 | WT | WT | WT | WT |
| H292 | 8 | WT | WT | WT | WT |
| A427 | 13 | G12D | WT | WT | WT |
| H1693 | 16 | WT | WT | WT | WT |
| H358 | 89 | G12C | WT | WT | WT |
| H1838 | 258 | WT | WT | WT | WT |
| H460 | 274 | Q61H | WT | WT | WT |
| H2170 | 276 | WT | WT | WT | WT |
Fig. 1
Anti-proliferative activity of trametinib on NSCLC cell lines. A colony forming assay (CFA) was used to measure the anti-proliferative activity of trametinib on the full panel of 12 NSCLC cell lines. Cells were plated at their own optimal plating efficiency. Each cell line was treated with trametinib concentrations ranging from 0.15 nM to 1μM for 72 h and allowed to grow for 7 days to form colonies. Colonies were counted and averaged for each concentration, then compared to vehicle control. Data are represented with mean and standard deviation of representative experiment. Data are representative of two or three independent experiments.
3.2ERK is not a good predictive marker for trametinib response
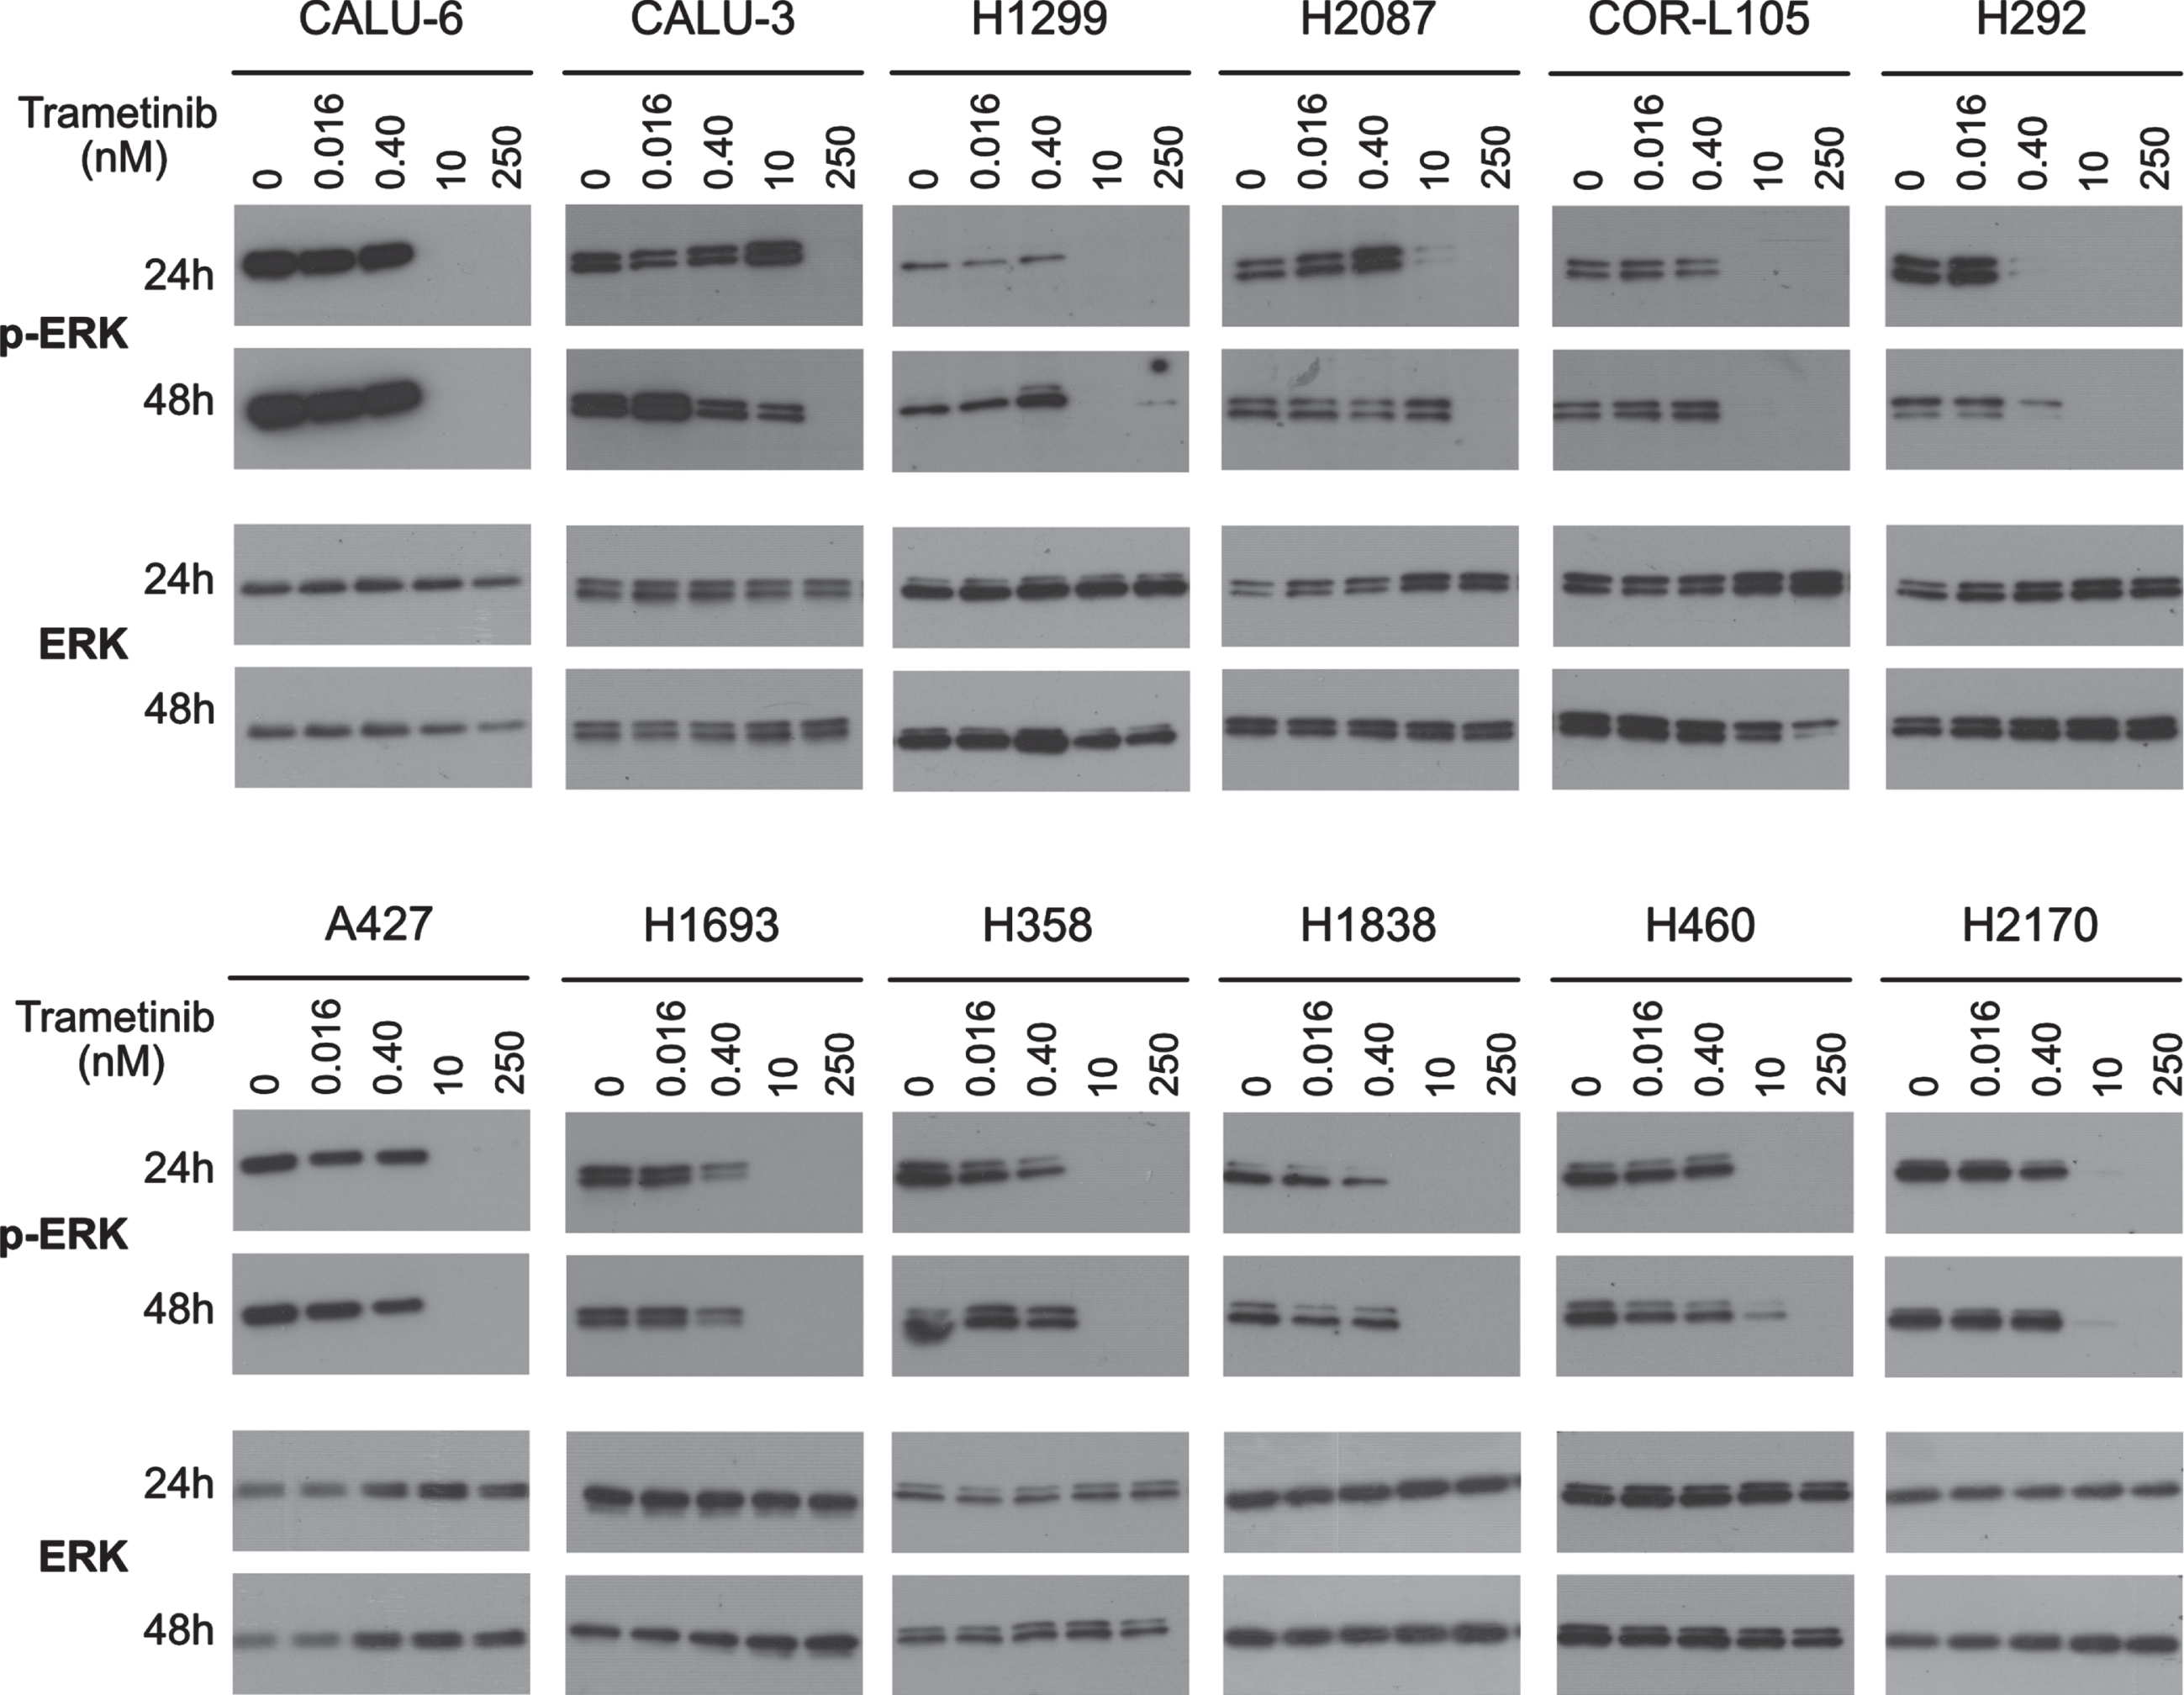
Since MAP Kinase (ERK) is an effector substrate of MEK, we assessed ERK phosphorylation status (T202/204) as a predictive biomarker for trametinib. Phospho-ERK (p-ERK) was assessed at various trametinib doses and exposure times. First, we studied short-term (0.5 h) responses in 4 representative cell lines: CALU-6 (highly sensitive), A427 (moderately sensitive) and H1838 and H2170 (minimally sensitive). Regardless of sensitivities in the CFA reference assay, all four cell lines showed strong downregulation of p-ERK with 10 and 250 nM trametinib at 0.5 h (Supplementary Figure 1). Furthermore, at extended treatments of 24 and 48 h, all 12 cell lines showed universal strong downregulation of p-ERK with 10 and/or 250 nM trametinib, with no total ERK change (Fig. 2). Therefore, trametinib is an effective inhibitor of proximal MAP kinase activity irrespective of ultimate response category and p-ERK is not suited to predict longer-term fate in NSCLC. Since this proximal biomarker did not correlate to overall trametinib response, we assessed intermediate and distal biomarkers for predictive potential.
Fig. 2
Inhibitory effect of trametinib on ERK phosphorylation. Western blots were used to measure the effect of trametinib on the levels of phosphorylated ERK (pERK) and total ERK on the full panel of 12 NSCLC cell lines. Cell lines were treated with vehicle control, 0.016, 0.4, 10 or 250 nM trametinib for 24 or 48 h. Western blot images are representative of two independent experiments.
3.3Trametinib causes cell cycle and growth arrest
To further elucidate downstream pathways of trametinib response, we investigated changes in cell cycle markers. Trametinib can induce p27KIP1 expression in cancer [12–14]. We confirmed a clear dose-dependent increase in p27KIP1 expression at 24 and 48 h almost universally in our cell lines, irrespective of overall trametinib sensitivities (Fig. 3). p27KIP1 expression was strongly induced with 10 nM in most cell lines while in H1693, H292 and H1838 the increase was less pronounced. This indicates that p27KIP1 expression changes are not predictive of overall trametinib response.
Fig. 3
Induction of G1/S arrest by trametinib. The full panel of 12 cell lines were treated with 0, 0.016, 0.4, 10 or 250 nM trametinib for 24 or 48 h. Expression levels of the G1/S phase proteins cyclin D1 and p27 were determined by western blotting. Six ug of protein was loaded in each lane for each sample. Equal loading of protein was determined by GAPDH. Western blot images are representative of two independent experiments.
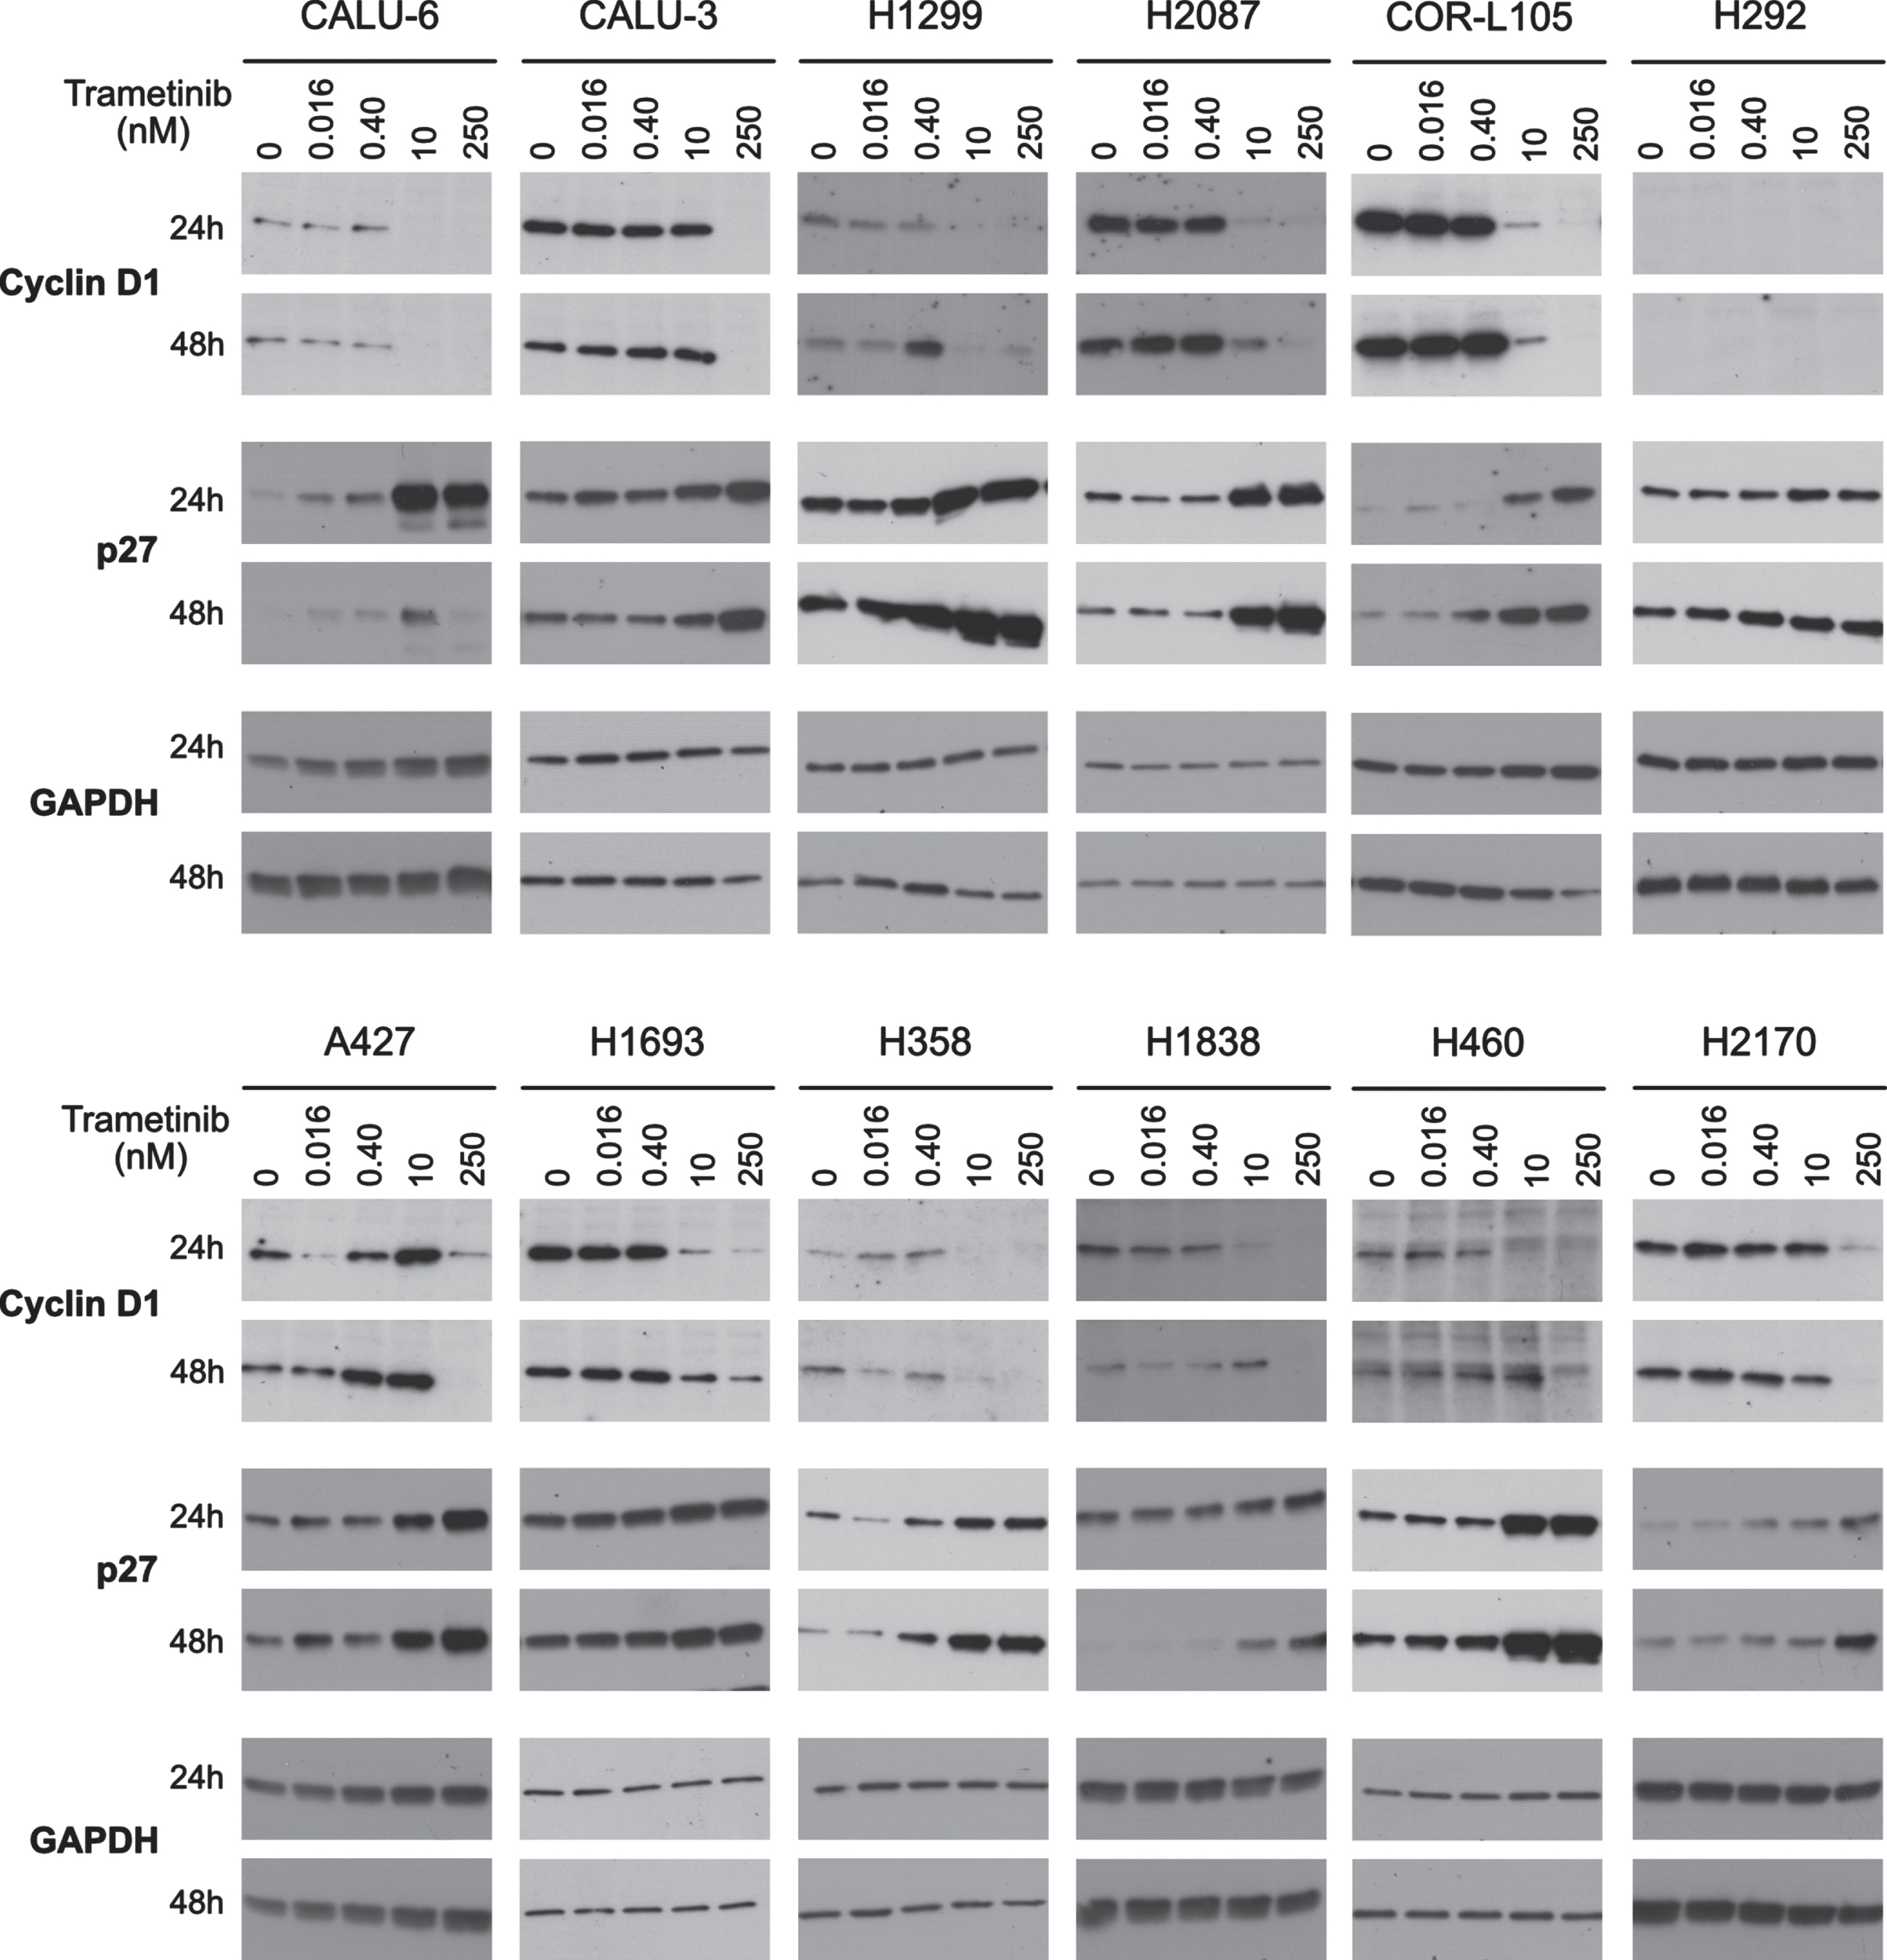
The RAS/RAF/MEK pathway influences cyclin D1 expression [13], therefore, we examined cyclin D1 levels following trametinib treatment. In most cell lines, we observed a strong decrease in cyclin D1 expression with 10 and 250 nM trametinib at 24 and 48 h, irrespective of overall trametinib sensitivities (Fig. 3). Interestingly, whereas cyclin D1 was undetectable in H292 using antibody clone E3P5 S (Cat # 55506), it showed a similar down-regulation of cyclin D1 with a different antibody (Cat # 2922) (Supplementary Figure 1). Other studies have shown that the functional determinant for cyclin D1 downregulation is the phosphorylation status of retinoblastoma protein (pRb; S807/811) [13]. Therefore, we analyzed this with the four representative cell lines described above. In all four cell lines, phospho-pRb (p-pRb) was downregulated with 250 nM trametinib at 24 and 48 h (Supplementary Figure 1). Together, these data indicate that regardless of overall sensitivities, trametinib induces cell cycle arrest at G1/S phase in NSCLC cells. Specifically, trametinib-induced p27KIP1 accumulation is functional and inhibits cyclin D1-Cdk4/6 activity resulting in G1/S phase arrest. Since all NSCLC cell lines with varied RAS mutation status showed similar p-ERK and cyclin D1 responses, it is unlikely that G1/S arrest is the primary cause of the varied trametinib responses.
3.4Trametinib induces apoptotic and/or non-apoptotic cell death in NSCLC cell lines
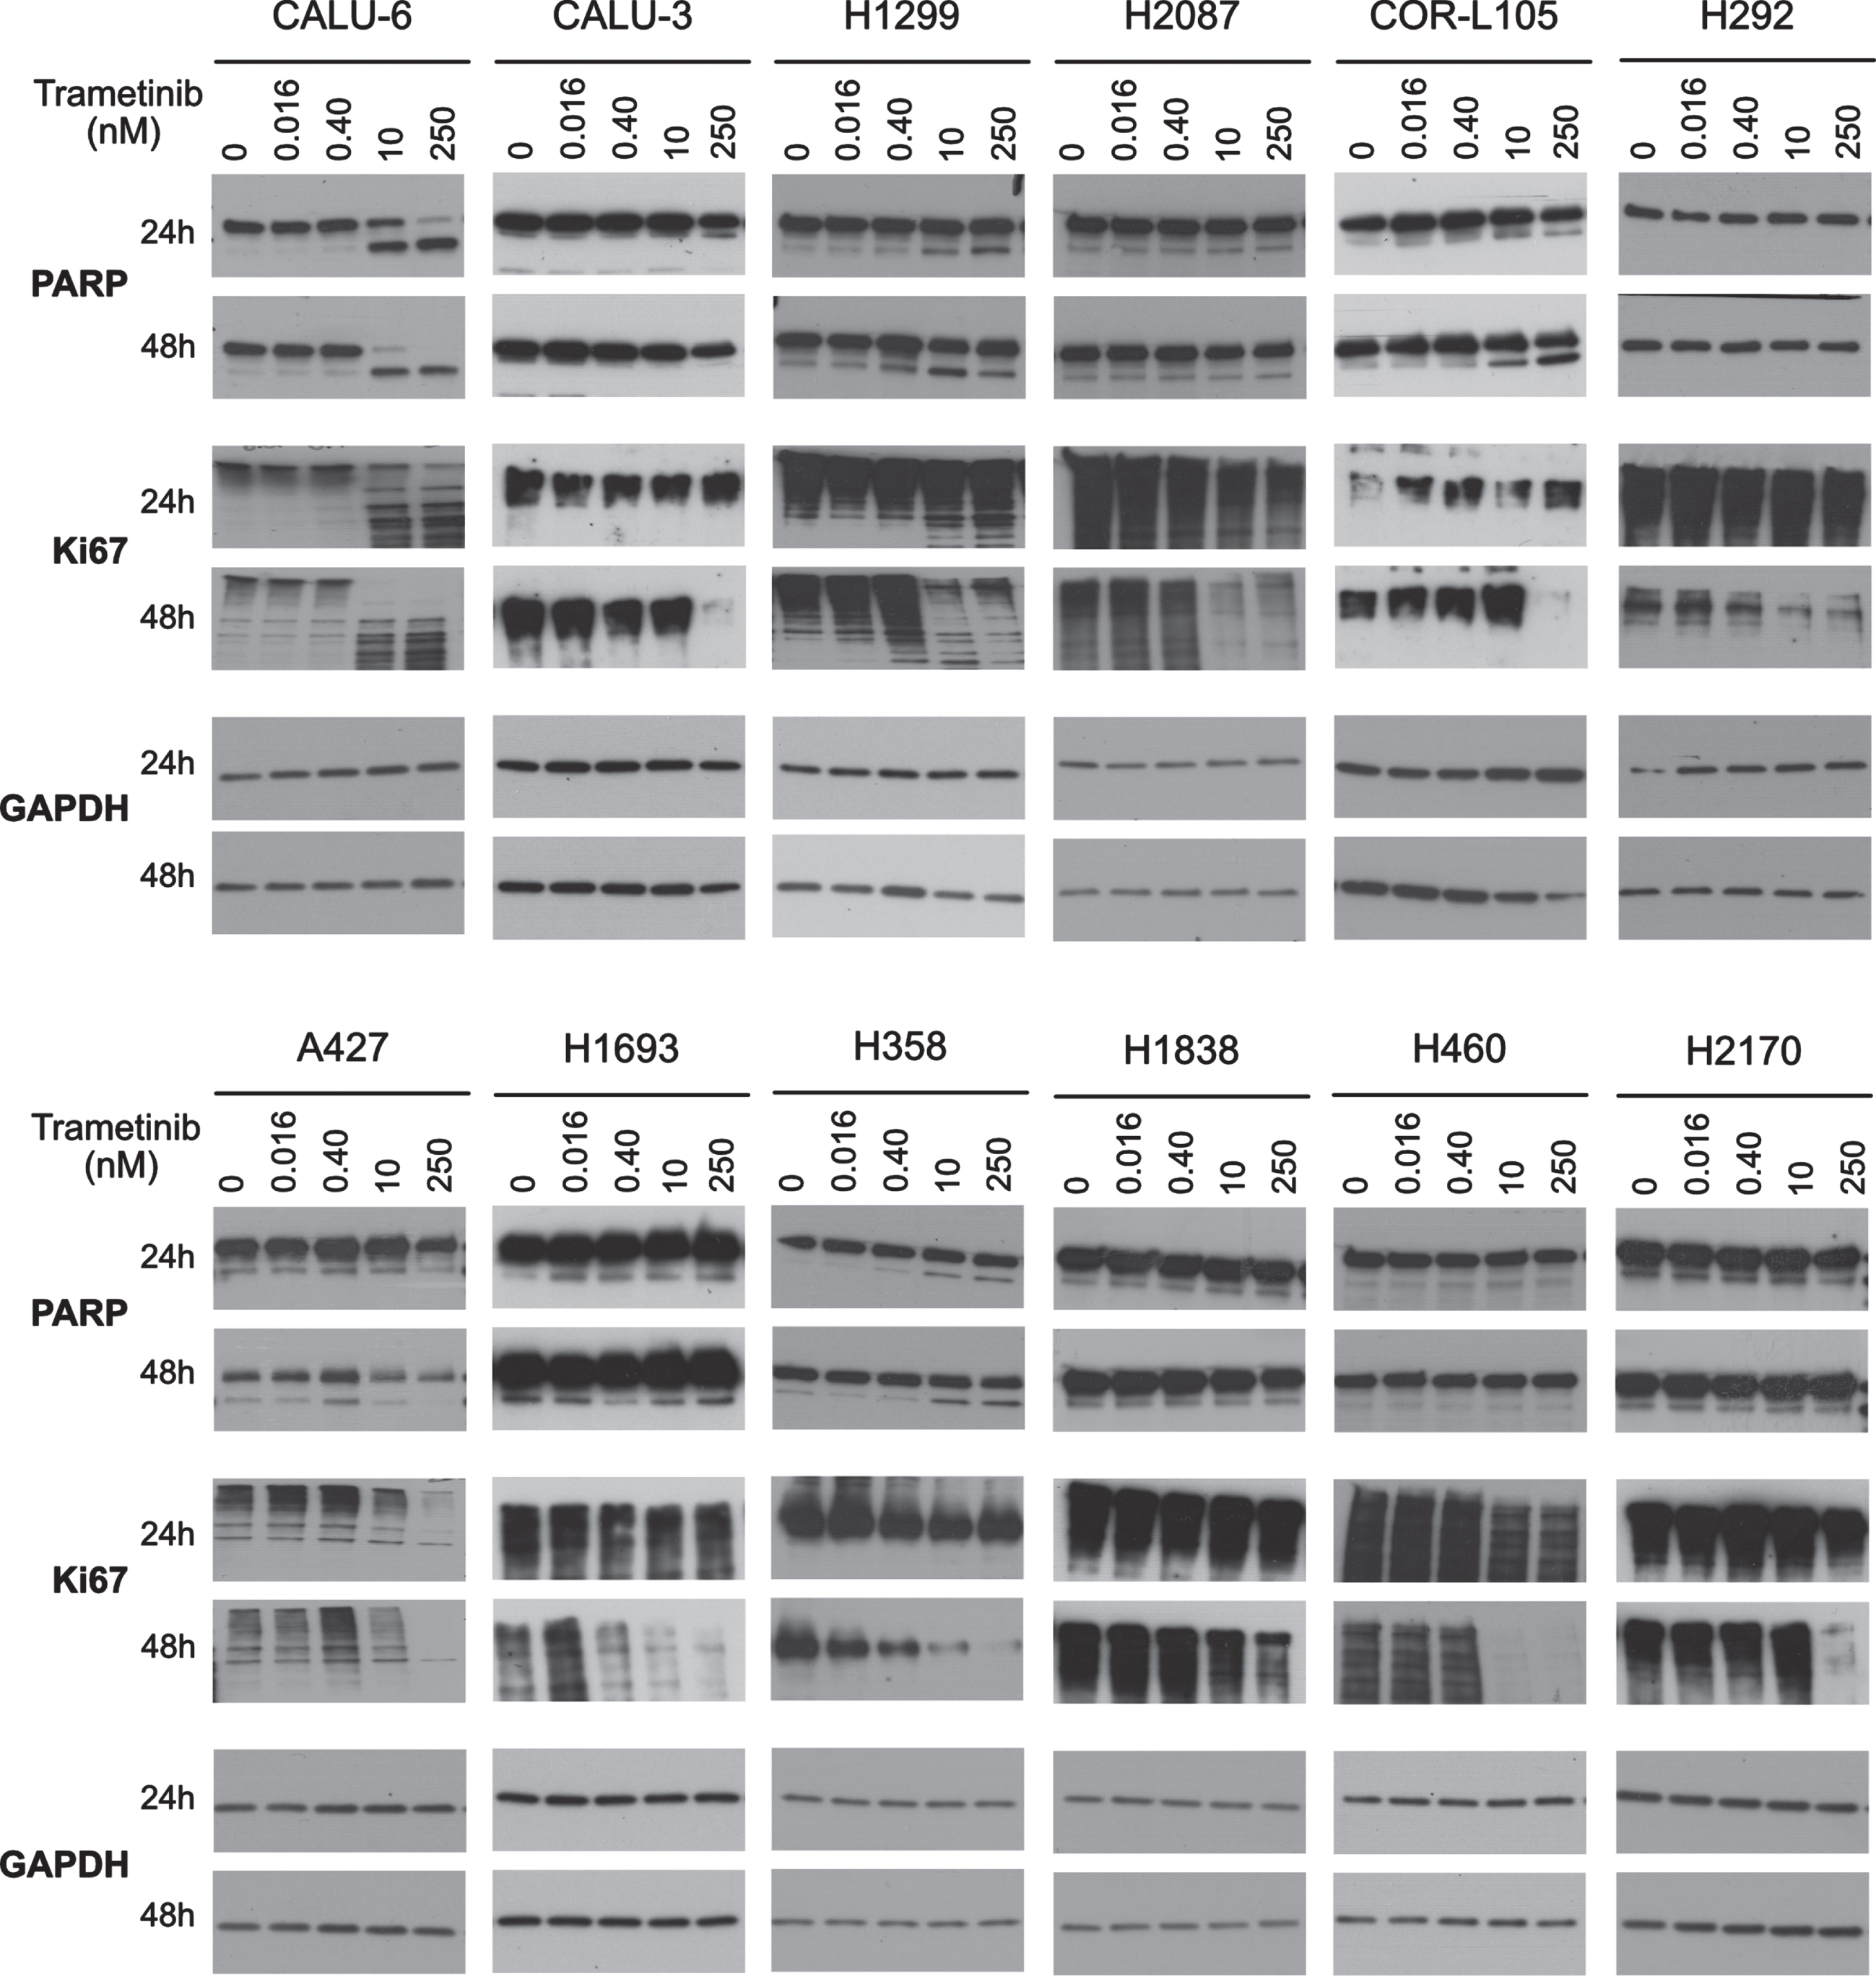
To further elucidate trametinib-induced cellular outcomes, we investigated types of cell death. First, we examined PARP cleavage to examine apoptosis induction. In CALU-6 and H1299 (highly sensitive) and H358 (moderately sensitive) cells, we observed strong dose-dependent increases of cleaved PARP (c-PARP) after 24 and 48 h trametinib treatment, but in COR-L105 (highly sensitive) the increase occurred only at 48 h (Fig. 4). Furthermore, in CALU-6 we observed caspase-3/7 cleavage (Supplementary Figure 1). In contrast, c-PARP induction was not observed in other trametinib-sensitive cell lines including CALU-3 and H2087 (highly sensitive) and A427 and H1693 (moderately sensitive). In A427, we observed moderate c-PARP induction with 0.4 nM trametinib followed by an overall decrease at higher doses. Minimally sensitive cell lines H1838 and H2170 showed no c-PARP with increasing trametinib dosing (Fig. 4).
Fig. 4
Growth inhibitory and apoptotic effects of Trametinibs. The expression of the proliferation marker Ki67 and the apoptosis marker cleaved PARP were determined by western blotting in the full panel of 12 cell lines. Cells were treated with 0, 0.016, 0.4, 10 or 250 nM trametinib for 24 h or 48 h. Six ug of protein was loaded in each lane for each sample. Equal loading of protein was determined by GAPDH. Western blot images are representative of two independent experiments.
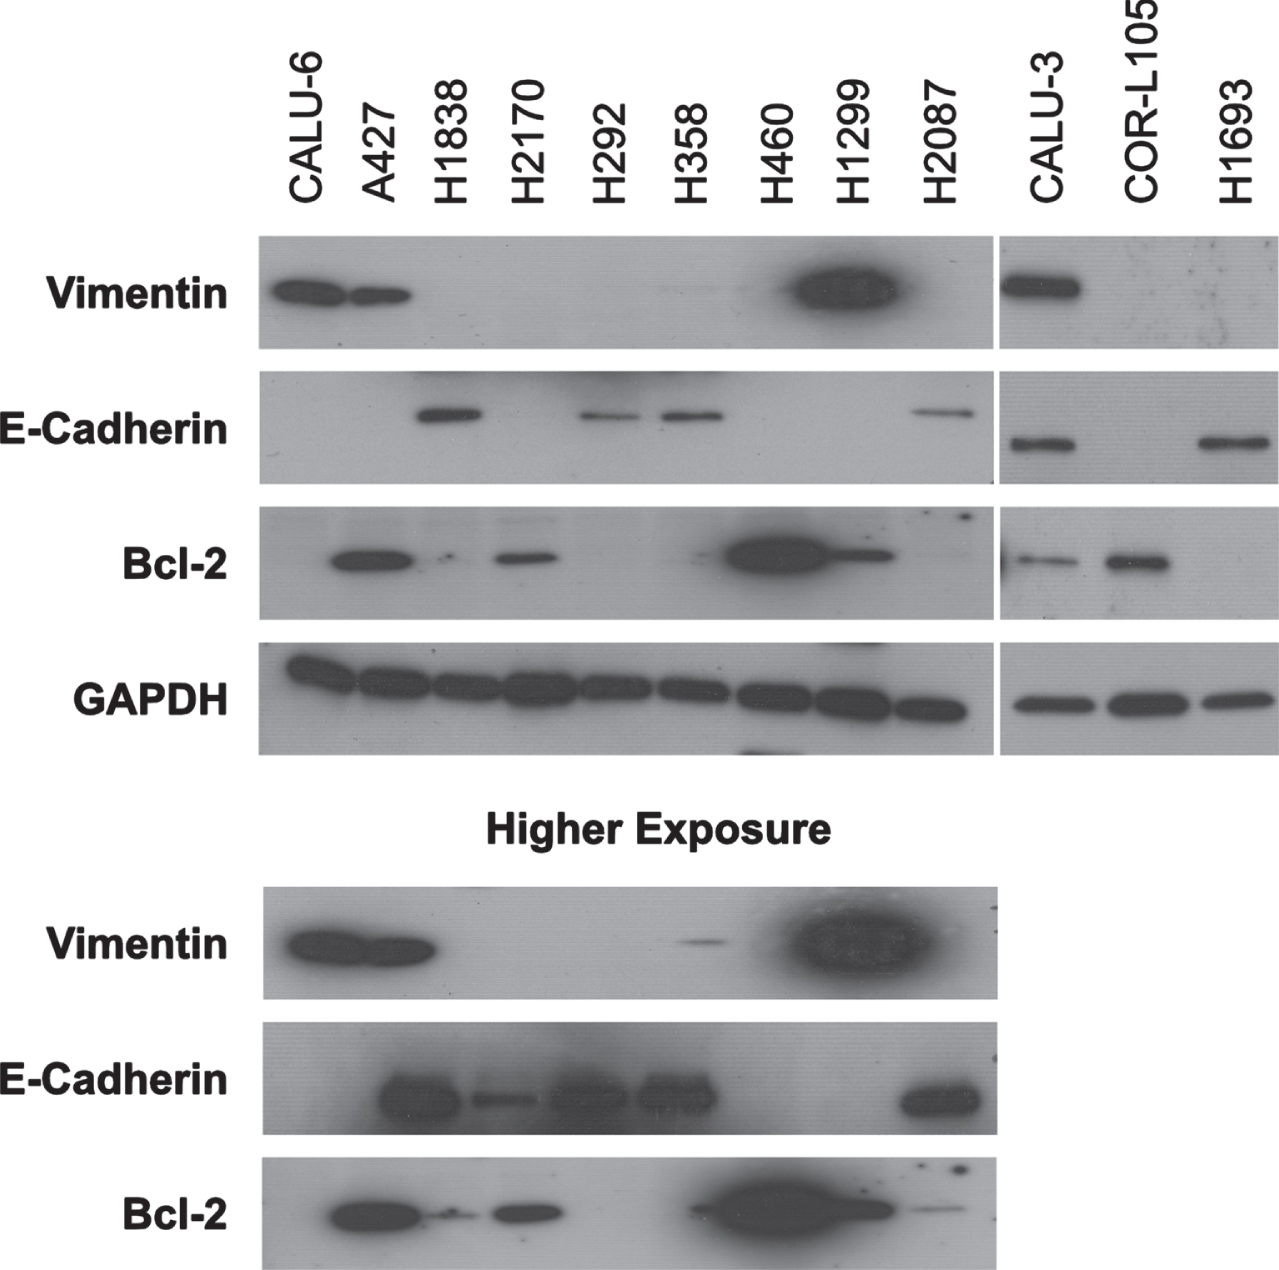
Since trametinib-induced PARP cleavage was not observed in 5 of our 9 sensitive cell lines, we investigated the possibility of the role of anti-apoptotic protein Bcl-2 and induction of necrotic cell death. We observed strong-to-moderate basal Bcl-2 expression in A427, H460, H1299, CALU-3, CORL-105 and H2170 cells, while in H2087 and H1838 we observed minimal expression (Fig. 5). Below detectable Bcl-2 expression was observed in CALU-6, H358, H1693 and H292. Bcl-2 expression levels do not indicate potential apoptotic response to trametinib in NSCLC cell lines, though it is possible that other pro-/anti-apoptotic factors play a role.
Fig. 5
Epithelial-to-mesenchymal transition (EMT) and anti-apoptotic status of NSCLC cell lines. The basal expression of EMT markers vimentin and E-cadherin and the anti-apoptotic Bcl2 protein was analyzed by western blotting of the full panel of 12 NSCLC cell lines. Equal loading of protein was determined by GAPDH. For nine cell lines, high exposure time blots are shown as needed to confirm the expression of respective proteins. Western blot images are representative of two independent experiments.
Additionally, we measured cell death using the PromoKine Apoptotic/Necrotic/Healthy Cells Detection Kit in the same four representative cell lines. After 72 h of trametinib treatment we observed a marked increase in cell death in the highly sensitive CALU-6 (+90%) and moderately sensitive A427 (+55%) cell lines but not in our minimally sensitive cell lines H1838 (0%) and H2170 (∼15%) (Supplementary Figure 2). Taken together, these data indicate that trametinib causes a strong increase in apoptotic and marginal necrotic death in sensitive lines.
3.5Trametinib induces autophagy in trametinib-resistant NSCLC cell lines
Most MTAs are known to induce cytostatic effects rather than cytotoxicity. We observed strong cytotoxic effects in our most sensitive cell line CALU-6 (Fig. 4 and Supplementary Figures 1 and 2). Since the apoptotic response in other cell lines was less pronounced, we investigated the possibility of trametinib-induced autophagy in NSCLC cell lines.
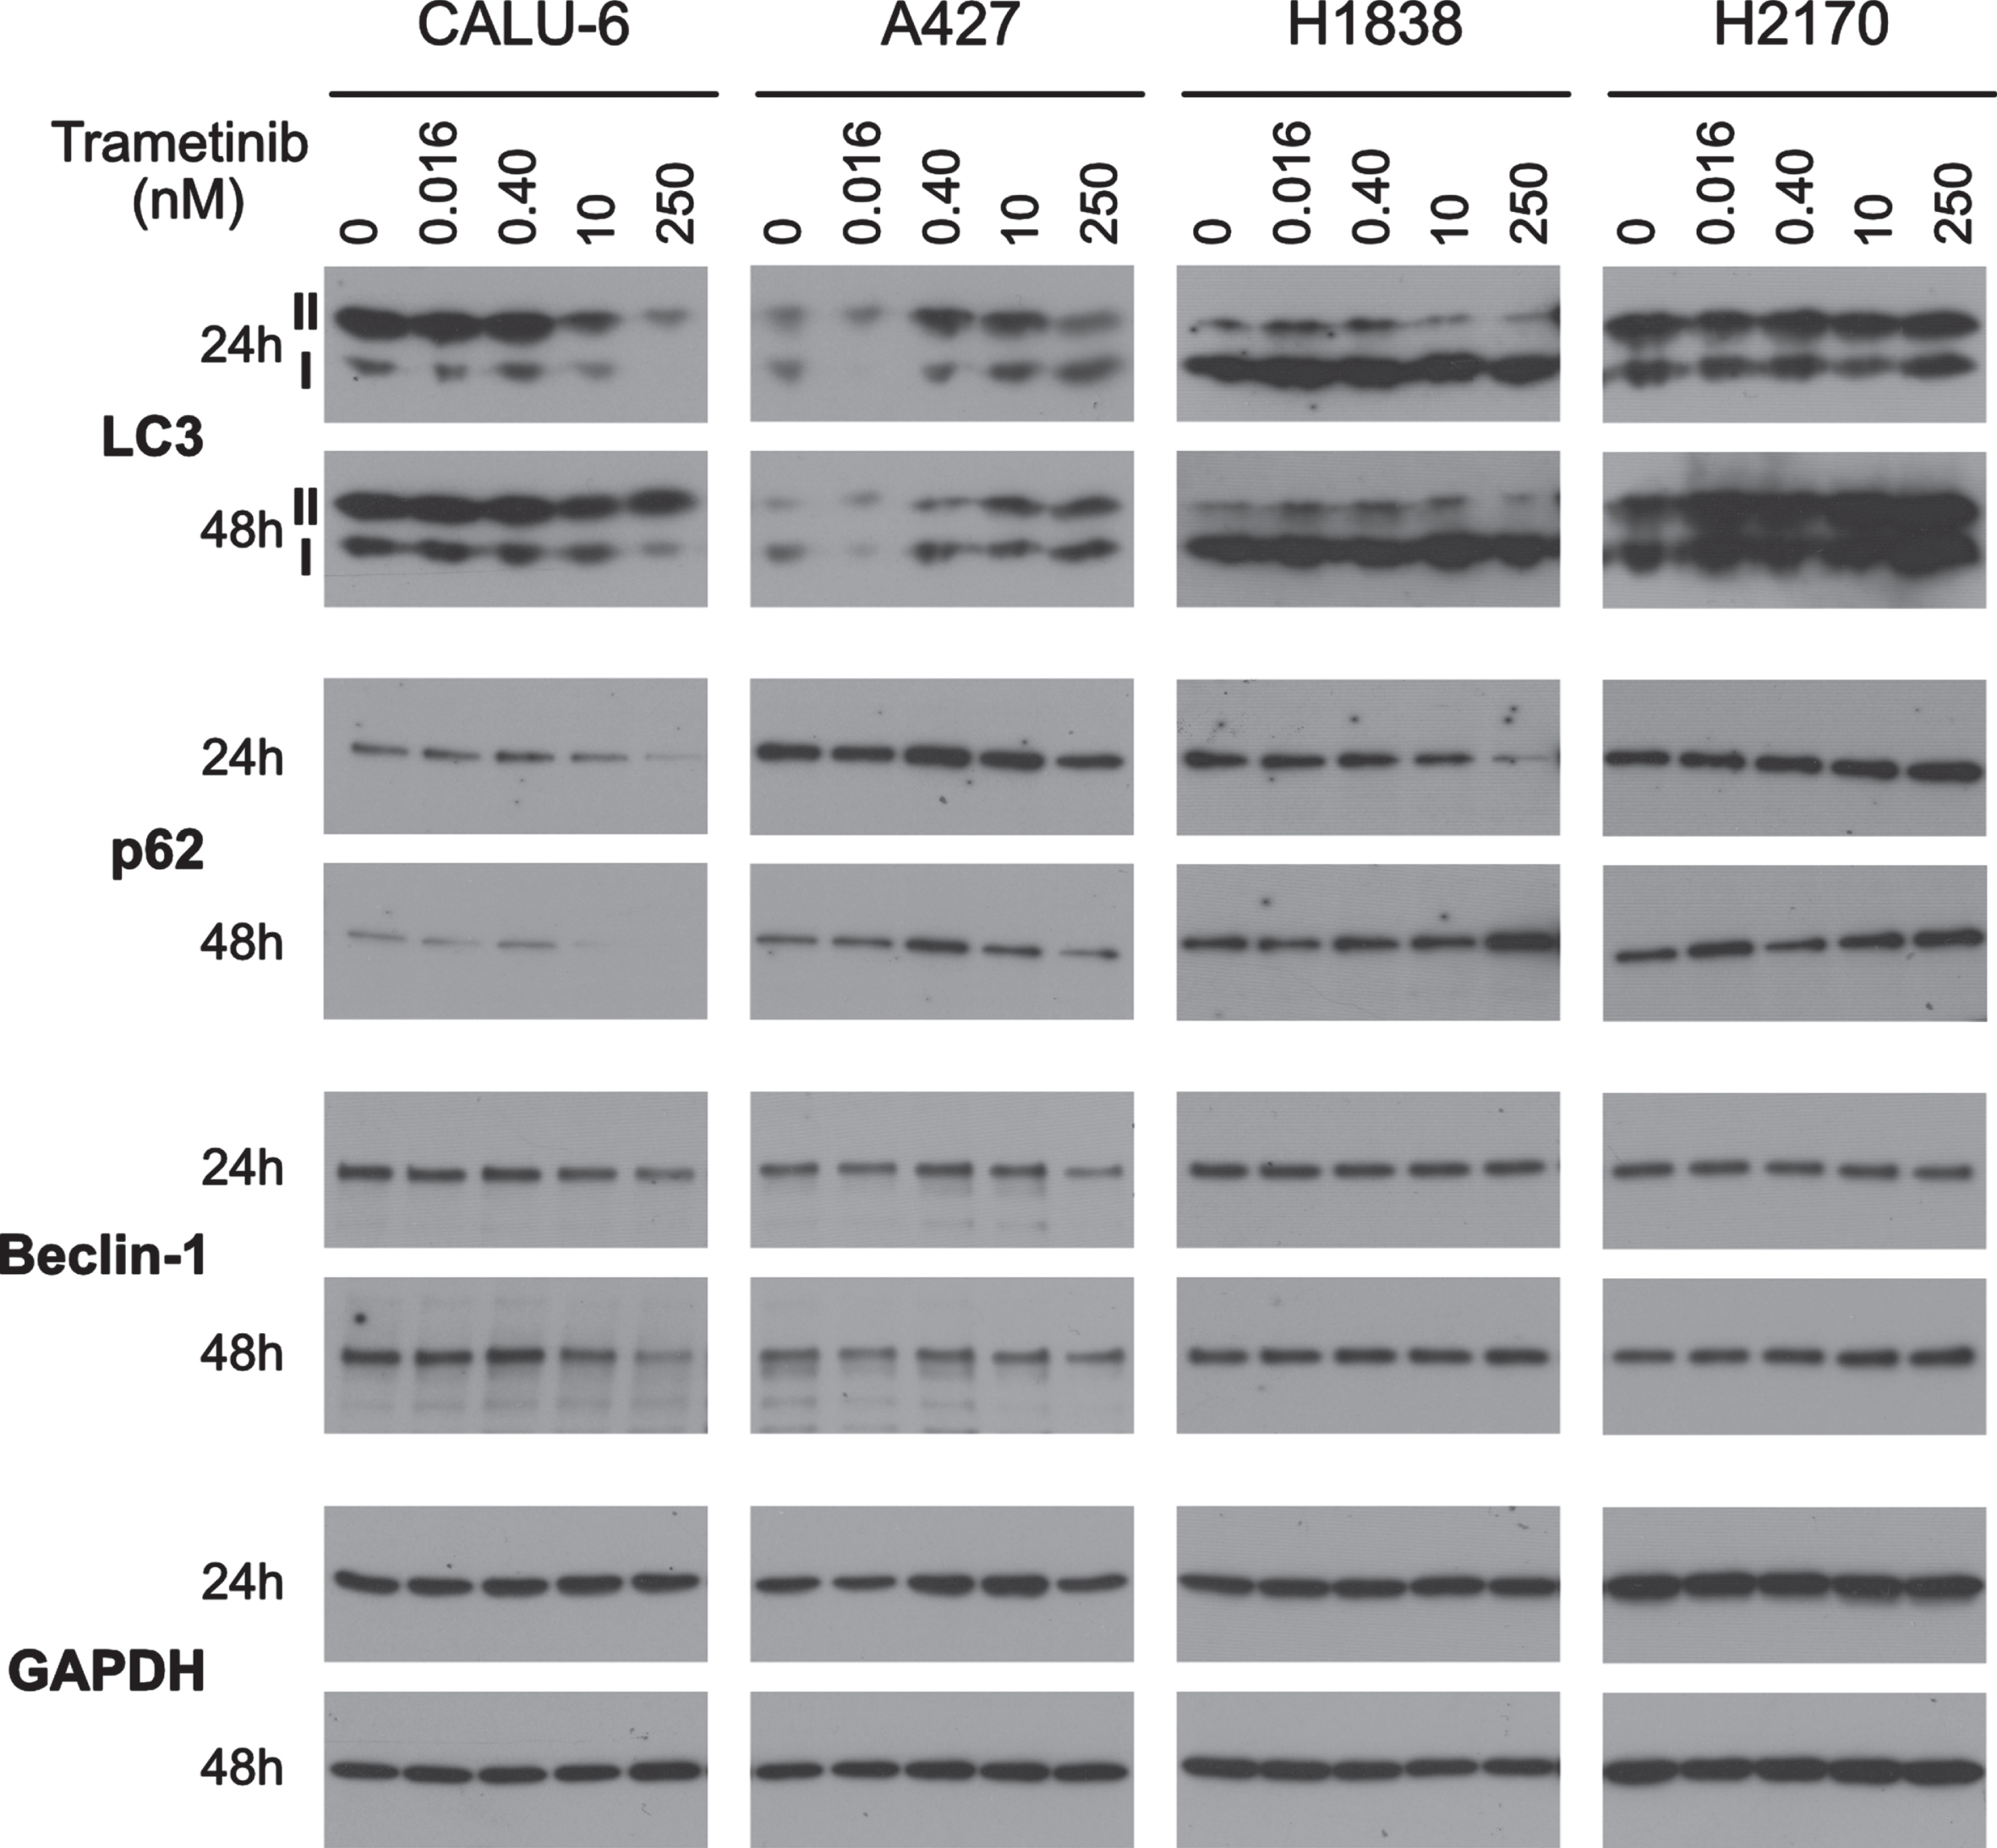
We observed no increase in LC3-II:LC3-I ratio in highly (CALU-6), moderately (A427) or minimally sensitive (H2170) cells (Fig. 6). Minimally sensitive H1838 cells showed a dose-dependent increase in LC3-II:LC3-I ratio. H1838 had significantly higher levels of LC3-II over LC3-I in our untreated control. Furthermore, in H1838, p62 levels were downregulated with 250 nM trametinib at 24 h indicating a state of autophagic flux, yet at 48 h p62 increased, indicating autophagy inhibition. We did not observe dose- or time-dependent changes in autophagy marker Beclin-1 expression in H1838, H2170 or A427 cells with trametinib. In CALU-6, Beclin-1 was slightly downregulated with 250 nM trametinib at both 24 and 48 h (Fig. 6). This result is consistent with apoptosis marker c-PARP response in CALU-6 (Fig. 4).
Fig. 6
Autophagy as a protective mechanism against trametinib. Autophagy flux (LC3 and p62) and initiation (Beclin 1) was determined by performing immunoblotting of one highly sensitive (CALU-6), one moderately sensitive (A427) and two minimally sensitive (H1838 & H2170) cell lines. Cells were treated with 0, 0.016, 0.4, 10 or 250 nM trametinib for 24 or 48 h. Six ug of protein was loaded in each lane for each sample. Equal loading of protein was determined by GAPDH. Western blot images are representative of two independent experiments.
3.6Epithelial-to-mesenchymal transition (EMT) does not predict trametinib sensitivity
EMT plays a role in resistance to MTAs in cancer including MEK inhibitors in KRAS mutated lung cancers [10]. To determine if EMT status is predictive of trametinib response, we examined the expression of vimentin and E-cadherin. In highly sensitive CALU-6, CALU-3, H1299 and moderately sensitive A427, we detected strong vimentin expression, indicative of mesenchymal characteristics (Fig. 5). In the highly (H2087, CALU-3 and H292), moderately (H1693 and H358), and minimally sensitive (H1838 and H2170) cell lines we observed strong E-cadherin expression (Fig. 5), indicating an epithelial characteristic. Interestingly, CALU-3 strongly expressed both EMT markers indicating the possibility of a heterogenous cell population. Neither marker was detected in H460 cells, potentially due to detection limits (Fig. 5). Cell lines with epithelial characteristic have varied responses from highly to minimally sensitive to trametinib. These data indicate EMT status cannot predict trametinib response.
3.7Ki67 does not predict trametinib sensitivity
Static Ki67 abundance is a well-known cell proliferation marker in cancer and clinical trials have used Ki67 expression as a biomarker for trametinib response [15]. We examined Ki67 expression following trametinib treatment using western blot and ICC. In trametinib-sensitive CALU-6 and H1299 cells at 24 and 48 h treatment, we observed a strong dose-dependent decrease in Ki67 expression, as well as a clear protein degradation pattern by western blot (Fig. 4). Highly sensitive H2087, moderately sensitive A427 and minimally sensitive H460 showed downregulation of Ki67 expression at higher trametinib doses at 24 and 48 h without protein degradation pattern (Fig. 4). Meanwhile, highly sensitive H292 and moderately sensitive H1693 and H358 showed effective downregulation of Ki67 from 0.4nM onwards at 48 h. Interestingly, in highly sensitive CALU-3 and COR-L105, and minimally sensitive H1838 and H2170, we observed similar decreases in Ki67 with 250 nM trametinib dose only at 48 h (Fig. 4).
We performed ICC staining in the representative cell lines after trametinib treatments to confirm western blot data. In CALU-6 and A427 there were very few surviving cells with a fraction of them Ki67 positive with 250 nM trametinib at 48 h. H1838 showed a marginal decrease in total surviving cells with 250 nM at 48 h. H2170 showed little change upon treatment. This ICC Ki67 expression data was consistent with our western blot data (Supplementary Figure 3). These data indicate that Ki67 response is not predictive of overall trametinib response.
3.8Trametinib activates AKT and therapy-induced senescence
AKT is a downstream effector of both EGFR and RAS signaling through the PI3K/AKT pathway and involved in promoting cell survival and senescence. MEK inhibitors are known to induce compensatory AKT activity as a cell survival mechanism [16, 17]. To better elucidate potential cell survival mechanisms or therapy induced senescence following trametinib treatment, we examined the expression of key markers of the PI3K/AKT pathway.
Highly sensitive CALU-3 and H2087, moderately sensitive H1693 and H358, as well as minimally sensitive H1838, H460 and H2170 showed dose-dependent increases in AKT phosphorylation (p-AKT) (Fig. 7). Slight differences were evident with the highly sensitive CALU-6 and moderately sensitive A427 which showed a sudden and abrupt increase in p-AKT expression at 10 nM (at 24 and 48 h) and 250 nM (at 48 h) trametinib, respectively. We did not see strong increases in p-AKT in highly sensitive H1299, COR-L105 or H292 (Fig. 7). This suggests that p-AKT modulation following trametinib treatment is complex and an unsuitable standalone predictive biomarker.
Fig. 7
Effects of trametinib on PI3K/AKT/mTOR pathway. The expression of the cell survival signaling protein phosphorylated AKT and growth regulation (phosphorylated 4EBP1), were determined by western blotting in the full panel of 12 cell lines using varied concentrations of trametinib at 24 or 48 h. Six μg of protein was loaded in each lane for each sample. Equal loading of protein was determined by GAPDH. Western blot images are representative of two independent experiments.
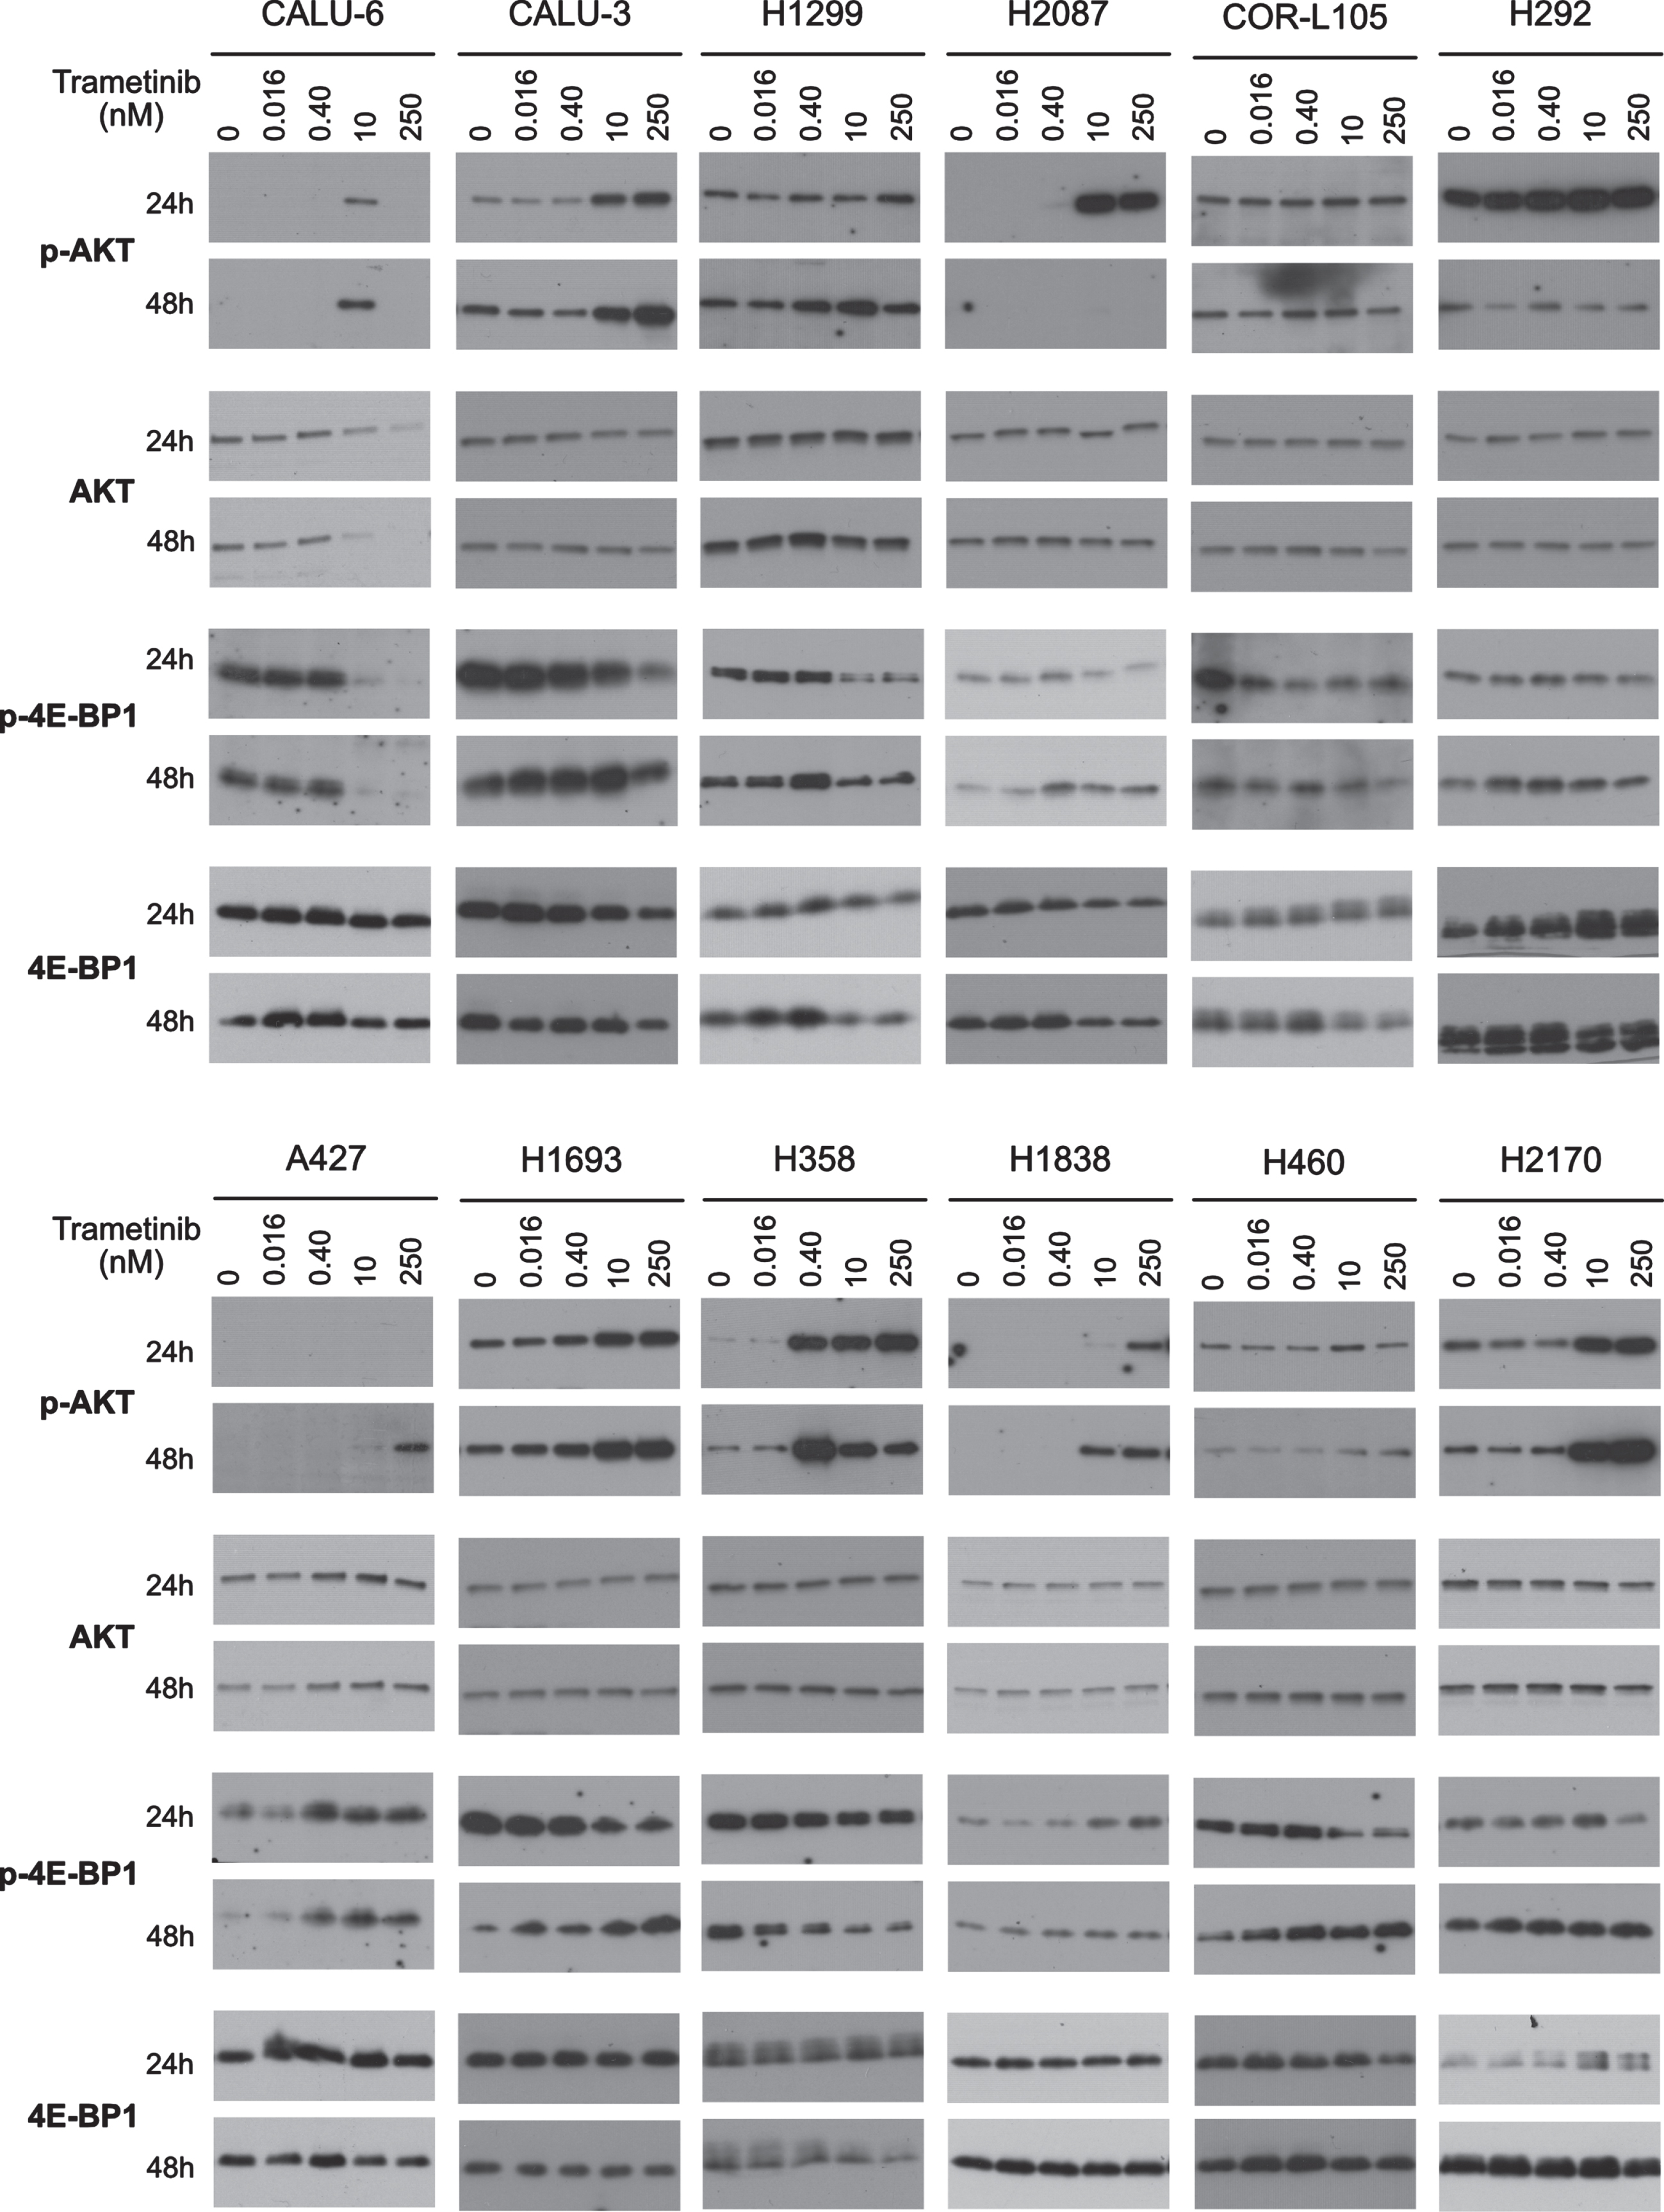
Being downstream of PI3K/AKT, we also studied the mTOR pathway effector protein 4E-BP1. In highly sensitive CALU-6, CALU-3, COR-L105 and moderately sensitive H358 we observed a marked decrease in phospho-4E-BP1 (Ser70) (p-4E-BP1) with increasing trametinib dosing at 24 and 48 h (Fig. 4). In moderately sensitive A427 and minimally sensitive H1838, we observed an increase in p-4E-BP1 expression with increasing trametinib at 24 and 48 h. Interestingly, in highly sensitive H1299, H292, H2087, moderately sensitive H1693 and minimally sensitive H460, we observed a dose dependent decrease of p-4E-BP1 at 24 h and an increase at 48 h, indicating senescence was induced (Fig. 7). Minimally sensitive H2170 expressed consistently high levels of p-4E-BP1 at 48 h with and without trametinib. Downregulation of p-ERK is known to cause G1/S-phase cell cycle arrest of cancer cells; in response to this, a compensatory AKT/mTOR pathway activation, which induces protein synthesis, would suggest a senescent characteristic [18]. Based on that, our parallel analysis of p-4E-BP1 responses can predict a cytostatic response following trametinib treatment. To measure trametinib-induced senescence, we performed β-galactosidase assay staining. In moderately sensitive H1693 and minimally sensitive H460 cells we observed a marked increase in β-galactosidase staining with 250 nM trametinib at 72 h. Surprisingly, in highly sensitive H1299 cells, which showed only marginal increase in p-4E-BP1 expression at 48 h, were distinctly positive for β-galactosidase (Supplementary Figure 4). Many p-4E-BP1 expressing cell lines like H2087, H292, A427 and H1838 did not show this senescence characteristic by β-galactosidase staining (Supplementary Figure 4). However, it is possible that therapy-induced senescent cells may not show β-galactosidase staining based on reports describing an increase in lysosomal content through many cell divisions cause β-galactosidase staining in senescent cells [19, 20]. It is also possible that our cell lines, based on unique cellular contexts, may not all commit to senescence. Altogether, these data indicate that trametinib causes primarily a cytostatic effect in NSCLC cell lines.
4Discussion
EGFR and MAPK pathways are highly exploited for targeted cancer therapies. Various MTAs against MAPK pathway targets BRAF, MEK and KRAS have been developed and FDA-approved [21–25]. These MTAs are prescribed to patients only with identifiable driver mutations (e.g. dabrafenib and trametinib for BRAF V600E mutations [21] and sotorasib for KRAS G12 C [25]), which limits overall utility by excluding large majorities of patients who present with driver-negative tumors, but may be responsive. Thus, the work described herein, was undertaken to explore the possibility of broadening the use of trametinib in biomarker negative patients. In NSCLC, trametinib is only approved in combination with dabrafenib in BRAF V600E mutant patients and cannot be used as a monotherapy [6]. MEK inhibitors appear effective against NRAS mutant NSCLC cell lines [9]. Furthermore, receptor tyrosine kinases (RTKs; EGFR/ERBB3/FGFR1, etc.), feed overactive RAS/RAF/MEK pathway signaling in many tumors. Therefore, biomarkers capable of predicting response to downstream inhibitors of MEK would be useful [26]. To improve current treatment options, it is imperative to elucidate trametinib response mechanisms as well as improve methods to identify trametinib-sensitive patients which may be overlooked using the current FDA-approved tests [21].
To meet these needs, we explored the utility of trametinib in BRAF wild-type NSCLC cell lines with varied KRAS/NRAS mutation status. It is noteworthy that our CFA data show that four of six BRAF/KRAS/NRAS wildtype NSCLC cell lines are moderately-to-highly sensitive to trametinib monotherapy. Five of six BRAF wildtype cell lines with KRAS or NRAS mutations are moderately-to-highly sensitive to trametinib monotherapy, suggesting trametinib can be effective irrespective of KRAS/NRAS status. Based on this, trametinib as a monotherapy or in combination may be of use to a wider population of NSCLC patients, not only those who have the V600E BRAF mutation identified by current tests.
Trametinib has been shown to inhibit the cell cycle at the G1/S-phase by inhibiting cyclin D1 expression through the RAS/MEK/ERK pathway and/or inducing p27KIP1 expression, thereby inhibiting cyclin D-Cdk4/6, cyclin E-Cdk2 and cyclin A-Cdk2 signaling complexes [12, 13]. In our cell lines, we found that trametinib universally inhibited ERK phosphorylation (Fig. 2) and induced greater p27KIP1 expression (Fig. 3) irrespective of KRAS/NRAS status or overall sensitivity measured by CFA (Fig. 1). Additionally, we observed dose-dependent downregulation of cyclin D1 (Fig. 3) and inhibition of pRb phosphorylation (Supplementary Figure 1), a key downstream effector of cyclin D-CDK4/6 and cyclin E-CDK2 complexes. These data confirm trametinib’s potent induction of cell cycle arrest irrespective of mutational status or sensitivity. Consistently, we observed downregulation of key cell proliferation marker Ki67 in all cell lines in our study, most prominently at 48 h trametinib treatment. Taken together, this indicates that trametinib blocks proliferation and induces cell cycle arrest at the G1/S-phase through the inhibition of ERK phosphorylation in all studied cell lines irrespective of overall trametinib sensitivity. None of the biomarkers tested (p-ERK, p27 KIP1, cyclin D1, or Ki67) would serve as standalone predictive markers of trametinib response.
We observed an increase in caspase 3/7-mediated PARP cleavage, a hallmark of apoptosis induction, in four of nine highly and moderately trametinib-sensitive cell lines (CALU-6, H1299, COR-L105 and H358). These cell lines had varied KRAS/NRAS mutational status. Also, trametinib-induced proteasomal degradation of Ki67 in CALU-6 and H1299 is in accordance with apoptosis induction. However, we did not observe apoptosis marker induction in all trametinib-sensitive NSCLC cell lines. This may be attributable to intrinsic resistance mechanisms [27], non-apoptotic cell death mechanisms [28] and/or a cytostatic effect [29].
Anti-cancer agents initially cause cytostatic effects and depending upon the cellular context and cell cycle phase, they can remain cytostatic or proceed to cytotoxicity [30]. Cancer cells may have intrinsic or adaptive resistance mechanisms against the anti-cancer therapies and Bcl-2 family members are known to contribute to this through MEKi and PI3Ki combination therapy [31]. Furthermore, survival pathways (e.g. NF-κ β, PI3K/AKT/mTOR) may facilitate anti-apoptotic responses to MTAs by regulating Bcl-2 family members [32, 33]. Upon examining Bcl-2 expression in our cell line panel, we found that highly and moderately sensitive cell lines (CALU-6 and H358) had no detectable Bcl-2 expression, in parallel with induction of apoptotic marker c-PARP, indicating trametinib causes cytotoxicity in these cells. In contrast, in highly sensitive H1299 and COR-L105 cells we observed comparatively moderate Bcl-2 expression, along with moderate c-PARP induction, suggesting induction of pro-apoptotic factors in a more heterogenous manner. However, recent reports indicate that MEKi can trigger apoptosis by inducing the pro-apoptotic protein PUMA [34] and through knockdown of the anti-apoptotic proteins MCL1 and BCL-XL [35]. Interestingly in our study, some cell lines failed to show apoptotic marker induction with trametinib treatment even in the absence of Bcl-2 expression. It is possible that other anti-apoptotic proteins like MCL1 or BCL-XL could be inhibiting trametinib-induced apoptosis. Of note, moderately trametinib-sensitive A427 cells exhibit high basal Bcl-2 expression, and we did not observe apoptotic molecular changes following treatment. This indicates that trametinib does not induce cell death with highly organized apoptotic events exclusively and, instead, the type of cell death responses may be cellular context-dependent. We cannot rule out the possibility that trametinib may induce necroptosis [28].
Further, we studied the role of autophagy in intrinsic resistance to trametinib in NSCLC. Following trametinib treatment in a minimally sensitive cell line (H1838), we observed an induction of autophagic flux through modulation of the LC3II:LC3I ratio and decrease in p62 expression. This confirms results from other studies in which protective autophagic states are triggered by similar inhibitors of RAF/MEK in RAS-driven cancers [36]. Contrastingly, highly sensitive cells, like CALU-6, which commit to apoptosis following trametinib treatment, may use caspase 3/7 to degrade Beclin-1 and block a potential autophagic recovery route.
Most MEKi induce adaptive kinome responses, which can override and weaken the effects of their direct anti-cancer action. These adaptive responses, mainly through RTK activity, occur due to reduced feed-back inhibition by MEK and can rewire signaling through cytoskeleton mechanisms and/or the PI3K/AKT pathway, leading to increased cell survival signaling [16, 17]. Consistently with a recent report, we observed almost universal upregulation of AKT phosphorylation after trametinib treatment irrespective of EMT characteristics [10]. This may suggest primary or adaptive resistance occurring through RTK-mediated AKT activation. Surprisingly, we observed AKT activation in response to trametinib in 10 out of 12 cell lines yet still observed consistent downregulation of cyclin D1 and Ki67 in all, suggesting survival without compensatory proliferation.
We did not observe hallmarks of cytotoxicity in many highly and moderately trametinib-sensitive NSCLC lines, so we expanded our study to include markers of cytostasis. A recent study showed that trametinib-induced senescence in melanoma and a combination of trametinib and radiation therapy resulted in senescence and cytotoxicity [37]. Similarly, in our study we observed therapy-induced senescence. In highly sensitive cell lines, we found that trametinib caused either a cytotoxic effect, by apoptotic or non-apoptotic cell death, or in moderately and minimally sensitive cell lines a cytostatic effect, by inducing p-4E-BP1. Many cell lines from highly-to-moderately-to-minimally sensitive cell lines did not show high c-PARP levels and instead may be entering cellular senescence; this is evident from the observed increase in p-4E-BP1 expression. We observed confirmatory β-galactosidase activity in H1299, H1693 and H460 cell lines. Highly sensitive H1299 cells showed a strong p-4E-BP1 increase with positive β-galactosidase, but also strong c-PARP following trametinib treatment, suggesting simultaneous cytotoxic and cytostatic (senescent)-type responses. This may be attributable to heterogeneity in H1299. Other studies have shown that therapy-induced senescence and cytotoxicity can be present simultaneously in some cells. In this context, trametinib may be useful in immune surveillance or in combination with senolytic compounds [38, 39].
In summary, our data show that in EGFR/BRAF wild-type NSCLC, trametinib induces a myriad of response mechanisms including cytotoxic-apoptotic or non-apoptotic cell death, resistant autophagy, proliferation inhibition, and/or senescence, depending upon cellular context. In eight out of nine of our trametinib-sensitive cell lines we observed distinct biomarker changes which suggest cytotoxic and/or cytostatic responses likely based upon cellular context rather than RAS genetic status. Our data suggest that for NSCLC, trametinib may be most effective in combination with other anti-cancer agents such as senolytic drugs, Bcl-2 inhibitors or other parallel pathway targeting drugs such as PI3K/AKT inhibitors for NSCLC to achieve significant cytotoxic anti-tumor responses. Importantly, our data do suggest that tumor cells like CALU-6, due to cellular context, are clear candidates for trametinib monotherapy even in the absence of BRAF V600E mutation. Cells like H292 and COR-L105 with wild-type KRAS and BRAF are also sensitive to trametinib monotherapy and show cytostatic or cytotoxic responses respectively, based on their cellular context. Current FDA-approved companion diagnostics using BRAF mutational status exclude such cases from trametinib candidacy, which could impact patient care. Finally, our data indicate that the dynamic biomarkers described here could be utilized to predict response to those combination therapies.
Acknowledgments
The present work was supported by NIH/NCI SBIR Phase I and II grants R44CA203068. We thank the team members of BioMarker Strategies, LLC, Marika Xydes Smith, Jeffrey Blazar, Diana Fleischer, Kristin Harwood, Amy James, Dr. Alexandrine Derrien-Colemyn, Dr. Meena Chandok, Dr. Selvan Senthamil, and Jerry Parrott for their insights, assay development, comments, discussion and administrative support during the planning and course of this work.
Author contributions
CONCEPTION: Palak R. Parekh and Greg P. Bertenshaw
DATA CURATION: Palak R. Parekh, Denise B. Thurber, Gregory M. Botting, Marika Boruszczak, and William Murphy
ANALYSIS OF DATA: Palak R. Parekh
PREPARATION OF THE MANUSCRIPT: Palak R. Parekh, Gregory M. Botting, and Greg P. Bertenshaw
REVISION FOR IMPORTANT INTELLECTUAL CONTENT: Palak R. Parekh, Denise B. Thurber, Gregory M. Botting, Marika Boruszczak, William Murphy, and Greg P. Bertenshaw
SUPERVISION: Palak R. Parekh and Greg P. Bertenshaw
Conflict of interest
Palak R. Parekh, Gregory M. Botting, William Murphy, and Marika Boruszczak are previous employees of BioMarker Strategies, LLC. Denise B. Thurber, and Greg P. Bertenshaw are current employees of BioMarker Strategies, LLC. As such, all authors have stock options in the company.
Supplementary material
[1] The supplementary material is available in the electronic version of this article: https://dx.doi.org/10.3233/TUB-220009.
References
[1] | Centers for Disease Control and Prevention [Internet]. An Update on Cancer Deaths in the United States; [updated 2022 Feb 28; cited 2022 Oct 6]. Available from: https://www.cdc.gov/cancer/dcpc/research/update-on-cancer-deaths/index.htm |
[2] | American Cancer Society [Internet]. Key Statistics for Lung Cancer; [updated 2022 Feb 14; cited 2022 Oct 6]. Available from: https://www.cancer.org/cancer/lung-cancer/about/key-statistics.html |
[3] | Sung H , Ferlay J , Siegel RL , Laversanne M , Soerjomataram I , Jemal A , et al. Global Cancer Statistics 2020: GLOBOCAN Estimates of Incidence and Mortality Worldwide for 36 Cancers in 185 Countries. CA: A Cancer Journal for Clinicians. (2021) ;71: (3):209–49. doi: 10.3322/caac.21660 |
[4] | World Health Organization [Internet]. Cancer; [updated 2022 Feb 03; cited 2022 Oct 6]. Available from: https://www.who.int/news-room/fact-sheets/detail/cancer |
[5] | American Cancer Society [Internet]. About Lung Cancer; [updated 2019 Oct 01; cited 2022 Mar 10]. Available from: https://www.cancer.org/cancer/lung-cancer/about/what-is.html |
[6] | U.S. Food & Drug Administration. FDA grants regular approval to dabrafenib and trametinib combination for metastatic NSCLC with BRAF V600E mutation [Internet]. [updated 2017 Jun 22; cited 2022 Oct 6]. Available from: https://www.fda.gov/drugs/resources-information-approved-drugs/fda-grants-regular-approval-dabrafenib-and-trametinib-combination-metastatic-nsclc-braf-v600e |
[7] | Alvarez JGB , Otterson GA . Agents to treat BRAF-mutant lung cancer. Drugs Context. (2019) ;8: :212566. doi: 10.7573/dic.212566 |
[8] | American Lung Association. BRAF and Lung Cancer. [updated 2021 Oct 28; cited 2022 Mar 10]. Available from: https://www.lung.org/lung-health-diseases/lung-disease-lookup/lung-cancer/learn-about-lung-cancer/how-is-lung-cancer-diagnosed/lung-cancer-tumor-testing/braf |
[9] | Ohashi K , Sequist LV , Arcila ME , Lovely CM , Chen X , Rudin CM , et al. Characteristics of lung cancers harboring NRAS mutations. Clin Cancer Res. (2013) ;19: (9):2584–91. doi: 10.1158/1078-0432.CCR-12-3173 |
[10] | Kitai H , Ebi H , Tomida S , Floros K V , Kotani H , Adachi Y , et al. Epithelial-to-mesenchymal transition defines feedback activation of receptor tyrosine kinase signaling induced by MEK inhibition in KRAS-mutant lung cancer. Cancer Discov. (2016) ;6: (7):754–69. doi: 10.1158/2159-8290.CD-15-1377 |
[11] | Franken NAP , Rodermond HM , Stap J , Haveman J , van Bree C . Clonogenic assay of cells in vitro. Nature Protocols. (2006) ;1: (5):2315–9. doi: 10.1038/nprot.2006.339 |
[12] | Yamaguchi T , Yoshida T , Kurachi R , Kakegawa J , Hori Y , Nanayama T , et al. Identification of JTP-2, a p15INK4b-inductive compound, as a novel MEK1/2 inhibitor. Cancer Sci. (2007) ;98: (11):1809–16. doi: 10.1111/j.1349-7006.2007.00604.x |
[13] | Watanabe M , Sowa Y , Yogosawa M , Sakai T . Novel MEK inhibitor trametinib and other retinoblastoma gene (RB)-reactivating agents enhance efficacy of 5-fluorouracil on human colon cancer cells. Cancer Sci. (2013) ;104: (6):687–93. doi: 10.1111/cas.12139 |
[14] | King AJ , Arnone MR , Bleam MR , Moss KG , Yang J , Fedorowicz KE , et al. Dabrafenib; preclinical characterization, increased efficacy when combined with trametinib, while BRAF/MEK tool combination reduced skin lesions. PLoS One. (2013) ;8: (7):e67583. doi: 10.1371/journal.pone.0067583 |
[15] | Infante JR , Fecher LA , Falchook GS , Nallapareddy S , Gordon MS , Becerra C , et al. Safety, pharmacokinetic, pharmacodynamic, and efficacy data for the oral MEK inhibitor trametinib: A phase 1 dose-escalation trial. Lancet Oncol. (2012) ;13: (8):773–81. doi: 10.1016/S1470-2045(12)70270-X |
[16] | Mirzoeva OK , Das D , Heiser LM , Bhattacharya S , Siwak D , Gendelman R , et al. Basal subtype and MAPK/ERK kinase (MEK)-phosphoinositide3-kinase feedback signaling determine susceptibility of breastcancer cells to MEK inhibition. Cancer Res. (2009) ;69: (2):565–72. doi: 10.1158/0008-5472.CAN-08-3389 |
[17] | Turke AB , Song Y , Costa C , Cook R , Arteaga CL , Asara JM , et al. MEK inhibition leads to PI3K/AKT activation by relieving a negative feedback on ERBB receptors. Cancer Res. (2012) ;72: (13):3228–37. doi: 10.1158/0008-5472.CAN-11-3747 |
[18] | Blagosklonny MV . Cell cycle arrest is not senescence. Aging (Albany NY). (2011) ;3: (2):94–101. doi: 10.18632/aging.100281 |
[19] | Kurz DJ , Decary S , Hong Y , Erusalimsky JD . Senescence-associated (beta)-galactosidase reflects an increase in lysosomal mass during replicative ageing of human endothelial cells. J Cell Sci. (2000) ;113: (Pt 20):3613–22. doi: 10.1242/jcs.113.20.3613 |
[20] | Cotter MA , Florell SR , Leachman SA , Grossman D . Absence of senescence-associated β-galactosidase activity in human melanocytic nevi in vivo. J Invest Dermatol. (2007) ;127: (10):2469–71. doi: 10.1038/sj.jid.5700903 |
[21] | U.S. Food & Drug Administration. MEKINIST® (trametinib) tablets, for oral use; [updated 2020 Jun; 515 cited 2022 Oct 6]. Available from: https://www.accessdata.fda.gov/drugsatfda_docs/label//14s016lbl.pdf |
[22] | U.S. Food & Drug Administration. KOSELUGO (selumetinib) capsules, for oral use; [updated 2020 Apr; cited 2022 Oct 6]. Available from: https://www.accessdata.fda.gov/drugsatfda_docs/label//56s000lbl.pdf |
[23] | U.S. Food & Drug Administration. COTELLIC® (cobimetinib) tablets, for oral use; [updated 2018 Jan; cited 2022 Oct 6]. Available from: https://www.accessdata.fda.gov/drugsatfda_docs/label//92s002lbl.pdf |
[24] | U.S. Food & Drug Administration. MEKTOVI® (binimetinib) tablets, for oral use; [updated 2019 Jan; cited 2022 Oct 6]. Available from: https://www.accessdata.fda.gov/drugsatfda_docs/label//98s001lbl.pdf |
[25] | U.S. Food & Drug Administration. LUMAKRAS™ (sotorasib) tablets, for oral use; [updated 2021 May; cited 2022 Oct 6]. Available from: https://www.accessdata.fda.gov/drugsatfda_docs/label//65s000lbl.pdf |
[26] | Kim C , Giaccone G . MEK inhibitors under development for treatment of non-small-cell lung cancer. Expert Opin Investig Drugs. (2018) ;27: (1):17–30. doi: 10.1080/13543784.2018.1415324 |
[27] | Sale MJ , Cook SJ . That which does not kill me make me stronger; combining ERK1/2 pathway inhibitors and BH3 mimetic to kill tumor cells and prevent acquired resistance. Br J 28. |
[28] | Erkes DA , Cai W , Sanchez IM , Purwin TJ , Rogers C , Field CO , et al. Mutant BRAF and MEK inhibitors regulate the tumor immune microenvironment via pyroptosis. Cancer Discov. (2020) ;10: (2):254–69. doi: 10.1158/2159-8290.CD-19-0672 |
[29] | Selvasaravanan KD , Wiederspohn N , Hadzalic A , Strobel H , Payer C , Schuster A , et al. The limitations of targeting MEK signaling in Glioblastoma therapy. Sci Rep. (2020) ;10: (1):7401. doi: 10.1038/s41598-020-64289-6 |
[30] | Rixe O , Fojo T . Is cell death a critical endpoint for anticancer therapies or is cytostasis sufficient? Clin Cancer Res. (2007) ;13: (24):7280–7. doi: 10.1158/1078-0432.CCR-07-2141 |
[31] | Hata AN , Yeo A , Faber AC , Lifshits E , Chen Z , Cheng KA , et al. Failure to induce apoptosis via BCL-2 family proteins underlies lack of efficacy of combined MEK and PI3K inhibitors for KRAS mutant lung cancers. Cancer Res. (2014) ;74: (11):3146–56. doi: 10.1158/0008-5472.CAN-13-3728 |
[32] | Barbie DA , Tamayo P , Boehm JS , Kim SY , Moody SE , Dunn IF , et al. Systematic RNA interference reveals that oncogenic KRAS-driven cancers require TBK1. Nature. (2009) ;462: (7269):108–12. doi: 10.1038/nature08460 |
[33] | Faber AC , Li D , Song Y , Liang MC , Yeap BY , Bronson RT , et al. Differential induction of apoptosis in HER2 and EGFR addicted cancers following PI3K inhibition. Proc Natl Acad Sci U S A. (2009) ;106: (46):19503–8. doi: 10.1073/pnas.0905056106 |
[34] | Lin L , Ding D , Jiang Y , Li Y , Li S . MEK inhibitors induce apoptosis via FoxO3a-dependent PUMA induction in colorectal cancer cells. Oncogenesis. (2018) ;7: (9):67. doi: 10.1038/s41389-018-0078-y |
[35] | Tada M , Sumi T , Tanaka Y , Hirai S , Yamaguchi M , Miyajima M , et al. MCL1 inhibition enhances the therapeutic effect of MEK inhibitors in KRAS-mutant lung adenocarcinoma cells. Lung Cancer. (2019) ;133: :88–95. doi: 10.1016/j.lungcan.2019.05.014 |
[36] | Kinsey CG , Camolotto SA , Boespflug AM , Guillen KP , Foth M , Truong A , et al. Protective autophagy elicited by RAF-MEK-ERK inhibition suggests a treatment strategy for RAS-driven cancers. Nat Med. (2019) ;25: (4):620–7. doi: 10.1038/s41591-019-0367-9 |
[37] | Schick U , Kyula J , Barker H , Patel R , Zaidi S , Gregory C , et al. Trametinib radiosensitises RAS- and BRAF-mutated melanoma by perturbing cell cycle and inducing senescence. Radiother Oncol. (2015) ;117: (2):364–75. doi: 10.1016/j.radonc.2015.06026 |
[38] | Ruscetti M , Leibold J , Bott MJ , Fennell M , Kulick A , Salgado NR , et al. NK cell-mediated cytotoxicity contributes to tumor control by a cytostatic drug combination. Science. (2018) ;362: (6421):1416–22. doi: 10.1126/science.aas9090 |
[39] | Lee S , Schmitt CA . The dynamic nature of senescence in cancer. Nat Cell Biol. (2019) ;21: (1):94–101. doi: 10.1038/s41556-018-0249-2 |


