
Upregulation of HOX genes promotes cell migration and proliferation in head and neck squamous cell carcinoma
Abstract
BACKGROUND:
Expression dysregulation of HOX homeobox genes has been observed in several cancers, including head and neck squamous cell carcinoma (HNSC). Although characterization of HOX gene roles in HNSC development has been reported, there is still a need to better understand their real contribution to tumorigenesis.
OBJECTIVE:
The present study aimed to evaluate the contribution of the protein-coding HOX genes (HOXA10, HOXC9, HOXC10, and HOXC13) in cellular processes related to carcinogenesis and progression of the HNSC.
METHODS:
Expression of HOX genes was analyzed in HNSC RNA-Seq data from The Cancer Genome Atlas (TCGA) and by RT-qPCR in different tumor cell lines. siRNA-mediated knockdown of HOXA10, HOXC9, HOXC10 or HOXC13 was performed in HNSC cell lines, and predicted transcriptional targets HOX genes was analyzed by bioinformatic.
RESULTS:
Thirty-one out of the 39 mammalian HOX genes were found upregulated in HNSC tissues and cell lines. The HOXC9, HOXC10 or HOXC13 knockdown attenuated cell migration, and lead to downregulation of epithelial-mesenchymal transition (EMT) markers, which were predicted as transcriptional targets of these three HOX genes. Diminished colony formation and cell cycle arrest after HOXC10 or HOXC13 knockdown were also observed, corroborating the fact that there was an enrichment for genes in proliferation/cell cycle pathways.
CONCLUSIONS:
In summary, we revealed roles for HOXC9, HOXC10, and HOXC13 in cell migration and proliferation/cell cycle progression in HNSC cells and suggested that those HOX members contribute to HNSC development possibly by regulating tumor growth and metastasis.
1Introduction
As other genes from the Homeobox superfamily, HOX genes encode for transcription factors characterized by having a DNA-binding domain, called homeodomain. They are crucial regulators of metazoan embryogenesis [1, 2], through the orchestration of several biological processes such as proliferation, migration, differentiation, adhesion and cell death [3]. Aberrant expression in adult tissues of genes involved in embryonic development contributes to the development of cancer [4]. In general, HOX genes have a diminished expression during adult lifetime, but reactivation of some of these genes may occur during carcinogenesis [5]. Upregulation of HOX gene expression, leading to increased proliferation, migration and cell invasion, has been reported in several tumors including pancreatic cancer, lung cancer, ovarian cancer, breast cancer, and among others [6–10]. Therefore, understanding how the aberrant expression of HOX genes affects the development and progression of tumors is of paramount importance, both for understanding their carcinogenic role and for new forms of treatments and therapies to be developed.
Head and neck squamous cell carcinomas (HNSC) represent a group of cancers originating in the mucosa inside the mouth, nose, and throat, and also include tumors derived from the salivary glands. [11]. The Global Burden of Disease (GBD) study estimated 890 000 new head and neck cancers worldwide in 2017, representing 5.3%of all cancers [12]. About 75%of this type of cancer cases are related to alcohol or tobacco consumption, but other risk factors include human papillomavirus (16 and 18 types) and Epstein-Barr virus infections [11, 13]. A rising number of studies on molecular changes in HNSC have identified specific cytogenetic abnormalities (chromosome gain or loss) and genetic alterations, such as activation of proto-oncogenes (cyclin D1, MYC, RAS, EGFR) and inactivation of tumor suppressor genes (p161INK4A and p53) [13]. The epidermal growth factor receptor (EGFR) is the only molecular therapeutic target established so far [14]. Therefore, a deeper understanding of the cellular and molecular biology of this cancer will facilitate the development of more effective therapeutic strategies.
A previous study conducted by our group found eight members of the HOX gene family (HOXA10, HOXA11-AS1, HOXC8, HOXC9, HOXC10, HOXC13, HOXD10, and HOXD11) overexpressed in laryngeal squamous cell carcinoma (LSCC) [15]. Cell functional assays upon esiRNA-mediated knockdown against the most upregulated ones: HOXC8, HOXD10, and HOXD11, revealed a role for those three genes in the regulation of colony formation and cell migration capacity of HNSC cell lines [15]. The present study aimed to evaluate the contribution of the other protein-coding HOX genes (HOXA10, HOXC9, HOXC10, and HOXC13) in cellular processes related to carcinogenesis and progression of the HNSC.
Here we report that HOXA10, HOXC9, HOXC10 and HOXC13 genes are overexpressed in HNSC tissues, based on data from The Cancer Genome Atlas (TCGA) database and also in HNSC cell lines. Knockdown of HOXC9, HOXC10, and HOXC13 significantly reduced in vitro cell migration and colony formation. Target prediction analysis showed the involvement of those selected HOX genes in cell cycle control and epithelial-mesenchymal transition (EMT) pathways, which was corroborated by observation of cell cycle arrest and altered expression of EMT markers after HOXC10 and HOXC13 knockdown.
2Materials and methods
2.1TCGA data analysis
Gene expression profile Level 3 restricted to IlluminaHiSeq RNASeqV2 for 44 normal tissue and 520 primary tumor samples of patients with head and neck squamous cell carcinoma (HNSC) available up to July 2017 were downloaded from The Cancer Genome Atlas (TCGA) database by R/Bioconductor package TCGAbiolinks [16]. A total number of 265 low expressed genes with less than 2 CPM across all samples were removed. The differential expression analysis was conducted using the R/Bioconductor package edgeR [17] with the quasi-likelihood method, a glm approach. An FDR (False Discovery Rate) adjusted p-value threshold of 0.01 with a fold-change cutoff of 2 was used to determine the differentially expressed genes (DEGs) (Supplementary tables 1 and 2). The R/Bioconductor package ComplexHeatmap [18] was used to generate gene expression heatmaps. The boxplots showing HOX gene expression values in normal and tumor samples from TCGA dataset were customized from those generated in the interactive web server GEPIA (Gene Expression Profiling Interactive Analysis) [19].
2.2Cell lines
FaDu and UMSCC-1 cell lines are derived from pharynx carcinoma and mouth floor carcinoma, respectively, and were used as representatives of the human head and neck squamous cell carcinoma. Both cell lines were kindly provided by Dr. Eloiza H. Tajara of the School of Pharmaceutical Sciences–UNESP. Certification of cell lines authenticity was done by short tandem repeat polymorphisms (STRs) analysis, performed by the Human Identification Service in the Department of Genetics, Ribeirão Preto Medical School, University of São Paulo.
2.3Cell culture
Cell lines were cultured under standard conditions in low glucose Dulbecco’s modified Eagle’s medium (Thermo Fisher Scientific) for FaDu, or high glucose Dulbecco’s modified Eagle’s medium (Thermo Fisher Scientific) for UMSCC-1, supplemented with 10 %fetal bovine serum and without antibiotics. Cells were maintained in an incubator at 37°C and 5 %CO2.
2.4RNA extraction and quantitative real-time PCR
RNA extraction was performed using Trizol reagent (Thermo Fisher Scientific). High Capacity cDNA Reverse Transcription kit (Thermo Fisher Scientific) was used to generate cDNAs from 1μg of extracted RNA according to the manufacturer’s instructions. RT-qPCR was performed in an Applied Biosystems 7500 Real-Time PCR System, using TaqMan® assays (Thermo Fisher Scientific), PrimeTime® qPCR Probe Assays or custom designed primers (IDT - Integrated DNA Technologies) (Supplementary table 3), and Taqman® Universal PCR Master Mix (Thermo Fisher Scientific) or SYBR Green® PCR Power Mix 2x (Thermo Fisher Scientific) following the supplier’s protocol. For all RT-qPCR reactions the housekeeping GAPDH gene was used for RNA input normalization. Normalized expression levels and relative expression values (fold-change) were calculated using the 2–ΔCt or 2–ΔΔCt methods, respectively.
2.5Gene knockdown assay
Knockdown assays were performed using esiRNAs against HOXA10 (esiHOXA10 –EHU131511), HOXC9 (esiHOXC9 –EHU038931), HOXC10 (esiHOXC10 –EHU038091) or HOXC13 (esiHOXC13 –EHU034171) or a negative control esiRNA (esiEGFP - EHUEGFP) provided by Sigma Aldrich. Cells were transfected with specific esiRNAs (20 nM final concentration) using Lipofectamine RNAiMAX reagent (Thermo Fisher Scientific) according to manufacturer’s instructions. Subsequent experiments were performed 48 h after transfection.
2.6Cell viability assay
Cell viability and apoptosis were evaluated using Annexin V-FITC apoptosis detection kit (BD - Becton Dickinson) and Propidium Iodide (PI). All experiments were performed according to the manufacturer’s guidelines. FACSCalibur flow cytometer was used for all analysis (BD - Becton Dickinson). Double-negative cells were considered viable. Annexin V-positive cells were determined as apoptotic cells.
2.7Colony formation assay
Cells were harvested 48 h after transfection, and the cell suspension was settled into six-well plates (500 cells/ well) (Greiner Bio-One). After 14 days, cells were fixed in 4 %formaldehyde and stained with 0.5 %crystal violet solution. The number of colonies was counted with the open-source software ImageJ (National Institutes of Health).
2.8Transwell migration assay
Cell motility was evaluated by transwell migration assays performed in 24-well plates with inserts containing a filter membrane with 8μm pores (Greiner Bio-One). FaDu and UMSCC-1 cells (1×10⁵cells/ 200μL serum-free medium) were seeded in the upper chambers of the transwell plates 48 h after transfection with individual esiRNAs. The lower chambers were filled with 500μL of medium containing 10 %FBS. Cells were allowed to migrate for 24 h at 37°C. Then, the cells from the upper compartment were removed with a cotton swab, and the cells that migrate to the lower face of the filter were fixed in 4 %formaldehyde and stained with 0.5 %crystal violet solution. The number of migrating cells was manually counted using the open-source software ImageJ (National Institutes of Health).
2.9Western blot
Transfected cells were lysed with Radioimmunoprecipitation Assay Buffer (RIPA buffer), supplemented with protease inhibitors (SigmaFast™ protease inhibitor -S8820) and phosphatase inhibitors (1 mM sodium orthovanadate and 10 mM sodium fluoride). Protein extracts were quantitated using a Bio-Rad Protein Assay according to the manufacturer’s instructions (Bio-Rad). 50μg of total protein per sample were resolved in 12%polyacrylamide gel by SDS-PAGE and transferred to nitrocellulose membranes. Membranes were probed with anti-E-Cadherin (EP700Y - Abcam) and anti-GAPDH (ab9485 - Abcam). Bands were visualized on ImageQuant (GE Healthcare) by chemiluminescence using Enhanced chemiluminescent ECL™ Prime Western Blotting System (GE Healthcare) following the manufacturer’s instructions.
2.10Target analysis
For identification of putative transcriptional targets of HOX genes, CHIP-seq peaks were extracted from the CistromeDB platform [20]. Peaks intersecting ENCODE DNAse clusters were used to identify DNA binding motifs through the MEME v4.11.4 program [21]. The motif scanning in the human reference genome GRCh38.p7 was performed by the FIMO tool [22]. Peaks and motifs mapped in gene promoters (2000 pb) and intragenic regions were associated with the closest gene, according to ensemble human genome GRCH38 release 90, and this gene considered a possible target of the HOX genes. Also, peaks and motifs mapped to enhancer regions were associated with genes by known interactions between enhancers and promoters or intragenic regions, available at GeneHancer. Described targets from the literature, available at R package TFTargets (https://github.com/slowkow/tftargets), were also used for targets identification. Pearson’s correlation was applied to indicate HOX association with the putative target in head and neck squamous cell carcinoma. More detailed description of this method for HOX target prediction is found elsewhere [23].
2.11Pathway enrichment analysis
Overrepresentation enrichment analysis of pathways based on REACTOME, or Gene Ontology databases were performed using the online tool WebGestalt GSAT (WEB-based Gene SeT AnaLysis Toolkit) (http://www.webgestalt.org/option.php). Analysis of overrepresentation of specific gene sets (gene signatures) deposited in the Molecular Signature Database (MSigDB) was done using the GSEA (Gene Set Enrichment Analysis) webpage (http://software.broadinstitute.org/gsea/msigdb/index.jsp). [24–28]. A q-value < #x003C;< #x200A;0.05 was considered significant.
2.12Cell cycle analysis
Cell cycle analysis was performed by propidium iodide staining and flow cytometry sorting. FaDu or UMSCC-1 cells (1×l05) were fixed in 70%ethanol for 24 h and then, incubated with RNAse A (0.1 mg/ml) (Sigma Aldrich) diluted in PBS-EDTA at 37°C for 30 minutes. The cell pellet was resuspended in 160μL of PBS-EDTA and 40μL of propidium iodide (PI). Samples submitted to the FACScalibur Flow Cytometer (BD - Becton Dickinson) and resulting data were analyzed using ModFit LT 5.0 software.
2.13Statistical analysis
Data were analyzed using GraphPad Prism 7.0 software package (Graph Pad Software Inc.). Statistical significance was determined by Kruskal-Wallis test followed by Dunn as a post hoc test. A probability of p < #x003C;< #x200A;0.05 was considered to be statistically significant. All data are shown as mean±standard deviation.
3Results
3.1HOX genes are upregulated in head and neck squamous cell carcinoma (HNSC)
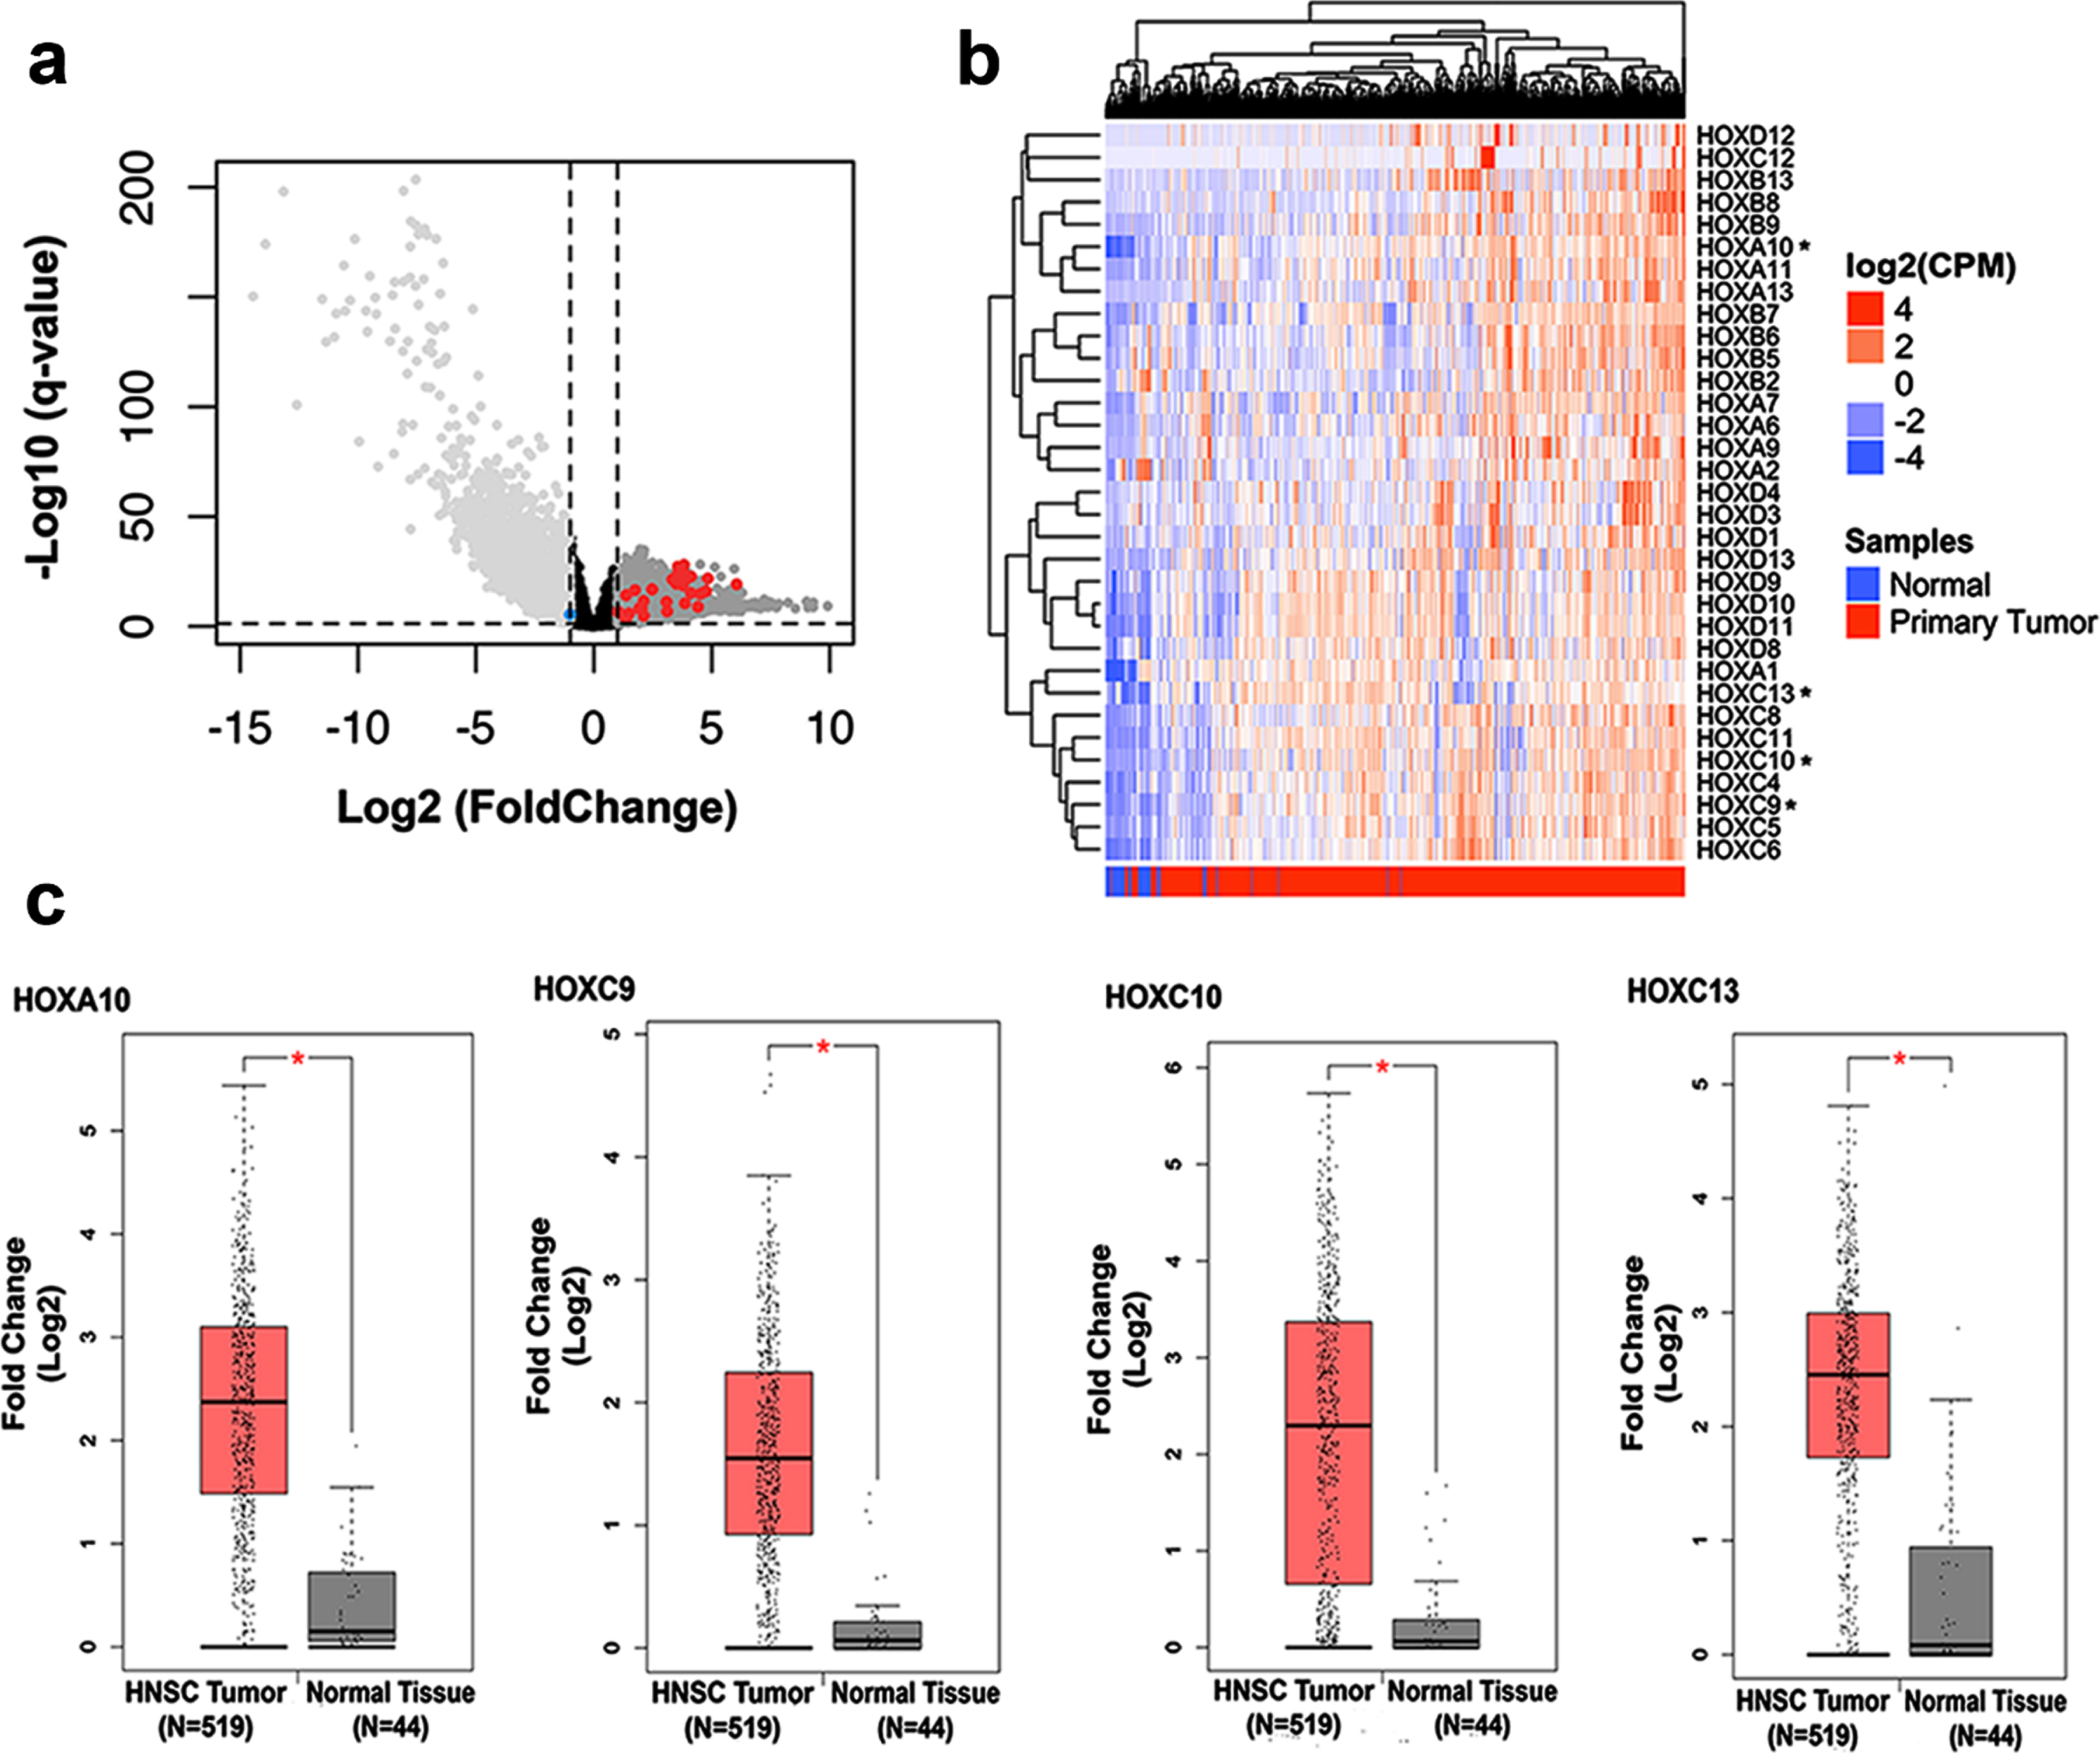
Extending a previous study of our group which detected upregulation of eight members of HOX genes using a microarray analysis [15], we assessed the expression profile of all mammalian HOX genes in head and neck squamous cell carcinoma tissues in comparison with normal adjacent tissues from the most updated RNA-seq data from TCGA database. Among the 39 HOX genes known to be expressed in mammalian cells, we found that 31 were significantly overexpressed in HNSC tissue (Fig. 1A - red dots) and only one (HOXA2) was found downregulated (blue dot). For better visualization of the expression profile of these HOX genes in HNSCC tissues, we built a heatmap plot (Fig. 1B). Since our previous work started the characterization of the functional role in oncogenic phenotypes of three out of the eight HOX members found upregulated in HNSC, in this work we focused in a more detailed expression profile and functional characterization of the other four protein-coding members (HOXA10, HOXC9, HOXC10, and HOXC13). Figure 1C displays the expression levels of the four HOX genes in HNSC tissue in comparison with the normal adjacent tissue from the TCGA RNA-seq data, as assessed through the platform GEPIA (http://gepia.cancer-pku.cn/).
Fig. 1
Analysis of HOX gene expression in HNSC and normal tissue samples from public databases. (a) Volcano plot showing the comparison of gene expression between normal margin and head and neck squamous cell carcinoma (HNSC) samples. The x-axis represents fold change values (FC; log2) and Y-axis q-value adjusted (–log10). A threshold cutoff (2-FC vs p-value 0.01) was applied for selection of genes downregulated (right side) or upregulated (left side) in HNSC samples. The red and blue dots show the HOX genes upregulated or downregulated, respectively. (b) Hierarchical clustering of HOX genes differentially expressed in HNSC by ward.d2 distance is illustrated in the heatmap. Each column represents a sample, and each row indicates a gene. Sample clustering tree is shown at the top, while that for genes appears on the right. Across all samples, relative gene expression levels are shown in color scales (red, above the mean; blue, lower than the mean; white, median expression). (c) Boxplots represent the individual expression of the HOXA10, HOXC9, HOXC10, and HOXC13 genes between HNSC and nontumoral tissues. The y-axis represents fold change values (FC; log2) and the x-axis shows the number of tumor samples and normal adjacent tissue.
3.2HOX genes HOXA10, HOXC9, HOXC10, and HOXC13 are upregulated in head and neck cancer cell lines
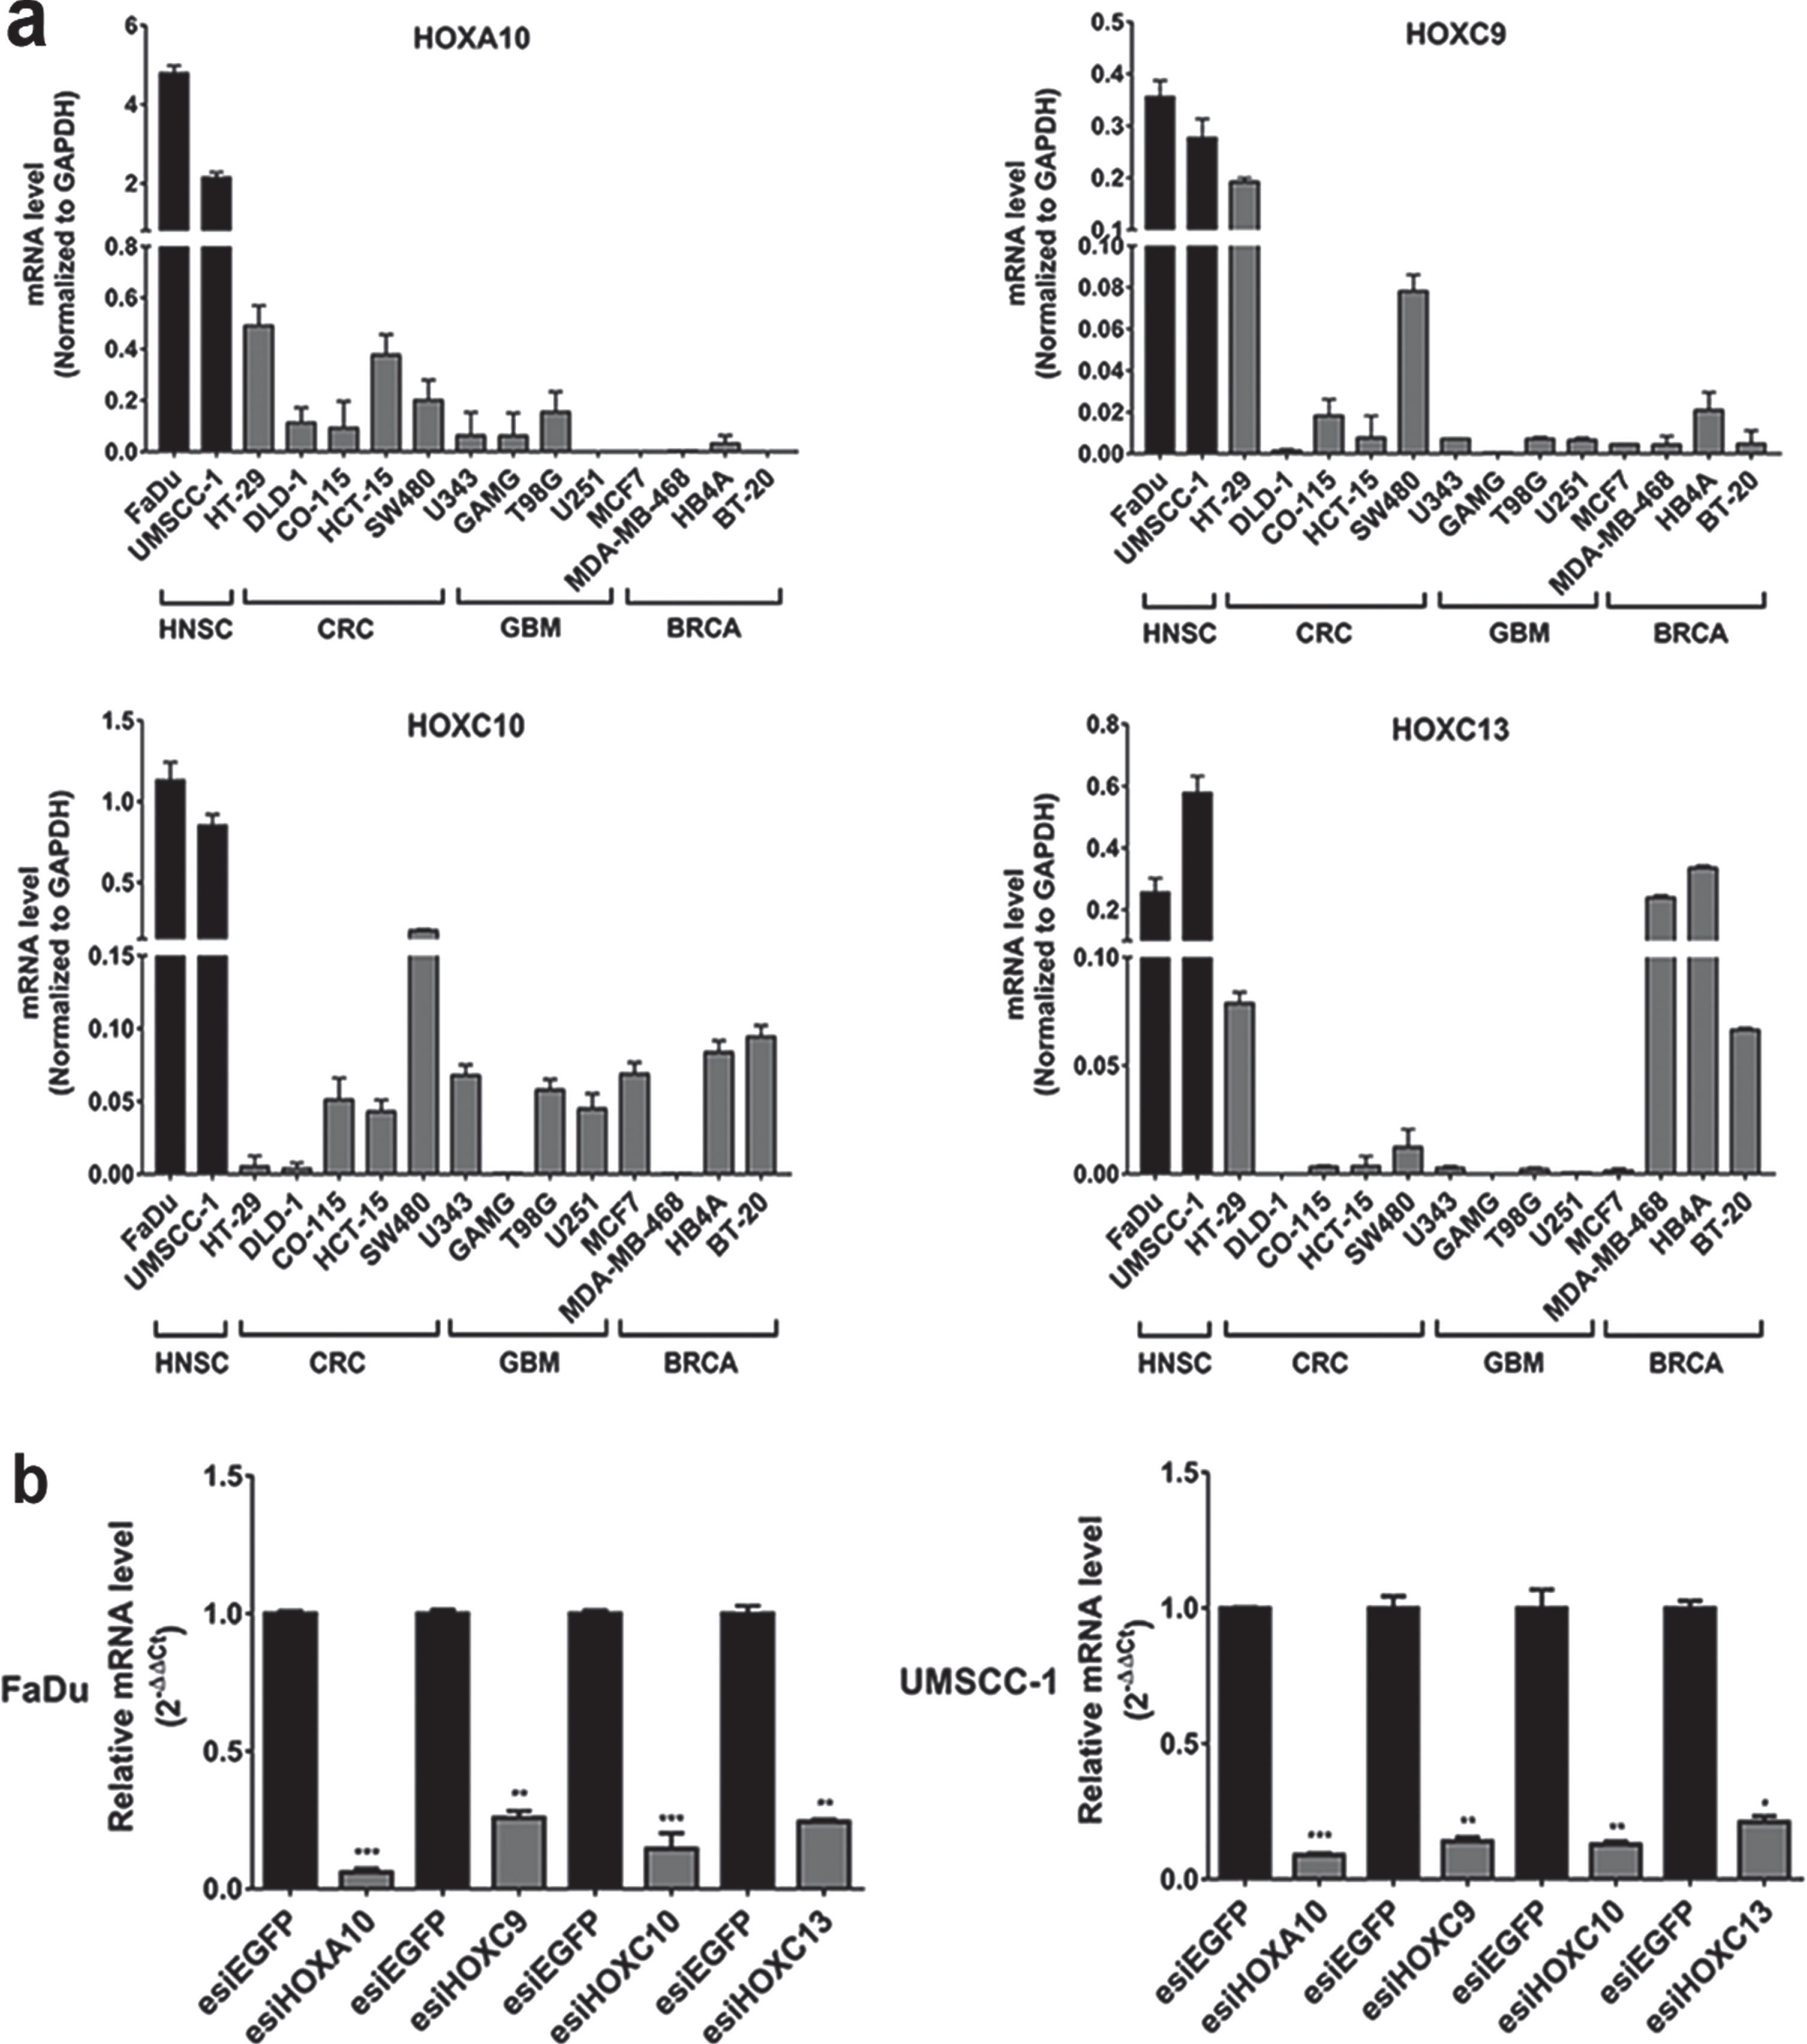
We also evaluated the gene expression profile of the four selected HOX genes by quantitative reverse transcription PCR (RT-qPCR) in a panel of 14 tumoral cell lines: two from head and neck cancer, four from colorectal cancer, four from glioblastoma and four from breast cancer. We found the highest expression levels for all four HOX genes in head and neck cancer cells in comparison with the other tumor cell lines (Fig. 2A).
Fig. 2
Gene expression profile and efficiency of transient knockdown of selected HOX genes. (a) HOXA10, HOXC9, HOXC10 e HOXC13 gene expression levels in HNSC-derived cell lines FaDu and UMSCC-1 cell lines and in additional thirteen cell lines derived from three different tumor types (CRC: colorectal cancer, GBM: glioblastoma and BRCA: breast cancer). Expression levels were calculated according to the 2–ΔCt method using the mean Ct value of GAPDH gene (endogenous control) amplification for normalization. (b) The efficiency of knockdown induced by esiRNA against HOXA10, HOXC9, HOXC10 and HOXC13 genes at RNA level, assessed by RT-qPCR, in FaDu and UMSCC-1 cell lines. Fold-change difference in the expression of each HOX gene upon knockdown was calculated with the 2–ΔΔCt method, using GAPDH as endogenous control and the expression in the sample from control cells (transfected with esiEGFP) as reference/calibrator.
3.3HOXA10, HOXC9, HOXC10, and HOXC13 were efficiently knocked down in HNSC cell lines
To elucidate possible contributions of the selected HOX genes to oncogenic phenotypes we performed functional cancer assays upon knockdown of the genes by the interfering RNA technique (esiRNA). FaDu and UMSCC-1 cell lines were chosen as experimental models because they are representatives of the human head and neck squamous cell carcinoma. RT-qPCR evaluated gene knockdown efficiency after 48 h of transfection with esiRNA against HOXA10, HOXC9, HOXC10 or HOXC13 genes. Expression levels, detected by RT-qPCR, of any of those genes were reduced over 80%in both cell lines in comparison with the cultures transfected with non-targeting control esiRNA (Fig. 2B).
3.4HOXC9, HOXC10, and HOXC13 knockdowns inhibit in vitro migration of HNSC cell lines
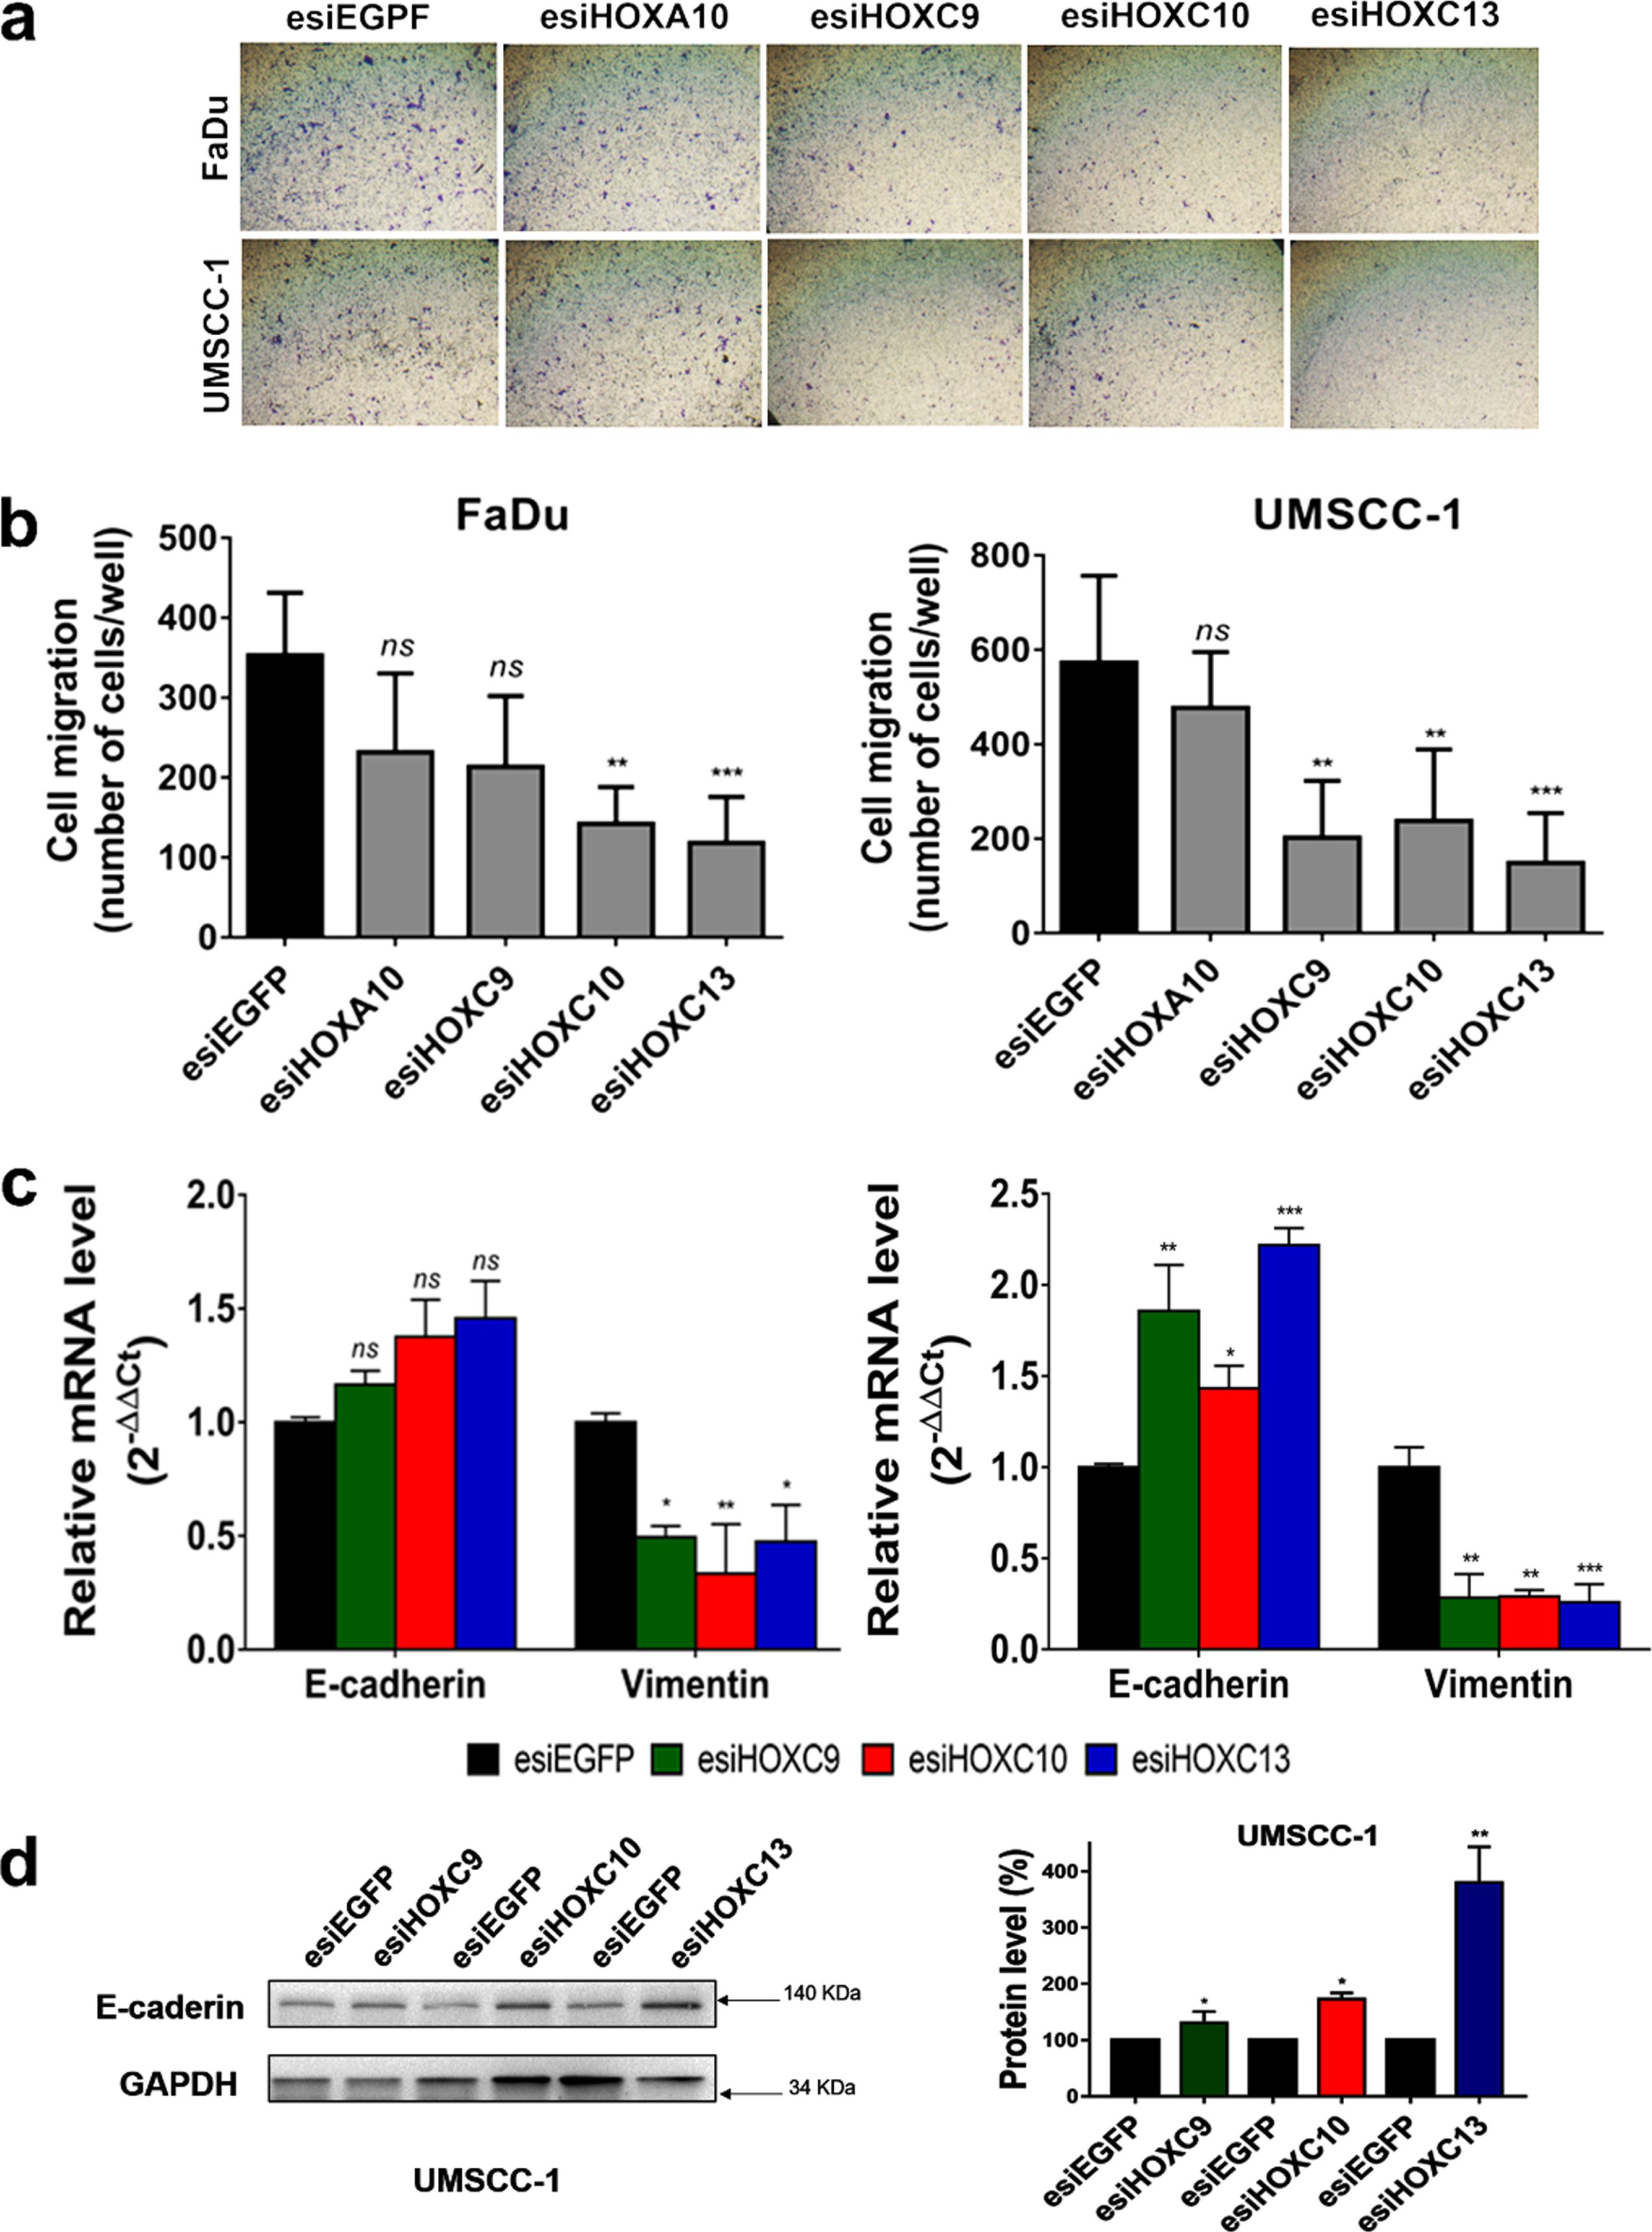
A possible role of the four selected HOX genes in cell migration was evaluated by a cell motility assay, in which esiRNA-transfected cells were allowed to migrate for 24 h through transwell chambers. Results showed a significant decrease in cell migration after HOXC10 or HOXC13 knockdown. HOXC9 knockdown decreased cell migration rates only in the UMSCC-1 cell line (Fig. 3A, B). Moreover, HOX knockdown increased the expression of epithelial marker E-cadherin and decreased that of Vimentin, a mesenchymal marker (Fig. 3C, D). These results suggested that HOX knockdown could inhibit in vitro migration of HNSC cells via disrupting epithelial-mesenchymal transition (EMT) process.
Fig. 3
HOXC9, HOXC10 or HOXC13 knockdown reduced cell migration and affected the expression of epithelial-mesenchymal transition (EMT) markers. (a) Representative images of the bottom surface of transwell inserts showing stained migrating cells from FaDu (upper panel) and UMSCC-1 (bottom panel) cell lines transfected with esiRNA against the indicated HOX genes. (b) Bar graph showing the quantitation of migrating cells; FaDu (left) or UMSCC-1 (right). (c) Relative mRNA expression levels of the epithelial marker, E-cadherin, and the mesenchymal marker, Vimentin, after transfection of FaDu (left) or UMSCC-1 (right) cells with esiHOXC9, esiHOXC10 or esiHOXC13 in comparison with the esiEGFG-transfected cells (control). mRNA level was detected by RT-qPCR and the relative expression was calculated with the 2–ΔΔCt method, using GAPDH as endogenous control and the expression in the sample from control cells (transfected with esiEGFP) as reference/calibrator. (d) (Left) A western blot representative image confirming the increase of the E-cadherin protein levels after knockdown of HOX genes in the UMSCC-1 cell line. (Right) Bar graph with the quantitation of E-cadherin protein level normalized by GAPDH level in esiHOX-transfected cells in comparison to esiEGFP-control cells (considered as 100%). Full-length blots are presented in supplementary Fig. 4. Kruskal-Wallis followed by Dunn’s post hoc test was used for statistical analysis. Each experiment was performed three times and each time in triplicate. ns: not significant, *p < #x003C;< #x200A;0.05, **p < #x003C;< #x200A;0.01 and ***p < #x003C;< #x200A;0.001.
3.5HOXC9, HOXC10, and HOXC13 knockdowns suppress colony formation capacity of HNSC cell lines via cell cycle arrest at G1/S transition
We conducted a cell colony formation assay to determine if the cell proliferative capacity in low-density cultures would be affected by the selected HOX genes. The knockdown of HOXC9, HOXC10 or HOXC13, in UMSCC-1 cells, significantly reduced their ability to establish colonies after 14 days of culturing (Fig. 4A,B, lower left panel). Both the number of colonies and their sizes were affected by HOX gene knockdowns. On the other hand, knockdown of HOXC9 in FaDu cells increased the formation of colonies (Fig. 4A,B, lower right panel). Neither HOXC10 nor HOXC13 knockdown affected the colony formation rate of FaDu cells.
Fig. 4
HOXC9, HOXC10 and HOXC13 knockdown reduced colony formation via cell cycle arrest at G1/S. (a) Representative images showing colonies formed by FaDu cells (upper panel) or UMSCC-1 cells (bottom panel) after 14 days of transfection with control esiRNA (esiEGFP) or HOXA10, HOXC9, HOXC10, or HOXC13 esiRNAs. (b) Bar graph showing the quantitation of cell colony numbers; FaDu (left) and UMSCC-1 (right). (c) Cell cycle progression of FaDu (left) or UMSCC-1 (right) cells, transfected with esiEGFG (control), esiHOXC9, esiHOXC10 or esiHOXC13. The graphs show the proportion (%) of cells in each cell cycle phase, as detected by propidium iodide staining and flow cytometry. Kruskal-Wallis followed by Dunn’s post hoc test was used for statistical analysis. Each experiment was performed three times and each time in triplicate. ns: not significant, *p < #x003C;< #x200A;0.05, **p < #x003C;< #x200A;0.01 and ***p < #x003C;< #x200A;0.001.
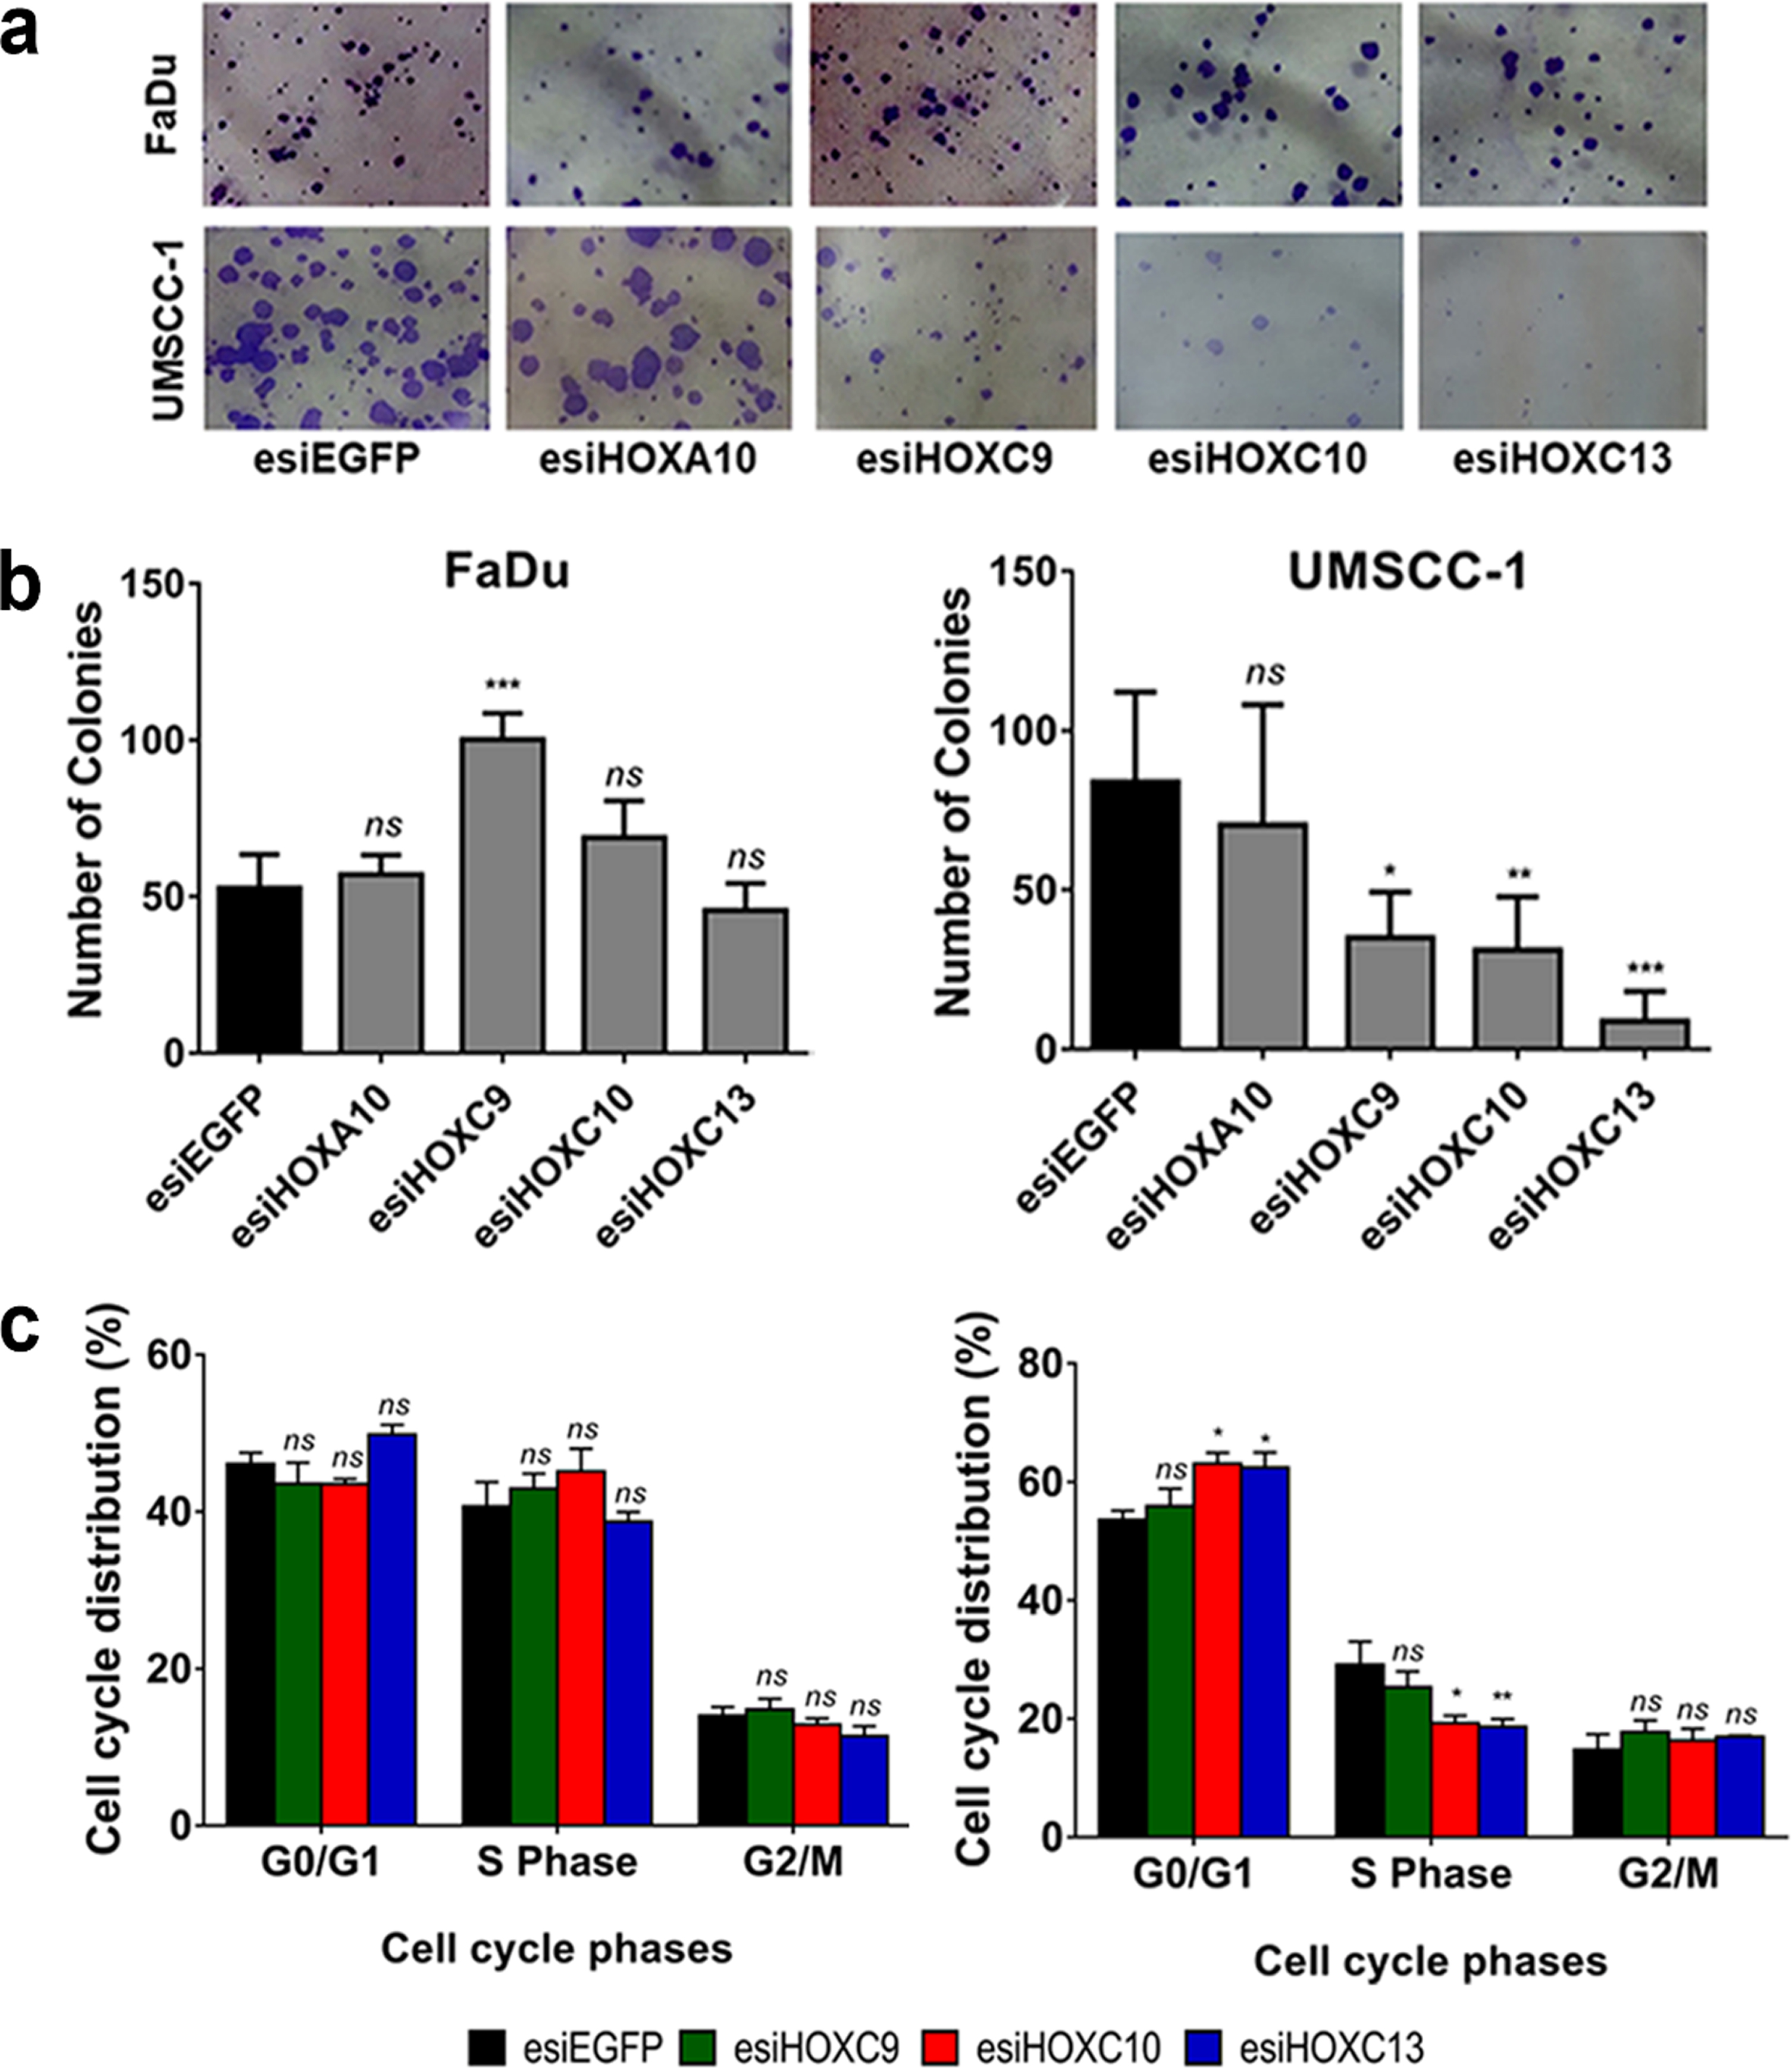
We also evaluate the effect of the HOXC9, HOXC10 or HOXC13 genes in cell cycle progression. Knockdown of HOXC10 or HOXC13 in UMSCC-1 lead to a significant increase in the proportion of cells in G0-G1 phase and a reduction in the percentage of cells in S phase. There were no significant changes in the cell cycle progression of FaDu cells (Fig. 4C, lower left panel), in partial agreement with the results observed in the colony formation assay (also no effect for HOXC10 and HOXC13). HOXC9 knockdown did not change cell cycle progression rates in any of the cell lines. At least for HOXC13, the mechanism involved in the cell cycle control may be linked to the regulation (direct or indirect) of cyclin levels since we detected a reduction of Cyclin D1 mRNA levels after HOXC13 knockdown in UMSCC-1 cell line (Supplementary figure 1).
3.6HOXC9/C10/C13 putative transcriptional targets in HNSC are involved with cell proliferation pathways and epithelial-mesenchymal transition
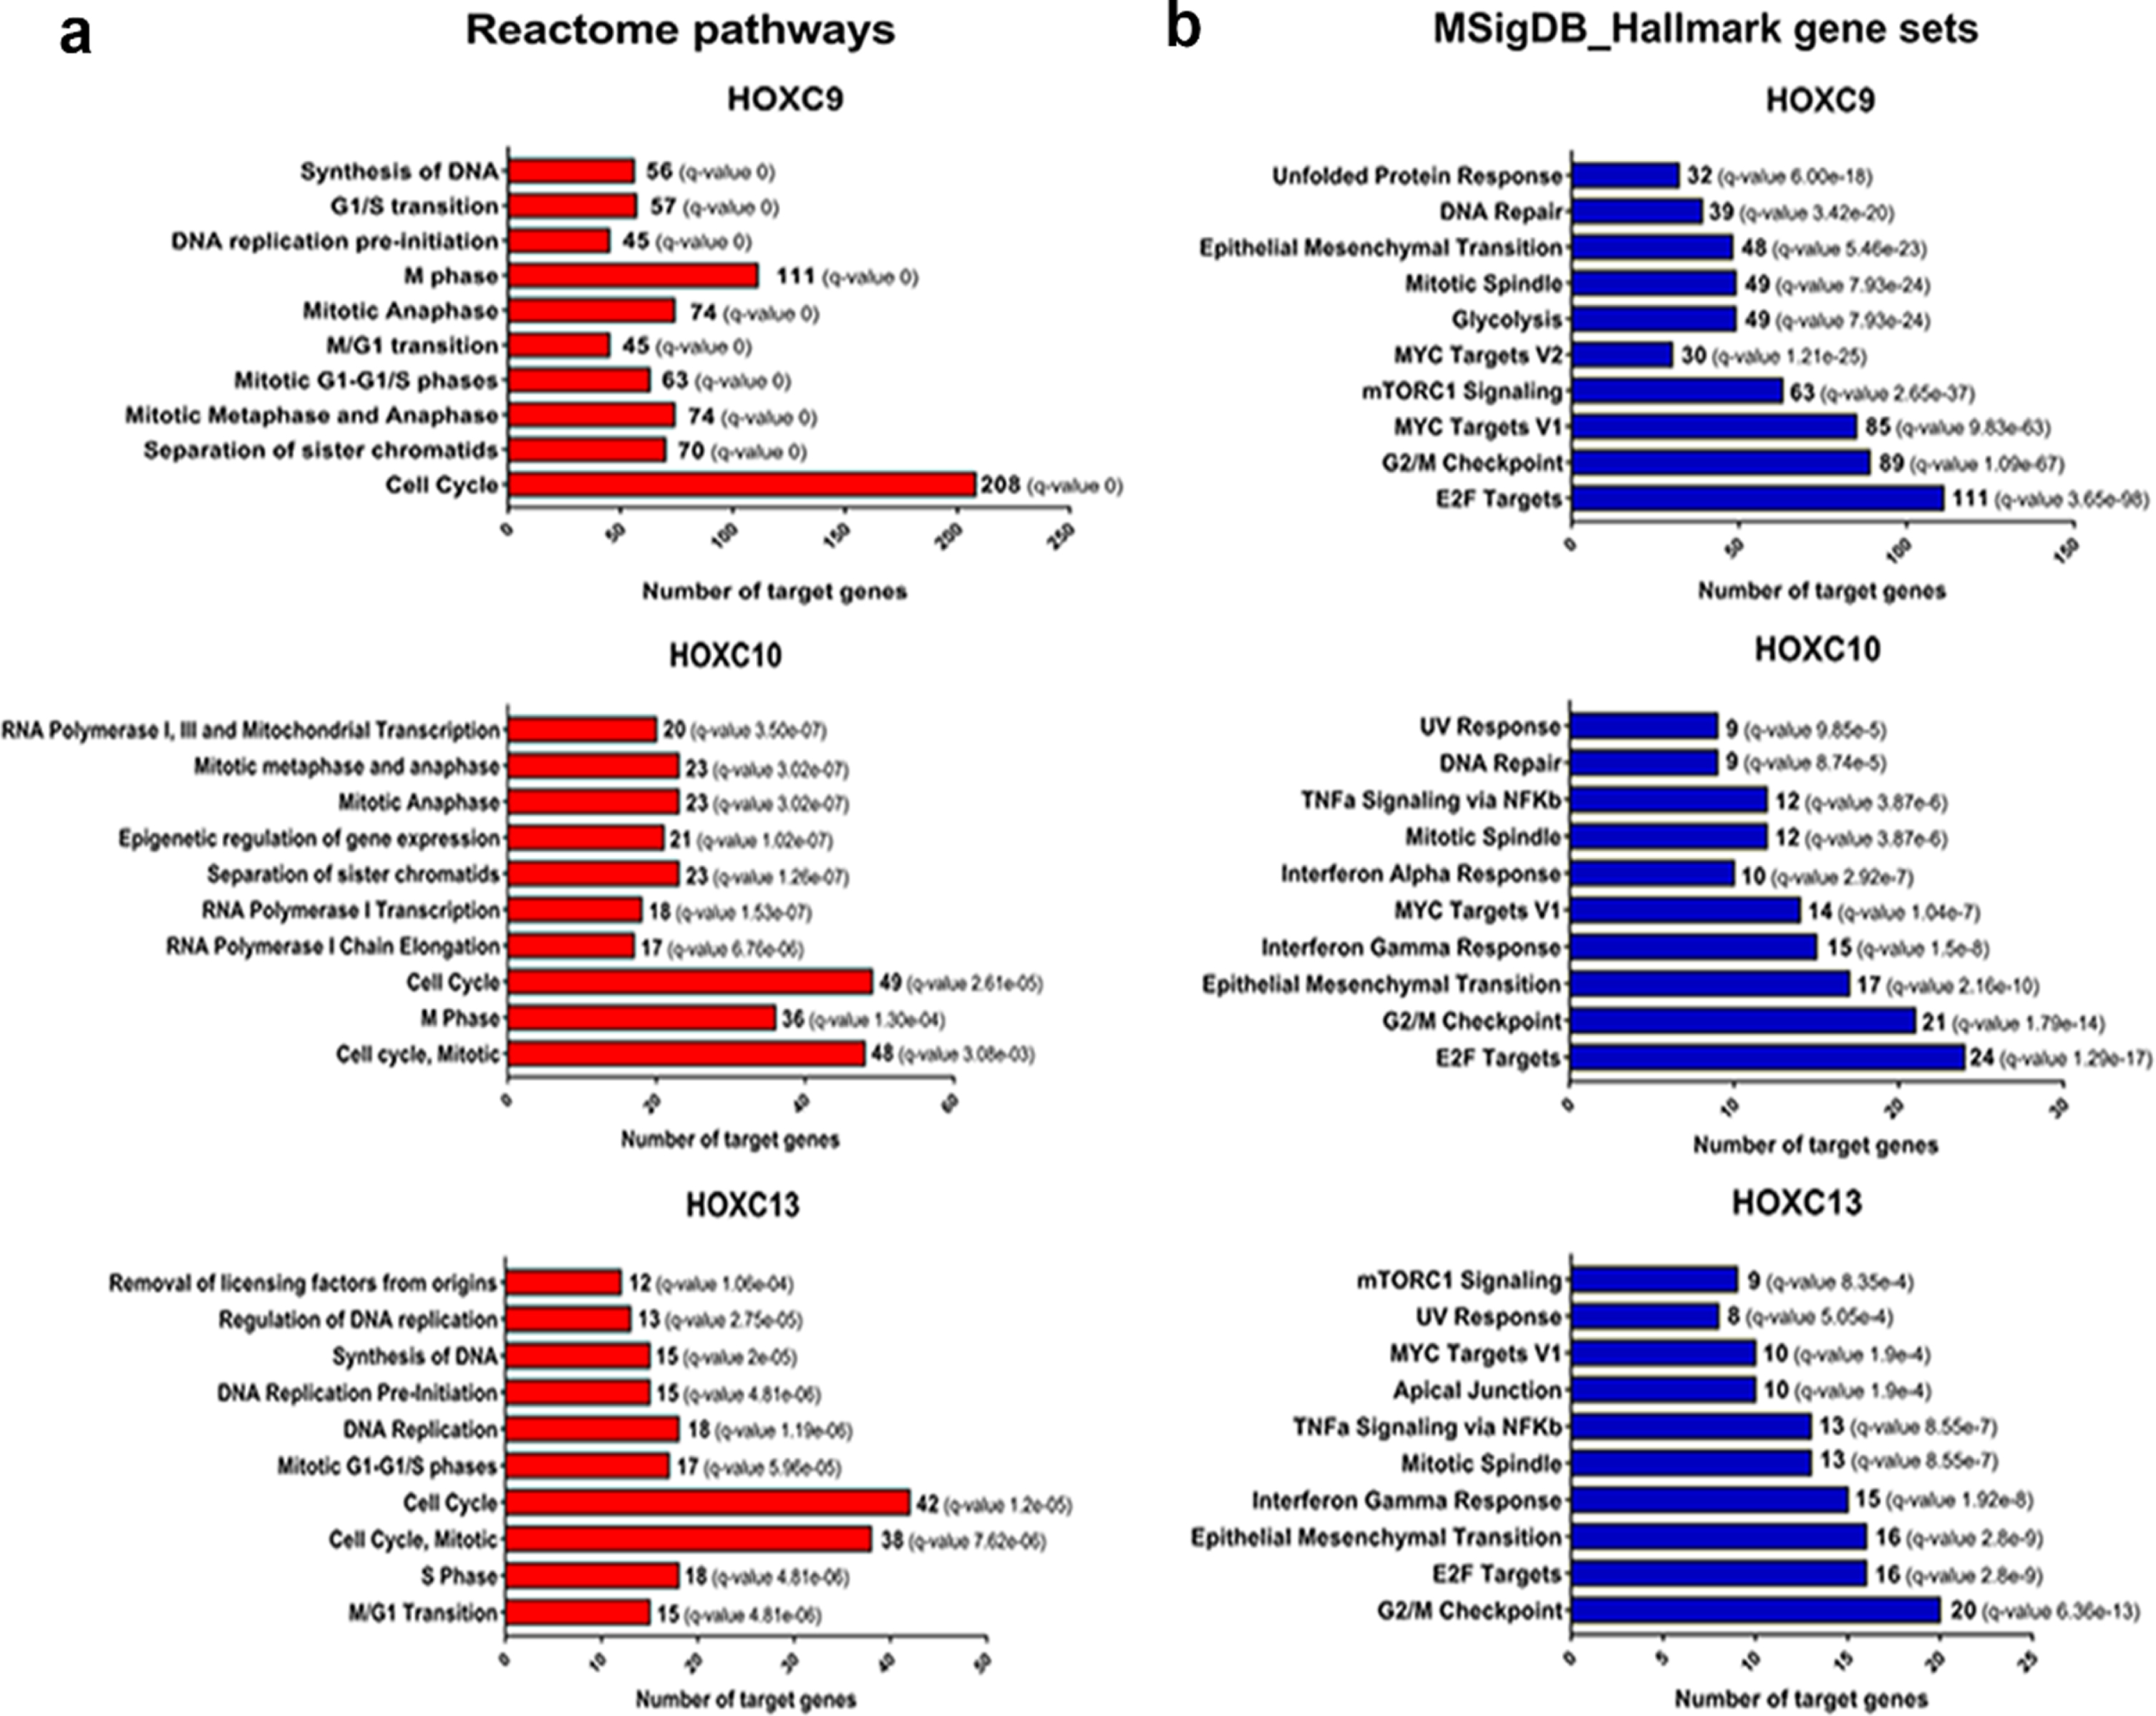
HOX family genes encode transcription factors and are involved in a variety of biological processes, such as cell proliferation, differentiation, and migration. To act in these biological roles, HOX genes activate or inhibit the transcription of target genes related to these processes [3]. Thus, we searched for putative target genes of the HOXC9, HOXC10, and HOXC13 using a bioinformatic approach combining information publicly available in ChIP-Seq datasets and Transcription Factor databases with expression level correlations (R > #x003E;> #x200A;0.4 or < #x003C;< #x200A;–0.4) between the selected HOX and their predicted targets using the HNSC RNA-seq data from TCGA, chip-seq data and motif analysis. The list of putative targets transcriptionally activated (R > #x003E;> #x200A;0.4) or inhibited (R < #x003C;< #x200A;–0.4) in HNSC for each of the selected HOX (HOXC9/C10/C13) can be found at supplementary table 4–9. We excluded HOXA10 from this analysis since no effect on the oncogenic phenotypes investigated was observed in the HNSC cells after its knockdown. To gain insights on the molecular processes regulated by the putative targets of the selected HOX, we performed a pathway enrichment analysis. Corroborating the results observed for HOXC9/C10/C13 on the colony formation capacity and cell cycle progression of UMSCC-1 cells, there was an enrichment for several processes related to cell proliferation and cell cycle control in the lists of predicted positively regulated targets of all three HOX, using different molecular pathway databases (Fig. 5 and Supplementary figure 2). In agreement with the results observed for the migration assays, epithelial-mesenchymal transition (EMT) was one of the top ten enriched pathways for the putative positively regulated target genes for all three selected HOX, according to the MSigDB platform. For the negatively correlated target genes, we only detected enriched pathways (KRAS and IL2 / STAT5 signaling) for HOXC9 predicted targets (Supplementary figure 3).
Fig. 5
Putative positive transcriptional targets of the selected HOX are involved with cell proliferation pathways and epithelial-mesenchymal transition. (a) Enriched Reactome pathways of the putative transcriptional targets of each HOX. The number of genes involved in each pathway is presented. (b) Overlap of Molecular Signatures Database hallmark gene sets with the putative transcriptional targets of each HOX. The number of target genes overlaped in each HOX set is presented. FDR≤0.05.
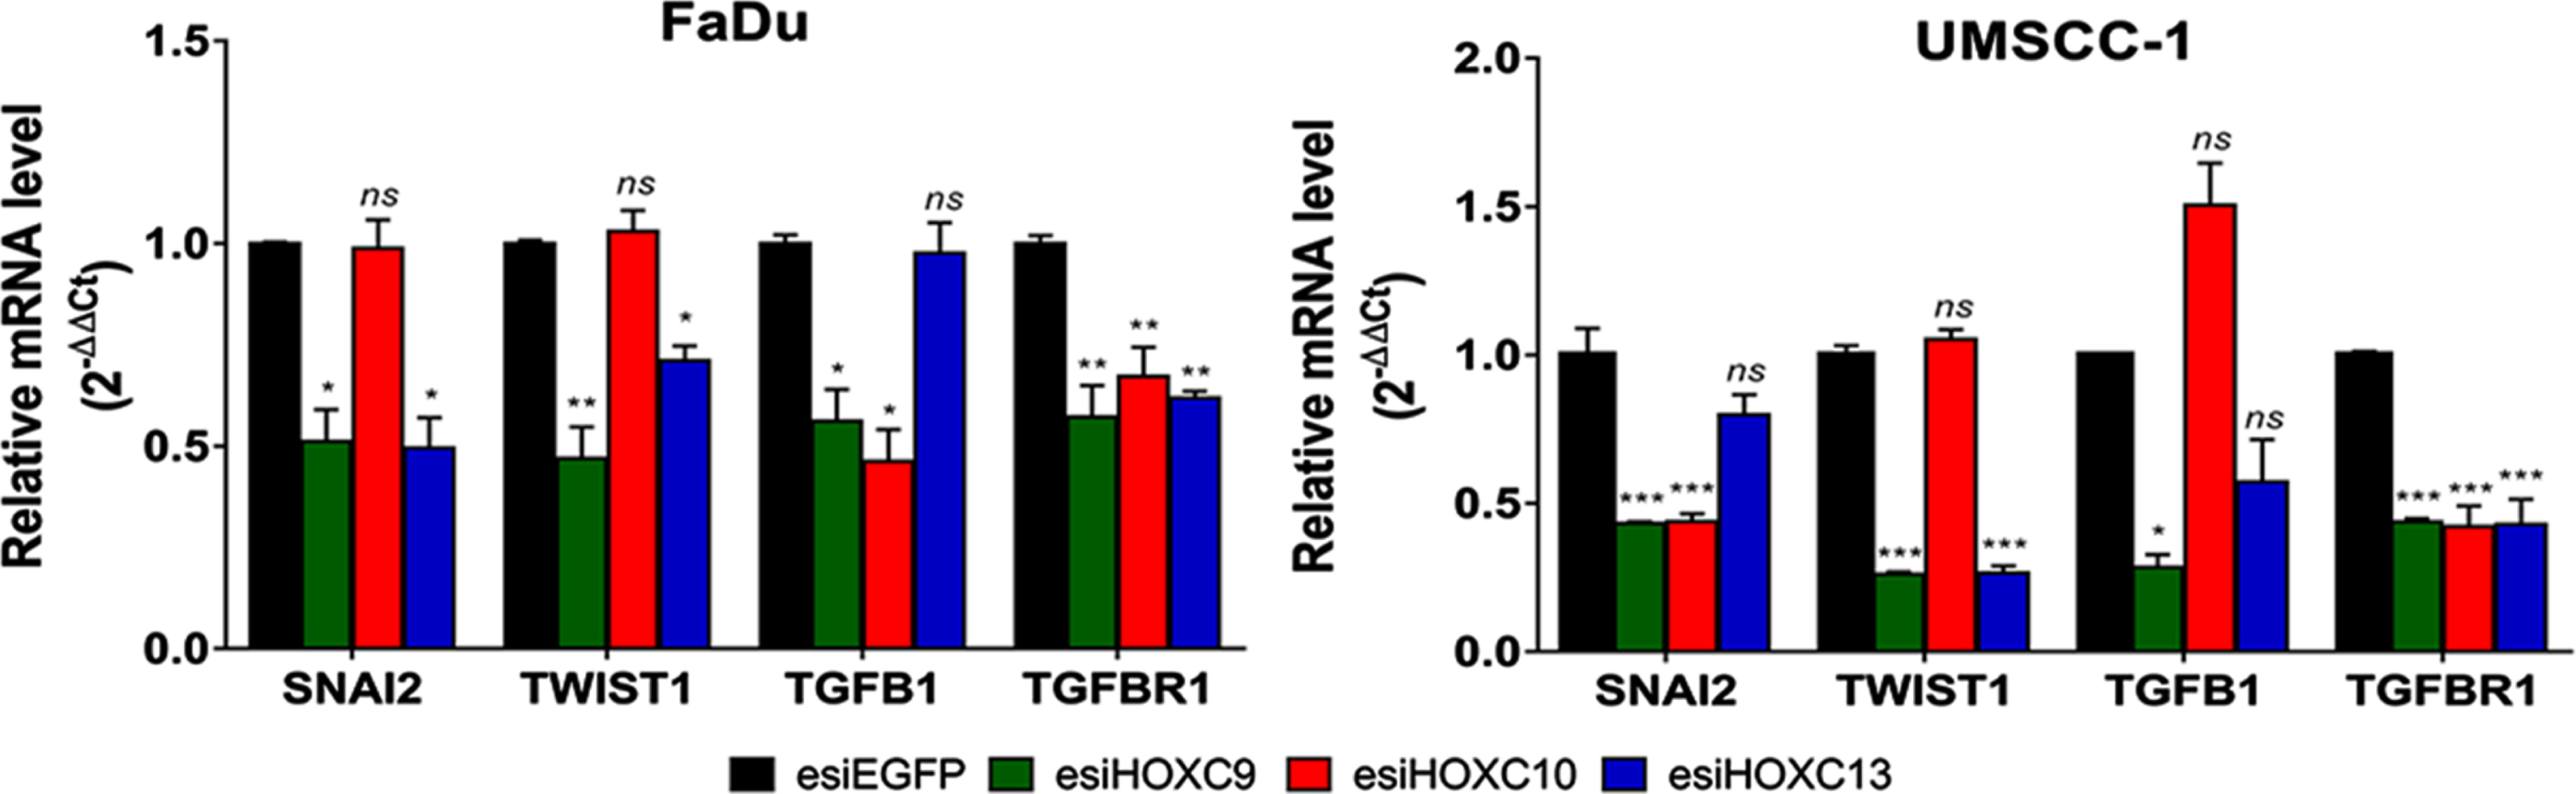
RT-qPCR was applied to evaluate the effect of HOX gene knockdowns on four EMT markers (Snail Family Transcriptional Repressor 2 (SNAI2), Twist Family BHLH Transcription Factor 1 (TWIST1), Transforming Growth Factor Beta 1 (TGFB1), and Transforming Growth Factor Beta Receptor 1 (TGFBR1)) indicated by the bioinformatic analysis as putative transcriptional targets for one or more of our selected HOX. Knockdown of HOXC9 decreased the expression of all of them in both cell lines. Regarding HOXC10 knockdown, there was a reduction in the expression of TGFB1 and TGFBR1 in FaDu cell line and SNAI2 and TGFBR1 in UMSCC-1 cell line. As TGFB1 and TGFBR1 were not considered direct targets of HOXC10 by our bioinformatic analysis, it is possible that they are under an indirect regulation of HOXC10. After HOXC13 knockdown, SNAI2, TWIST1 and TGFBR1 decreased their mRNA levels in FaDu cells, whereas only TWIST1 and TGFBR1 were downregulated in UMSCC-1 (Fig. 6).
Fig. 6
Effect of selected HOX gene knockdowns on the expression of their putative transcriptional targets involved with the EMT process. Relative expression of HOX target genes (SNAI2, TWIST1, TGFB1, and TGFBR1), after transfection with esiEGFG (control), esiHOXC9, esiHOXC10 or esiHOXC13. The mRNA level was detected by RT-qPCR, in FaDu (left) and UMSCC-1 (right), and the relative expression was calculated with the 2–Δ ΔCt method, using TBP as endogenous control and the expression in the sample from control cells (transfected with esiEGFP) as reference/calibrator. Kruskal-Wallis followed by Dunn’s post hoc test was used for statistical analysis. Each experiment was performed three times and each time in triplicate. ns: not significant, *p < #x003C;< #x200A;0.05, **p < #x003C;< #x200A;0.01 and ***p < #x003C;< #x200A;0.001.
4Discussion
Several studies have reported the dysregulation of HOX gene expression in various tumors. There are multiple mechanisms by which this dysregulation occurs, and dysregulated expression patterns are usually tissue-specific [29]. A previous study from our group found eight HOX genes overexpressed in laryngeal squamous cell carcinoma (LSCC) and in vitro assays suggested the association of three of them (HOXC8, HOXD10 and HOXD11) with this tumor development [15]. Here, we confirmed the upregulation of several HOX genes in head and neck tumors in general by analyzing gene expression using RNA-Seq data available in TCGA database. In fact, HNSC is marked by a global upregulation of HOX family members (31 out of the 39 known mammalian HOX genes), supporting the notion that this family of transcription factors contributes to the development of HNSC.
By using in vitro assays, we assessed the roles on oncogenic phenotypes of four HOX genes identified previously by our group as upregulated in LSCC: HOXA10, HOXC9, HOXC10, and HOXC13. Knockdown of HOXC9, HOXC10 or HOXC13 impacted cell proliferation and migration in at least one of the cell lines used. Although HOXA10 knockdown has been reported to cause decreased cell migration and proliferation rates in oral and bladder carcinoma, respectively [30, 31], in our study, it did not show any effects on the biological processes analyzed in FaDu or UMSCC-1 cells.
Regarding cell proliferation, we found that the knockdown of HOXC9 suppressed in vitro colony formation in UMSCC-1 cells, indicating that in this cell line, HOXC9 acts positively on cell proliferation. However, in FaDu cell line, the results observed are suggestive of a negative control of cell proliferation. Influence of HOXC9 on cell proliferation has been reported. A study of HOXC9 roles in breast cancer showed results in agreement with the one observed in our assay with FaDu cell line, suggestive of a negative control on cell proliferation. Also, in neuronal tissue and neuroblastoma, HOXC9 seems to have a negative impact on cell cycle progression and proliferation by directly repressing several cell cycle-related genes [32, 33]. Although we had different effects for HOXC9 on cell proliferation, depending on the HNSC cell line used, the results on the analysis of putative targets and co-expression are indicative of a HOXC9 positive influence on cell cycle progression in HNSC. Although the link between HOXC9 and cell cycle genes appear to be consistent, additional studies will be necessary to uncover how HOXC9 impacts cell cycle and proliferation and if its action on these processes is cell-type dependent. Knockdown of either HOXC10 and HOXC13 reduced colony formation capacity and induced cell cycle arrest in the G1-S transition in UMSCC-1 cell line. In addition, among their predicted transcriptional targets there was an enrichment for genes involved in DNA replication and cell-cycle control. Participation of these two HOX in the cell cycle control and proliferation has been reported. HOXC10 was associated to increased proliferation in gastric cancer [34] and with cell-cycle-regulation, facilitating the transition from G1 to S phase and increasing drug resistance [35]. HOXC13 was reported to promote cell proliferation of lung adenocarcinoma via modulation of cyclin D1 and cyclin E1 [36]. Thus, evidence from our results in UMSCC-1 cell line, target prediction and data from the literature supports a role for HOXC10 and HOXC13 in inducing cycle progression and proliferation, through the transcriptional activation of key genes involved in those process in different types of tumors. The lack of effect of HOXC10 and HOXC13 knockdown on FaDu cell proliferation may be related to the disruption of specific gene function or pathways in this particular cell line. Although the global mutational status of UMSCC-1 cell line is not currently available, the one form FADU cells is and it shows that there are indeed several mutations in genes regulating cell cycle progression and proliferation in this cell line (https://portals.broadinstitute.org/ccle) [37, 38].
Our results also support the involvement of HOXC9, HOXC10 and HOXC13 in cell migration and probably in the regulation of epithelial-mesenchymal transition. Knockdown of HOXC10 and HOXC13 reduced cell migration capacity in the two HNSC cell lines used here and lead to increase in E-cadherin and decrease of Vimentin levels in UMSCC-1 cell line, whereas in FADU cell line a significant decrease in Vimentin only was detected. HOXC9 only affected cell migration in UMSCC-1 cells, although there was a trend for reduced migration and a significant decrease in Vimentin levels upon HOXC9 in FaDu cells. To our knowledge, there are no reports showing the association between HOXC13 and cell migration or invasion. Influence of HOXC9 on invasiveness was previously reported in one study, showing that, similarly as in UMSCC-1 cells, in breast cancer cell lines silencing of HOXC9 lead to decreased invasiveness [39]. Out of the three HOX genes only HOXC10 has consistently been reported as being involved in tumor cell migration and invasion. It has been found overexpressed in several types of cancer, such as lung cancer, osteosarcoma, and oral cancer, and in all of them, inhibition of HOXC10 expression resulted in a reduction of invasive and migratory capacity and also reported the contribution of HOXC10 on the regulation of epithelial-mesenchymal transition markers [40–42]. In addition to reveal the influence of HOXC9, HOXC10 and HOXC13 on cell migration and on the expression of epithelial-mesenchymal markers, our work suggests for the first time putative direct transcriptional targets regulated by those three HOX in the EMT process in HNSC. Although further experiments will necessary for validation, our bioinformatic and knockdown experiments support the notion that SNAI2 would be a transcriptional target of all three HOX (HOXC9, HOXC10 and HOXC13); TWIST1 is a probable target of HOXC9 and HOXC13; transcription of TGFB1 could be directly activated by HOXC9 and TGFBR1 is a direct target of HOXC9 and HOXC13.
The results found by our group, suggested that HOXC9, HOXC10, and HOXC13 gene are involved with cell migration and proliferation of HNSC cells. Since migration and proliferation are central main features of cancers and cell cycle alterations would be a hallmark to tumor development, our data reveal that these genes may play a significant role in the pathogenesis of HNSC. Furthermore, our study suggests, for the first time, the involvement of HOXC13 gene in the positive regulation of mesenchymal markers.
In conclusion, based on data from The Cancer Genome Atlas (TCGA) database and also in HNSC cell lines, we report that HOXA10, HOXC9, HOXC10 and HOXC13 genes are overexpressed in HNSC tissues, and the knockdown of HOXC9, HOXC10, and HOXC13 significantly reduced in vitro cell migration and colony formation. Cell cycle control and epithelial-mesenchymal transition (EMT) pathways was showed regulated by those selected HOX genes, which was corroborated by observation of cell cycle arrest and altered expression of EMT markers after HOXC10 and HOXC13 knockdown.
Acknowledgments
We thank Camila Menezes and Patrícia Vianna Bonini Palma for the technical support at Flow Cytometry Core; The National Institute of Science and Technology in Stem Cell and Cell Therapy and Dr. Cláudio Miguel Costa-Neto, from Department of Biochemistry and Immunology, for the technical support; and the Human Identification Service, under the coordination of Dr. Aguinaldo Luiz Simões, for the STR profile. We also thank São Paulo Research Foundation (FAPESP), National Council for Scientific and Technological Development (CNPq), and Coordination of Superior Level Staff Improvement (CAPES) for financial support.
Author contributions
CONCEPTION: GMA, AR, FFC, CC, JS, and WASJr
DATA CURATION: GMA, AR, JP, SCS
ANALYSIS OF DATA: GMA, AR, JP, NVS, FFC, CC, JS, and WASJr
PREPARATION OF THE MANUSCRIPT: GMA, AR, JP, FFC, CC, JS, and WASJr
REVISION FOR IMPORTANT INTELLECTUAL CONTENT: All authors
SUPERVISION: WASJr
Conflict of interest
The authors declare that the research was conducted in the absence of any commercial or financial relationships that could be construed as a potential conflict of interest.
Funding
This work was supported by a grant to WASJr from São Paulo Research Foundation (FAPESP #2013/08135-2). GMA was supported by fellowships from National Council for Scientific and Technological Development (CNPq #160079/2014-4), São Paulo Research Foundation (FAPESP #2015/16329-7) and Coordination of Superior Level Staff Improvement (CAPES 2018 fellowship to GDS). NVS was supported by a fellowship from São Paulo Research Foundation (FAPESP # 2014/20379-7 and #2017/24027-6). JFS received a fellowship from National Council for Scientific and Technological Development (CNPq #157988/2015-5). These funding sources or funding bodies had no role in the design of this study and will not have any role during its execution, analysis, interpretation of the data, or decision to submit the results.
Supplementary material
[1] The supplementary material is available in the electronic version of this article: https://dx.doi.org/10.3233/TUB-211525.
References
[1] | Scott MP , Weiner AJ , Hazelrigg TI , et al. The molecular organization of the Antennapedia locus of Drosophila. Cell. (1983) ;35: (3 Pt 2):763–76. doi:10.1016/0092-8674(83)90109-5. |
[2] | McGinnis W , Levine MS , Hafen E , Kuroiwa A , Gehring WJ . A conserved DNA sequence in homoeotic genes of the Drosophila Antennapedia and bithorax complexes. Nature. (1984) ;308: (5958):428–33. doi:10.1038/308428a0. |
[3] | Zakany J , Duboule D . The role of Hox genes during vertebrate limb development. Curr Opin Genet Dev. (2007) ;17: (4):359–66. doi:10.1016/j.gde.2007.05.011. |
[4] | Nunes FD , de Almeida FC , Tucci R , de Sousa SC . Homeobox genes: a molecular link between development and cancer. Pesqui Odontol Bras. (2003) ;17: (1):94–8. doi:10.1590/s1517-74912003000100018. |
[5] | Pearson JC , Lemons D , McGinnis W . Modulating Hox gene functions during animal body patterning. Nat Rev Genet. (2005) ;6: (12):893–904. doi:10.1038/nrg1726. |
[6] | Kuo TL , Cheng KH , Chen LT , Hung WC . Deciphering The Potential Role of Hox Genes in Pancreatic Cancer. Cancers (Basel). (2019) ;11: (5):734. doi:10.3390/cancers11050734. |
[7] | Li L , Zhang X , Liu Q , et al. Emerging role of HOX genes and their related long noncoding RNAs in lung cancer. Crit Rev Oncol Hematol. (2019) ;139: :1–6. doi:10.1016/j.critrevonc.2019.04.019. |
[8] | Idaikkadar P , Morgan R , Michael A . HOX Genes in High Grade Ovarian Cancer. Cancers (Basel). (2019) ;11: (8):1107. doi:10.3390/cancers11081107. |
[9] | de Bessa Garcia SA , Araújo M , Pereira T , Mouta J , Freitas R . HOX genes function in Breast Cancer development. Biochim Biophys Acta Rev Cancer. (2020) ;1873: (2):58. doi:10.1016/j.bbcan.2020.188358. |
[10] | Paco A , de Bessa Garcia SA , Leitão Castro J , Costa-Pinto AR , Freitas R . Roles of the HOX Proteins in Cancer Invasion and Metastasis. Cancers (Basel). (2020) ;13: (1):10. doi:10.3390/cancers13010010. |
[11] | Head and Neck Cancers NIH National Cancer Institute; 2020 [updated May 15, 2020]. Available from: https://www.cancer.gov/types/head-and-neck/head-neck-fact-sheet#how-common-are-head-and-neck-cancers. |
[12] | Global Burden of Disease Cancer Collaboration, Fitzmaurice C , Abate D , et al. Global, Regional, and National Cancer Incidence, Mortality, Years of Life Lost, Years Lived With Disability, and Disability-Adjusted Life-Years for 29 Cancer Groups, 1990 to 2017: A Systematic Analysis for the Global Burden of Disease Study. JAMA Oncol. (2019) ;5: (12):1749–68. doi:10.1001/jamaoncol.2019.2996. |
[13] | Wild CP , Weiderpass E , Stewart BW , editors. World Cancer Report: Cancer Research for Cancer Prevention. Lyon, France: International Agency for Research on Cancer. Licence: CC BY-NC-ND 3.0 IGO. 2020. |
[14] | Park BJ , Chiosea SI , Grandis JR . Molecular changes in the multistage pathogenesis of head and neck cancer. Cancer Biomark. (2010) ;9: (1–6):325–39. doi:10.3233/CBM-2011-0163. |
[15] | de Barros E , Lima Bueno R , Ramão A , Pinheiro DG , et al. HOX genes: potential candidates for the progression of laryngeal squamous cell carcinoma. Tumour Biol. (1508) ;37: (11):7–96. doi:10.1007/s13277-016-5356-8. |
[16] | Colaprico A , Silva TC , Olsen C , et al. TCGAbiolinks: an R/Bioconductor package for integrative analysis of TCGA data. Nucleic Acids Res. (2016) ;44: (8):e71. doi:10.1093/nar/gkv1507. |
[17] | McCarthy DJ , Chen Y , Smyth GK . Differential expression analysis of multifactor RNA-Seq experiments with respect to biological variation. Nucleic Acids Res. (2012) ;40: (10):4288–97. doi:10.1093/nar/gks042. |
[18] | Gu Z , Eils R , Schlesner M . Complex heatmaps reveal patterns and correlations in multidimensional genomic data. Bioinformatics. (2016) ;32: (18):2847–9. doi:10.1093/bioinformatics/btw313. |
[19] | Tang Z , Li C , Kang B , Gao G , Li C , Zhang Z . GEPIA: a web server for cancer and normal gene expression profiling and interactive analyses. Nucleic Acids Res. (2017) ;45: (W1):W98–W102. doi:10.1093/nar/gkx247. |
[20] | Mei S , Qin Q , Wu Q , et al. Cistrome Data Browser: a data portal for ChIP-Seq and chromatin accessibility data in human and mouse. Nucleic Acids Res. (2017) ;45: (D1):D658–D662. doi:10.1093/nar/gkw983. |
[21] | Frith MC , Saunders NF , Kobe B , Bailey TL . Discovering sequence motifs with arbitrary insertions and deletions. PLoS Comput Biol. (2008) ;4: (4):e1000071. doi:10.1371/journal.pcbi.1000071. |
[22] | Grant CE , Bailey TL , Noble WS . FIMO: scanning for occurrences of a given motif. Bioinformatics. (2011) ;27: (7):1017–18. doi:10.1093/bioinformatics/btr064. |
[23] | Plaça JR . Genomic profile evaluation of HOX genes family in cancer using public databases. [master’s thesis]. Ribeirão Preto (Brazil): University of São Paulo; (2017) . |
[24] | Zhang B , Kirov S , Snoddy J . WebGestalt: an integrated system for exploring gene sets in various biological contexts. Nucleic Acids Res. (2005) ;33: :W741–W748. doi:10.1093/nar/gki475. |
[25] | Wang J , Duncan D , Shi Z , Zhang B . WEB-based GEne SeT AnaLysis Toolkit (WebGestalt): update 2013. Nucleic Acids Res. (2013) ;41: :W77–W83. doi:10.1093/nar/gkt439. |
[26] | Wang J , Vasaikar S , Shi Z , Greer M , Zhang B . WebGestalt a more comprehensive, powerful, flexible and interactive gene set enrichment analysis toolkit. Nucleic Acids Res. (2017) ;45: (W1):W130–W137. doi:10.1093/nar/gkx356. |
[27] | Subramanian A , Tamayo P , Mootha VK , et al. Gene set enrichment analysis: a knowledge-based approach for interpreting genome-wide expression profiles. Proc Natl Acad Sci U S A. (2005) ;102: (43):15545–50. doi:10.1073/pnas.0506580102. |
[28] | Mootha VK , Lindgren CM , Eriksson KF , et al. PGC-1alpha-responsive genes involved in oxidative phosphorylation are coordinately downregulated in human diabetes. Nat Genet. (2003) ;34: (3):267–73. doi:10.1038/ng1180. |
[29] | Shah N , Sukumar S . The Hox genes and their roles in oncogenesis. Nat Rev Cancer. (2010) ;10: (5):361–71. doi:10.1038/nrc2826. |
[30] | Carrera M , Bitu CC , de Oliveira CE , et al. HOXA10 controls proliferation, migration and invasion in oral squamous cell carcinoma. Int J Clin Exp Pathol. (2015) ;8: (4):3613–23. |
[31] | Liu C , Ge M , Ma J , Zhang Y , Zhao Y , Cui T . Homeobox A10 promotes the proliferation and invasion of bladder cancer cells via regulation of matrix metalloproteinase-3. Oncol Lett. (2019) ;18: (1):49–56. doi:10.3892/ol.2019.10312. |
[32] | Mao L , Ding J , Zha Y , et al. HOXC9 links cell-cycle exit and neuronal differentiation and is a prognostic marker in neuroblastoma. Cancer Res. (2011) ;71: (12):4314–24. doi:10.1158/0008-5472.CAN-11-0051. |
[33] | Wang X , Choi JH , Ding J , et al. HOXC9 directly regulates distinct sets of genes to coordinate diverse cellular processes during neuronal differentiation. BMC Genomics. (2013) ;14: :830. doi:10.1186/1471-2164-14-830. |
[34] | Kim J , Bae DH , Kim JH , Song KS , Kim YS , Kim SY . HOXC10 overexpression promotes cell proliferation and migration in gastric cancer. Oncol Rep. (2019) ;42: (1):202–12. doi:10.3892/or.2019.7164. |
[35] | Sadik H , Korangath P , Nguyen NK , et al. HOXC10 Expression Supports the Development of Chemotherapy Resistance by Fine Tuning DNA Repair in Breast Cancer Cells. Cancer Res. (2016) ;76: (15):4443–56. doi:10.1158/0008-5472.CAN-16-0774. |
[36] | Yao Y , Luo J , Sun Q , et al. HOXC13 promotes proliferation of lung adenocarcinoma via modulation of CCND1 and CCNE1. Am J Cancer Res. (2017) ;7: (9):1820–34. |
[37] | Cancer Cell Line Encyclopedia Consortium; Genomics of Drug Sensitivity in Cancer Consortium. Pharmacogenomic agreement between two cancer cell line data sets. Nature. (2015) ;528: (7580):84–7. doi:10.1038/nature15736. |
[38] | Barretina J , Caponigro G , Stransky N , et al. The Cancer Cell Line Encyclopedia enables predictive modelling of anticancer drug sensitivity. Nature. (2012) ;492: (7428):290. |
[39] | Hur H , Lee JY , Yang S , Kim JM , Park AE , Kim MH . HOXC9 Induces Phenotypic Switching between Proliferation and Invasion in Breast Cancer Cells. J Cancer. (2016) ;7: (7):768–73. doi:10.7150/jca.13894. |
[40] | Tang XL , Ding BX , Hua Y , et al. HOXC10 Promotes the Metastasis of Human Lung Adenocarcinoma and Indicates Poor Survival Outcome. Front Physiol. (2017) ;8: :557. doi:10.3389/fphys.2017.00557. |
[41] | Xiong W , Zhou Q , Liu G , Liu XS , Li XY . Homeodomain-containing gene 10 inhibits cell apoptosis and promotes cell invasion and migration in osteosarcoma cell lines. Tumour Biol. (2017) :39: (5). doi:10.1177/1010428317697566. |
[42] | Dai BW , Yang ZM , Deng P , et al. HOXC10 promotes migration and invasion via the WNT-EMT signaling pathway in oral squamous cell carcinoma. J Cancer. (2019) ;10: (19):4540–455. doi:10.7150/jca.30645. |


