
Identification of interleukin-16 production on tumor aggravation in hepatocellular carcinoma by a proteomics approach
Abstract
BACKGROUND:
Cytokines play an important role in the immune response, angiogenesis, cell growth, and differentiation in hepatocellular carcinoma (HCC).
OBJECTIVE:
We performed a comprehensive study to identify tumor-related cytokines and pathways involved in HCC pathogenesis.
METHODS:
Cytokine production was evaluated in human HCC tissues and adjacent non-tumor tissues using an antibody-based protein array technique. We compared cytokine expression in HCC tissues with that of hepatic hemangioma (HH), liver metastasis of colorectal cancer, and noncancerous liver tissues from transplantation donors. The protein levels and localization of the candidate cytokines were analyzed by western blotting and immunohistochemistry.
RESULTS:
Increased expression of interleukin (IL)-1 receptor antagonist, macrophage migration inhibitory factor, and IL-16 was observed in HCC and paired adjacent non-tumor tissues compared with noncancerous livers. In addition, there were increased IL-16 levels in HCC tissues compared with HH. IL-16 treatment significantly increased cell proliferation in vitro. The expression of extracellular signal-regulated kinase (ERK)1/2 and cyclin D1 was markedly increased in cells from two HCC cell lines, Huh7 and HepG2, in a dose- and time-dependent manner. Phosphorylated to total ERK1/2 ratio was increased in Huh7 cells following IL-16 50 ng/ml, but not HepG2 cells. ERK phosphorylation have occurred earlier than protein accumulation at 48 h. Pretreatment with the ERK inhibitor, FR18024, or an anti-IL-16 antibody reduced the increase in IL-16 production in HCC cells.
CONCLUSIONS:
These results suggest that cell proliferation induced by IL-16 is mediated through the ERK pathway, thus, we identified a new factor associated with HCC tumor growth.
1Introduction
Hepatocellular carcinoma (HCC) is the most common malignancy of the liver and is the 3rd leading cause of cancer-related deaths worldwide [1]. The prognosis for patients with hepatocellular carcinoma (HCC) is usually poor. HCC may occur as a consequence of various pathologic conditions that cause chronic liver damage [1] and it is preceded by chronic hepatitis and liver cirrhosis, which alter the immune microenvironment to promote HCC development [2]. Under these conditions, the hepatic immune cells release cytokines that play a role in defense [2]. Several cytokines are involved in the immune response, angiogenesis, tumor growth, and differentiation in HCC pathogenesis [3].
Hepatic hemangioma (HH) is a benign liver tumor of the mesenchymal tissues [4]. These tumors can grow large enough to cause a number of symptoms, including severe hepatic dysfunction. Lazăr et al. demonstrated that inflammatory cytokines play a role in the angiogenesis of HH [4]. The activation of various immune modulatory cytokines and innate immune cells, such as natural killer cells and dendritic cells, are downregulated in patients with the progression of HCC [5]. Consequently, many cytokines are released in response to a diverse range of cellular stresses, including infection, inflammation, and carcinogenesis. These proteins are generally grouped into two categories: pro-inflammatory or anti-inflammatory [6]. Th1 cytokines, including interleukin (IL)-1α, IL-1β, IL-2, IL-12p35, IL-12p40, IL-15, tumor necrosis factor (TNF)-α, and interferon (IFN)-γ, are generally referred to as pro-inflammatory, whereas Th2 cytokines, such as IL-4, IL-8, IL-10, and IL-5, induce anti-inflammatory responses [3]. These cytokines activate a host response aimed at controlling cellular stress and minimizing cellular damage.
The liver is an organ enriched with immune cells and liver cancer progresses by a viral-induced immune response from chronic inflammation and consequent regeneration. Studies have shown that increased expression of the Th2 cytokine, IL-10, in HCC tumors correlates with disease progression [7, 8]. Conversely, the Th1 cytokine, IFN-γ, activates macrophages and increases TNF-α, which compromises liver function [9]. Patients with HCC and either low serum IFN-γ levels or negative IFN-γ receptor expression in cancerous tissues usually have large-sized tumors, higher metastases, and an increased risk of tumor recurrence after curative treatment [10]. Th1 and Th2 imbalances in the HCC microenvironment induce metastasis and recurrence, thereby exerting a significant effect on patient prognosis. Identifying and characterizing factors underlying HCC pathogenesis and their regulation may lead to improved diagnostic and therapeutic strategies. Understanding the role of cytokines through longitudinal studies will provide further insight into the process of HCC progression.
Proteomics represents a powerful tool for discovering cancer-specific biomarkers and their properties during cancer progression [11]. In the present study, we performed differential profiling of cytokines from HCC tissues and adjacent non-tumoral liver tissues using a cytokine array. Our findings may help to identify factors involved in HCC invasion and progression that may lead to the development of new therapeutic strategies.
2Materials and methods
2.1Drugs and antibodies
Recombinant IL-16 (rIL-16) and anti-human IL-16 antibody (Ab) was obtained from R&D Systems (Minneapolis, MN, USA) and recombinant human macrophage migration inhibitory factor (rhMIF) and recombinant human interleukin-1 receptor antagonist (rh IL-1ra) was obtained from PeproTech (Rockey Hill. NJ, USA). These reagents were dissolved in phosphate buffer saline (Nissui Pharmaceutical, Tokyo, Japan) and stored at –20°C until use. The extracellular signal-regulated kinase (ERK) inhibitor II, FR180204, was obtained from Merck Millipore (Darmstadt, Germany), dissolved in dimethyl sulfoxide (Fujifirm Wako Pure Chemical, Osaka, Japan), and stored at –20°C until use. In addition to anti-human IL-16 Ab, the following Abs were used: rabbit anti-ERK1/2 polyclonal Ab, rabbit anti-phospho-ERK1/2 polyclonal Ab, and rabbit anti-cyclin D1 polyclonal Ab (Santa Cruz Biotechnology, Santa Cruz, CA, USA).
2.2Human liver tissue samples
Human liver tissue samples preserved in our internal human tissue bank were obtained from patients undergoing partial hepatectomy for liver disease, including HCC and liver metastasis of colorectal cancer, at St. Marianna University Hospital in Kanagawa, Japan. Liver samples were managed using anonymized numbers and each patient provided written informed consent before surgery. No patients showed evidence of concurrent hepatitis B or hepatitis C virus-related HCC. Noncancerous liver samples from Caucasian and Hispanic transplantation donors were supplied by the National Disease Research Interchange (Philadelphia, PA, USA) through the Biomedical Research Institute, Human and Animal Bridging Research Organization (Chiba, Japan). The St. Marianna University School of Medicine Ethics Committee approved this study (approval number 1208).
All tissue samples were frozen in liquid nitrogen or fixed in 10%formalin and embedded in paraffin. Non-tumor tissue specimens were obtained from at least 10 cm away from the tumor region and they were confirmed to be free of tumor cells by pathological analysis.
2.3Cytokine and chemokine profiles using antibody arrays
Whole protein from liver tissues was extracted using a lysis solution (Tris-HCl 50 mM, pH 7.4, EGTA 1 mM, 0.001%leupeptin) and supernatants were collected after centrifugation for 30 min at 15,000 rpm. Simultaneous profiling was performed to identify the relative levels of multiple cytokines in a single sample using the Human Cytokine Array Panel A (Proteome ProfilerTM, R&D Systems) which consists of 36 cytokine and chemokine Abs spotted in duplicate onto a membrane [12]. The assay was performed according to the manufacturer’s instructions. The membrane was blocked with 10%bovine serum albumin in Tris-buffered saline, followed by incubation with the primary Ab while shaking at 110 rpm at 4°C overnight. After a series of washes, 2 mL of a 1:500 dilution of biotin-conjugated Abs were added to the membrane. The membrane was incubated on a shaker for 2 h at room temperature. Following a wash, the membrane was incubated with streptavidin-conjugated peroxidase for 1 h at room temperature. Reactive proteins were detected by enhanced chemiluminescence using an ECL Plus Kit (GE Healthcare, Buckinghamshire, UK). The arrays were scanned into a computer and optical density measurements were obtained with the densitograph software, CS Analyzer 3 (ATTO, Tokyo, Japan). The net density gray levels were determined for each spot by subtracting the gray background levels from the total raw density gray levels.
2.4Cell lines and cell cultures
The HCC lines, Huh7 and HepG2, were obtained from the Riken Gene Bank (Tsukuba, Japan). Cells were cultured in RPMI-1640 medium containing 10%fetal bovine serum (Sigma-Aldrich, St. Louis, MO, USA) with penicillin (100 units/mL) and streptomycin (100μg/mL) at 37°C in an atmosphere of 5%CO2 and 95%O2. Cells (5×10⁵) were seeded in culture dishes. The cells were incubated for 48 h and the second Day was designated as Day 0. From Day 0, cells were incubated with rIl-16 at concentrations of 20, 50, or 100 ng/mL for either 48 h or 72 h.
2.5Immunohistochemistry
Hepatic tissue samples fixed in 10%formalin were embedded in paraffin and sliced longitudinally into 5-μm-thick sections. Paraffin-embedded samples were deparaffinized in xylene and rehydrated in a graded ethanol series. Endogenous peroxidase activity was inactivated with 0.1%hydrogen peroxide. After blocking with bovine serum for 30 min, the slides were incubated with an anti-IL-16 polyclonal Ab diluted to 1:200. Immunoreactivity in the sections was demonstrated using the DAKO Envision system (Carpinteria, CA, USA) following the manufacturer’s instructions. Finally, the tissues were counterstained with hematoxylin and eosin. Microscopic observation was performed using a Carl Zeiss Axiophot microscope (Hitschfeld Optical Instruments, St. Louis, MO, USA). Rabbit serum was used as a negative control.
2.6Cell proliferation assay
Huh7 and HepG2 cells (4×10⁴) were cultured with rIl-16 for 4, 16, and 24 h in 96-well flat bottom plates (Costar, NY, USA) in 200μL of RPM1-1640 medium. After incubation, 20μL of 3-(4,5-dimethylthiazol-2-yl)-5-(3-carboxymethoxyphenyl)-2-(4-sulfophenyl)-2H-tetrazolium (MTS) substrate was added to each well. Cell proliferation was evaluated using a CellTiter 96 Aqueous One Solution Cell Proliferation Assay (Promega, Madison, WI, USA) and the procedure was performed according to the manufacturer’s instructions. Absorbance was measured at 490 nm with a Multiscan microplate reader (Thermo Labsystems, Vantaa, Finland). The proliferation rate was determined as the ratio of the optical density of treated to control cells.
2.7Western blot analysis
Whole cell extracts were prepared from HepG2 and Huh7 cells using cell lysis buffer and nuclear proteins were extracted using a NE-PER Nuclear and Cytoplasmic Extraction Kit (Pierce Biotechnology, Rockford, IL, USA). Protein concentration was measured using a Bio-Rad Protein Assay Kit (Hercules, CA, USA). Samples (30μg) were resolved by 10%SDS-polyacrylamide gel electrophoresis and then transferred to a Hybond-ECL membrane (Roche Diagnostics, Basel, Swiss). The membrane was blocked overnight at 4°C with 5%skim milk in Tris-buffered saline containing Tween 20 (NaCl 150 mmol/L, Tris-HCl 10 mmol/L, pH 7.5, Tween 0.5%). The membranes were incubated with primary Ab for 2 h at room temperature and reactive proteins were detected by enhanced chemiluminescence (ImmunoStar, Wako, Tokyo). Signal intensities were analyzed using a C-DiGit Chemiluminescent Western Blot Scanner (LI-COR Bioscience, Lincoln, NE, USA), and protein expression was quantified by densitometric analysis. Expression of α-tubulin was used as a control to normalize the respective band densities.
2.8Statistical analysis
Data are expressed as the mean±standard error of the mean (SEM). The Steal-Dwass test for multiple comparisons was used to evaluate differences between respective groups. All statistical analyses were performed using JMP®13 software (SAS Institute Inc., Cary, NC, USA). A p-value < 0.05 was considered statistically significant.
3Results
3.1Identification of differentially secreted cytokines in HCC tissues by cytokine array
First, we identified three cytokines that were significantly differentially expressed between paired tumor and adjacent non-tumor regions from liver tissues of six patients with HCC and noncancerous livers from transplantation donors (Fig. 1a). All differentially expressed cytokines were upregulated at least 2-fold in the liver tissues of patients with HCC. Interleukin-1 receptor antagonist (IL-1ra) and macrophage migration inhibitory factor (MIF) are cytokines commonly associated with HCC pathogenesis [10, 11]. Thus, as expected, we found that the IL-1ra spot density from HCC liver samples of non-tumor and tumor regions differed by 4.1- and 3.7-fold, respectively, compared with noncancerous liver tissue. Similarly, the spot density of MIF from HCC liver samples from non-tumor and tumor regions was also different by 4.9- and 4.9-fold, respectively. However, we also found that the IL-16 spot density from HCC liver samples of non-tumor and tumor regions differed by 2.4-fold and 1.9-fold, respectively, although the differential expression was lower compared with that of the other two cytokines.
Fig. 1
Antibody-based microarray analysis of HCC patient samples. (a) All protein array analyses were done according to the manufacturer’s instructions. Antibody array layout (upper panel). Positive controls (Posi) are located in the upper left-hand corner (two spots) and higher right-hand corner (two spots), and negative controls (Nega) are located in the lower right-hand corner (two spots) of each array panel. Pixel densities were analyzed by densitometry. The expression of individual proteins was calculated after normalizing to the positive control on each array (middle panel). Among the several cytokines evaluated, the expression of the IL-1 receptor antagonist (ra), MIF, PAI-1, and IL-16 were increased 2-fold in tumor regions of HCC tissues and paired adjacent non-tumor regions compared with noncancerous liver samples (lower panel). Representative images of six independent experiments are shown. (b) Western blot analysis showing IL-16 expression and band intensities in HCC, hepatic hemangioma (HH), and noncancerous liver tissues. Levels of α-tubulin are shown as a control and used for normalization. The percentage of IL-16 expression in respective cancer tissues is shown as the value relative to the average (as 100%) of seven non-cancer liver tissues. The image of Fig.1b was assembled from separate blots representing HCC and HH/noncancerous livers. Data indicate the mean±SEM. Data are representative of 5–7 independent experiments. Sample numbers are given in parentheses.
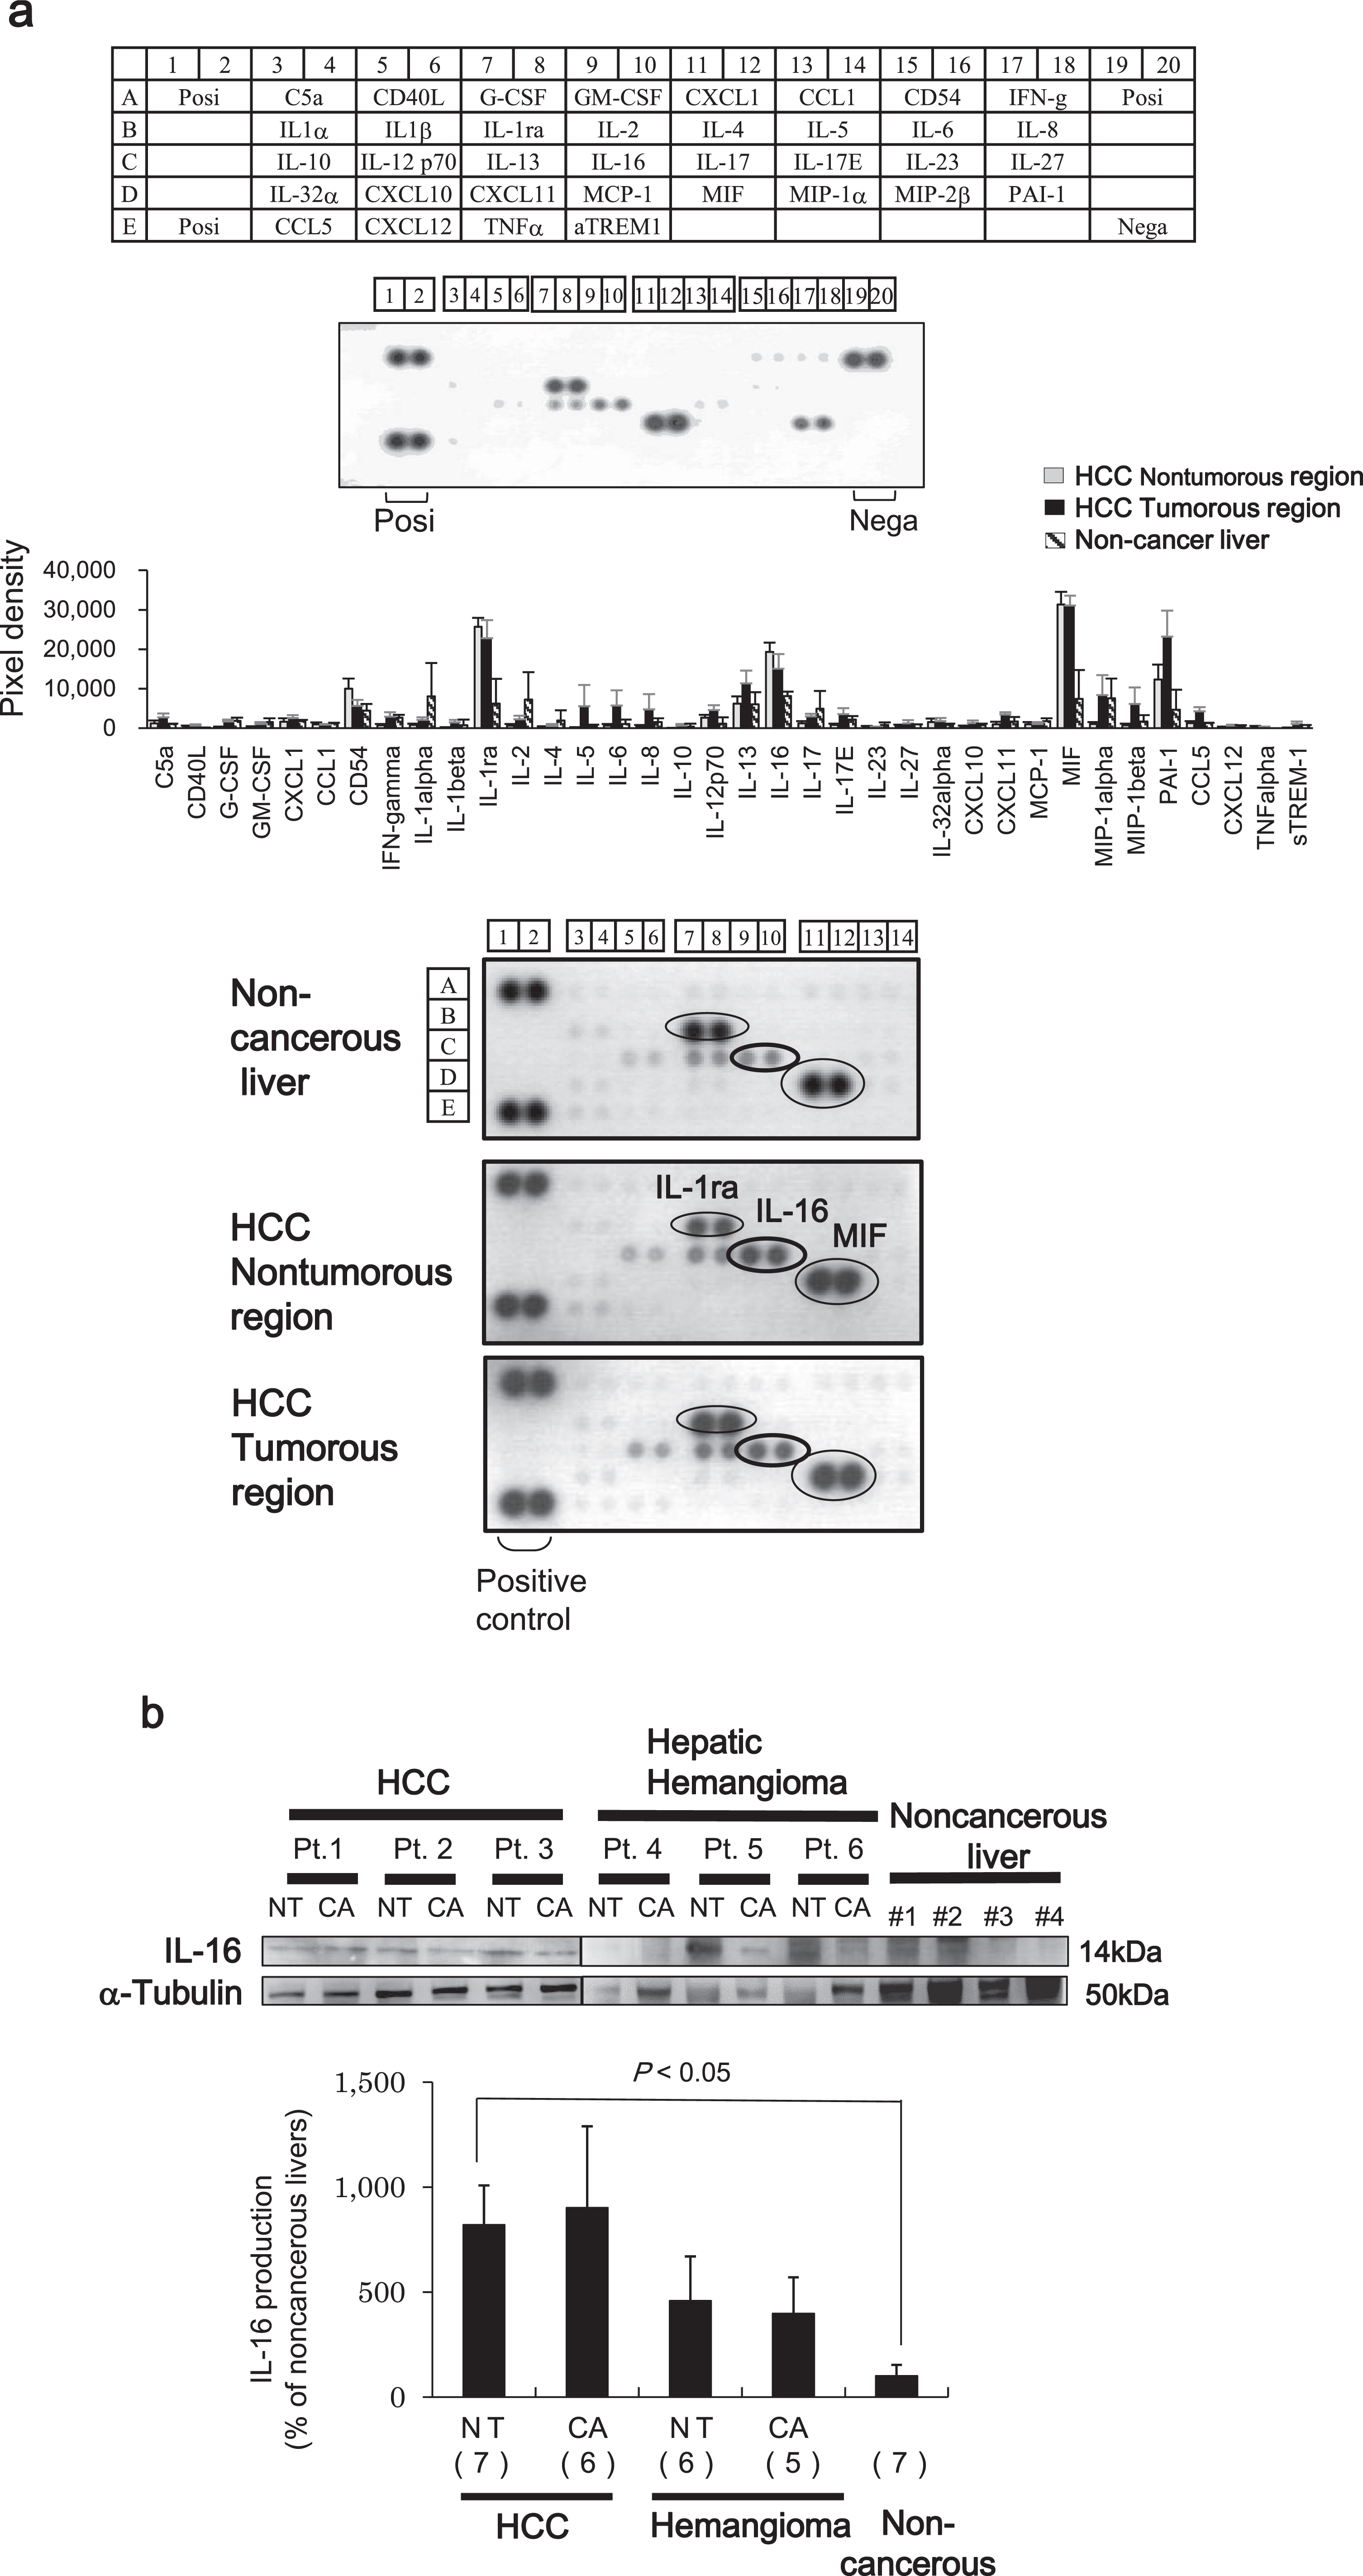
A number of studies have previously reported a relationship between aberrant expression of IL-1ra and MIF and HCC pathogenesis [13, 14]. Therefore, we determined whether the upregulation of IL-16 contributes to HCC pathogenesis. IL-16 protein expression was measured in HCC liver samples and compared with that of the benign tumor (HH) and noncancerous liver samples using western blot analysis. The protein levels of IL-16 in both non-tumor and tumor regions of the HCC tissues were higher compared with those found in HH and noncancerous liver tissues (Fig. 1b).
3.2IL-16 secretion in human liver tissue
Next, we evaluated IL-16 secretion in liver tissues by immunohistochemical analysis. In HCC tissues with hepatitis, IL-16-positive cells were commonly found with perivascular blood cells, but not with hepatocytes or tumor cells. Also, there were no IL-16-positive cells in the noncancerous liver tissue, although there was some slight positivity in HH and liver metastasis of colorectal cancer tissues (Fig. 2a).
Fig. 2
(a) Immunohistochemical analysis of IL-16 in tissue samples of noncancerous liver (B), hepatitis B virus-related HCC (D), hepatitis C virus-related HCC (F), hepatic hemangioma (H), and liver metastasis of colorectal cancer (J). Consecutive sections were stained with hematoxylin and eosin (A, C, E, G, and I). Original magnification×200. Scale bar = 100μm. (b) IL-16-positive cells around the infiltration area of CD3-positive cells from tumor (lower panel) and adjacent non-tumor regions (upper panel) of nonviral-related HCC. Consecutive sections stained with hematoxylin and eosin are shown on the right side. Original magnification×200. HBV+, hepatitis B virus-positive; HCV+, hepatitis C virus-positive. Scale bar = 100μm.
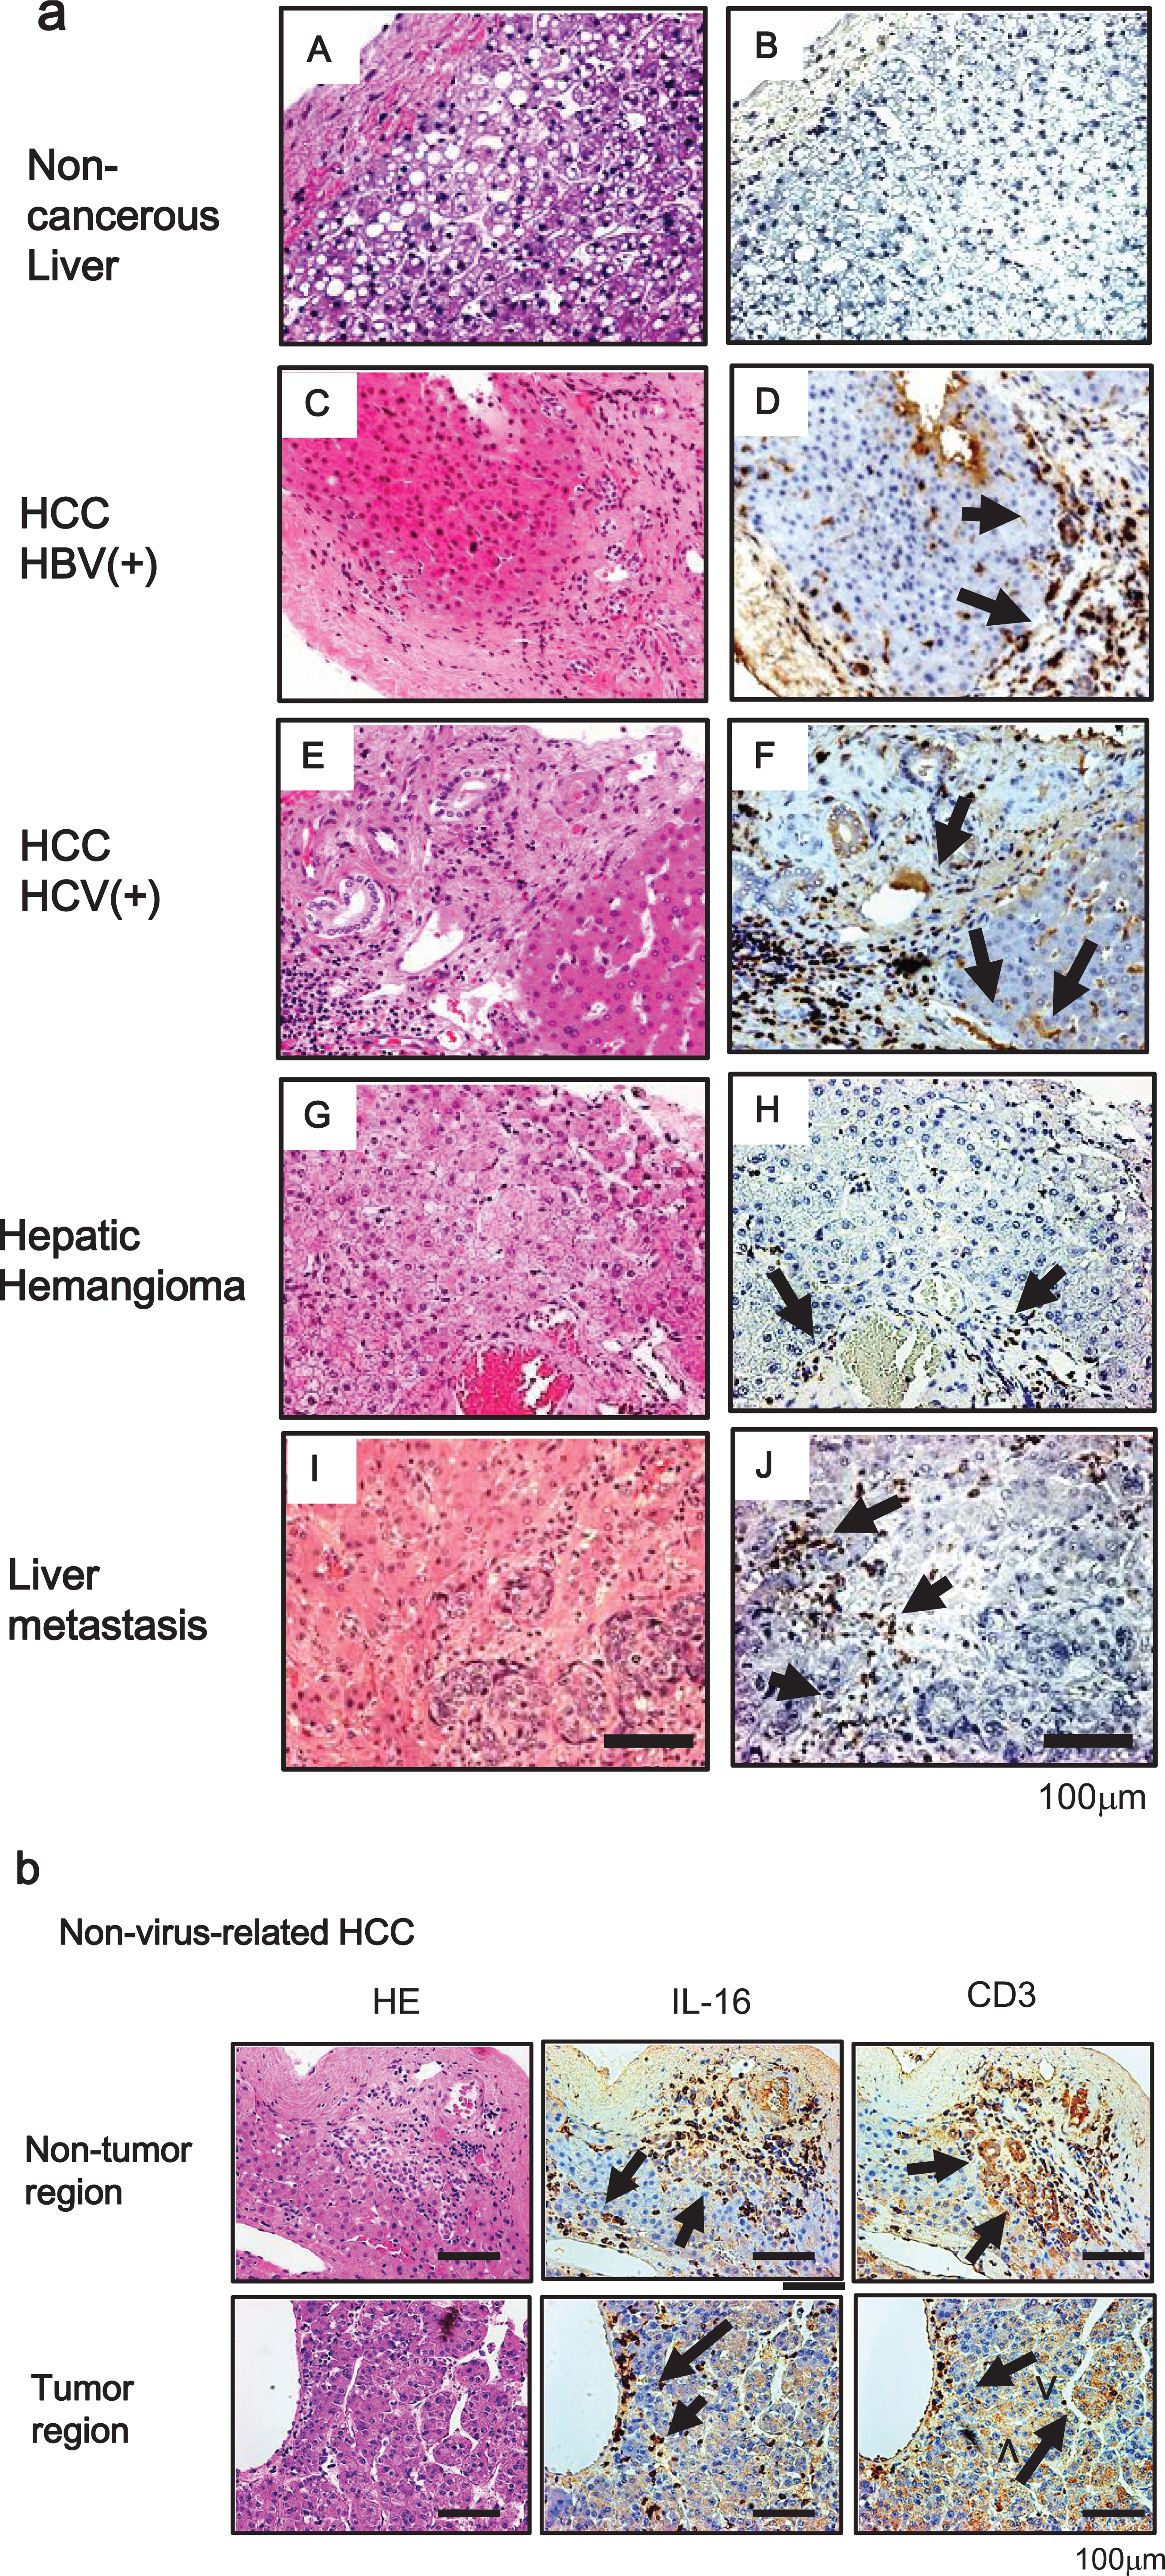
IL-16, which has been characterized as a chemoattractant for T cells, is produced by peripheral lymphocytes [15]. We verified whether IL-16 secretion is observed in the area of infiltrated lymphocytes. As a T lymphocyte marker, many CD3-positive cells were observed with HCC cells and hepatocytes in noncancerous regions. Furthermore, IL-16-positive cells were localized to the area of infiltrated CD3-positive cells (Fig. 2b).
3.3Effects of IL-16 on the proliferation of HCC cells
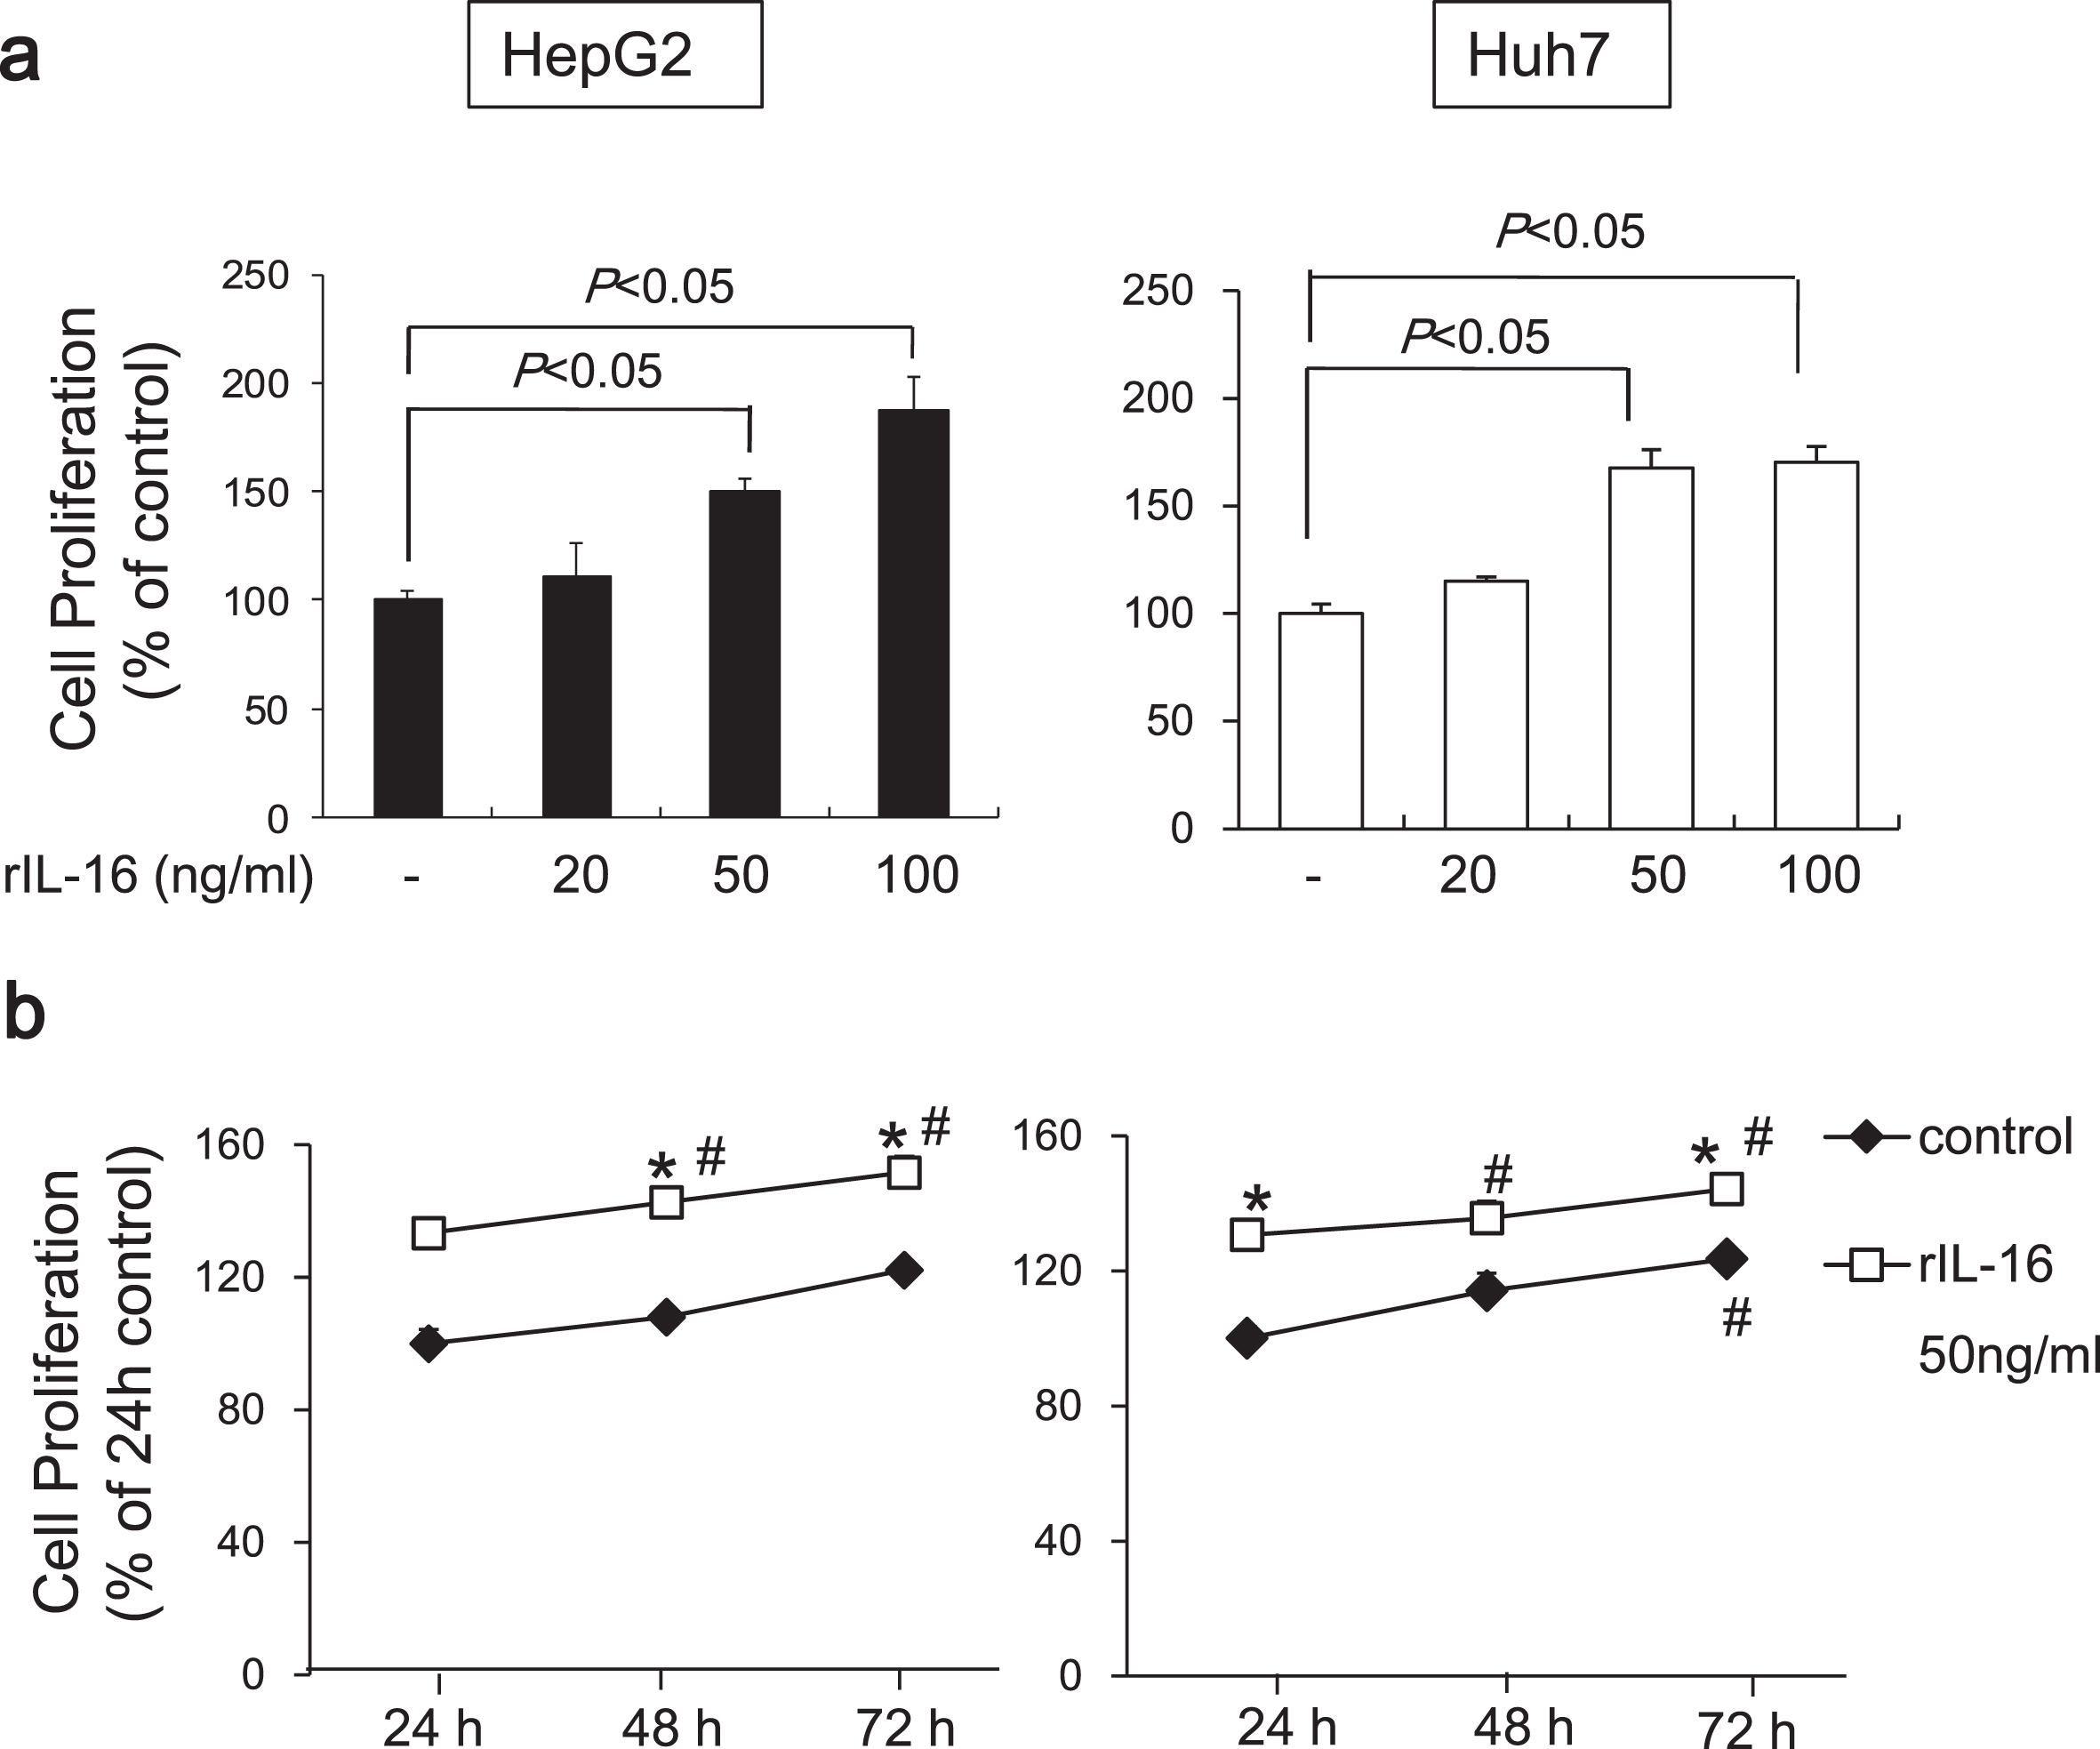
To determine the effects of IL-16 on HCC cell proliferation, we evaluated the HCC cell lines, HepG2 and Huh7. We found that rIL-16 treatment for 48 h significantly increased cell proliferation in HepG2 cells in a dose-dependent manner (no treatment: 100.0±6.2; rIL-16 20 ng/mL: 105.4±11.0; 50 ng/mL: 143.9±6.1; and 100 ng/mL: 171.7%±9.4%). Proliferation of Huh7 cells exposed to rIL-16 was also increased (rIl-16 20 ng/mL: 114.9±5.7; 50 ng/mL: 167.7±8.4; and 100 ng/mL: 170.4%±7.2%) compared with untreated cells (100.0%±4.4%) (Fig. 3a). Cell proliferation increased in untreated HCC cells in a time-dependent manner, and furthermore, IL-16 treatment increased HCC cell proliferation. The proliferation of IL-16-treated HepG2 and Huh7 cells increased significantly at 48 and 72 h compared with IL-16 treatment for 24 h (Fig. 3b).
Fig. 3
Proliferation of HepG2 and Huh7 cells cultured with rIL-16. (a) Cells (5×10⁴) were treated with IL-16 at 20, 50, and 100 ng/mL in 96-well plates for 48 h. Cell proliferation was measured using the MTS assay and measuring absorbance at 490 nm. Cell proliferation is presented as the ratio of the optical density of IL-16-treated cells to that of untreated cells. Data indicate the mean±SEM and are representative of eight and six independent experiments with HepG2 and Huh7 cells, respectively. p < 0.05 versus untreated cells. (b) Cell proliferation of HCC cells treated with 50 ng/mL rIL-16 was evaluated for 72 h. Data indicate the mean±SEM and are representative of six independent experiments each with HepG2 and Huh7 cells. *p < 0.05 versus untreated cells. #p < 0.05 versus untreated cells for 24 h.
3.4IL-16 increases the expression of ERK and cyclin D1
Recently, studies have shown that aberrant, rapid changes in mitogen activated protein kinase (MAPK) and ERK activation are important for cancer growth, survival, and motility [16]. Thus, we evaluated the expression of ERK1/2 and phosphorylated ERK1/2 in HCC cells treated with rIL-16 and found that IL-16 markedly increased total ERK 1/2 protein levels in both HCC cell types in a dose-dependent manner (HepG2: no treatment: 100.0±6.1; rIL-16 20 ng/mL: 125.9±6.1; 50 ng/mL: 160.1±7.3; and 100 ng/mL: 238.5%±14.7%; Huh7: no treatment: 100.0±7.7; rIL-16 20 ng/mL: 119.0±9.0; 50 ng/mL: 179.5±4.9; and 100 ng/mL: 196.4%±5.0%). The ratio of phosphorylated to total ERK1/2 protein levels was not changed in HepG2, however, Huh7 cells treated with 50 ng/mL IL-16 (226.5±8.9 %) exhibited a significant increase compared with that of controls (100.0±23.3%) (Fig. 4a). These results suggest that ERK phosphorylation may arise earlier than protein accumulation over a 48-hour period.
Fig. 4
Western blot band intensities of (a) ERK1/2 protein and phosphorylated ERK1/2 protein and (b) cyclin D1 in HCC cell lines. HCC cells were treated with IL-16 for 48 h. Total ERK1/2 increased significantly in HepG2 and Huh7 cells in a dose-dependent manner. Data indicate the mean±SEM. ERK1/2 and phosphorylated ERK1/2 data are representative of six independent experiments. Cyclin D1 data are representative of five (HepG2) and six (Huh7) independent experiments. α-Tubulin was used as a loading control and to normalize protein intensities. ERK, extracellular signal-regulated protein kinase.
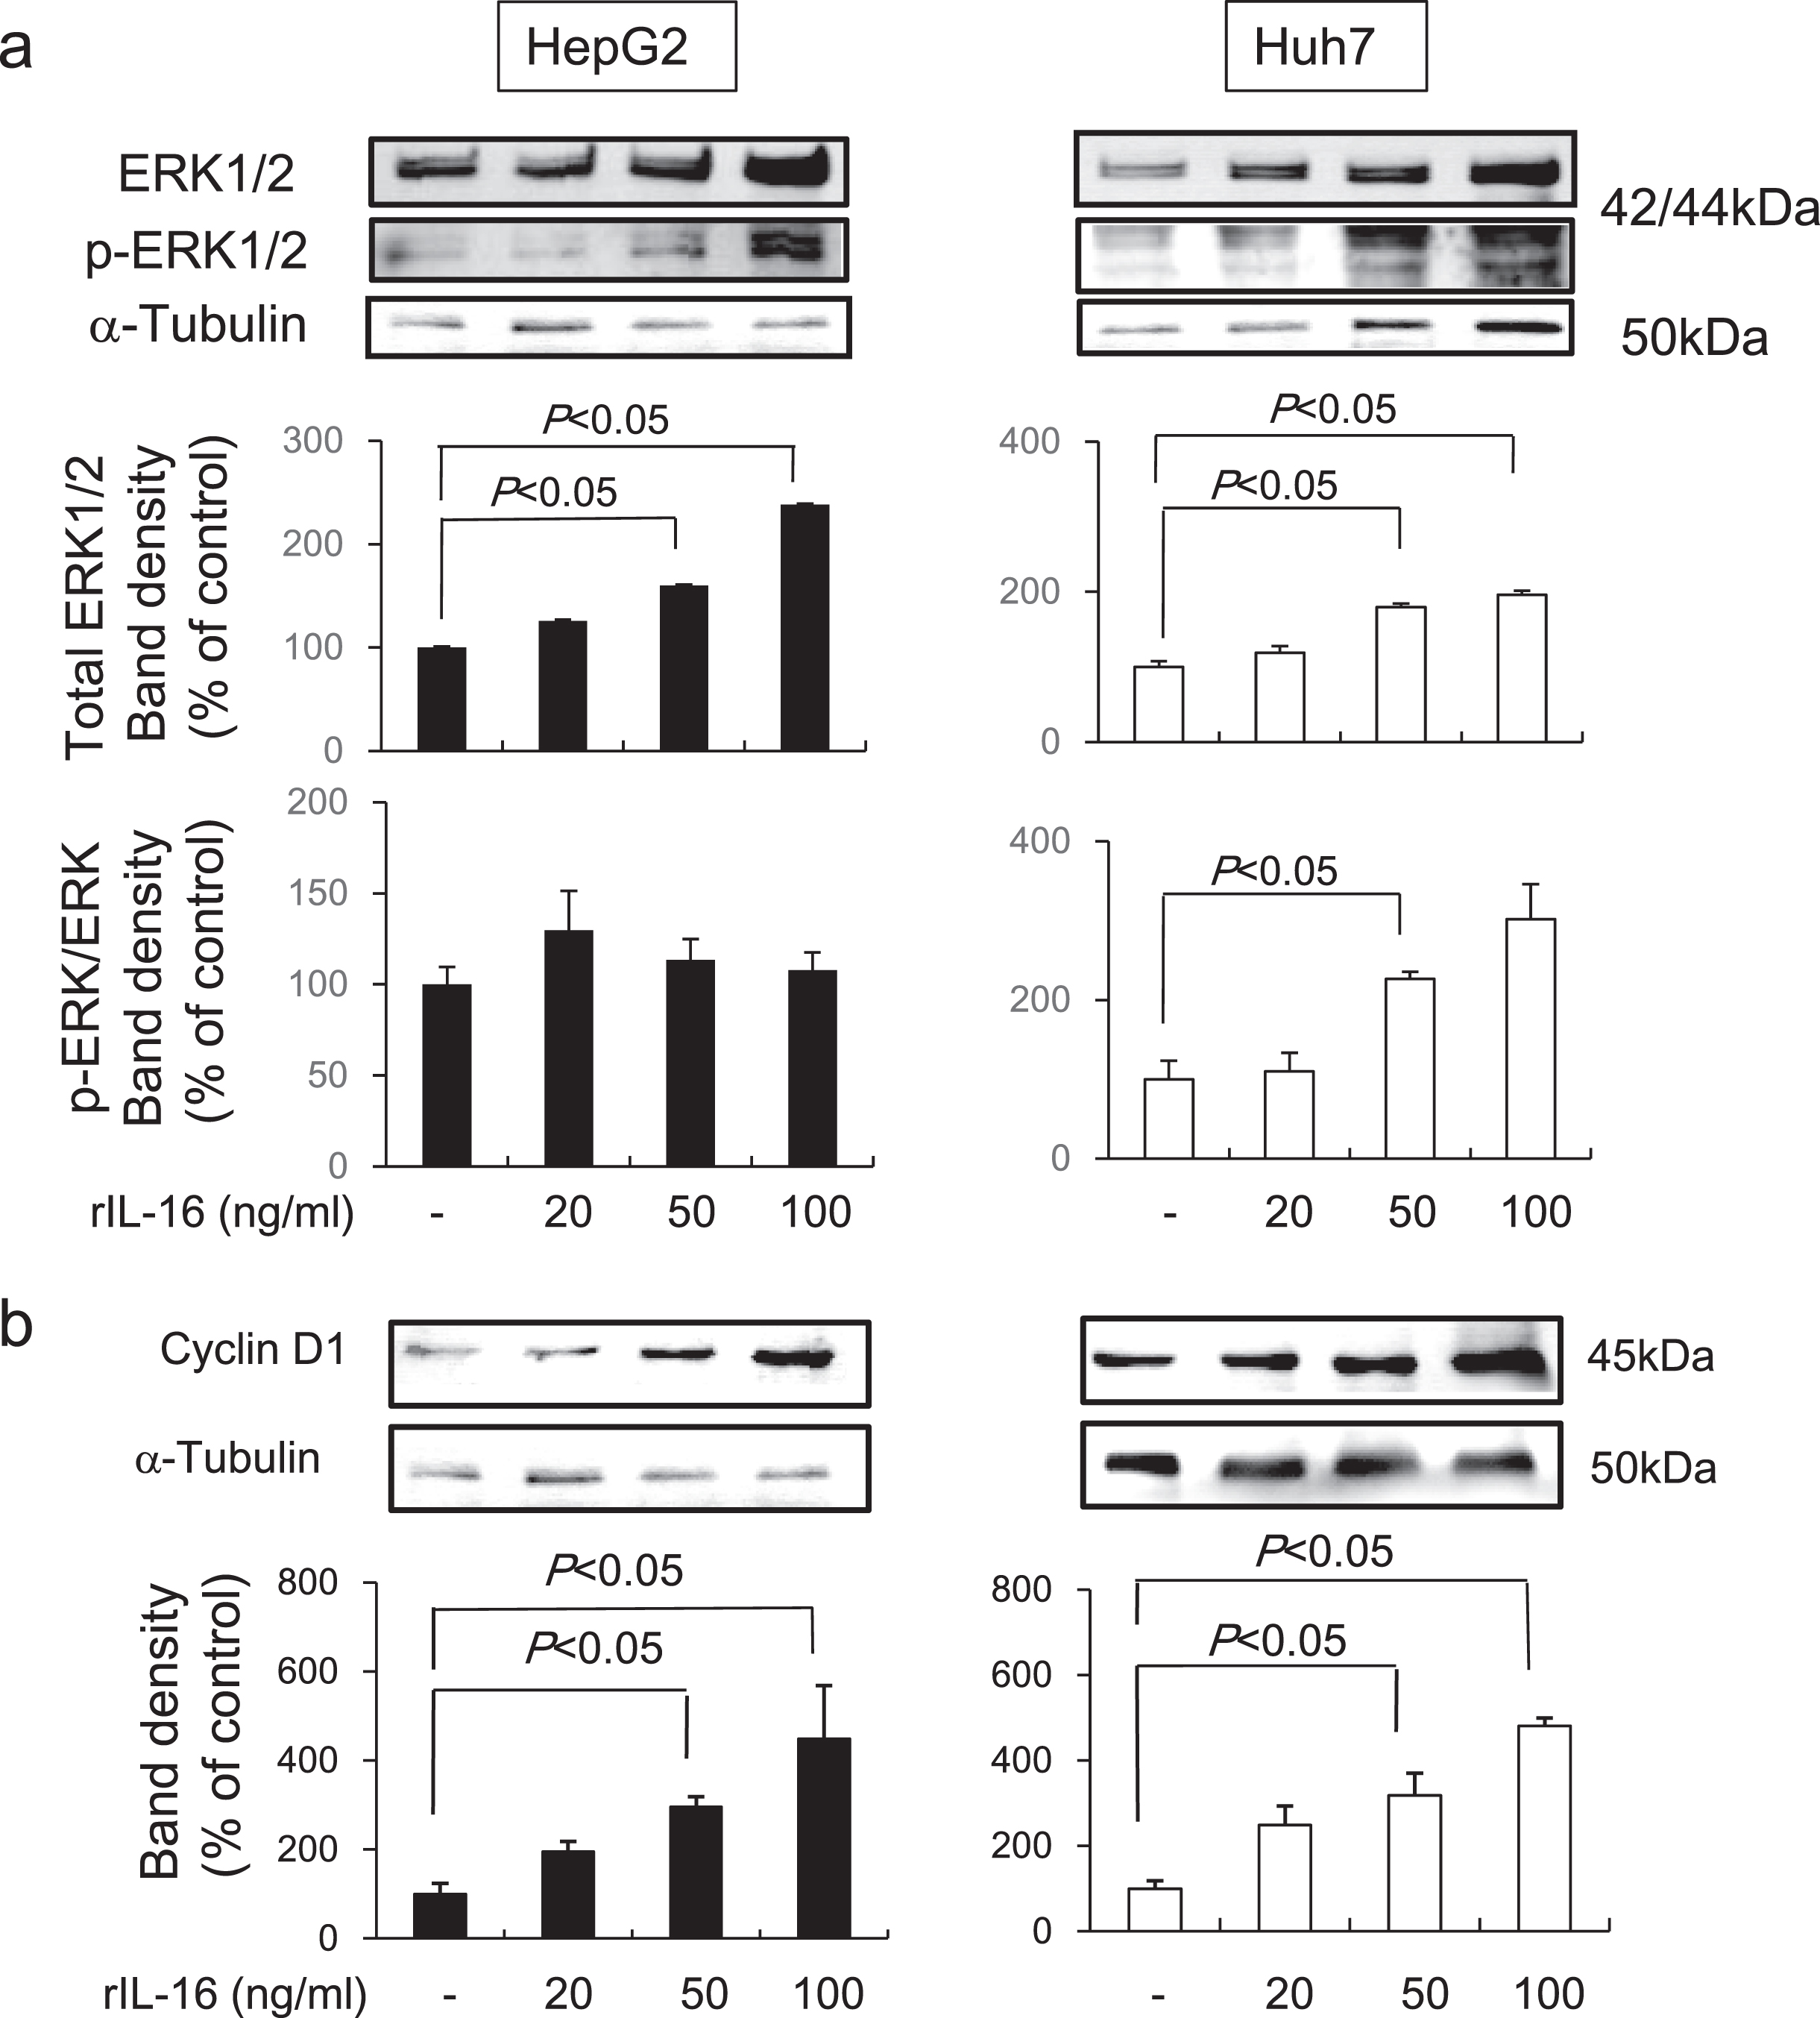
Many oncogenes promote cell proliferation by accelerating the G1-S phase transition [17]. We found that cyclin D1 levels were dose-dependently increased in both HepG2 (no treatment: 100.0±23.7; rIL-16 20 ng/mL: 195.7±22.2; 50 ng/mL: 295.4±23.7; and 100 ng/mL: 448.8%±119.3%) and Huh7 (no treatment: 100.0±18.6; IL-16 20 ng/mL: 248.5±45.2; 50 ng/mL: 317.9±51.9; and 100 ng/mL: 481.2%±18.6%) cells following treatment with IL-16 (Fig. 4b).
3.5Effects of an ERK inhibitor on rIL-16-induced ERK and cyclin D1 upregulation in HCC cells
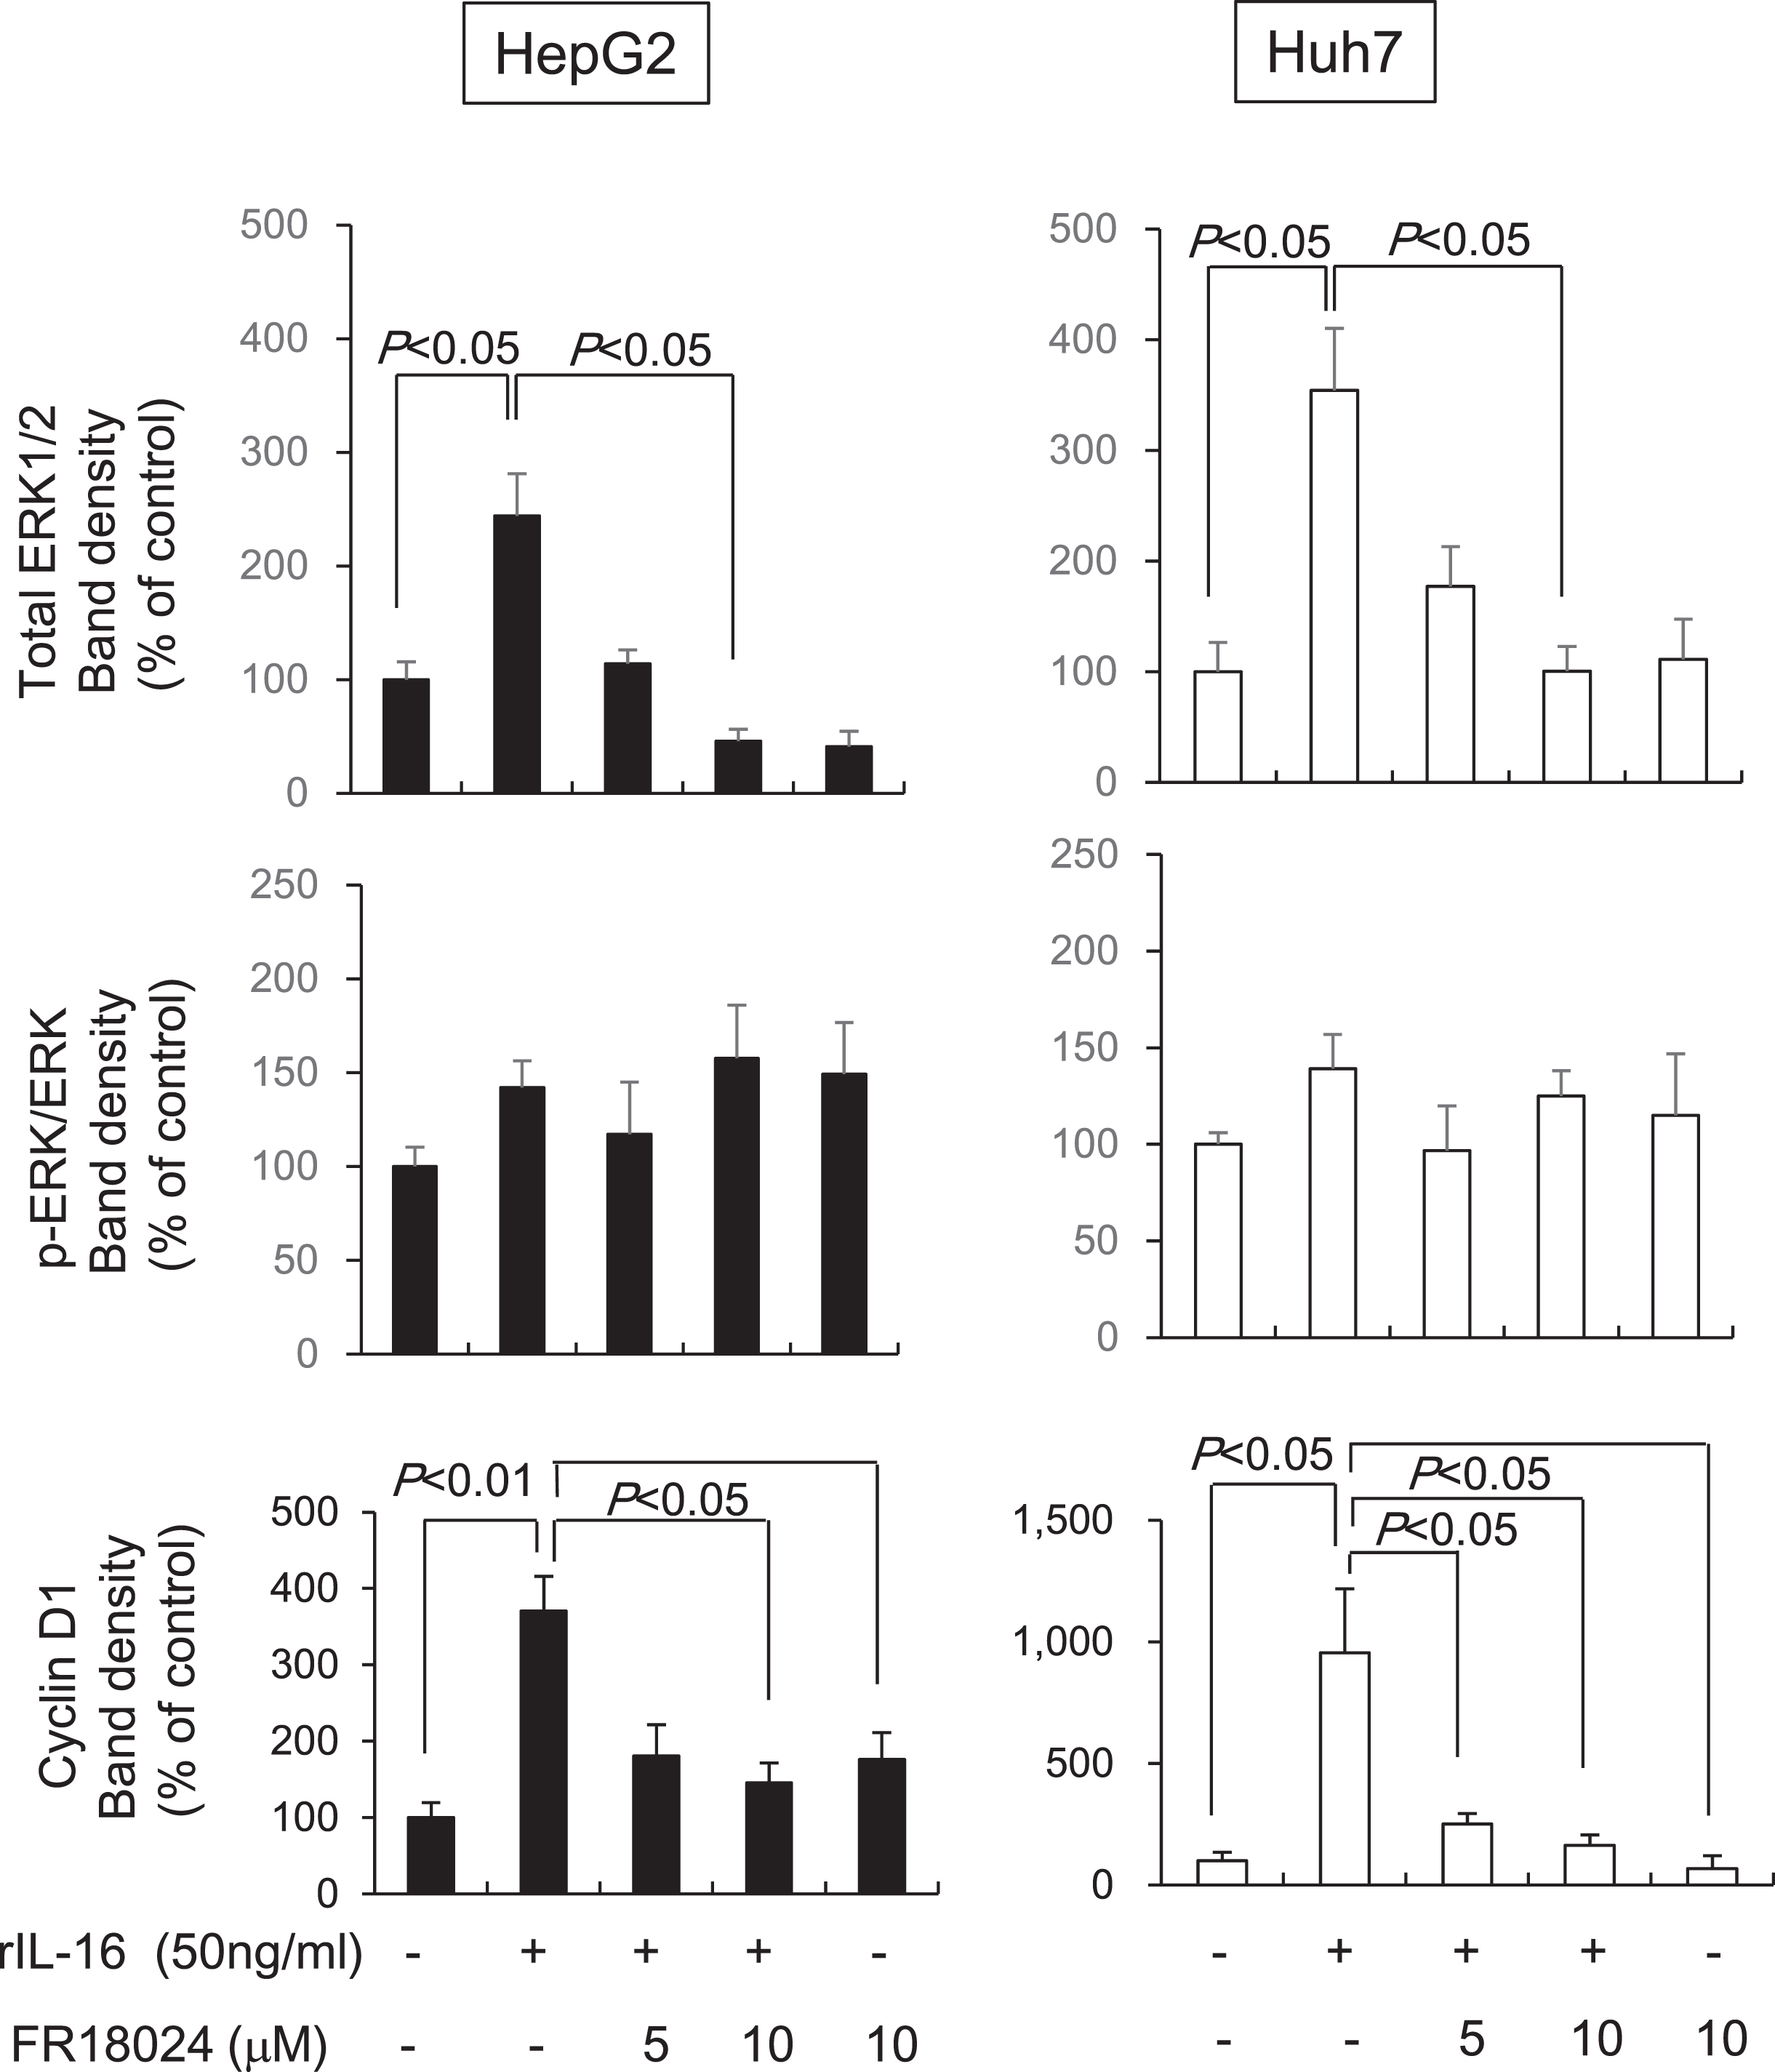
To determine whether IL-16 acts through the ERK/cyclin D1 pathway, HCC cells were pretreated with the ERK inhibitor, FR18024, followed by rIL-16 treatment. We found that total ERK1/2 protein levels were reduced in both rIL-16-treated HepG2 and Huh7 cells; however, the phosphorylated ERK to total ERK ratio was not changed. Furthermore, cyclin D1 protein expression was not increased by pretreatment with FR18024 (10μM) in rIL-16-treated HCC cells (rIL-16 treatment versus pretreatment with FR 18024, p < 0.05) (Fig. 5). Incubation with FR18024 (10μM) alone had no effect on ERK1/2 and cyclin D1 protein expression.
Fig. 5
The ERK inhibitor, FR18024, decreases the rIL-16-induced increases of ERK1/2 and cyclin D1 protein expression in HepG2 and Huh7 cells. The two HCC cell lines were pretreated with 50 ng/mL FR18024 followed by a 48-h incubation with rIL-16. ERK1/2 and cyclin D1 protein expression in HepG2 and Huh7 cells treated with IL-16 were determined by western blot analysis. α-Tubulin was used as a loading control and to normalize protein intensities. Data represent six independent experiments. N, number of samples.
3.6Effects of an ERK inhibitor and anti-IL-16 Ab on IL-16-induced HCC cell proliferation
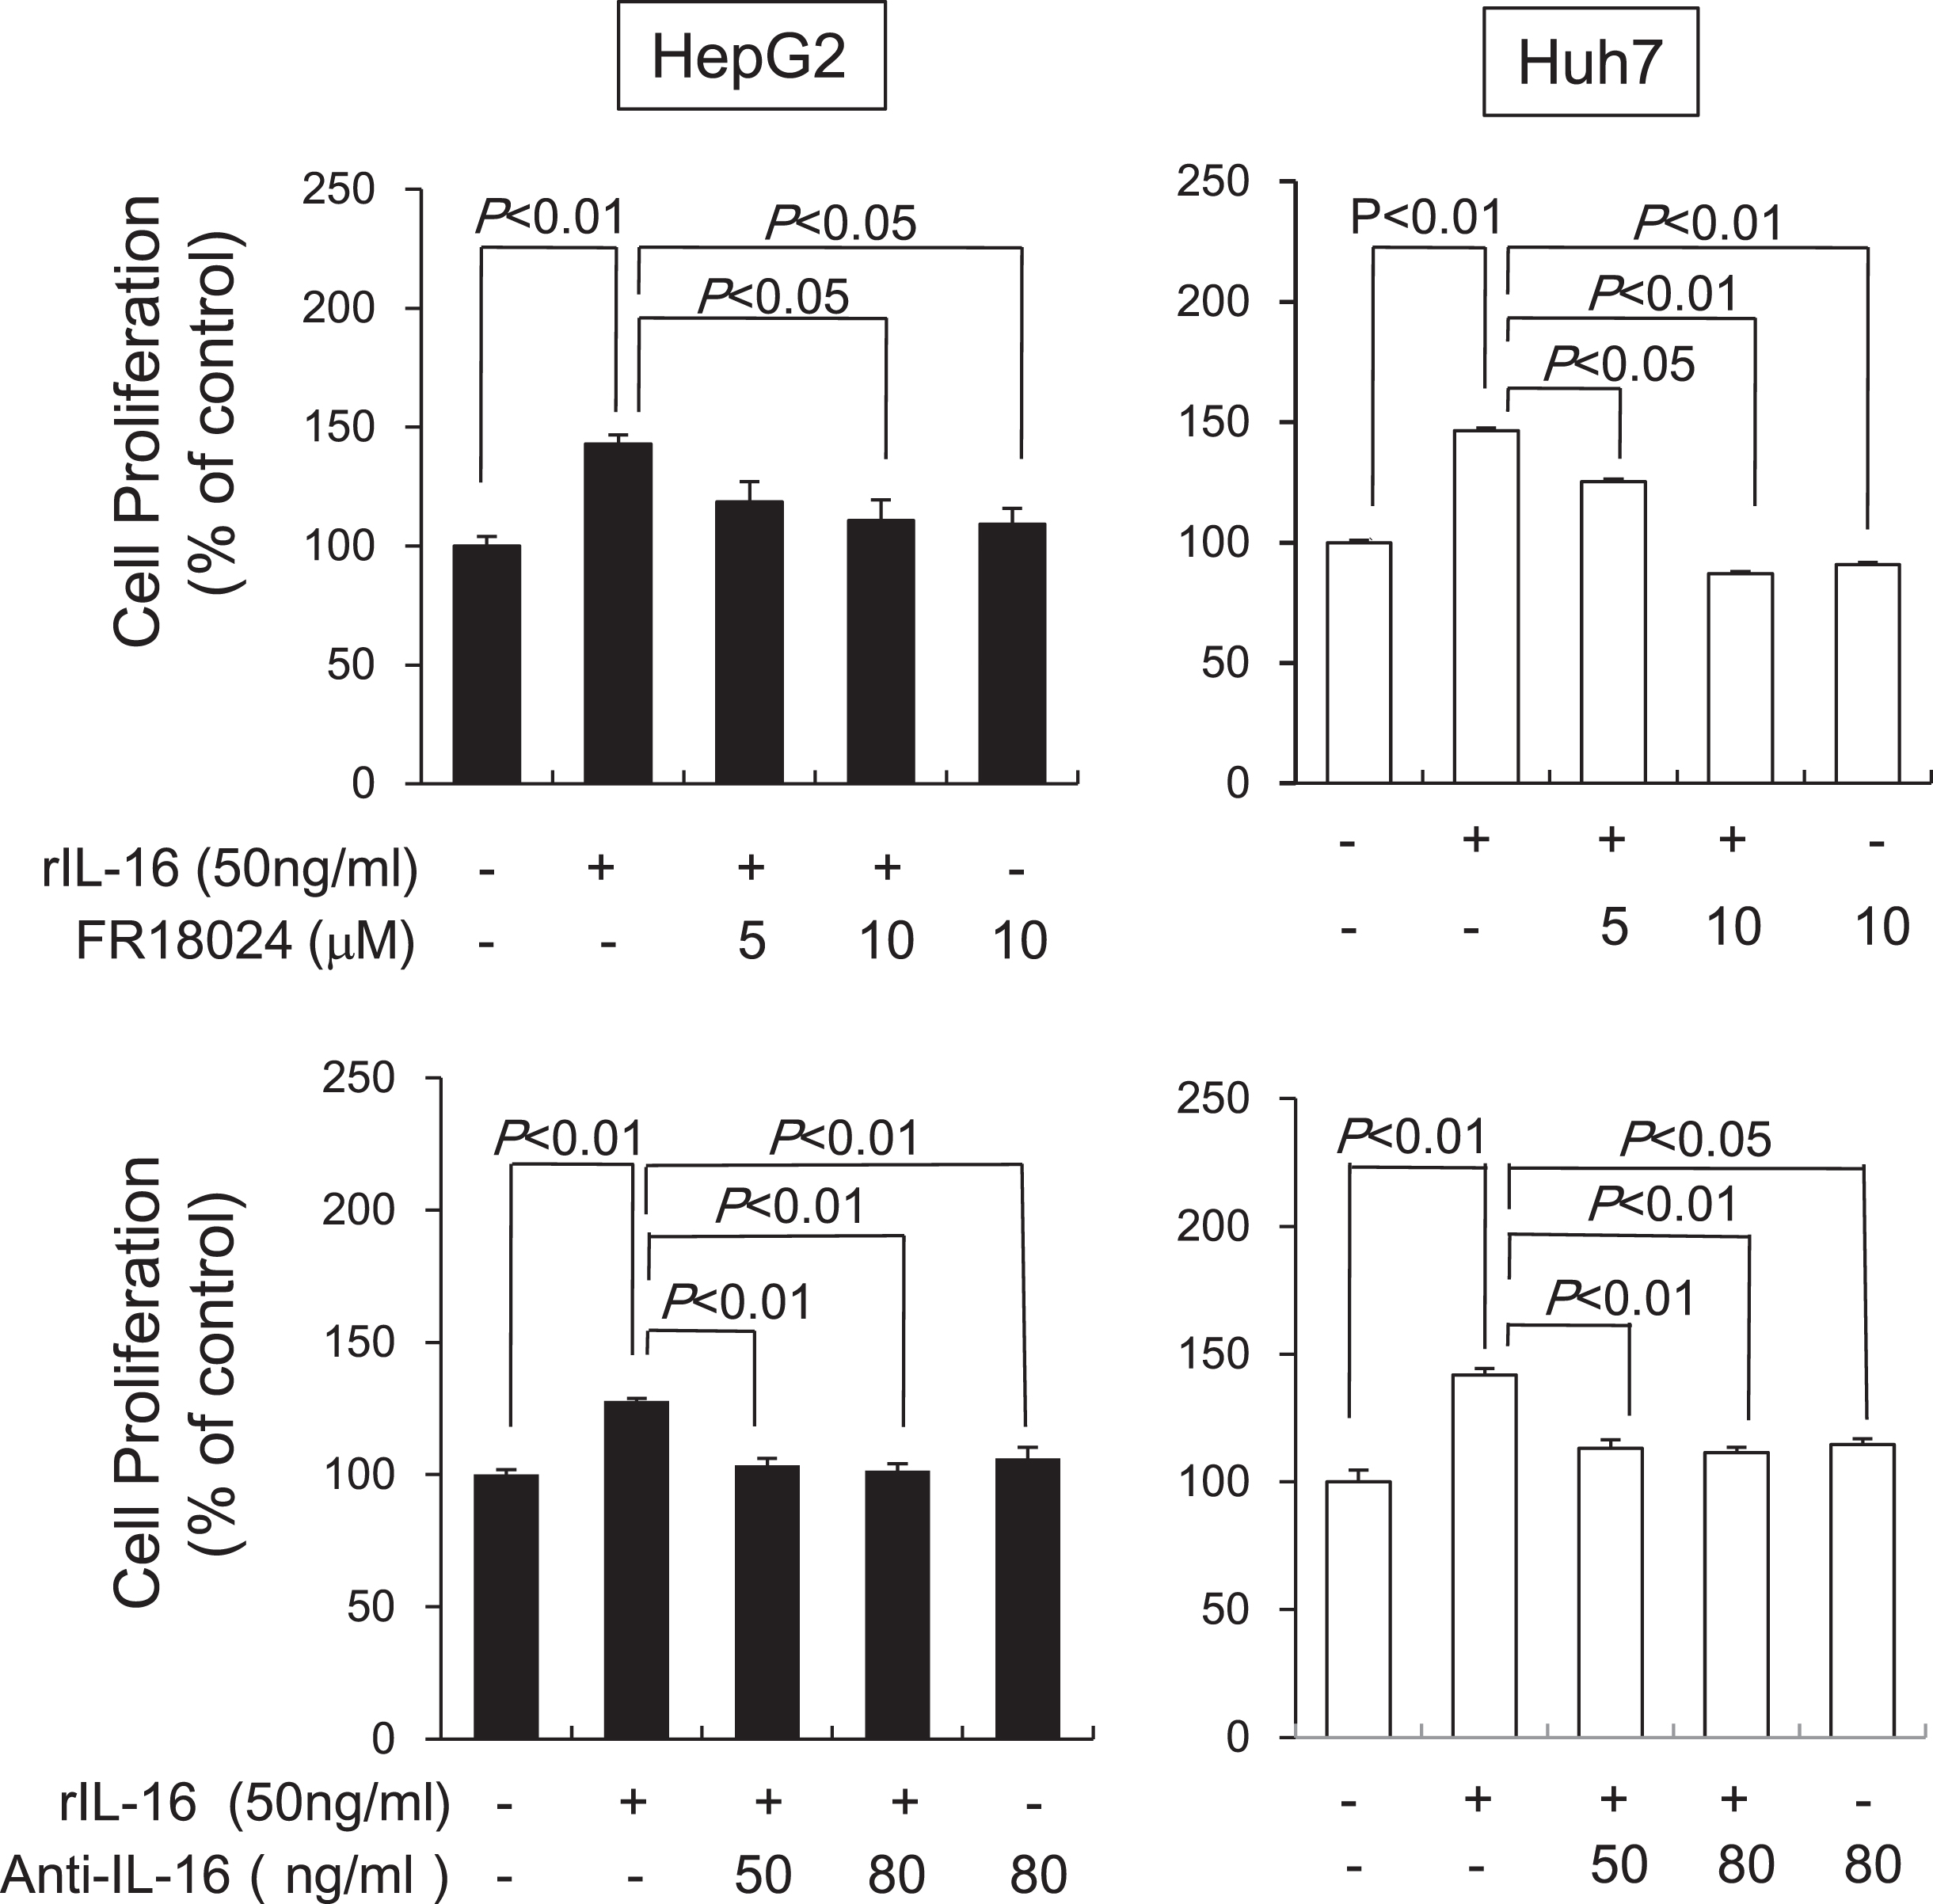
Next, we determined the effects of an ERK inhibitor or anti-IL-16 Ab on HCC cell proliferation induced by rIL-16. Pretreatment with FR18024 (10μM) significantly decreased rIL-16-induced proliferation in HepG2 and Huh7 cells, whereas anti-IL-16 Ab pretreatment (50 ng/mL and 80 ng/mL) also significantly decreased proliferation in rIL-16-treated HepG2 and Huh7 cells (Fig. 6). Incubation with either FR18024 or anti-IL-16 Ab alone had no effect on cell proliferation.
Fig. 6
Effects of an ERK inhibitor and anti-IL-16 Ab on IL-16-induced cell proliferation in HCC cell lines analyzed after 48 h by western blotting. HepG2 and Huh7 cells were pretreated with FR18024 (5 or 10μM) or anti-IL-16 Ab (50 or 80 ng/mL) followed by a 48-h incubation with rIL-16. The cell proliferation rate was measured by MTS assay. Data indicate the mean±SEM. All data are representative of eight independent experiments. The addition of FR18024 or anti-IL-16 Ab alone did not affect cell proliferation.
3.7Synergistic effects of MIF and IL-1ra in combination with IL-16 on HCC cell proliferation
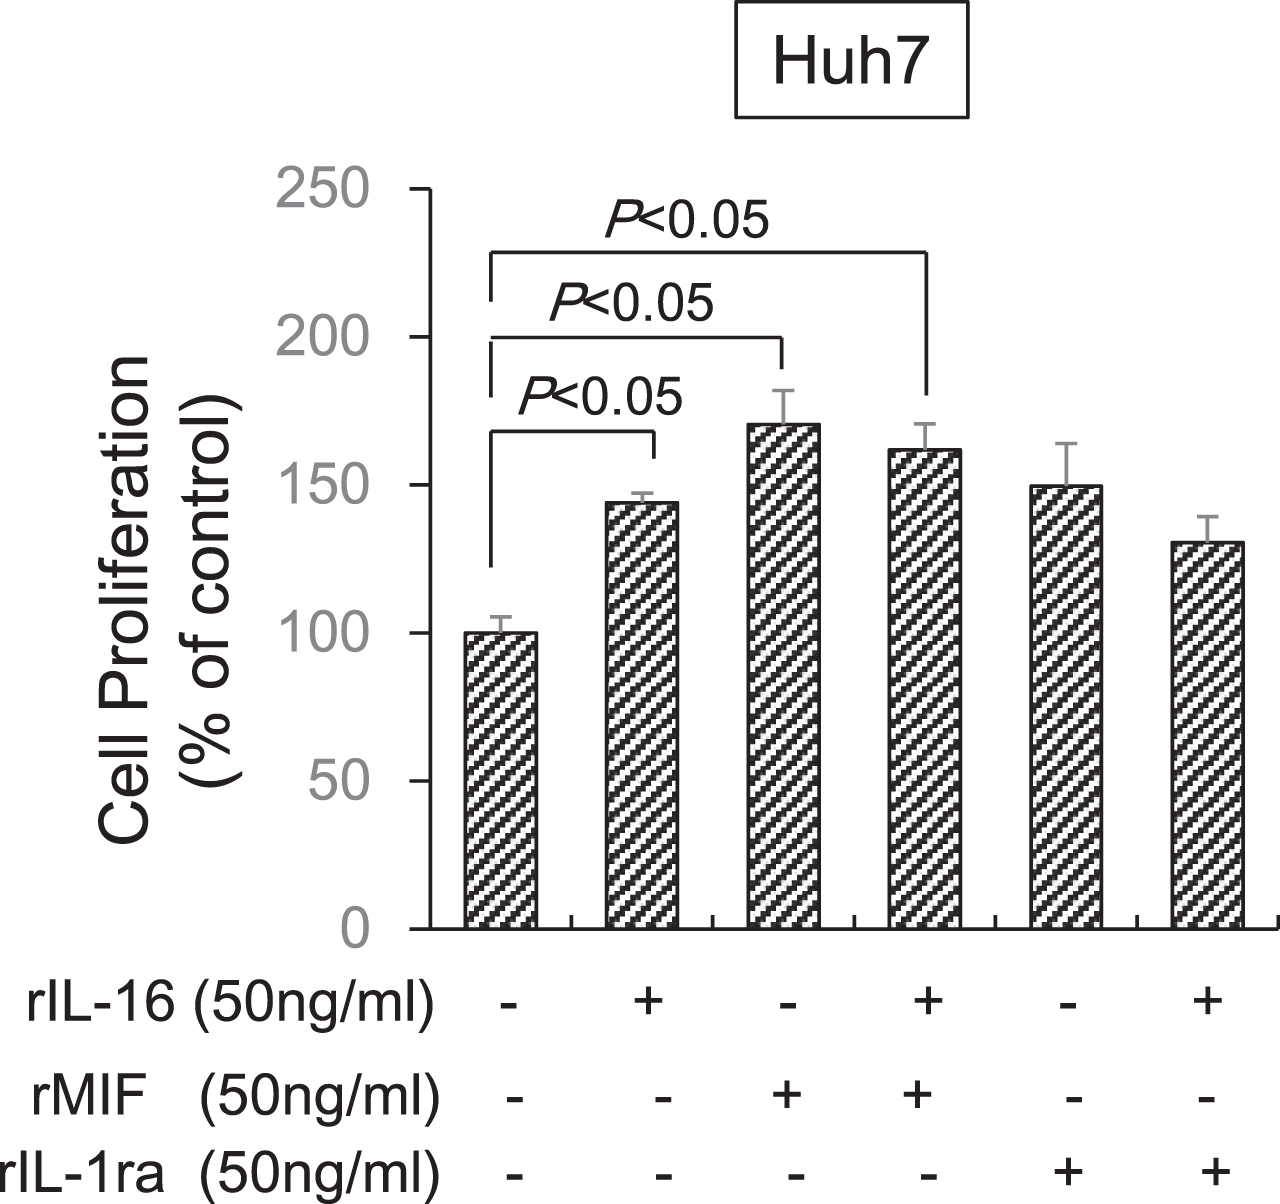
Finally, we determined the effects of MIF and IL-1ra in combination with IL-16 on HCC cell proliferation. MIF alone (170.3±11.6%) significantly increased Huh7 cell proliferation and IL-1ra (140.9±12.4%) tended to increase proliferation compared with untreated cells (100.0±5.3%). However, the MIF (161.9±8.7%) and IL-1ra (130.6±8.6%) combination with IL-16 did not significantly increased cell proliferation compared with IL-16 alone (143.9±3.9%). Thus, a synergistic effect of MIF or IL-1ra in combination with IL-16 was not observed (Fig. 7).
Fig. 7
Synergistic effect of MIF and IL-1ra in combination with IL-16 on HCC cell proliferation. Huh7 cells (5×10⁴) were incubated with IL-16 and MIF or IL-1ra at 50 ng/mL concentrations in 96-well plates for 72 h. Cell proliferation was detected using the MTS assay by measuring absorbance at 490 nm. Cell proliferation is presented as the ratio of the optical density of cells treated with MIF and IL-1ra in combination with IL-16 to that of untreated cells. Data indicate the mean±SEM. Data are representative of eight (MIF treatment, right panel) and six (IL-1ra treatment, left panel) independent experiments, respectively. P < 0.05 versus untreated cells.
4Discussion
HCC promotes and exacerbates chronic inflammation and infection [18, 19]. There is increasing recognition of the role of cells in mediating these responses, especially the cytokine cascade, during the immunopathogenesis of chronic hepatitis virus-associated HCC or noninfectious HCC. Therefore, characterization of the expression profile of tumor-associated inflammatory cytokines in HCC will need to new diagnostic and therapeutic strategies.
In the present study, we identified cytokines associated with the pathogenesis of HCC by proteomic analysis using an antibody-based protein microarray technique. Three significant cytokines, IL-1ra, MIF, and IL-16, were differentially expressed between paired tumor and adjacent non-tumor regions from HCC patients and tissues of noncancerous livers. We found that all differentially expressed cytokines were increased by at least 2-fold in the tissues of patients with HCC. As expected, we also identified IL-1ra and MIF in our study as both are cytokines known to be associated with HCC pathogenesis[10, 11]. Also, compared with noncancerous liver, the IL-16 spot density of HCC liver samples of non-tumor and tumor regions was increased by 2.4- and 1.9-fold, respectively. Although the expression of IL-16 in HCC was lower compared with that of the other two cytokines, we focused on IL-16 production in HCC tissues.
IL-16 is produced in T lymphocytes, B lymphocytes, mast cells, and dendritic cells [15, 20]. It is a pleiotropic cytokine and its activity affects both chemical attraction and modulation of T cell activation [15, 20]. Although the involvement of IL-16 in allergy and autoimmune diseases is well known, its role in HCC pathogenesis is unclear [21, 22], although IL-16 contributes to the production of tumor-related inflammatory cytokines [23, 24]. There is recent evidence of an association between IL-16 polymorphisms and susceptibility to a variety of cancers [25, 26]. Although IL-16 polymorphisms were associated with susceptibility to HBV-related HCC compared with patients with chronic hepatitis B, there is no evidence of an association between these polymorphisms and HCC risk compared with that of healthy subjects [27].
Western blot analysis confirmed that IL-16 is expressed in HCC tissues. IL-16 expression levels in both non-tumor and tumor regions of HCC tissues were higher compared with those found in benign tumors, HH, and noncancerous liver. Also, IL-16 secretion in HCC tissues was observed in blood perivascular cells (CD3-positive cells), but not in hepatocytes and tumor cells, suggesting that the IL-16 produced in infiltrating T cells acted on HCC cells. Although there was minor IL-16 secretion in noncancerous liver and liver metastasis of colorectal cancer, we believe that IL-16 may is an important cytokine in HCC pathogenesis.
Next, to clarify the molecular mechanisms of IL-16 augmentation underlying inflammation-associated HCC, we determined the effects of IL-16 on HCC cell proliferation in vitro in cells from two different HCC cell lines, HepG2 and Huh7. We found that rIL-16 treatment significantly increased cell proliferation in a dose- and time-dependent manner both cell lines. Templin et al. demonstrated that IL-16 is involved in the proliferation of leukemia Jurkat T cells. Functional assays demonstrated that IL-16 knockdown inhibits proliferation with a significant delay in cell cycle progression to the G2 phase [28].
The ERK signaling pathway regulates the activity of proteins involved in proliferation, cell cycle, and apoptosis through the MAPK/ERK cascade [16, 29]. Zhang et al. demonstrated that a low dose of rIL-16 stimulates the proliferation of Jurkat cells and rIL-16 may be a dose-dependent regulator for growth or apoptosis mediated through the protein kinase C (PKC) or ERK signal pathway in Jurkat cells [30]. The expression of ERK and cyclin D1 proteins was significantly higher in patients with histologically poorly differentiated tumors and associated with the presence of intrahepatic metastasis, suggesting that increased expression of these factors is clinically relevant [31]. Many oncogenes promote cell proliferation by accelerating the G1-to-S phase transition. As a key regulator of G1 phase reentry and progression, cyclin D1 is a frequently altered cell cycle regulator in cancer [17]. IL-16-treated HCC cells significantly increased the levels of total ERK1/2 and cyclin D1 protein. To determine whether IL-16 acts through the ERK/cyclin D1 pathway in HCC cells, we pretreated cells with the ERK inhibitor, FR18024, prior to rIL-16 treatment. Increased total ERK1/2 protein levels were inhibited by pretreatment with FR18024 in IL-16-treated HepG2 and Huh7 cells. However, the phosphorylated ERK to ERK ratio was not significantly changed by IL-16 treatment alone or pretreatment with FR18024. The ratio of phosphorylated to total ERK1/2 was increased in only Huh7 cells treated with 50 ng/ml IL-16, but not in HepG2 cells. Considering that IL-16 was exposed to HCC cell for 48 h, the phosphorylation of ERK may have occurred earlier. We reasoned that phosphorylated ERK protein levels were relatively lower than that of total ERK and increased ERK phosphorylation concomitantly increased with total ERK. Furthermore, cyclin D1 expression was not increased by pretreatment with FR18024 in rIL-16-treated HCC cells. Our findings suggest that HCC cell proliferation induced by IL-16 is mediated, in part, through increases in ERK1/2. However, it has been reported that the overexpression of many upstream growth factors in HCC, such as endothelial growth factor, vascular endothelial growth factor, platelet-derived growth factor-β (PDGF-β) and transforming growth factor-α (TGF-α), are activated through the Ras/Raf/MEK/ERK pathway [16]. Therefore, other factors should also be considered.
We also studied the effects of an ERK inhibitor and anti-IL-16 Ab on rIL-16-induced HCC cell proliferation and found that pretreatment with either FR18024 or anti-IL-16 Ab significantly decreased rIL-16-induced proliferation in HepG2 and Huh7 cells. These findings suggest that HCC cell proliferation is closely associated with IL-16-mediated activation of the ERK/cyclin D1 pathway. Thus, HCC cell proliferation by IL-16 is ERK pathway dependent.
We considered the magnitude of the IL-16 effect on HCC cell proliferation. MIF is known to increase the proliferation of tumor cells including HCC, which suggests that MIF is associated with HCC initiation and progression [14, 32, 33]. In the present study, IL-16-induced HCC cell proliferation was a somewhat lower compared with that observed following MIF treatment and was equivalent to that of IL-1ra. Moreover, the potential synergistic effects of MIF or IL-1ra in combination with IL-16 was not apparent compared with either agent alone. The proliferative effect of IL-16 in HCC was also equivalent to that of insulin-like growth factor as reported by Ma et al. [34]. Therefore, we conclude that IL-16 is an important cytokine for tumor progression in HCC cells.
Recently, IL-16 activity has been closely associated with the progression of various cancers and the underlying mechanism has been partially elucidated in cutaneous T cell lymphoma (CTL), multiple myeloma (MM), and breast cancer. However, the mechanism for promoting cell growth is different in each of these cancers. IL-16 has the potential to act directly, either in an autocrine or paracrine manner, to induce tumor cell growth, such as that observed in CTL and MM. In contrast, CD9 and C-C chemokine receptor type (CCR) 5, as well as CD4, are capable of binding to IL-16. Secreted IL-16 from various cells has the potential to act through CD9, which has been observed in breast cancer. Lung epithelial cells lack CD4 for IL-16 binding, suggesting that CD9 may act as an alternate receptor for IL-16 [35].
CD9 is a member of the tetraspanin protein family and has a role in malignancy, the immune system, cell signaling, adhesion, morphology, motility, proliferation, and tumor invasion. Furthermore, CD9 has been identified as a prognostic marker or predictor of metastasis is some cancer types [36]. Lin et al. demonstrated that CD9 may differentially affect tumor growth and progression in HCC [37]. CD9 was found to be highly expressed in metastatic HCC cells and promoted HCC cell migration [37]. In the present study, it is possible that the action of IL-16 mediated through CD9 may be involved in HCC tumor proliferation [36]. Many hepatocellular carcinomas occur in chronically inflamed livers. Immunosurveillance for tumor malignancy and progression is conducted primarily by cytotoxic T lymphocytes. In contrast, tumor infiltrating T cell-tumor cell interactions may interfere with an immune response against tumor progression, suggesting that insufficient immunity facilitates tumor development [38]. These results suggest that IL-16 produced by T cells contributes to the recruitment of CD4- and CD9-positive immune cells or HCC cells that facilitate tumor progression. Therefore, immunotherapeutic treatment strategies may be suitable for HCC. Neutralization through IL-16 antibodies would represent one novel therapeutic approach.
A limitation to our study is that we did not have staging data for the HCC patient tissue samples. Further studies are needed to elucidate the role of IL-16 in HCC development using animal models and to examine IL-16 production and secretion in patients with HCC.
In conclusion, we identified IL-16 as an important cytokine overexpressed in human HCC tissues from both non-tumor and tumor regions and IL-16 production may activate the ERK/cyclin D1 signaling pathway, thereby leading to tumor growth. Our study also illustrates the usefulness of proteomics to better understand the underlying mechanisms and pathways involved in HCC. We believe that these findings provide a better understanding of HCC development and may contribute to new strategies for HCC treatment.
Acknowledgments
The authors would like to thank Enago (www.enago.jp) for the English language review.
This work was supported by Japan Society for the Promotion of Science KAKENHI Grant Number JP20K08500.
Author contributions
CONCEPTUALIZATION: YT
METHODOLOGY: YT, MW, SK and TO
VALIDATION: YT, YO and MO
DATA ANALYSIS: YT and MO
INVESTIGATION: YT and TK
RESOURCES: YT, YO, MW, SK and TO
WRITING–ORIGINAL DRAFT PREPARATION: YT
WRITING–REVIEW & EDITING: KK and TI
FUNDING ACQUISITION: NM
Conflict of interest
The authors declare no conflict of interest.
Ethical considerations
This study was approved by the St. Marianna University School of Medicine Ethics Committee (approval number 1208). All patients provided written informed consent before undergoing surgery.
Availability of data and material
Raw data were generated at Department of pharmacology, St Marianna University School of Medicine. Derived data supporting the findings of this study are available from the corresponding author Y.T on request.
References
[1] | Ferlay J , Soerjomataram I , Dikshit R , et al. Cancer incidence and mortality worldwide: sources, methods and major patterns in GLOBOCAN 2012. Int J Cancer. (2015) ;136: (5):E359–E386. doi: 10.1002/ijc.29210. |
[2] | Farazi PA , DePinho RA . Hepatocellular carcinoma pathogenesis: from genes to environment. Nat Rev Cancer. (2006) ;6: (9):674–87. doi: 10.1038/nrc1934. |
[3] | Budhu A , Wang XW . The role of cytokines in hepatocellular carcinoma. J Leukoc Biol. (2006) ;80: (6):1197–213. doi: 10.1189/jlb.0506297. |
[4] | Lazăr DC , Avram MF , Romoşan I , et al. Malignant hepatic vascular tumors in adults: Characteristics, diagnostic difficulties and current management. World J Clin Oncol. (2019) ;24: :110–35. doi: 10.5306/wjco.v10.i3.110. |
[5] | Shuai Z , Leung MW , He X , et al. Adaptive immunity in the liver. Cell Mol Immunol. (2016) ;13: (3):354–68. doi: 10.1038/cmi.2016.4. |
[6] | Lin WW , Karin M . A cytokine-mediated link between innate immunity, inflammation, and cancer. J Clin Invest. (2007) ;117: (5):1175–83. doi: 10.1172/JCI31537. |
[7] | Chia CS , Ban K , Ithnin H , et al. Expression of interleukin-18, interferon-γand interleukin-10 in hepatocellular carcinoma. Immunol Lett. (2002) ;84: (3):163–72. doi: 10.1016/s0165-2478(02)00176-1. |
[8] | Kakumu S , Okumura A , Ishikawa T , et al. Serum levels of IL-10, IL-15 and soluble tumornecrosis factor-α (TNF- α) receptors in type C chronic liver disease. Clin Exp Immunol. (1997) ;109: (3):458–63. doi: 10.1046/j.1365-2249.1997.4861382.x. |
[9] | Kakimi K , Lane TE , Wieland S , et al. Blocking chemokine responsive to γ-2/interferon (IFN)-γ inducible protein and monokine induced by IFN-γ activity in vivo reduces the pathogenetic but not the antiviral potential of hepatitis B virus-specific cytotoxic T lymphocytes. J Exp Med. (2001) ;194: (12):1755–66. doi: 10.1084/jem.194.12.1755. |
[10] | Lee IC , Huang YH , Chau GY , et al. Serum interferon gamma level predicts recurrence in hepatocellular carcinoma patients after curative treatments. Int J Cancer. (2013) ;133: (12):2895–902. doi: 10.1002/ijc.28311. |
[11] | Seow TK , Liang RC , Leow CK , et al. Hepatocellular carcinoma: from bedside to proteomics. Proteomics. (2001) ;1: (10):1249–63. doi: 10.1002/1615-9861(200110)1. |
[12] | Hwang JH , Shim SS , Seok OS , et al. Comparison of cytokine expression in mesenchymal stem cells from human placenta, cord blood, and bone marrow. J Korean Med Sci. (2009) ;24: (4):547–54. doi: 10.3346/jkms.2009.24.4.547. |
[13] | Litmanovich A , Khazim K , Cohen I . The Role of interleukin-1 in the pathogenesis of cancer and its potential as a therapeutic target in clinical practice. Oncol Therapy. (2018) ;6: (2):109–27. doi: 10.1007/s40487-018-0089-z. |
[14] | Lu M , Xu Y , He G , et al. The expression of CD74 and macrophage migration inhibitory factor protein is upregulated in hepatitis B virus-related hepatocellular carcinoma. Transl Cancer Res. (2018) ;7: (6):1537–47. doi: 10.21037/tcr.2018.11.21. |
[15] | Center DM , Kornfeld H , Cruikshank WW . Interleukin 16 and its function as a CD4 ligand. Immunol Today. (1996) ;17: (10):476–81. doi: 10.1016/0167-5699(96)10052-i. |
[16] | Roberts PJ , Der CJ . Targeting the Raf-MEK-ERK mitogen-activated protein kinase cascade for the treatment of cancer. Oncogene. (2007) ;26: (22):3291–310. doi: 10.1038/sj.onc.1210422. |
[17] | Diehl JA . Cycling to cancer with cyclin D1. Cancer Biol Ther. (2002) ;1: (3):226–31. doi: 10.4161/cbt.72. |
[18] | Coussens LM , Werb Z . Inflammation and cancer. Nature. 420 . (2002) ;420: (6917):860–7. doi: 10.1038/nature01322. |
[19] | Shacter E , Weitzman SA . Chronic inflammation and cancer. Oncology. (2002) ;16: (2):217–26. |
[20] | Cruikshank WW , Kornfeld H , Center DM . Interleukin-16. J Leukoc Biol. (2000) ;67: (6):757–66. doi: 10.1002/jlb.67.6.757. |
[21] | Deng JM , Shi HZ . Interleukin-16 in asthma. Chin Med J. (2006) ;119: (12):1017–25. |
[22] | Liu H , Yan Y , Zhang F , et al. The immuno-enhancement effects of tubiechong (Eupolyphagasinensis) lyophilized powder in cyclophosphamide-induced immunosuppressed mice. ImmunolInvest. (2019) ;48: (8):844–59. doi: 10.1080/08820139.2019.1588291. |
[23] | Muc-Wierzgon M , Nowakowska-Zajdel E , Kokot T , et al. Genetic disregulation of TNF alpha and TNF alpha type II receptors in colon cancer at the II and III stage of disease. J Biol Regul Homeost Agents. (2006) ;20: :10–14. |
[24] | Shanmugham LN , Petrarca C , Frydas S , et al. IL-15 an immunoregulatory and anti-cancer cytokine. Recent advances. J Exp Clin Cancer Res. (2006) ;25: (4):529–36. |
[25] | Azimzadeh P , Romani S , Mohebbi SR , et al. Interleukin-16 (IL-16) gene polymorphisms in Iranian patients with colorectal cancer. J Gastrointestin Liver Dis. (2011) ;20: (4):371–6. |
[26] | Kashfi SM , Behboudi Farahbakhsh F , Nazemalhosseini Mojarad E , et al. Interleukin-16 polymorphisms as new promising biomarkers for risk of gastric cancer. Tumour Biol. (2016) ;37: (2):2119–26. doi: 10.1007/s13277-015-4013-y. |
[27] | Li S , Deng Y , Chen ZP , Huang S , et al. Genetic polymorphism of interleukin-16 influencessusceptibility to HBV-related hepatocellular carcinoma in a Chinese population. InfectGenet Evol. (2011) ;11: (8):2083–8. doi: 10.1016/j.meegid.2011.09.025. |
[28] | Templin J , Atanackovic D , Hasche D , et al. Oscillating expression of interleukin-16 in multiple myeloma is associated with proliferation, clonogenic growth, and PI3K/NFKB/MAPK activation. Oncotarget. (2017) ;25: (30):49253–63. doi: 10.18632/oncotarget.17534. |
[29] | McCubrey JA , Steelman LS , Chappell WH , et al. Roles of the Raf/MEK/ERK pathway in cell growth, malignant transformation and drug resistance. Biochim Biophys Acta. (2007) ;1773: (8):1263–84. doi: 10.1016/j.bbamcr.2006.10.001. |
[30] | Zhang XM , Xu YH . The associated regulators and signal pathway in rIL-16/CD4 mediated growth regulation in Jurkat cells. Cell Research. (2002) ;12: :363–72. doi: 10.1038/sj.cr.7290138. |
[31] | Osada S , Kanematsu M , Imai H , et al. Evaluation of extracellular signal regulated kinase expression and its relation to treatment of hepatocellular carcinoma. J Am Coll Surg. (2005) ;201: (3):405–11. doi: 10.1016/j.jamcollsurg.2005.05.015. |
[32] | Mitchell RA , Bucala R . Tumor growth-promoting properties of macrophage migration inhibitory factor (MIF). Semin Cancer Biol. (2000) ;10: (5):359–66. doi: 10.1006/scbi.2000.0328. |
[33] | Huang XH , Jian WH , Wu ZF , et al. Small interfering RNA (siRNA)-mediated knockdown of macrophage migration inhibitory factor (MIF) suppressed cyclin D1 expression and hepatocellular carcinoma cell proliferation. Oncotarget. (2014) ;30: (14):5570–80. doi: 10.18632/oncotarget.2141. |
[34] | Ma Y , Chen Y , Chen L et al. Promotion of Insulin-like growth factor II in cell proliferation and epithelial–mesenchymal transition in hepatocellular carcinoma. J Cancer Res Ther. (2018) ;14: (4):844–50. doi: 10.4103/jcrt.JCRT_605_17. |
[35] | Yadav S , Shi Y , Wang H . IL-16 effects on A549 lung epithelial cells: dependence on CD9 as an IL-16 receptor? J Immunotoxicol. (2010) ;7: (3):183–93. doi: 10.3109/15476911003649346. |
[36] | Richmond J , Tuzova M , Cruikshank W , et al. Regulation of cellular processes by interleukin-16 in homeostasis and cancer. J Cell Physiol. (2014) ;229: (2):139–47. doi: 10.1002/jcp.24441. |
[37] | Lin Q , Peng S , Yang Y . Inhibition of CD9 expression reduces the metastatic capacity of human hepatocellular carcinoma cell line MHCC97-H. Int J Oncol. (2018) ;53: (1):266–74. doi: 10.3892/ijo.2018.4381. |
[38] | Kubes P , Jenne C . Immune Responses in the Liver. Annu Rev Immunol. (2018) ;36: :247–77. doi: 10.1146/annurev-immunol-051116-052415. |


